Embed Size (px)
Citation preview
Performance and Scalability of Microsoft SQL Server on VMware vSphere 5.5 Performance Study
T E C H N I C A L W H I T E P A P E R
Performance and Scalability of Microsoft SQL Server on VMware vSphere 5.5
Table of Contents
Executive Summary .................................................................................................................................................................................................. 3
Introduction................................................................................................................................................................................................................... 3
Test Environment ........................................................................................................................................................................................................ 3 Test Bed Configuration ..................................................................................................................................................................................... 3 Host Processor Architecture ......................................................................................................................................................................... 4 Operating System and SQL Server Installation/Tuning .................................................................................................................... 5 DVD Store 2 Benchmark .................................................................................................................................................................................. 8
Comparing Physical vs. Logical Processors ................................................................................................................................................... 9 8 Physical Cores versus 8 Logical Processors ....................................................................................................................................... 11 16 Physical Cores versus 16 Logical Cores .............................................................................................................................................. 12
Maximum Throughput Tests ................................................................................................................................................................................ 13 8 VM x 8 vCPU Configuration ...................................................................................................................................................................... 13 9 VM x 8 vCPU Configuration ...................................................................................................................................................................... 14 4 VM x 16 vCPU Configuration..................................................................................................................................................................... 15 2 VM x 32 vCPU Configuration .................................................................................................................................................................... 17 1 VM x 64 vCPU Configuration.................................................................................................................................................................... 20
Virtual NUMA, Cores per Socket Testing ...................................................................................................................................................... 23
Latency Sensitivity Tests ...................................................................................................................................................................................... 25
Best Practices ............................................................................................................................................................................................................ 27
Conclusion .................................................................................................................................................................................................................. 28
Appendix A ................................................................................................................................................................................................................ 29
References .................................................................................................................................................................................................................. 30
T E C H N I C A L W H I T E P A P E R / 2

Performance and Scalability of Microsoft SQL Server on VMware vSphere 5.5
Executive Summary Large Microsoft SQL Server® databases can achieve great performance and fully utilize current-generation server and storage technology using VMware vSphere® 5.5. A variety of vCPU and virtual machine quantity combinations were tested and show that vSphere can handle hundreds of thousands of online transaction processing (OLTP) database operations per minute.
Introduction VMware vSphere provides an ideal platform for customers to virtualize their business-critical applications, including databases, ERP systems, email servers, and even newly emerging technologies such as Hadoop. There are many benefits of doing so; see “Virtualizing Business-Critical Applications on vSphere [1] ” for a full list.
One of the key applications that can be virtualized is Microsoft SQL Server, which is “one of the most widely deployed database platforms in the world, with many organizations having dozens or even hundreds of instances deployed in their environments [1].” Consolidating these deployments onto modern multi-socket, multi-core, multi-threaded server hardware is an increasingly attractive proposition for administrators.
Achieving optimal SQL Server performance has been a continual focus for VMware; in fact, a primary goal of this paper is to refresh a previous-generation vSphere 4 SQL scalability study [2]. With current vSphere 5.x releases, VMware supports “monster” virtual machines that can scale up to 64 virtual CPUs and 1 TB of RAM [3]; vSphere can also expose a virtual NUMA architecture to the guest.
These tests show that large SQL Server database instances can run extremely efficiently, achieving great performance in a variety of virtual machine configurations with only minor tunings to the SQL Server application and the vSphere ESXi host. These tunings and other best practices for fully optimizing large virtual machines for SQL Server databases are presented in the paper.
Additionally, there are several tests which show the performance differences between physical cores and logical processors (Hyper-Threads), the maximum throughput achieved using multiple virtual machines that vary from 8 to 64 vCPUs, and experiments with the advanced Latency Sensitivity setting vSphere offers.
Test Environment In order to test the performance of large database virtual machines, a benchmark test bed was assembled in the VMware labs with sufficient compute, storage, and networking hardware. This configuration was capable of running one monster database virtual machine with maximum vCPUs and memory, as well as multiple, smaller virtual machines. Multiple large databases were created within these virtual machines, and the open-source DVD Store workload was used to measure the aggregate throughput.
Test Bed Configuration
The server, storage, and networking hardware used for this performance study are shown in Figure 1. The HP ProLiant DL580 G7 server was the system under test (SUT), and was equipped with four Intel Xeon E7-4870 10-core processors, 1 TB of physical memory, a quad-port 1GbE NIC, two 10GbE NICs, and an 8Gb Fibre Channel HBA.
The latest released server system ROM and iLO firmware were used. Since the goal of this study was to achieve maximum application performance, processor power management was disabled by setting the HP Power Profile Mode to Maximum Performance, and Power Regulator Mode to Static High Performance. This is described in “Poor virtual machine application performance may be caused by processor power management settings” (KB 1018206) [4]. Other BIOS settings, such as Intel Hyper-Threading and Turbo Mode, were left at their defaults (Enabled) because they provided the highest throughput.
ESXi 5.5 Update 1 was installed on an internal disk, while all the virtual machines’ disks resided on an EMC VNX5800 array. This array had a mixture of 6Gbps 300GB 15K SAS drives and 200GB SSDs. 16 of the SAS drives
T E C H N I C A L W H I T E P A P E R / 3

Performance and Scalability of Microsoft SQL Server on VMware vSphere 5.5
were combined into a RAID0 LUN, and this is where the guest operating system and log file virtual disks were stored. The SSDs were split into multiple 6-drive RAID0 LUNs, and each SQL database instance was placed on the SSDs to achieve optimal disk read performance.
For more details, such as hardware and software versions, refer to “Appendix A.”
Figure 1. Test bed architecture
Host Processor Architecture
Figure 2 shows the physical host’s processor sockets, cores, and logical threads available to ESXi. Note that while the host has 4 physical processors, there are 80 logical processors available to the operating system.
T E C H N I C A L W H I T E P A P E R / 4

Performance and Scalability of Microsoft SQL Server on VMware vSphere 5.5
Figure 2. Host processor architecture
Operating System and SQL Server Installation/Tuning
The HP customized ESXi Image [5] was used to install vSphere 5.5 U1 on the HP ProLiant server because that image provides the latest certified drivers for the network and storage controllers.
Microsoft Windows® Server 2012 R2 was used as the guest operating system for the virtual machines and was updated using Windows Update. The number of virtual CPUs and virtual RAM varied depending upon the test, and is detailed later. The operating system, SQL logs, and backups were stored on a 350GB virtual disk. Each virtual machine had VMware Tools installed, and each virtual hard disk was connected to a separate VMware Paravirtual SCSI (PVSCSI) adapter to ensure optimal throughput and lower CPU utilization [6]. The number of virtual network adapters varied depending on the number of SQL Server database instances, but all used the VMXNET 3 adapter, which was designed for optimal performance [7]. SQL Server 2012 SP1 Enterprise Edition was installed for each database instance, with the following features: Database Engine Services, Full-Text Search, Client Tools Connectivity, Client Tools Backwards Compatibility, Management Tools – Complete. The Database Engine was configured with Mixed Mode Authentication. Each instance was split across two 132GB virtual hard disks and was created based on the sqlserverds2_create_all_large2.sql script provided with the DVD Store kit.
For tuning SQL Server, there are two great resources:
1. The SQL Server on VMware Best Practices Guide [8] has a wealth of recommendations and guidance for running SQL Server in a vSphere-based environment.
2. Performance Tuning Guidelines for Windows Server 2012 R2 [9] is a Microsoft document with a specific set of tuning recommendations for OLTP workloads [10] and does mention which tunings that are applicable to
T E C H N I C A L W H I T E P A P E R / 5

Performance and Scalability of Microsoft SQL Server on VMware vSphere 5.5
virtualized configurations. The tunings were found to have a noticeable benefit for the DVD Store workload and are summarized below:
• Set the power plan to High Performance.
• Enable SQL Server to use large pages by enabling the Lock pages in memory user right assignment for the account that will run the SQL Server in Group Policy.
• Enable the TCP/IP protocol to allow communication with client systems:
In Server Configuration Manager, navigate to SQL Server Network Configuration > Protocols for MSSQL Server, right-click TCP/IP, and click Enable.
• SQL Server Startup Parameters:
– -x Disable SQL Server performance monitor counters
– -T661 Disable the ghost record removal process
– -T834 Use Microsoft Windows large-page allocations for the buffer pool Note: This parameter was not used in these tests, as it hurt performance, caused slower startup time for SQL Server services, and required limiting each instance to a static slice of memory. Even if this parameter is not set, SQL Server does use large pages for other internal structures. This can be verified by looking for lines like the below in the startup log:
2014-08-07 15:18:55.23 Server Using locked pages in the memory manager.
2014-08-07 15:18:55.24 Server Large Page Allocated: 32MB
Other common SQL tunings, their values for these tests, and references to more information are noted below:
• Max degree of parallelism (MAXDOP) [11] is an advanced configuration option that controls the number of processors used to execute a query in a parallel plan. Setting this value to 1 disables parallel plans altogether, which is not recommended in a large virtual machine because it could result in unused virtual CPUs and wasted resources. Microsoft has guidelines for setting this value, depending on whether the host has NUMA and (or) Hyper-Threading, and there are numerous recommendations online, but many predate virtualization and modern server hardware [12] . The default value of 0 is recommended because it allows SQL Server to utilize all virtual CPUs available, and this was the value used for all testing.
• Cost threshold for parallelism [13] is an option that specifies the threshold at which parallel plans are used for queries. The value is specified in seconds, and the default is 5, which means a parallel plan for queries are used if SQL estimates it would take longer than 5 seconds if run serially. This value started to show very high response times with large virtual machines with 8 or more virtual CPUs, particularly for the DVD Store “login” query. Increasing this value to 50 [14] resolved this performance bottleneck and was used for all testing.
• Processor affinity [15] and I/O affinity [16] masks allow database administrators to assign SQL CPU and I/O to specific vCPUs and (or) vNUMA nodes, as shown in Figure 3.
T E C H N I C A L W H I T E P A P E R / 6

Performance and Scalability of Microsoft SQL Server on VMware vSphere 5.5
Figure 3. SQL Server Affinity settings (kept at defaults)
Additionally the number of worker threads can be set, process priority can be raised, and “Windows fibers” can be used (as shown above). All experiments with enabling these features resulted in lower performance, however, which is consistent with Microsoft guidance that these should only be set under rare circumstances, so the defaults are recommended.
• SQL Server licensing can affect performance [17]. Product features vary depending upon the edition (the three main editions are Standard, Business Intelligence, and Enterprise), and SQL Server 2012 licensing has two different licensing models (Core-Based or Server+CAL). During testing, the type of license was determined to be limiting the performance of virtual machines with more than 20 vCPUs. The SQL instance’s ERRORLOG showed this message when the virtual machine had more than 20 vCPUs:
SQL Server detected 32 sockets with 1 cores per socket and 1 logical processors
per socket, 32 total logical processors; using 20 logical processors based on SQL
Server licensing.
This was due to a 20 logical processor limitation imposed on the Server+CAL licenses we had used initially [18]. Fortunately, using a Core-Based licensing model can allow customers to license by virtual machines/vCPUs instead of the entire physical host.
See “Licensing SQL Server 2012 in a Virtualized Environment” in the SQL Server 2012 Licensing Guide [19] for all definitive statements about SQL Server 2012 licensing in virtualized environments.
• To scale up load on a SQL Server virtual machine, large tables can be partitioned, multiple databases can be hosted on one SQL instance, or multiple “named instances” of SQL Server can be installed.
For ease of benchmarking, multiple instances of the SQL Server Database Engine were installed, each with its own set of dedicated virtual resources (virtual NIC and virtual disks). This choice was made because the DVD Store workload is written to stress a specific database with a defined database schema. By using named instances, no code modifications need to be made to the load driver program; each simply listens on its own unique IP address.
T E C H N I C A L W H I T E P A P E R / 7

Performance and Scalability of Microsoft SQL Server on VMware vSphere 5.5
Figure 4 shows how two instances can be configured to listen on different IP addresses (NICs) but the same TCP port within the SQL Server management interface.
Figure 4. SQL Server instances listening on different IPs
For more information on named instances, see Multiple Instances of SQL Server [20].
DVD Store 2 Benchmark
Performance tests in this paper were undertaken using the DVD Store 2 benchmark [21]. DVD Store is an open-source tool that simulates an E-commerce Web application and advanced transactions against a backend database tier. It has been used in numerous third-party performance studies, and is a key application workload in the VMmark 2 benchmark [22]. For the tests in this study, the Web layer was bypassed so it was not a potential bottleneck, so the client load drivers could stress the database tier directly.
DVD Store 2 comes in three standard database sizes: small, medium, and large, as shown in Table 1.
DATABASE SIZE CUSTOMERS ORDERS PRODUCTS
Small 10 MB 20,000 1,000/month 10,000
Medium 1 GB 2,000,000 100,000/month 100,000
Large 100 GB 200,000,000 10,000,000/month 1,000,000
Table 1. DVD Store 2 database sizes
Given the goal of these tests was to stress large virtual machines, the large 100GB database size was selected. This simulates 200 million customers ordering 10 million DVDs per month from a catalog of 1 million DVDs.
In order to saturate virtual machines with large amounts of virtual CPUs and memory, multiple SQL Server databases (named instances) were used. Each SQL Server instance has its own 100GB large DVD Store database. For example, a 64-vCPU virtual machine had four 100GB database instances for a 400GB total working set.
T E C H N I C A L W H I T E P A P E R / 8
Performance and Scalability of Microsoft SQL Server on VMware vSphere 5.5
Repeatability was ensured by restoring a backup for each database instance before each run. Steady state was achieved by ensuring throughput gradually increased during the 5-minute warmup period, and reached/maintained steady state during each 10-minute run time. The number of driver processes and threads were adjusted as needed to saturate the number of virtual machines and database instances running for each test.
Comparing Physical vs. Logical Processors Hyper-Threading is a processor technology designed by Intel to improve parallelization by splitting each physical core into two logical cores, which allows the operating system to schedule more simultaneous processes. ESXi is Hyper-Threading aware, and benefits from having more cores available to schedule virtual machines on. However, unlike a traditional dual-core processor, which contains two separate physical cores, logical cores share execution resources. This allows one core to use resources from the other while it is waiting for data.
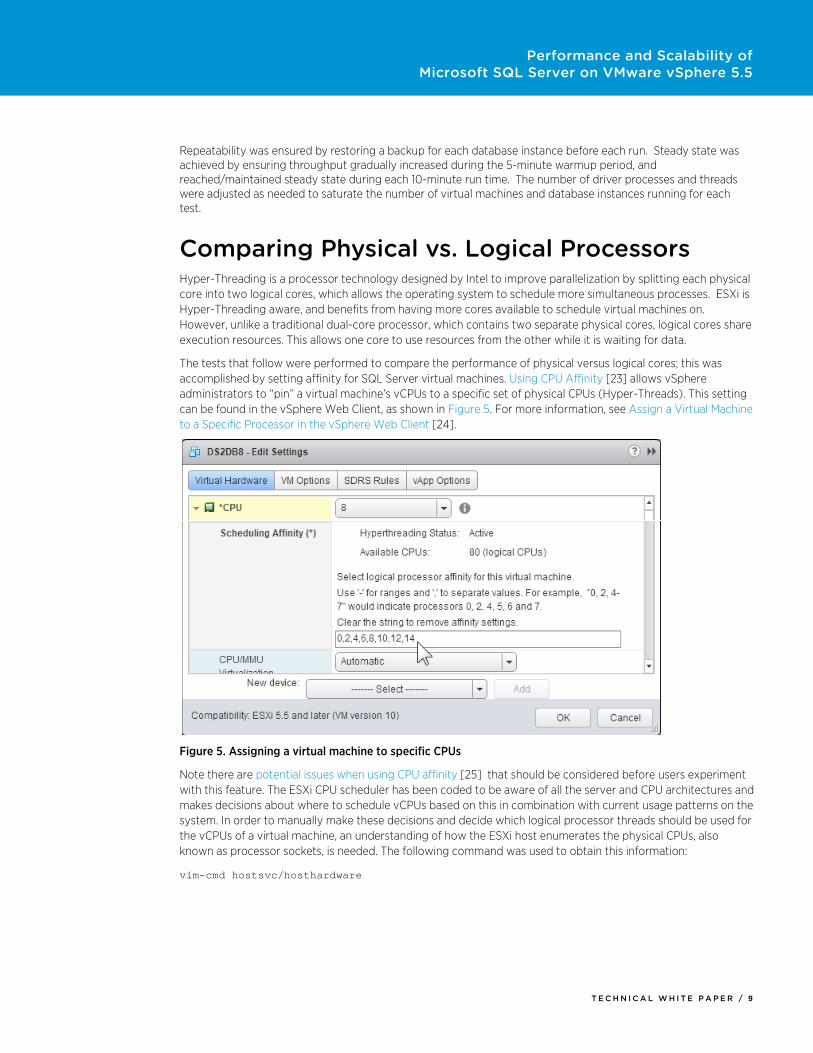
The tests that follow were performed to compare the performance of physical versus logical cores; this was accomplished by setting affinity for SQL Server virtual machines. Using CPU Affinity [23] allows vSphere administrators to “pin” a virtual machine’s vCPUs to a specific set of physical CPUs (Hyper-Threads). This setting can be found in the vSphere Web Client, as shown in Figure 5. For more information, see Assign a Virtual Machine to a Specific Processor in the vSphere Web Client [24].
Figure 5. Assigning a virtual machine to specific CPUs
Note there are potential issues when using CPU affinity [25] that should be considered before users experiment with this feature. The ESXi CPU scheduler has been coded to be aware of all the server and CPU architectures and makes decisions about where to schedule vCPUs based on this in combination with current usage patterns on the system. In order to manually make these decisions and decide which logical processor threads should be used for the vCPUs of a virtual machine, an understanding of how the ESXi host enumerates the physical CPUs, also known as processor sockets, is needed. The following command was used to obtain this information:
vim-cmd hostsvc/hosthardware
T E C H N I C A L W H I T E P A P E R / 9

Performance and Scalability of Microsoft SQL Server on VMware vSphere 5.5
As previously shown in Figure 2, the SUT used in this paper is a 4-socket server, each socket consisting of a 10-core Intel Xeon Processor E7-4870 (80 total threads with Hyper-Threading). The following cpuInfo structure shows how ESXi interprets this internally; this is the ESXi physical CPU view.
cpuInfo = (vim.host.CpuInfo) { dynamicType = <unset>,
numCpuPackages = 4,
numCpuCores = 40,
numCpuThreads = 80,
hz = 2397400272,
},
This confirms the ESXi host sees 4 processors (called packages here), 40 cores (10 physical cores per processor), and 80 threads (also known as logical processors).
Figure 6 shows how ESXi breaks down the processor packages into 80 threads, numbered 0-79:
Figure 6. ESXi processor threads view
A key takeaway from this figure is that each physical core is sequentially numbered; the first physical core has threads 0 and 1, the second physical core has threads 2 and 3, and so on. Since each core’s pair of threads share physical processor resources (namely cache), virtual machines are preferentially scheduled on two different cores rather than on two logical processors on the same core. The next section shows why.
10 cores (20 threads) within each “CPU package” (processor)
Each physical core has 2 threads (“twins”) or logical processors
T E C H N I C A L W H I T E P A P E R / 1 0

Performance and Scalability of Microsoft SQL Server on VMware vSphere 5.5
8 Physical Cores versus 8 Logical Processors
The purpose of this performance test is to verify that 8 physical cores outperform 8 logical processors, since more execution resources are available to physical cores. This test utilized only one processor package, since each has 10 cores and 20 threads (logical processors) as shown above.
For this test, one 8-vCPU virtual machine was affinitized, or “pinned,” two different ways:
• 8 physical cores: The virtual machine was assigned to CPUs 0, 2, 4, 6, 8, 10, 12, 14
• 8 logical processors: The virtual machine was assigned to CPUs 0, 1, 2, 3, 4, 5, 6, 7
The results are shown below in Figure 7.
Figure 7. 8 physical cores vs. 8 logical processors (4 cores + 4 threads)
Results show that the test using 8 physical cores can achieve 92,712 operations per minute (OPM), while 8 logical processors could only reach 58,145 OPM. In essence, 8 physical cores perform 59% better than 8 logical processors. This is not to say Hyper-Threading is not beneficial; on the contrary, Hyper-Threading can show significant benefits, as shown in the next section.
Note that NUMA is not a factor in this test for a couple of reasons: first, physical NUMA boundaries are not crossed, since only one physical processor is used; and second, by default, vSphere only creates a virtual NUMA (vNUMA) topology for VMs with more than 8 vCPUs. For more information, refer to Using Virtual NUMA [26].
92,712
58,145
0
10,000
20,000
30,000
40,000
50,000
60,000
70,000
80,000
90,000
100,000
8 full cores (no HT)PCPU 0,2,4,6,8,10,12,14
4 cores + 4 threads (twins)PCPU 0,1,2,3,4,5,6,7
Ope
ratio
ns P
er M
inut
e (O
PM)
T E C H N I C A L W H I T E P A P E R / 1 1

Performance and Scalability of Microsoft SQL Server on VMware vSphere 5.5
16 Physical Cores versus 16 Logical Cores
The next set of tests are similar to the previous section, but the number of vCPUs is doubled from 8 to 16. This is a subtle but important difference, because ESXi will now span two physical processors (sockets), so NUMA boundaries are crossed. Also, as noted above, since the number of vCPUs is greater than 8, a virtual NUMA topology is visible to the virtual machine as well. Following is output from Microsoft’s Coreinfo command-line utility [27] inside the virtual machine:
Logical Processor to NUMA Node Map:
********-------- NUMA Node 0
--------******** NUMA Node 1
Note how the virtual machine sees two NUMA nodes, split evenly into 8 vCPUs per node.
By setting CPU affinity within ESXi, the 16 virtual CPUs can be mapped to the host’s processors in different ways:
• 16 logical processors: CPUs 0, 1, 2, 3, 4, 5, 6, 7, 8, 9, 10, 11, 12, 13, 14, 15
• 16 physical cores: CPUs 0, 2, 4, 6, 8, 10, 12, 14, 16, 18, 20, 22, 24, 26, 28, 30 Note these are sequential, even-numbered logical CPUs, but unevenly distributed across physical CPUs; the first 10 vCPUs will reside on the first socket, and the remaining 6 will be on the second socket.
• 16 physical cores, but evenly distributed across 2 physical sockets: CPUs 0 ,2, 4, 6, 8, 10, 12 ,14 for the first socket; then 20, 22, 24, 26, 28 ,30, 32, 34 on the second
The results are shown in Figure 8.
Figure 8. Affinity tests using a 16-vCPU virtual machine
117,345
150,519 152,192
0
20,000
40,000
60,000
80,000
100,000
120,000
140,000
160,000
8 cores + 8 threads(twins)
16 full cores (sequential:10 on 1st CPU, 6 on 2nd;
no HT)
16 full cores (even split: 8on 1st CPU, 8 on 2nd;
no HT)
Ope
ratio
ns P
er M
inut
e (O
PM)
T E C H N I C A L W H I T E P A P E R / 1 2

Performance and Scalability of Microsoft SQL Server on VMware vSphere 5.5
The results again show that physical cores can deliver noticeably higher throughput than logical processors, but we also see an even split of virtual CPUs across physical processors (2 NUMA nodes) yields the highest throughput.
These tests show that 16 physical cores outperform 16 logical processors, even when NUMA nodes have to be crossed. However, the performance improvement is only 30% compared to the 59% improvement for the 8-vCPU test, indicating that spanning two NUMA nodes incurs approximately a 19% performance penalty.
Comparing the first columns of Figures 7 and 8 shows that enabling Hyper-Threading yields a very substantial 27% performance improvement.
Maximum Throughput Tests The goal of the tests in this section was to achieve maximum throughput with different numbers of virtual machines, where the number of vCPUs per virtual machine starts at 8, then is doubled to 16, then 32, and finally 64 (the maximum supported for vSphere 5.5). Virtual memory was scaled up accordingly. While our best practice recommendation is to size vCPU count to align with physical NUMA boundaries, we made a conscious decision in this study to test 8/16/32/64 vCPUs, even though the physical host has 10 physical cores per NUMA node; customers often have dynamic data center environments where the hosts may be heterogeneous and continually changing.
To ensure the physical host was fully utilized, the esxtop [28] utility was run in the ESXi shell to obtain performance statistics. Esxtop collects data for all major host subsystems (CPU, memory, disk, and network), but the most relevant statistic for these tests was determined to be the Physical CPU “CORE UTIL(%)”. When this counter reaches an average of 99%, the system is fully utilized and maximum throughput is obtained. For more information, see the Interpreting esxtop Statistics [29] document.
8 VM x 8 vCPU Configuration
This setup consisted of 8-vCPU virtual machines, each with two SQL Server instances (databases) per virtual machine. Eight identical virtual machines were stressed simultaneously, for a total of 64 vCPUs under test.
Figure 9. 8 x 8 vCPU VM configuration
T E C H N I C A L W H I T E P A P E R / 1 3

Performance and Scalability of Microsoft SQL Server on VMware vSphere 5.5
Figure 10 shows this configuration performs well within an 80 logical processor host. It also performed the best out of all the other configurations in terms of total throughput across all virtual machines, achieving 493,804 OPM; all logical processors were close to saturation, as esxtop showed 96% CORE UTIL. The Windows guest operating system does not have to manage NUMA and large amounts of vCPUs and memory, as an 8-vCPU virtual machine does not have virtual NUMA by default. ESXi understands the underyling physical host’s NUMA architecture, and evenly distributes the virtual machines across processors and NUMA nodes, resulting in excellent performance.
Figure 10. 8 x 8 vCPU VM throughput
9 VM x 8 vCPU Configuration
Adding a ninth virtual machine to the setup above overloads the host, even though the total vCPU used, at 72 vCPU, is less than the 80 logical processors on the ESXi host. Performance starts to become much more inconsistent across virtual machines, and total throughput across all virtual machines is lower than the 8 VM x 8 vCPU test, as Figure 11 shows, totaling 473,267 OPM. Esxtop shows the % CORE UTIL at 99%, confirming the host was over-saturated. The main reason for this is that at all times one of the processors is running 3 virtual machines while the other 3 are running 2 virtual machines each. The resulting imbalance causes the scheduler to migrate one of the 3 virtual machines to another processor, resulting in a different imbalance. It may take several minutes for the virtual machine memory to migrate to the new socket.The vSphere scheduler ensures fairness: eventually all the virtual machines will achieve a similar average throughput. However, this throughput will be non-optimal, since virtual machine memory is non-local a significant fraction of the time. As mentioned in the
61,844 59,941
62,904 60,485
62,866 62,629 61,511 61,624
0
10,000
20,000
30,000
40,000
50,000
60,000
70,000
VM1 VM2 VM3 VM4 VM5 VM6 VM7 VM8
Ope
ratio
ns P
er M
inut
e (O
PM)
T E C H N I C A L W H I T E P A P E R / 1 4

Performance and Scalability of Microsoft SQL Server on VMware vSphere 5.5
beginning of this section, since the physical host has 10 physical cores per NUMA node, an optimal configuration would be 8 VM x 10 vCPU (not run for this study, as it was not a goal in this testing).
Figure 11. 9 x 8 vCPU VM throughput
4 VM x 16 vCPU Configuration
The number of virtual CPUs was doubled from 8 to 16 per virtual machine for this test. As mentioned earlier, 16-vCPU virtual machines expose two 8-vCPU vNUMA nodes to the Windows virtual machines. Four of these virtual machines were used, for a total of 64 vCPUs being stressed.
Figure 12. 4 x 16 vCPU VM configuration
63,790
50,130 52,069
44,871
56,646
44,948
54,242
60,439
46,132
0
10,000
20,000
30,000
40,000
50,000
60,000
70,000
VM1 VM2 VM3 VM4 VM5 VM6 VM7 VM8 VM9
Ope
ratio
ns P
er M
inut
e (O
PM)
T E C H N I C A L W H I T E P A P E R / 1 5

Performance and Scalability of Microsoft SQL Server on VMware vSphere 5.5
Figure 13 shows that 4 VMs x 16 vCPUs performs well within an 80 logical processor host.
Figure 13. 4 VM x 16 vCPU throughput
The configuration above achieved 467,076 OPM, with an average 96% core utilization.
Adding a fifth virtual machine fully allocates all the host’s processors to vCPUs, (16 vCPUs x 5 = 80). Again, bear in mind Hyper-Threading does not double the processing power; there are only 40 physical cores in this server.
121,958 115,450 115,281 114,387
0
20,000
40,000
60,000
80,000
100,000
120,000
140,000O
pera
tions
Per
Min
ute
(OPM
)
VM1 VM2 VM3 VM4
T E C H N I C A L W H I T E P A P E R / 1 6

Performance and Scalability of Microsoft SQL Server on VMware vSphere 5.5
Figure 14. 5 VM x 16 vCPU throughput
Here in Figure 14, the aggregate throughput was 464,883 operations per minute (slightly lower than the 4-VM case), and the 80 logical processors reported 99% average core utilization.
2 VM x 32 vCPU Configuration
This test used 4 SQL Server instances running across two 32-vCPU virtual machines (as shown in Figure 15). With 32 virtual CPUs, vSphere creates 4 vNUMA nodes, each with 8 vCPUs.
93,681 90,926 92,484 95,552 92,240
0
20,000
40,000
60,000
80,000
100,000
120,000
140,000
Ope
ratio
ns P
er M
inut
e (O
PM)
VM1 VM2 VM3 VM4 VM5
T E C H N I C A L W H I T E P A P E R / 1 7

Performance and Scalability of Microsoft SQL Server on VMware vSphere 5.5
Figure 15. 2 VM x 32 vCPU configuration
Here is what Coreinfo shows as the vNUMA configuration (4 vNUMA nodes, 8 CPUs in each):
Logical Processor to NUMA Node Map:
********------------------------ NUMA Node 0 --------********---------------- NUMA Node 1
----------------********-------- NUMA Node 2
------------------------******** NUMA Node 3
As Figure 16 shows, both 32-vCPU virtual machines performed very similarly, each above 200,000 OPM.
T E C H N I C A L W H I T E P A P E R / 1 8

Performance and Scalability of Microsoft SQL Server on VMware vSphere 5.5
Figure 16. 2 VM x 32 vCPU throughput
The aggregate throughput of this configuration is 407,401 OPM, and the 80 logical processors were not quite saturated at 94% average (indicating some headroom). This test case could benefit from the preferHT parameter (described and tested in the following 64 vCPU test), as each virtual machine could utilize 2 NUMA nodes, resulting in more local memory.
Adding a third 32-vCPU virtual machine raises the aggregate throughput slightly, as Figure 17 shows, even though there are now 96 vCPUs (32 x 3) versus only 80 logical processors on the host. Note, however, that the per-VM throughput has dropped from over 200,000 to approximately 140,000 OPM.
204,167 203,234
0
50,000
100,000
150,000
200,000
250,000
300,000
Ope
ratio
ns P
er M
inut
e (O
PM)
VM1 VM2
T E C H N I C A L W H I T E P A P E R / 1 9

Performance and Scalability of Microsoft SQL Server on VMware vSphere 5.5
Figure 17. 3 VM x 32 vCPU throughput
In this test, the aggregate throughput was 424,860 OPM, and the 80 logical processors were fully utilized. The reason this is better than the 2 VM x 32 vCPU case is that this case is balanced, so migrations are minimal.
1 VM x 64 vCPU Configuration
The final scaling test increased the number of vCPUs to 64, the maximum supported with vSphere 5.5. Figure 18 shows the configuration of this virtual machine.
141,527 142,284 141,049
0
20,000
40,000
60,000
80,000
100,000
120,000
140,000
160,000
180,000
200,000
Ope
ratio
ns P
er M
inut
e (O
PM)
VM1 VM2 VM3
T E C H N I C A L W H I T E P A P E R / 2 0

Performance and Scalability of Microsoft SQL Server on VMware vSphere 5.5
Figure 18. 1 x 64 vCPU VM configuration
This test turned up an interesting disconnect between the number of vCPUs and the number of physical cores per processor (10). ESXi, by default, splits a virtual machine into vNUMA nodes based on the number of cores per node, so this is the imbalanced vNUMA layout Windows (Coreinfo) sees:
Logical Processor to NUMA Node Map:
**********------------------------------------------------------ NUMA Node 0
----------**********-------------------------------------------- NUMA Node 1
--------------------**********---------------------------------- NUMA Node 2
------------------------------**********------------------------ NUMA Node 3
----------------------------------------**********-------------- NUMA Node 4 --------------------------------------------------**********---- NUMA Node 5
------------------------------------------------------------**** NUMA Node 6
By default, ESXi creates 7 virtual NUMA nodes with 10 virtual CPUs per vNUMA node, except for the last node, which has only 4 (for a total of 64 vCPUs).
In order to mimic the same number of virtual NUMA nodes as physical NUMA nodes (four), the virtual machine was configured to use Hyper-Threading with NUMA [30] using the preferHT parameter:
numa.vcpu.preferHT=TRUE
This creates a more balanced virtual NUMA architecture with 4 nodes, each with 16 vCPUs (an even distribution of 64), as Coreinfo output confirms below:
Logical Processor to NUMA Node Map:
****************------------------------------------------------ NUMA Node 0
----------------****************-------------------------------- NUMA Node 1 --------------------------------****************---------------- NUMA Node 2
------------------------------------------------**************** NUMA Node 3
Figure 19 illustrates a marked 30% improvement with this tuning.
T E C H N I C A L W H I T E P A P E R / 2 1

Performance and Scalability of Microsoft SQL Server on VMware vSphere 5.5
Figure 19. Aggregate throughput of 64-vCPU VMs
Table 2 summarizes the throughput (OPM) achieved for various virtual machine and vCPU configurations. The average core utilization was consistently approaching 100%; in all cases, host processor utilization was the bottleneck.
330,685
428,874
0
50,000
100,000
150,000
200,000
250,000
300,000
350,000
400,000
450,000
500,000
1 x 64-way, default(7 vNUMA clients)
1 x 64-way, tuned(4 vNUMA clients)
Ope
ratio
ns P
er M
inut
e (O
PM)
T E C H N I C A L W H I T E P A P E R / 2 2

Performance and Scalability of Microsoft SQL Server on VMware vSphere 5.5
VM QUANTITY, SIZE AGGREGATE THROUGHPUT (OPM) % CORE UTILIZATION (AVG. OF ALL LOGICAL PROCESSORS)
8 x 8 vCPU 493,804 96%
9 x 8 vCPU 473,267 99%
4 x 16 vCPU 467,076 96%
5 x 16 vCPU 464,883 99%
2 x 32 vCPU 407,401 94%
3 x 32 vCPU 424,860 97%
1 x 64 vCPU 428,874 94%
Table 2. Aggregate throughput test summary
Virtual NUMA, Cores per Socket Testing Virtual NUMA (vNUMA) exposes NUMA topology to the guest operating system, allowing NUMA-aware guest operating systems and applications to make the most efficient use of the underlying hardware’s NUMA architecture. It can provide significant performance benefits for wide virtual machines. For more information, see “Virtual NUMA (vNUMA)” in the Performance Best Practices for vSphere 5.5 guide [31].
The tests in this section were done to observe how throughput was impacted by presenting various different NUMA and processor topologies to the Windows virtual machines. vSphere allows users to change the way virtual CPUs are presented to a virtual machine. For example, instead of presenting a 32-vCPU virtual machine as 4 sockets (the default for the hardware considered here), a user could employ the vSphere Web Client (as shown in Figure 20) to specify 8 sockets (4 cores per socket), or 16 sockets (2 cores per socket). In nearly all cases, the default value of “Cores per Socket” (1) should be used. With the default value, vSphere creates virtual NUMA nodes that best align with the physical NUMA topology of the host the virtual machine is booted on. Values greater than 1 are used directly to create virtual NUMA nodes for “wide” virtual machines. The most common use-case for changing this parameter is to align with Windows licensing, which, in some cases, is socket-based. Another use-case is to force the creation of virtual NUMA nodes that map well to machines with different physical NUMA node sizes in the case where the virtual machine may be migrated using vMotion among such machines.
T E C H N I C A L W H I T E P A P E R / 2 3

Performance and Scalability of Microsoft SQL Server on VMware vSphere 5.5
Figure 20. Cores per Socket options for a 32-vCPU VM
The tests that follow were all run with 3 x 32-vCPU virtual machines. Several different topologies were tested, as shown in Table 3.
VM QUANTITY, SIZE
SOCKETS PER VM CORES PER SOCKET
VNUMA NODES AGGREGATE THROUGHPUT (OPM)
3 x 32 vCPU 32 1 (default) 4 424,860
3 x 32 vCPU 8 4 8 411,648
3 x 32 vCPU 16 2 16 385,412
3 x 32 vCPU 32 1 (default) vNUMA disabled 421,263
Table 3. Cores per Socket / vNUMA Nodes test matrix
The results are summarized in Figure 21. Note that the default topology (the first bar) was the highest performing case, which enables vNUMA for a 32-vCPU virtual machine. When using the default settings with 1 vCPU core per socket, vSphere will automatically select the best vNUMA topology and present that to the guest. In this case, it was 4 virtual NUMA nodes with 8 virtual CPUs each. This is consistent with past guidance in the “VMware vSphere Blog” [32]. In summary, the default settings provided the best performance which resulted in a vNUMA topology that matched the physical NUMA topology of the server.
T E C H N I C A L W H I T E P A P E R / 2 4

Performance and Scalability of Microsoft SQL Server on VMware vSphere 5.5
Figure 21. Cores per Socket / vNUMA performance results
Latency Sensitivity Tests ESXi is optimized for high throughput to minimize virtualization overhead for a wide range of applications, including business-critical applications such as databases. DVD Store measures throughput in operations per minute (OPM). Latency, on the other hand, measures the time it takes to transfer data from one endpoint to another and is typically measured in milliseconds. Latency-sensitive applications typically include VoIP services or high-frequency trading, where sub-millisecond response times are critical; database applications would not fall into this category.
vSphere includes an advanced setting to support virtual machines with strict latency requirements to lower response time and reduce jitter. This is set through the vSphere Web Client on a per-VM basis, as Figure 22 shows. This setting optimizes ESXi for low latency rather than high throughput. For more information, see Deploying Extremely Latency-Sensitive Applications in VMware vSphere 5.5 [33].
424,860 411,648
385,412
421,263
0
50,000
100,000
150,000
200,000
250,000
300,000
350,000
400,000
450,000
32 sockets, 1 Coreper Socket
4 vNUMA nodes(default)
8 sockets, 4 Coresper Socket
8 vNUMA nodes
16 sockets, 2 Coresper Socket
16 vNUMA nodes
32 vCPU, 1 Coreper Socket
vNUMA Disabled
Ope
ratio
ns P
er M
inut
e (O
PM)
T E C H N I C A L W H I T E P A P E R / 2 5

Performance and Scalability of Microsoft SQL Server on VMware vSphere 5.5
Figure 22. vSphere Latency Sensitivity setting choices
To verify that DVD Store is not a latency-sensitive workload, the 64-vCPU virtual machine used in the prior throughput test was retested with all of the Latency Sensitivity choices shown above: Normal (default), Low, Medium, and High.
T E C H N I C A L W H I T E P A P E R / 2 6

Performance and Scalability of Microsoft SQL Server on VMware vSphere 5.5
Figure 23. Benefit from Latency Sensitivity setting
These results show that this OLTP test on SQL Server is not a latency-sensitive workload. The first three cases are essentially the same (within test variability), but the High setting, which is only designed for extremely low-latency workloads, shows a marked degradation in throughput.
Best Practices • Make sure guest operating systems are running VMware Tools, as well as the latest virtual hardware
version. Important: Configuring a large number of vCPUs is possible only by upgrading to the latest virtual hardware version, and VMware Tools allows the use of paravirtual storage and network drivers.
• Size virtual machines with respect to the underlying processor architecture. The virtual NUMA defaults are optimal for most cases, but vCPU counts that do not cleanly match the server processor core count can cause suboptimal virtual NUMA layouts (i.e. the default layout of a 64 vCPU VM on an 80 logical processor physical host, as shown above). For more information, see the vSphere Resource Management guide [34].
• Let the ESXi scheduler balance processor load for virtual machines. It does so automatically and efficiently. Setting CPU affinity does not usually provide a performance boost for a multi-VM environment, but may provide a modest performance boost for individual virtual machines. Setting CPU affinity requires an intimate understanding of the underlying physical architecture, and because of this, the action is not recommended.
429,215 433,033 427,859
385,662
0
50,000
100,000
150,000
200,000
250,000
300,000
350,000
400,000
450,000
500,000
Normal (default) Low Medium High
Ope
ratio
ns P
er M
inut
e (O
PM)
T E C H N I C A L W H I T E P A P E R / 2 7

Performance and Scalability of Microsoft SQL Server on VMware vSphere 5.5
• Tune SQL Server for virtual machines with large databases and (or) large numbers of vCPUs. Microsoft SQL Server 2012 SP1 is largely auto-tuning; NUMA (vNUMA, in this case) is automatically detected and used. Soft NUMA, processor affinity, and I/O affinity masks are unnecessary. However, some minimal tunings for using large virtual machines are necessary. Below is a summary of what benefited this particular DVD Store setup, but each environment is different.
– Parallelism settings: The Max Degree of Parallelism should be left at 0, but the Cost Threshold for Parallelism setting default of 5 may be too low (it was set to 50 for these tests).
– Scale your database: If the SQL Database Engine, or the database itself, seems to be a bottleneck, consider partitioning the database or installing multiple DB engine “named instances”, and bind them to different IPs/virtual NICs.
For details, see “SQL Server Tunings” on page 3. These are also useful third party references:
– Five SQL Server Settings to Change [14]
– Top 10 Keys to Deploying SQL Server on VMware [35]
– Benchmark Your SQL Server Instance with DVD Store [36]
• Defaults for Virtual NUMA and Cores per Socket should be optimal. While selection of the total number of virtual CPUs is important, the virtual NUMA topology ESXi selects by default should be optimal; this can be verified with the Windows Coreinfo utility mentioned earlier. Cores per Socket defaults to 1, which allows ESXi to select the best vNUMA topology based on the underlying hardware. It is recommended that this setting not be changed except for some particular use cases. In the tests presented here, performance drops when this value is increased.
• Enabling preferHT can increase performance on NUMA systems with Hyper-Threading.
PreferHT [30] is disabled by default, and in many cases this is ideal. However, for certain cases, virtual machines may perform better if ESXi is configured to use Hyper-Threading with fewer NUMA nodes. This was certainly the case for the 64 virtual CPU test, where a 30% performance improvement was achieved by enabling this parameter.
• SQL workloads are not highly sensitive to latency. Latency Sensitivity is an advanced setting designed for high performance computing applications like financial workloads. Database virtual machines in the test configuration did not benefit from being treated as highly latency sensitive. Also see “Latency Sensitivity” in the VMware vSphere 5.5 Documentation Center [37].
Conclusion SQL Server workloads achieve excellent performance with vSphere 5.5 on top of today’s massively multi-core, large memory server hardware. When scaling up the number of virtual machines or vCPUs, some minimal tuning of the database software and ESXi host can help achieve maximum throughput.
T E C H N I C A L W H I T E P A P E R / 2 8

Performance and Scalability of Microsoft SQL Server on VMware vSphere 5.5
Appendix A The following table describes the hardware and software used in the test bed.
VIRTUALIZATION PLATFORM
Hypervisor Vendor, Product, Version, and Build / Availability Date
VMware ESXi 5.5 Update 1 build 1623387 / 03-11-2014
Datacenter Management Software Vendor, Product, Version, and Build / Availability Date
VMware vCenter Server Appliance 5.5 Update 1 build 1623101 / 03-11-2014
SERVER PLATFORM
Server Manufacturer/Model HP ProLiant DL580 G7
Processor Vendor/Model Intel® Xeon® E7-4870
Processor Speed 2.4 GHz (Intel Turbo Boost Technology up to 2.8 GHz)
Total Sockets/Total Cores/Total Threads
4 Sockets / 40 Cores / 80 Threads
Primary Cache 32 KB I + 32 KB D on chip per core
Secondary Cache 256 KB I + D on chip per core
Tertiary Cache 30 MB I + D on chip per chip
BIOS Version P65 10/01/2013
Memory Size (in GB, Number of DIMMs)
1024 GB, 64 x 16 GB
Memory Type and Speed Dual rank x4 PC3L-10600 (DDR-1333) Registered ECC
Disk Subsystem Type FC SAN
Number of Disk Controllers 1
Disk Controller Vendor and Model
HP Smart Array P410i
Number of Host Bus Adapters
1 dual-port
Host Bus Adapter Vendors and Models
QLE2562 dual port 8Gb Fibre Channel HBA
STORAGE
Array Vendor, Model, and Firmware Version
EMC VNX 5800 (version 05.33.000.5.052)
Fibre Channel Switch Vendor and Model
Brocade 300 8Gb
Array Cache Size 32 GB per SP
Total Number of Physical Disks Used
100 (70 HDDs, 30 SSDs)
T E C H N I C A L W H I T E P A P E R / 2 9

Performance and Scalability of Microsoft SQL Server on VMware vSphere 5.5
Total Number of Enclosures/Pods/Shelves Used
4
Disk Vendors, Models, and Speeds
30 x SAS SSD (SS162512 CLAR200)
70 x SAS HDD (SS930065 CLAR300)
NETWORK
Network Switch Vendor and Model
HP ProCurve 5406zl
Network Speed 10Gbps, 1Gbps
Network Controller Vendors/Models
1 x Intel 82576 1GbE Quad-Port
2 x Intel 82598EB 10-Gigabit AF Dual-Port
DATABASE VM INFORMATION
Guest Operating System Windows Server 2012 R2
Database Application SQL Server 2012 SP1
Virtual Processors 8, 16, 32, 64 vCPU
Virtual RAM 16GB-1TB
Benchmarking Software DVD Store 2.1
Table 4. Hardware and software
References [1] VMware, Inc. (2012) Virtualizing Business-Critical Applications on vSphere.
http://www.vmware.com/files/pdf/solutions/VMware-Virtualizing-Business-Critical-Apps-on-VMware_en-wp.pdf
[2] VMware, Inc. (2009) Performance and Scalability of Microsoft SQL Server on VMware vSphere 4. http://www.vmware.com/files/pdf/perf_vsphere_sql_scalability.pdf
[3] VMware, Inc. Configuration Maximums for VMware vSphere 5.5. http://www.vmware.com/pdf/vsphere5/r55/vsphere-55-configuration-maximums.pdf
[4] VMware, Inc. (2104, September) Poor virtual machine application performance may be caused by processor power management settings (1018206). http://kb.vmware.com/kb/1018206
[5] Hewlett-Packard Development Company, LP. (2014) Customize VMware ESXi Images for HP ProLiant Servers. http://h18004.www1.hp.com/products/servers/software/vmware/esxi-image.html
[6] VMware, Inc. (2014, June) Configuring disks to use VMware Paravirtual SCSI (PVSCSI) adapters (1010398). http://kb.vmware.com/kb/1010398
[7] VMware, Inc. (2014, July) Choosing a network adapter for your virtual machine (1001805). http://kb.vmware.com/kb/1001805
T E C H N I C A L W H I T E P A P E R / 3 0

Performance and Scalability of Microsoft SQL Server on VMware vSphere 5.5
[8] VMware, Inc. (2012) SQL Server on VMware Best Practices Guide. http://www.vmware.com/files/pdf/solutions/SQL_Server_on_VMware-Best_Practices_Guide.pdf
[9] Microsoft. (2014, April) Performance Tuning Guidelines for Windows Server 2012 R2. http://msdn.microsoft.com/en-us/library/windows/hardware/dn529133
[10] Microsoft. Performance Tuning for Online Transaction Processing (OLTP). http://msdn.microsoft.com/en-us/library/windows/hardware/dn567642
[11] Microsoft. Recommendations and guidelines for the "max degree of parallelism" configuration option in SQL Server. http://support.microsoft.com/kb/2806535
[12] Brent Ozar. (2010, September) SQL Server Virtualization: Get Your Hands Off That MAXDOP. http://www.sqlskills.com/blogs/brent/sql-server-virtualization-get-your-hands-off-that-maxdop/
[13] Microsoft. (2012) Configure the cost threshold for parallelism Server Configuration Option. http://msdn.microsoft.com/en-us/library/ms190949(v=sql.110).aspx
[14] Brent Ozar. (2013, September) Five SQL Server Settings to Change. http://www.brentozar.com/archive/2013/09/five-sql-server-settings-to-change/
[15] Microsoft. (2012) affinity mask Server Configuration Option. http://msdn.microsoft.com/en-us/library/ms187104(v=sql.110).aspx
[16] Microsoft. (2012) affinity I/O mask Server Configuration Option. http://msdn.microsoft.com/en-us/library/ms189629(v=sql.110).aspx
[17] Michael Otey. (2012, December) SQL Server 2012 Licensing Help. http://sqlmag.com/sql-server-2012/sql-server-2012-licensing-help
[18] Jonathan Kehaylas. (2012, November) Performance Problems with SQL Server 2012 Enterprise Edition Under CAL Licensing. http://sqlperformance.com/2012/11/system-configuration/2012-cal-problems
[19] Microsoft. (2012) Microsoft SQL Server 2012 Licensing Guide. http://download.microsoft.com/download/7/3/C/73CAD4E0-D0B5-4BE5-AB49-D5B886A5AE00/SQL_Server_2012_Licensing_Reference_Guide.pdf
[20] Microsoft. (2000) Multiple Instances of SQL Server. http://technet.microsoft.com/en-us/library/aa174516.aspx
[21] Dave Jaffe and Todd Muirhead. DVD Store. http://en.community.dell.com/techcenter/extras/w/wiki/dvd-store.aspx
[22] VMware, Inc. VMmark 2.x. http://www.vmware.com/products/vmmark/overview.html
[23] VMware, Inc. (2014) Using CPU Affinity. http://pubs.vmware.com/vsphere-55/index.jsp#com.vmware.vsphere.resmgmt.doc/GUID-5FCC0AAA-9D58-4EDF-9A5F-8628F1C8B830.html
[24] VMware, Inc. Assign a Virtual Machine to a Specific Processor. http://pubs.vmware.com/vsphere-
T E C H N I C A L W H I T E P A P E R / 3 1

Performance and Scalability of Microsoft SQL Server on VMware vSphere 5.5
55/index.jsp#com.vmware.vsphere.hostclient.doc/GUID-523DAA21-202A-469B-9A89-1B192C4556F7.html
[25] VMware, Inc. Potential Issues with CPU Affinity. http://pubs.vmware.com/vsphere-55/index.jsp#com.vmware.vsphere.resmgmt.doc/GUID-199F1ADD-3B9B-490C-8F0C-440B53577B3A.html
[26] VMware, Inc. Using Virtual NUMA. http://pubs.vmware.com/vsphere-50/index.jsp?topic=%2Fcom.vmware.vsphere.resmgmt.doc_50%2FGUID-17B629DE-75DF-4C23-B831-08107007FBB9.html
[27] Mark Russinovich. (2013, December) Coreinfo v3.21. http://technet.microsoft.com/en-us/sysinternals/cc835722.aspx
[28] VMware, Inc. (2014) Using the esxtop Utility. http://pubs.vmware.com/vsphere-51/index.jsp?topic=%2Fcom.vmware.vsphere.monitoring.doc%2FGUID-D89E8267-C74A-496F-B58E-19672CAB5A53.html
[29] VMware, Inc. (2010, April) Interpreting esxtop Statistics. https://communities.vmware.com/docs/DOC-9279
[30] VMware, Inc. Configure virtual machines to use hyper-threading with NUMA in VMware ESXi 4.1.x / 5.0.x (2003582). http://kb.vmware.com/kb/2003582
[31] VMware, Inc. Performance Best Practices for vSphere 5.5. http://www.vmware.com/pdf/Perf_Best_Practices_vSphere5.5.pdf
[32] Mark Achtemichuk. (2013, October) Does corepersocket Affect Performance? http://blogs.vmware.com/vsphere/2013/10/does-corespersocket-affect-performance.html
[33] Jin Heo and Lenin Singaravelu. (2013, October) Deploying Extremely Latency-Sensitive Applications in VMware vSphere 5.5. http://www.vmware.com/resources/techresources/10383
[34] VMware, Inc. vSphere Resource Management. http://pubs.vmware.com/vsphere-55/topic/com.vmware.ICbase/PDF/vsphere-esxi-vcenter-server-55-resource-management-guide.pdf
[35] Brent Ozar. (2011, May) Top 10 Keys to Deploying SQL Server on VMware. http://www.brentozar.com/archive/2011/05/keys-deploying-sql-server-on-vmware/
[36] David Klee. (2013, July) Benchmark Your SQL Server Instance with DVD Store. http://www.davidklee.net/2013/07/29/benchmark-your-sql-server-instance-with-dvdstore/
[37] VMware, Inc. (2014) Latency Sensitivity. http://pubs.vmware.com/vsphere-55/index.jsp#com.vmware.vsphere.resmgmt.doc/GUID-9F4FD589-A73B-454A-A5A5-FED4C0F918C3.html
[38] VMware, Inc. Advanced Virtual NUMA Attributes. http://pubs.vmware.com/vsphere-51/index.jsp?topic=%2Fcom.vmware.vsphere.resmgmt.doc%2FGUID-89C52376-60C3-452A-A269-9F4F7FE489C6.html
T E C H N I C A L W H I T E P A P E R / 3 2

Performance and Scalability of
Microsoft SQL Server on VMware vSphere 5.5
About the Author David Morse is a Staff Engineer on the Performance Engineering team at VMware. He has 15 years of benchmarking experience at Dell Inc., VMware, and NCR Corp. He has held a variety of roles within the Standard Performance Evaluation Corporation (SPEC), including chairing the Open Systems Steering Committee and serving on the Board of Directors. David has a B.S. in Computer Engineering from the University of South Carolina and is a Red Hat Certified Engineer (RHCE).
Acknowledgements The author would like to thank: Todd Muirhead, for his DVD Store advice; David Klee, for his SQL Server expertise; Seongbeom Kim and Jeff Buell, for their vNUMA knowledge; and colleagues within the performance engineering organization, many of whom provided valuable feedback throughout this study.
VMware, Inc. 3401 Hillview Avenue Palo Alto CA 94304 USA Tel 877-486-9273 Fax 650-427-5001 www.vmware.com Copyright © 2014 VMware, Inc. All rights reserved. This product is protected by U.S. and international copyright and intellectual property laws. VMware products are covered by one or more patents listed at http://www.vmware.com/go/patents. VMware is a registered trademark or trademark of VMware, Inc. in the United States and/or other jurisdictions. All other marks and names mentioned herein may be trademarks of their respective companies. Item: EN-001559-00 Comments on this document: https://communities.vmware.com/docs/DOC-27373


![Microsoft SQL Server Query Tuning - Meetupfiles.meetup.com/1381968/Microsoft SQL Server Query...Microsoft PowerPoint - Microsoft SQL Server Query Tuning [Compatibility Mode] Author](https://img.dokumen.tips/doc/110x75/5ad9c9447f8b9afc0f8b9e56/microsoft-sql-server-query-tuning-sql-server-querymicrosoft-powerpoint-microsoft.jpg)


![[MS-SSSO]: SQL Server System Overview...SQL Server 2008, Microsoft SQL Server 2008 R2, Microsoft SQL Server 2012, and Microsoft SQL Server 2014. The specific release is indicated when](https://img.dokumen.tips/doc/110x75/5f77a3d14379c025977fc448/ms-ssso-sql-server-system-overview-sql-server-2008-microsoft-sql-server.jpg)

![Perf Vsphere SQL Scalability [A2Z eBooks]](https://img.dokumen.tips/doc/110x75/577d2d271a28ab4e1eacf94a/perf-vsphere-sql-scalability-a2z-ebooks.jpg)