Embed Size (px)
Citation preview

SIMON FRASER UNIVERSITY
Performance and safety of VANET
ENSC 427: COMMUNICATIONS NETWORKS
Group 3
Jeremy Borys 301172228
Jimmy Chenjie Yao 301160093
4/12/2015
www.sfu.ca/~jborys/
Vehicle safety has always been a major concern for automotive engineers. Information carried by a vehicle can be forwarded to another vehicle using the IEEE 802.11p standard protocol, providing a driver or autonomous vehicle with information regarding speed and direction of the approaching vehicle. With the focus on safety, this paper seeks to determine the performance of a vehicular ad hoc network (VANET) under varying conditions and constraints. This paper seeks to understand the effect on packet delivery and end to end delay with respect to the varying number and distances of mobile nodes.

i | P a g e
Table of Contents Table of Figures ................................................................................................................................ii
Table of Acronyms and Abbreviations .............................................................................................ii
1 Introduction ............................................................................................................................. 1
2 Vehicular Ad-hoc Network (VANET) Architecture ................................................................... 1
2.1 Medium Access Control Layer Protocols IEEE 802.11 ...................................................... 2
2.2 Ad-hoc on-Demand Distance Vectoring ........................................................................... 3
2.3 Scope ................................................................................................................................ 4
3 Tools ......................................................................................................................................... 4
3.1 The Network Simulator 2 ................................................................................................. 4
3.2 The Network Animator ..................................................................................................... 4
3.3 Tracegraph........................................................................................................................ 5
3.4 Xgraph .............................................................................................................................. 5
4 Design of the project ............................................................................................................... 6
5 Simulation Results ................................................................................................................... 7
5.1 Scenario 1: Varying Highway Network Traffic .................................................................. 7
5.2 Scenario 2: Varying Highway Inter Distances ................................................................... 9
5.3 Scenario 3: Sudden Four Way Stop ................................................................................ 11
6 Future Work ........................................................................................................................... 12
6.1 Simulation of Urban Mobility ......................................................................................... 12
6.2 Distance based vehicle connection initiation ................................................................ 13
7 Conclusion ............................................................................................................................. 14
8 References ............................................................................................................................. 15
9 Appendix A ............................................................................................................................. 16
9.1 Top level script ............................................................................................................... 16
9.2 Mobility Script ................................................................................................................ 18
9.3 Network Traffic script ..................................................................................................... 19
9.4 Constant Bitrate traffic ................................................................................................... 20
9.5 OSM to NS2 mobility file generation ............................................................................. 20
9.6 Generating a distance based solutions .......................................................................... 21

ii | P a g e
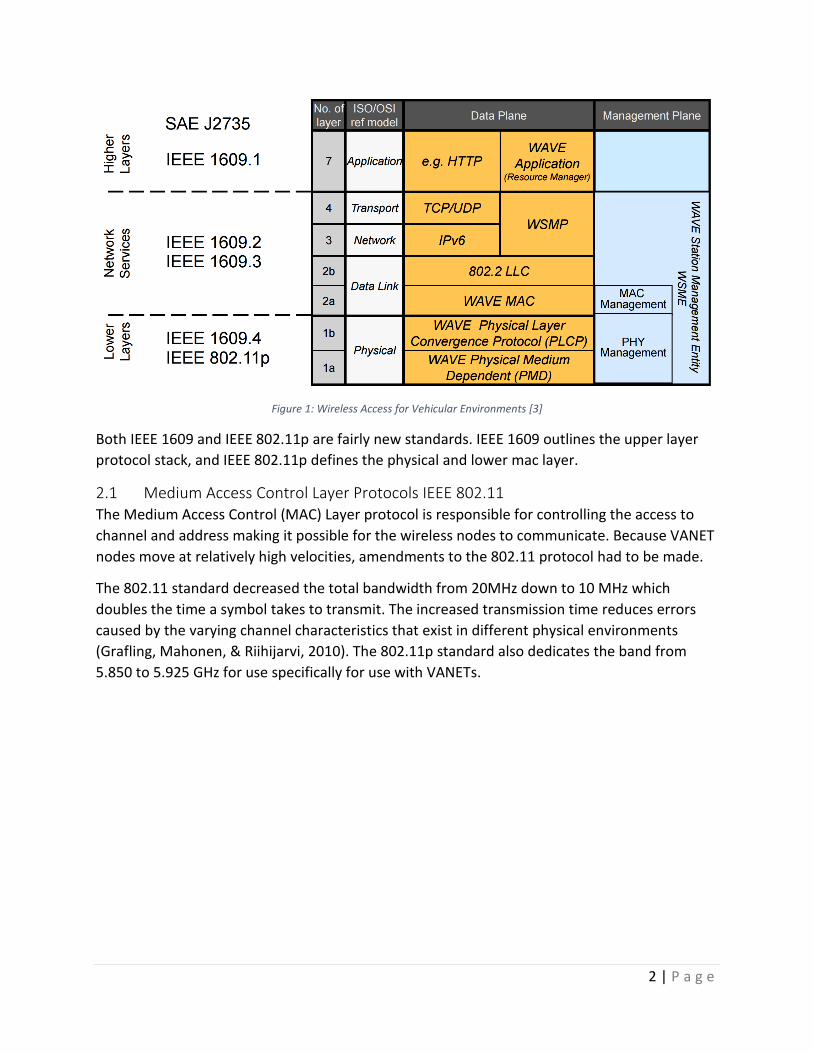
Table of Figures Figure 1: Wireless Access for Vehicular Environments [3] ............................................................. 2
Figure 2: A VANET and MANET Topology [9] .................................................................................. 3
Figure 3: AODV Discovery Process [4] ............................................................................................ 4
Figure 4: Screenshot of Tracegraph ................................................................................................ 5
Figure 5: Xgraph sample plot .......................................................................................................... 6
Figure 6: VANET simulation design flow chart ................................................................................ 6
Figure 7: Nam Snapshot of Scenario1 ............................................................................................. 7
Figure 8 Number of background connections vs delay .................................................................. 8
Figure 9 Number of background connections vs bytes .................................................................. 8
Figure 10: Nam Display of 10 nodes interspersed distance of 50 m .............................................. 9
Figure 11 Car to car distance vs End to end delay ........................................................................ 10
Figure 12 Tx Throughput vs Car to car distance ........................................................................... 10
Figure 13 Nam snapshot of Scenario1 .......................................................................................... 11
Figure 14 Number of background connections vs End to end delay ............................................ 12
Figure 15: Traffic Simulation of SFU ............................................................................................. 13
Figure 16: Traffic Simulation Granville Street ............................................................................... 13
Figure 17: Result of genTrafficInRange.py .................................................................................... 14
Table of Acronyms and Abbreviations
AODV Ad hoc On-Demand Distance Vector
E2E End to End
FTP File Transfer Protocol
IEEE Institute of Electrical and Electronics Engineers
MAC Medium Access Control
MANET Mobile Ad-hoc Network
NAM Network Animator
NS-2 Network Simulator 2
RREQ Route Request
RREP Route Reply
RREP-ACK Route Acknowledgment
RERR Route Error
SUMO Simulation of Urban Mobility
TCL Tool Command Line Language
TCP Transmission Control Protocol
VANET Vehicular Ad-hoc Network
V2V Vehicle to Vehicle

1 | P a g e
1 Introduction The world is currently evolving into a where there are an increasing number of devices
connecting to internet. By including networking technology into everyday objects we are
effectively creating the “internet of things”.
Recently there has been experimentation into communication between vehicles using a vehicle
ad-hoc network (VANET). Allowing cars to communicate between each other has many practical
applications, for example one could transmit the velocity of one vehicle, to the vehicle behind,
allowing the vehicle to match the velocity without driver interaction. [1] As automobiles are
becoming ever increasingly automated and communicating between vehicles is soon to be
commonplace.
The real-time requirements of the vehicular ad-hoc network tend to be more important when
compared to a mobile ad-hoc network (MANET). Knowing relatively accurate average
characteristics of a VANET is very important considering that the network involves humans. If
communication fails to be established or a packet arrives too late someone is potentially at risk
of getting seriously injured.
To understand some of the basic performance of a VANET, this paper plans to run some basic
simulations using the Network Simulator version 2.35 (NS-2) and generate as close as possible
approximations to real world traffic simulations.
2 Vehicular Ad-hoc Network (VANET) Architecture Vehicular ad-hoc networks are created on the continuously configure themselves without any
infrastructure. A VANET completes this using specific routing protocols such as Ad-hoc on-
Demand Distance Vectoring (AODV) and Destination Sequence Distance Vector (DSDV). Each
node must receive and send traffic as the node is effectively a router.
In general VANET nodes move along similar paths at high velocities which makes them different
from mobile ad hoc networks which do not have the same requirements. Vehicles also tend to
group into clusters while travelling along the same path [2] creating a series of disconnected
clusters along a given path. Between the vehicles there tends to be multiple channels of
communication generating large background traffic. The architecture of 802.11p is summarized
in Figure 1.
2 | P a g e
Figure 1: Wireless Access for Vehicular Environments [3]
Both IEEE 1609 and IEEE 802.11p are fairly new standards. IEEE 1609 outlines the upper layer
protocol stack, and IEEE 802.11p defines the physical and lower mac layer.
2.1 Medium Access Control Layer Protocols IEEE 802.11 The Medium Access Control (MAC) Layer protocol is responsible for controlling the access to
channel and address making it possible for the wireless nodes to communicate. Because VANET
nodes move at relatively high velocities, amendments to the 802.11 protocol had to be made.
The 802.11 standard decreased the total bandwidth from 20MHz down to 10 MHz which
doubles the time a symbol takes to transmit. The increased transmission time reduces errors
caused by the varying channel characteristics that exist in different physical environments
(Grafling, Mahonen, & Riihijarvi, 2010). The 802.11p standard also dedicates the band from
5.850 to 5.925 GHz for use specifically for use with VANETs.

3 | P a g e
Figure 2: A VANET and MANET Topology [9]
While a VANET and MANET are very similar Figure 1 tries to highlight the differences. The
VANET nodes do not move in random and follows strict paths guided by roads, this contrasts
with MANETS whose nodes can follow any path.
2.2 Ad-hoc on-Demand Distance Vectoring The Ad-hoc on-Demand Distance Vectoring (AODV) is a type of routing protocol commonly used
in VANET and MANETs. A routing protocol decides the way of data exchange between different
communication entities. The protocol provides services of establishing the route, forwarding,
error detection, and error recovery and flow control. Providing optimal paths between
communication nodes via minimum overhead is the main task of routing protocol.
The high mobility in a VANET makes it hard to design a dedicated VANET protocol. The issues
include computing and maintaining routing paths between vehicles. AODV protocol here is
responsible for discovering, establishing, recovering and maintaining routing paths. AODV uses
four types of control message. The messages are Route Request (RREQ), Route Reply (RREP),
Route Acknowledgment (RREP-ACK) and Route Error (RERR) messages. Every communication
nodes maintains a sequence number which is used by other nodes to determine the freshness
of the data contained from the originating node. When originator needs to route to some
certain nodes. AODV protocol starts discovery process. Figure 3 (a) shows the source
broadcasts RREQ signal to all the other nodes. Eventually, the RREQ will arrive at destination
node that routes back to source using an optimal path.

4 | P a g e
Figure 3: AODV Discovery Process [4]
2.3 Scope There is a lot of research into application of VANETs. Particularly with respect to automation
but most of the research is only just beginning to break into industry. Given the many different
areas that we could measure real time performance, we plan to focus mainly characterizing the
behavior of the IEEE 802.11p and AODV protocol.
3 Tools 3.1 The Network Simulator 2
The Network Simulator version 2.35 (NS-2) is an open source tool used for running event-driven
network simulations. [5]. Using the tool the user can generate a set of TCL scripts to issue
command to the NS2 simulator to specify when to initiate connections between which specific
nodes. The designer can specify which statistics are of interest to the simulation scenario. The
simulator also has lots of external support from researchers and other companies striving to
make the simulator better
3.2 The Network Animator The Network Animator (NAM) is a tool for visualizing the dataflow and movement of nodes in a
network. The tool was used to visually inspect any concerns that may be of interest during our
simulation.

5 | P a g e
3.3 Tracegraph Tracegraph is a third party tool developed by Jaroslaw Malek, used for parsing through and
extracting information from trace files output by NS-2 [6]. Using tracegraph the designer can
quickly view certain characteristics of their network such as end-to-end delay (E2E) delay.
Figure 4: Screenshot of Tracegraph shows a screen shot of the tracegraph GUI.
Figure 4: Screenshot of Tracegraph
Tracegraph provided us the ability to quickly analyze a number of different statistics. We could
also view the data generated by our simulations many different ways, Figure 4: Screenshot of
Tracegraph above the shows a histogram of E2E delays for one of our simulations.
3.4 Xgraph Xgraph is part of ns-all-in-one package, it is a plotting program which can be used to create
graphic representation of an NS-2 simulation result. You can create an output file from your
simulation.tcl script, which can be used as data sets for Xgraph. Below is a sample screenshot of
an Xgraph plot.

6 | P a g e
Figure 5: Xgraph sample plot
4 Design of the project Network simulation version 2.35 (NS-2) is used to simulate VANET model. Ns provides
substantial support for simulation of TCP, routing, and multicast protocols over wired and
wireless networks. We developed our TCL simulation scripts based on NS-2 tutorial.
The figure below shows the design of our VANET project,
Figure 6: VANET simulation design flow chart
We first tried to generate mobility file using a traffic simulator called Simulation of Urban
Mobilty (SUMO) which would allow us to generate more accurate traffic scenarios. However,
SUMO outputs a large area with many different nodes which are all random. The large
connection files made it difficult to write individual connections for all the nodes for the

7 | P a g e
scenarios we wished to simulate and we left what we had accomplished in mass simulation for
future work.
To generate random background network traffic, we used the CBR traffic generator with UDP
Segments. The background communication traffic will more closely resemble the actual
background communication that is to be expected of a real world VANET network.
FTP network traffic using TCP is applied along the nodes that we wish to monitor. The
simulation TCL file is responsible for generating the trace and NAM files. The NAM files are used
to give visual feedback for node movement and node communication. The trace file is required
to analyze packet delay. We used Xgraph and TraceGraph to quickly analyze and manually
extract useful data.
5 Simulation Results
5.1 Scenario 1: Varying Highway Network Traffic The scenario models a set of 30 cars each driving down a highway at a speed of 100 Km per
hour. In each of our simulations we increased background traffic by adding in additional
constant bit rate vehicle to vehicle (V2V) connections. The number of V2V background
connections varied from 1 to15 connections. Figure 7 shows a snapshot of the scenario in time.
Figure 7: Nam Snapshot of Scenario1
We chose to initiate a connection from node 0 to node 9. Node 0 was offset from the group of
Nodes so that we could verify that the AODV protocol was actually routing in between the
nodes, and not connecting directly to node 9.

8 | P a g e
Figure 8 Number of background connections vs delay
Figure 8 shows the communication delay between node 0 and node 9 increases as the number
of background connections increase. This is largely because VANET uses cars as mobile nodes to
create mobile network. In this case, data from node 0 has to go through all the nodes between
source and destination, and eventually to node 9. The background traffic would delay the
communication between node 0 and node 9.
Figure 9 Number of background connections vs bytes
Figure 9 shows that the transmit bit rate decreases when the number of background
connections increase. This is largely due to the background communication between
intermediate nodes. The bandwidth has been consumed not only by node 0 and node 9, but
0
0.5
1
1.5
2
2.5
3
3.5
4
4.5
5
1 3 5 7
End
to
En
d D
elay
(in
sec
)
Number of Background Connections
Avg. E2E Delay vs. Background Traffic
0
5000
10000
15000
20000
25000
30000
1 3 5 7
Thro
ugh
pu
t (i
n B
ytes
/sec
)
Number of Background Connections
Throughput vs. Background Traffic
Avg. Tx Throughput
Avg. Packets dropped

9 | P a g e
also those intermediate nodes. The packets loss is very small because of TCP is used between
node 0 and 9.
5.2 Scenario 2: Varying Highway Inter Distances Wireless communication distance is an important performance metric with respect to wireless
communication. As the distance between cars varies we wanted to understand the effect that
the additional distance may have on throughput. Figure 10 shows a single test case where we
tested the performance where each car was placed 50m apart from each other.
Figure 10: Nam Display of 10 nodes interspersed distance of 50 m
We increased the inter vehicle distance from 10m to 50m between vehicles and measured the
average delay in between vehicles. The results of average delay vs distance and average
throughput vs distance were plotted in the Figure 11 and Figure 12.

10 | P a g e
Figure 11 Car to car distance vs End to end delay
Figure 11 shows the communication delay increases when the distance between node to node
increases. This is largely because the propagation delay increases when the distance between
source and destination increases.
Figure 12 Tx Throughput vs Car to car distance
In wireless network, bit/s/Hz/area unit is used to measure throughput. In this case, the car to
car distance increases results an increase in area. Hence, a decrement of transmit throughput is
observed.
0
0.5
1
1.5
2
2.5
3
10 20 30 40 50
Avg
. Del
ay (
in s
ec)
Car-to-Car Distance (in m)
Avg. Delay vs. Distance
AVG E2E Delay
0
10000
20000
30000
40000
50000
60000
0 10 20 30 40 50 60
Thro
ugh
pu
t in
(B
ytes
/Sec
)
Car-to-car Distance (in m)
Avg. Throughput vs. Car-to-Car Distance
Throughput Tx

11 | P a g e
5.3 Scenario 3: Sudden Four Way Stop Scenario 3 models a set of ten cars run into a four way stop at 40 km/h. In each of our
simulations we increased background traffic by adding in additional constant bit rate vehicle to
vehicle (V2V) connections. The number of V2V background connections varied from 1 to 6
connections. Figure 13 shows a snapshot of the scenario in time.
Figure 13 Nam snapshot of Scenario1
When the node 9 approaches node 8 which stays still, node 8 sends information to node 9 and
tells node 9 to prepare to stop.

12 | P a g e
Figure 14 Number of background connections vs End to end delay
Figure 14 shows the communication delay between node 9 and node 8 when the number of
background connections varied from 1 to 6. The average delay increases as the number of
background connections increase. This is because the bandwidth is been consumed by other
nodes. The delay analysis is very crucial to VANET system and the automated driving system in
the future.
6 Future Work Simulation of VANETs still have a long ways before we can quickly generate real world
scenarios. We envision that it would not be too long to implement a basic method by which a
designer could download a map from Open Street Maps and quickly utilize a vehicle traffic
generator to create more realistic vehicle movements.
NS2’s implementation of wireless connectivity is also a little naïve. One would essentially wish
to implement an enhancement to NS2’s model to broadcast to other nodes and connect to
each node as they move into physical ranges.
6.1 Simulation of Urban Mobility The Simulation of Urban Mobility (SUMO) tool allows for us to rapidly generate many different
real world topologies that can be imported into the network simulator. We implemented a
script that could take a map downloaded from Open Street Maps and generate a traffic flow
usable in NS2 which is included in the Appendix.
0
2
4
6
8
10
12
14
16
18
0 1 2 3 4 5
End
to
En
d D
elay
(in
sec
)
Number of Background Connections
E2E Delay vs. Background Traffic
Min delay
Average delay
Max delay

13 | P a g e
Below are some quick topologies that were generated to test SUMO’s ability to interface with
NS-2.
Figure 15 and Figure 16 show a vehicle traffic simulation being executed around at Simon Fraser
and University and Granville Street in British Columbia. Each simulation has 100 cars. The maps
were generated for SUMO by downloading maps from openstreetmap.org and the downloaded
maps were then imported into SUMO.
6.2 Distance based vehicle connection initiation Initially we tried to simulate nodes connecting to each other with the assumption that if a node
was out of range, it would try to connect when the node moved within range. Eventually after
research we found that NS2 has not implemented that functionality and the designer needs to
initiate the connection knowing where the cars are at all points in time.
Ideally we would like to see as cars move within range, a connection is initiated and constant
bit rate data begins to be exchanged. We sought to try and resolve this issue by creating a
python script that browses through a mobility file which tries to automate the process of
connection initiation. And the result of the script that we began to implement is shown in
Figure 17.
Figure 15: Traffic Simulation of SFU
Figure 16: Traffic Simulation Granville Street

14 | P a g e
Figure 17: Result of genTrafficInRange.py
Figure 17 shows the initial implementation. The radio distance was set to 30 m. Using a test
script we could see that as node_(6) moved within range of node_(4) we could output a script
to automatically have the two nodes to connect. Unfortunately we were getting mixed results
as some nodes that were already connected would later try to reconnect again which made
using this script for our project unrealizable. We included the work we accomplished in the
Appendix for future work.
7 Conclusion In this VANET performance and safety analysis, ns2 is used along with tracegraph to simulate
AODV routing protocol with realistic mobility model for VANET. Graphs are plotted using Excel
for evaluation. The performance is analyzed for up to 30 nodes with respect to various
parameters like car to car distance and number of background connections.
In the future, higher number of nodes can be simulated and analyzed. SUMO could be a
potential tool to generate realistic mobility files. It would be interesting to see how ADOV
performs when in high node density network.

15 | P a g e
8 References
[1] M. Vassiliadis, "Volvo Trucks," 11 March 2015. [Online]. Available:
http://www.volvotrucks.com/trucks/NewZealand-market/en-
nz/newsmedia/pressreleases/Pages/pressreleases.aspx?pubID=14543.
[2] V. Cabrera, F. J. Ros and P. M. Ruiz, "Simulation-Based Study of Common Issues in VANET
Routing Protocols," in Vehicular Technology Conference, Barcelona, 2009.
[3] T. Strang and M. Röckl, "STI Innsbruck," 12 April 2015. [Online]. Available: http://www.sti-
innsbruck.at/sites/default/files/courses/fileadmin/documents/vn-ws0809/11-VN-
WAVE.pdf.
[4] B. G. A. A. Meghna Chhabra1, "A Novel Solution to Handle DDOS Attack in MANET," Journal
of Information Security, vol. 4, p. 15, 2014.
[5] T. Issariyakul and E. Hossain, Introduction to Network Simulator 2, New York: Springer
Science+Business Media, LLC 2012, 2012.
[6] P. V. Estrela, "Pedro Vale Estrela - TraceGraph Help Page," 11 04 2015. [Online]. Available:
http://tagus.inesc-id.pt/~pestrela/ns2/tracegraph.html.
[7] Wiki, "Application layer," 5 Feb 2015. [Online]. Available:
http://en.wikipedia.org/wiki/Application_layer.
[8] S. Grafling, P. Mahonen and J. Riihijarvi, "Performance evaluation of IEEE 1609 WAVE and
IEEE 802.11p for vehicular communications," in Ubiquitous and Future Networks (ICUFN),
Jeju Island, 2010.
[9] S. M. Khan, "College of Engineering, Design and Physical Sciences," 2011. [Online].
Available: http://www.brunel.ac.uk/cedps/electronic-computer-engineering/research-
activities/wncc/student-profiles/shariq-mahmood-khan.
[10] "Information Sciences Institute," 2 April 2015. [Online]. Available:
www.isi.edu/nsnam/ns/tutorial/nsindex.html.

16 | P a g e
9 Appendix A
9.1 Top level script # simulation.tcl
#
# This script reads a mobility.tcl script and networkTraffic.tcl
# to generate node movement and traffic
# Author: Jeremy Borys
# Date: April 12, 2015
# Define options
set val(chan) Channel/WirelessChannel ;# channel type
set val(prop) Propagation/TwoRayGround ;# radio-propagation model
set val(netif) Phy/WirelessPhy ;# network interface type
set val(mac) Mac/802_11 ;# MAC type
set val(ifq) Queue/DropTail/PriQueue ;# interface queue type
set val(ll) LL ;# link layer type
set val(ant) Antenna/OmniAntenna ;# antenna model
set val(ifqlen) 500 ;# max packet in ifq
set val(nn) 10 ;# number of mobilenodes
set val(rp) AODV ;# routing protocol
set val(x) 1000 ;# X dimension of topography
set val(y) 20 ;# Y dimension of topography
set val(stop) 20 ;# time of simulation end
set val(sc) "mobility.tcl"
set val(cbr) "networkTraffic.tcl"
set ns_ [new Simulator]
set tracefd [open out1.tr w]
set windowVsTime2 [open windowvtime.tr w]
set namtrace [open simwrls.nam w]
set f0 [open fourwaytraffic.tr w]
set node_size 10
set spacing 50
set num_cars $val(nn)
# Record creates periodically records the bandwidth received by
# traffic sinc 0 and writes it to the three files f0
proc record {} {
global sink f0
set ns_ [Simulator instance]
# Set the next time to call the prcedure and collect the time and bw
set time 0.5
set bw0 [$sink set bytes_]
set now [$ns_ now]
# Save the bandwidth to a file and reset the counter and set up the next
# time to call record again
puts $f0 "$now [expr $bw0/$time*8/1000000]"

17 | P a g e
$sink set bytes_ 0
$ns_ at [expr $now+$time] "record"
}
# Printing the window size
proc plotWindow {tcpSource file} {
global ns_
set time 0.01
set now [$ns_ now]
set cwnd [$tcpSource set cwnd_]
puts $file "$now $cwnd"
$ns_ at [expr $now+$time] "plotWindow $tcpSource $file"
}
proc stop {} {
global ns_ tracefd namtrace f0
$ns_ flush-trace
close $tracefd
close $namtrace
close $f0
exec xgraph fourwaytraffic.tr -geometry 800x400 &
#Execute nam on the trace file
exec nam simwrls.nam &
exit 0
}
$ns_ trace-all $tracefd
$ns_ namtrace-all-wireless $namtrace $val(x) $val(y)
# Configure the MAC Protocol to use the 802.11p standard
source IEEE802-11p.tcl
# Initialize the Topography, god object and area
set topo [new Topography]
set god_ [create-god $val(nn)]
$topo load_flatgrid $val(x) $val(y)
# Create and configure all the nodes upto nn number of nodes
$ns_ node-config -adhocRouting $val(rp) \
-llType $val(ll) \
-macType $val(mac) \
-ifqType $val(ifq) \
-ifqLen $val(ifqlen) \
-antType $val(ant) \
-propType $val(prop) \
-phyType $val(netif) \
-channelType $val(chan) \
-topoInstance $topo \
-agentTrace ON \
-routerTrace ON \
-macTrace OFF \
-movementTrace ON

18 | P a g e
# set num_nodes [expr {$val(nn) * 2}]
for {set i 0} {$i < $val(nn) } { incr i } {
set node_($i) [$ns_ node]
}
# Define traffic model
puts "Loading mobility.tcl file..."
source $val(sc)
puts "Loading networkTraffic.tcl file..."
source $val(cbr)
#Start logging the received bandwidth
$ns_ at 0.0 "record"
$ns_ at 10.1 "plotWindow $tcp $windowVsTime2"
# Define node initial position in nam
for {set i 0} {$i < $val(nn)} { incr i } {
# 30 defines the node size for nam
$ns_ initial_node_pos $node_($i) 10
}
# Telling nodes when the simulation ends
for {set i 0} {$i < $val(nn) } { incr i } {
$ns_ at $val(stop) "$node_($i) reset";
}
# ending nam and the simulation
$ns_ at $val(stop) "$ns_ nam-end-wireless $val(stop)"
$ns_ at $val(stop) "stop"
$ns_ at $val(stop) "puts \"end simulation\" ; $ns_ halt"
#Call the finish procedure after 5 seconds of simulation time
$ns_ run
9.2 Mobility Script #
# mobility.tcl
#
# Author: Jeremy Borys
# Date: April 12, 2015
#
# set TOPO_Y $val(y)
# The starting origin for the cars along the highway
set ori_x 10.0
set ori_y [expr {$val(y)/2.0}]
set ori_z 0.0
# the final point that the cars move
set final_x 995.0
set final_y [expr {$val(y)/2.0}]
# the velocity of the cars along the highway in m/s
set velocity 30

19 | P a g e
set lane 0
set lanecnt 0
set xpos 0
for {set i 0} {$i < $num_cars} {incr i} {
if {[expr {$i % 10}] == 0} {
incr lane
set xpos 0
}
$node_($i) set X_ [expr {$ori_x + 50 + $xpos * $spacing}]
$node_($i) set Y_ [expr {$ori_y - $lane * 15}]
$node_($i) set Z_ $ori_z
incr xpos
}
$node_(0) set X_ 5
$node_(0) set Y_ [expr {$ori_y + 30}]
for {set i 0} {$i < $num_cars} {incr i} {
$ns_ at 0.0 "$node_($i) setdest $final_x $final_y $velocity"
}
9.3 Network Traffic script #
# networkTraffic.tcl
#
# Author: Jeremy Borys
# Date: April 12, 2015
set ns $ns_
$ns_ color 1 Blue
$ns_ color 1 Red
# generate the background traffic using a pre-generated script
source cbrconntest1.tcl
# Set a TCP connection between node_(0) and node_(1)
set tcp [new Agent/TCP/Newreno]
# $tcp set class_ 2
# $tcp set color 1 Blue
$tcp set rate_ 1200k
$tcp set packetSize_ 1024
set ftp [new Application/FTP]
$ftp attach-agent $tcp
$ns_ at 1.0 "$ftp start"
set sink [new Agent/TCPSink]
$ns_ attach-agent $node_(0) $tcp
$ns_ attach-agent $node_(9) $sink
$ns_ connect $tcp $sink

20 | P a g e
9.4 Constant Bitrate traffic #
# This script was autogenerated using ns cbrgen.tcl
# nodes: 9, max conn: 1, send rate: 0.01, seed: 1
#
#
# 1 connecting to 2 at time 0.28409320874330274
#
set udp_(0) [new Agent/UDP]
$ns_ attach-agent $node_(1) $udp_(0)
set null_(0) [new Agent/Null]
$ns_ attach-agent $node_(2) $null_(0)
set cbr_(0) [new Application/Traffic/CBR]
$cbr_(0) set packetSize_ 512
$cbr_(0) set interval_ 0.01
$cbr_(0) set random_ 1
$cbr_(0) set maxpkts_ 10000
$cbr_(0) attach-agent $udp_(0)
$ns_ connect $udp_(0) $null_(0)
$ns_ at 0.28409320874330274 "$cbr_(0) start"
9.5 OSM to NS2 mobility file generation
#!/bin/sh
#
# mobilityGen.sh
#
# Convert a map.osm to a mobility file for use with NS-2
#
# Author: Jeremy Borys
# Date: April 12, 2015
#
echo 'File to read:' $1
echo 'Number of Cars:' $2
# Extracting the file name from osm
fname=${1%.osm}
# Assuming that typemap.xml has been downloadded otherwise have to download
from internet
cp ../typemap.xml ./typemap.xml
SUMO_HOME=~/untarred_files/sumo-0.23.0
# create map from open street map, typemap.xml is located on SUMO's
documentation
netconvert --osm-files ./$1 -o ./$fname.net.xml
polyconvert --net-file ./$fname.net.xml --osm-files ./$1 --type-file
./typemap.xml -o $fname.poly.xml
# Generates random trips
python $SUMO_HOME/tools/trip/randomTrips.py -n $fname.net.xml -e $2 -l
python $SUMO_HOME/tools/trip/randomTrips.py -n $fname.net.xml -r
$fname.rou.xml -e $2 -l

21 | P a g e
# Create a sumocfg file to load with sumo
echo "<?xml version=\"1.0\" encoding=\"UTF-8\"?> \
\n \
<configuration xmlns:xsi=\"http://www.w3.org/2001/XMLSchema-instance\"
xsi:noNamespaceSchemaLocation=\"http://sumo.dlr.de/xsd/sumoConfiguration.xsd\
"> \
\n \
<input>\n \
<net-file value=\"$fname.net.xml\"/>\n \
<route-files value=\"$fname.rou.xml\"/>\n \
<additional-files value=\"$fname.poly.xml\"/>\n \
</input> \n \
\n \
<time>\n \
<begin value=\"0\"/>\n \
<end value=\"300\"/>\n \
<step-length value=\"0.1\"/>\n \
</time>\n \
\n \
</configuration>" > $fname.sumocfg
# As of sumo 2.23 location is not a valid xml variable and is commented out
sed -e 's/<location/<!--<location/' -e 's/no_defs\"\/>/no_defs\"\/>-->/'
$fname.poly.xml > tmp && mv tmp $fname.poly.xml
sumo -c $fname.sumocfg --fcd-output $fname.fcd.xml
python ~/untarred_files/sumo-0.23.0/tools/traceExporter.py -i $fname.fcd.xml
--ns2mobility-output=$fname.ns2mob
9.6 Generating a distance based solutions # genNetTrafficInRange.py
#
# This scrip will parse through a mobility file and determine
# when a node should connect to another node
#
# Author: Jeremy Borys
# Date: April 12, 2015
#
import re
import math
NODE = 0
FILE = 'testcase1'
RANGE = 30
# update_pos = re.compile('.*$node_([0-9]*) setdest ([0-9].*.[0-9].*) ([0-
9].*.[0-9].*)')
update_pos = re.compile('([0-9]*.[0-9]*) "(\$node_\([0-9]*\)) setdest ([0-
9]*.[0-9]*) ([0-9]*.[0-9]*)')
X, Y = 0, 1

22 | P a g e
pos = {}
class Car():
def __init__(self):
x = 0
y = 0
conn_map = {}
def main():
with open(FILE) as f:
mobility = f.readlines()
for line in mobility:
# read the line and find all important information
m = update_pos.search(line)
if not m:
continue
# store the current position of the node
pos.update({m.group(2): [float(m.group(3)), float(m.group(4))]})
# Maintain a connection map to determine which node is connected to
what
conn_map.update({m.group(2):{m.group(2):1}})
# if m.group(1) == '$node_(0)':
# print pos['$node_(0)']
# import pdb; pdb.set_trace()
# for a given node compare the position with other nodes
for node1, val1 in pos.items():
# print "comparing %s" % node1
# print "................"
for key2, val2 in pos.items():
# print "%s => %s" % (node1, key2)
if node1 == key2:
continue
# if (node1 == '$node_(4)' or key2 == '$node_(4)') and (node1
== '$node_(6)' or key2 == '$node_(6)'):
# import pdb; pdb.set_trace()
dist = math.sqrt((val1[0] - val2[0])**2 + (val1[1] -
val2[1])**2)
if dist < RANGE:
if conn_map[node1].get(key2, 0):
# print "Flipping from 0->1:",
conn_map[node1].get(key2, 0)
# print "%s already connected to %s" % (node1, key2)
continue

23 | P a g e
# import pdb; pdb.set_trace()
print "DIST: %f, %s will connect to %s" % (dist, node1,
key2)
conn_map[node1][key2] = 1
conn_map[key2][node1] = 1
elif dist > RANGE:
if conn_map[node1].get(key2, 0):
# pass
# import pdb; pdb.set_trace()
print "DIST: %f, %s is flipping from %s 1->0" %
(dist, node1, key2)
else: # not connected
pass
conn_map[node1][key2] = 0
conn_map[key2][node1] = 0
else:
print "should never go here"
# for line in mobility:
# if update_pos.search(line):
# curpos[X], curpos[Y] = update_pos.search(line)
# continue
# elif:
# else:
# print "Not found"
if __name__ == '__main__':
main()


![Introduction/Motivation - Simon Fraser Universityljilja/ENSC427/Spring15/Projects/team3/ENSC...[8] S. Grafling, P. Mahonen and J. Riihijarvi, "Performance evaluation of IEEE 1609 WAVE](https://img.dokumen.tips/doc/110x75/5f700439eee606489707ae55/introductionmotivation-simon-fraser-ljiljaensc427spring15projectsteam3ensc.jpg)


![ENSC427:CommunicationNetworks,Spring2012 ... › ~ljilja › ENSC427 › Spring12 › Projects › team12 › ENSC...References’! [1]A.Zaballos,G.Corral,I.Serra,J.Abella,"TestingNetworkSecurity%](https://img.dokumen.tips/doc/110x75/5f0ec6637e708231d440e03f/ensc427communicationnetworksspring2012-a-ljilja-a-ensc427-a-spring12.jpg)