Embed Size (px)
Citation preview

AFRL-RX-TY-TP-2010-0082
PERFORMANCE AND CHARACTERIZATION OF SHEAR TIES FOR USE IN INSULATED PRECAST CONCRETE SANDWICH WALL PANELS PREPRINT
Clay Naito and Mark Beacraft Lehigh University ATLSS Center 117 ATLSS Drive Bethlehem, PA 18015 John M. Hoemann Applied Research Associates P.O. Box 40128 Tyndall Air Force Base, FL 32403 Bryan T. Bewick Airbase Technologies Division 139 Barnes Drive, Suite 2 Tyndall Air Force Base, FL 32403-5323 Contract No. FA9003-08-D-8768-0002 November 2010
AIR FORCE RESEARCH LABORATORY MATERIALS AND MANUFACTURING DIRECTORATE
Air Force Materiel Command
United States Air Force Tyndall Air Force Base, FL 32403-5323
DISTRIBUTION A: Approved for public release; distribution unlimited.
Standard Form 298 (Rev. 8/98)
REPORT DOCUMENTATION PAGE
Prescribed by ANSI Std. Z39.18
Form Approved OMB No. 0704-0188
The public reporting burden for this collection of information is estimated to average 1 hour per response, including the time for reviewing instructions, searching existing data sources, gathering and maintaining the data needed, and completing and reviewing the collection of information. Send comments regarding this burden estimate or any other aspect of this collection of information, including suggestions for reducing the burden, to Department of Defense, Washington Headquarters Services, Directorate for Information Operations and Reports (0704-0188), 1215 Jefferson Davis Highway, Suite 1204, Arlington, VA 22202-4302. Respondents should be aware that notwithstanding any other provision of law, no person shall be subject to any penalty for failing to comply with a collection of information if it does not display a currently valid OMB control number. PLEASE DO NOT RETURN YOUR FORM TO THE ABOVE ADDRESS. 1. REPORT DATE (DD-MM-YYYY) 2. REPORT TYPE 3. DATES COVERED (From - To)
4. TITLE AND SUBTITLE 5a. CONTRACT NUMBER
5b. GRANT NUMBER
5c. PROGRAM ELEMENT NUMBER
5d. PROJECT NUMBER
5e. TASK NUMBER
5f. WORK UNIT NUMBER
6. AUTHOR(S)
7. PERFORMING ORGANIZATION NAME(S) AND ADDRESS(ES) 8. PERFORMING ORGANIZATION REPORT NUMBER
9. SPONSORING/MONITORING AGENCY NAME(S) AND ADDRESS(ES) 10. SPONSOR/MONITOR'S ACRONYM(S)
11. SPONSOR/MONITOR'S REPORT NUMBER(S)
12. DISTRIBUTION/AVAILABILITY STATEMENT
13. SUPPLEMENTARY NOTES
14. ABSTRACT
15. SUBJECT TERMS
16. SECURITY CLASSIFICATION OF: a. REPORT b. ABSTRACT c. THIS PAGE
17. LIMITATION OF ABSTRACT
18. NUMBER OF PAGES
19a. NAME OF RESPONSIBLE PERSON
19b. TELEPHONE NUMBER (Include area code)
08-NOV-2010 Journal Article PREPRINT 01-JAN-2009 -- 21-MAY-2010
Performance and Characterization of Shear Ties for Use in Insulated Precast Concrete Sandwich Wall Panels (PREPRINT)
FA8903-08-D-8768-0002
0909999F
GOVT
F0
QF101000
#Naito, Clay; **Hoemann, John M.; #Beacraft, Mark; *Bewick, Bryan T.
**Applied Research Associates, P.O. Box 40128, Tyndall Air Force Base, FL 32403 #Lehigh University ATLSS Center, 117 ATLSS Dr., Bethlehem, PA 18015
*Air Force Research Laboratory Materials and Manufacturing Directorate Airbase Technologies Division 139 Barnes Drive, Suite 2 Tyndall Air Force Base, FL 32403-5323
AFRL/RXQEM
AFRL-RX-TY-TP-2010-0082
Distribution Statement A: Approved for public release; distribution unlimited.
Ref AFRL/RXQ Public Affairs Case # 10-173. Document contains color images.
Insulated precast concrete sandwich wall panels are commonly used for exterior cladding on building structures. The insulation is sandwiched between exterior and interior concrete layers to reduce the heating and cooling costs for the structure. The panels can be designed as composite, partially composite, or non-composite. Shear ties are used to achieve these varying degrees of composite action between the interior and exterior concrete layers. A variety of shear ties are available for domestic construction. An experimental study was conducted to assess the relative strength and response of these commercially available ties. Fourteen shear ties were examined, the failure modes and responses were quantified, and simplified engineer level multi-linear strength curves were developed for each connection. The results indicate that shear ties used in sandwich wall panels have considerable variation in strength, stiffness, and deformability. The maximum shear strength of the discrete ties averaged 10.5 kN (2357 lb) with a minimum of 5.52 kN (1241 lb) and maximum of 18.4 kN (4138 lb). The ties exhibited elastic-brittle, elastic-plastic, plastic-hardening, and a variety of other responses. The results were used to develop tri-linear constitutive relationships, which were used to approximate the flexural response of sandwich wall panels.
sandwich panel; prestressed concrete; composite; test; constitutive model
U U U UU 21
Paul Sheppard
Reset

To be submitted to ASCE Structural Journal
Page 1
PERFORMANCE AND CHARACTERIZATION OF SHEAR TIES FOR USE IN 1
INSULATED PRECAST CONCRETE SANDWICH WALL PANELS 2
Clay Naito1, John Hoemann2, Mark Beacraft3, and Bryan Bewick4
ABSTRACT 4
3
Insulated precast concrete sandwich wall panels are commonly used for exterior cladding on building 5
structures. The insulation is sandwiched between exterior and interior concrete layers to reduce the 6
heating and cooling costs for the structure. The panels can be designed as composite, partially composite, 7
or non-composite. Shear ties are used to achieve these varying degrees of composite action between the 8
interior and exterior concrete layers. A variety of shear ties are available for domestic construction. An 9
experimental study was conducted to assess the relative strength and response of these commercially 10
available ties. Fourteen shear ties were examined, the failure modes and responses were quantified, and 11
simplified engineer level multi-linear strength curves were developed for each connection. The results 12
indicate that shear ties used in sandwich wall panels have considerable variation in strength, stiffness, and 13
deformability. The maximum shear strength of the discrete ties averaged 10.5 kN (2357 lb) with a 14
minimum of 5.52 kN (1241 lb) and maximum of 18.4 kN (4138 lb). The ties exhibited elastic–brittle, 15
elastic–plastic, plastic–hardening, and a variety of other responses. The results were used to develop tri-16
linear constitutive relationships, which were used to approximate the flexural response of sandwich wall 17
panels. 18
CE Database Subject Headings: Sandwich Panel, Prestressed Concrete, Composite, Test, Constitutive 19
Model 20
21
1 Associate Professor, Department of Civil and Env. Engrg., Lehigh University ATLSS Center, 117 ATLSS Dr., Bethlehem, PA 18015, USA, Email: [email protected], Phone: 610-758-3081, Fax: 610-758-5553. 2 Research Civil Engineer, U.S. Army Engineer Research & Development Center, 3909 Halls Ferry Road, CEERD-GS-V, Bldg 5001, Vicksburg, MS 39180-6199, USA (formerly Air Force Research Laboratory support contractor, Applied Research Associates, Inc., Tyndall AFB, FL, USA). 3 Graduate Student Researcher, Lehigh University ATLSS Center, 117 ATLSS Dr., Bethlehem, PA 18015, USA. 4 Research Civil Engineer, Air Force Research Laboratory, 139 Barnes Dr., Suite 2, Tyndall AFB, FL, 32403,
USA.

To be submitted to ASCE Structural Journal
Page 2
INTRODUCTION 1
In the precast concrete wall industry, a significant development thrust has been in “Green Building” and 2
acquiring “LEED (Leadership in Energy and Environmental Design) certification.” With these energy 3
efficiency requirements and guidelines, the industry has increasingly turned to encased insulation to 4
enhance the thermal performance of the building envelope while still maintaining construction speed. 5
The insulation is sandwiched between an exterior and interior concrete layer to limit damage of the 6
insulation and to ease construction. Shear ties are used to provide integrity between the interior and 7
exterior concrete sections, or wythes, as illustrated in Figure 1. The shear ties allow the panels to be lifted 8
and handled during building erection and allow the panels to behave as a composite against flexural 9
demands. Varying the type and arrangement of the shear ties controls the amount of composite action 10
between the two wythes. 11
12 Figure 1: Shear ties in sandwich wall panels 13
The flexural demands placed on sandwich panels produce internal compression, tension, and shear 14
stresses. To support these internal demands as a composite section, the sandwich panel must have 15
adequate tie reinforcement between the interior and exterior concrete wythes. This is accomplished by 16
the placement of shear ties or the use of solid concrete zones between wythes. Solid concrete zones 17
provide a substantial means of achieving force transfer. However, commercial industries are moving 18
away from these designs to reduce the bridging between wythes and increase overall thermal efficiency of 19
the sandwich wall panel. As illustrated in Figure 2, maintaining the flexural demands requires the transfer 20
of a shear force, through the ties, perpendicular to the direction of loading. The magnitude of the shear tie 21
demand is commonly computed using one of three techniques. Method 1 computes the shear demand 22
from the flexural capacity of the section. This method is recommended by the Precast/Prestressed 23
Concrete Institute (PCI 1997). Method 2 computes the shear demand assuming elastic response and 24

To be submitted to ASCE Structural Journal
Page 3
considering the first moment of the area above the shear tie. Since the derivation of this method is based 1
on the elastic response of the member, the accuracy is poor after cracking. Method 3 approximates the 2
shear tie demand from the transverse shear forces acting on the panel. This method is recommended by 3
ACI 318 (2008). 4
5 Figure 2: Shear flow force transfer 6
While Methods 2 and 3 can be used, in most cases the design of shear reinforcement for concrete 7
sandwich wall panels follows the practice of PCI (1997). The maximum horizontal shear force is 8
computed using the lesser of the compression or tension capacity of the section at midspan. The number 9
of ties needed to resist the shear force must be placed on each half of the wall spanning from midspan to 10
the support. To simplify the calculation, the assumption is made that the entire depth of the exterior 11
wythe is acting in compression. 12
The required shear capacity, Vrequired, can be computed as follows: 13
Vrequired = minimum (T, C) Equation 1 14
𝑇 = 𝑇𝑒𝑛𝑠𝑖𝑜𝑛 = 𝐴𝑝𝑠𝑓𝑝𝑠 + 𝐴𝑠𝑓𝑦 Equation 2 15
𝐶 = = 0.85𝑓𝑐′𝑏𝑡𝑐 Equation 3 16
where Aps is the area of prestressing steel in the tension wythe, As is the area of non-prestressed steel in 17
the tension wythe, fps is the stress in the prestressing steel at ultimate flexural strength, fy is the yield stress 18
of the non-prestressed steel, f ’c is the concrete compressive strength, b is the width of the wall, and tc is 19
the thickness of the compression wythe. 20
To achieve a fully composite panel response, the required number of shear ties, Nrequired, can then be 21
computed using the following formulation. 22
Nrequired > (Required Shear Capacity) / (Design Strength of a Single Shear Tie) Equation 4
For traditional panel design considerations, such as handling and wind, knowledge of the strength of the 23
shear tie is adequate. In the extreme event, where panels are expected to reach their ultimate load 24
capacity, both the strength and ductility capacity of the tie should be known. An example of an extreme 25
event is an accidental or intentional explosion. This is a standard design condition for military facilities 26
C
dL
V = min(C,T)b x dL
a) Sandwich panel with applied load b) Shear demandShear
Moment
Section
CompositeStress
Distribution
Non-Composite
StressDistribution
TV
b

To be submitted to ASCE Structural Journal
Page 4
located near weapon storage depots, critical government or military facilities where anti-terrorism 1
protection is a concern, or commercial facilities such as refineries or grain handling producers where gas 2
or dust cloud explosions could occur. For these types of applications, there is potential for the panel to be 3
loaded to and beyond its flexural capacity. To ensure safety to the occupants of the facility, the proper 4
response of the shear ties within the panel must be considered. Furthermore, all three methods used to 5
determine demand are based on the assumption that compatibility between the concrete wythes is 6
maintained. If a flexible shear tie is used, the relative shear deformation could be very large at the 7
required shear demand. Consequently, the design approach would no longer be valid. To accurately 8
assess the response of the panel system under ultimate loads, the load deformation of the tie system used 9
must be known. Commercially available shear ties were procured and experimentally evaluated. The 10
results are used to develop simplified response curves, which are used for modeling the flexural response 11
of wall panels. 12
SHEAR TIE SYSTEMS 13
Shear ties are available in a variety of materials and configurations. These include carbon steel, stainless 14
steel, galvanized carbon steel, carbon-fiber-reinforced polymer (CFRP), glass-fiber-reinforced polymer 15
(GFRP), and basalt-fiber-reinforced polymer (BFRP). The various materials are chosen for their cost and 16
thermal or corrosion resistance benefits. Steel ties are commonly used when thermal and corrosion 17
resistance is not a concern. These ties are available at the lowest cost. When corrosion resistance is 18
needed, stainless steel or galvanized steel can be used at a premium. Steel, unfortunately, has a high 19
thermal conductivity which results in lower insulation properties for the walls. When high thermal 20
requirements are specified and corrosion is a risk, GFRP, CFRP, or BFRP can be used. 21
Shear ties are produced as trusses, pins, rods, and grids. The variation in shear tie configurations results 22
in a broad range of deformation ability. For example, an FRP truss tie produces a stiff brittle response, 23
whereas a thin steel rod results in a flexible response with large ductility. As a consequence, the flexural 24
performance of a wall panel can vary significantly based on the tie used. To accurately predict the 25
ultimate response of a sandwich panel subject to an increasing lateral pressure, the response of the shear 26
ties must be well defined. The shear capacity of the ties can be determined either by analytical modeling 27
of the mechanical and geometric properties of the tie or through experimental validation. Due to the 28
variety of ties and their proprietary design, the flexibility and strength is not directly examined through 29
modeling. Instead, a consistent experimental approach is used in this study to quantify and compare the 30
effectiveness of shear ties. 31

To be submitted to ASCE Structural Journal
Page 5
EXPERIMENTAL PROGRAM 1
Direct shear experiments were conducted on ties commercially available in the United States. The 2
research program includes both thermally efficient polymer-based connections and traditional steel 3
connections. The polymer connections include: (A) GFRP Delta Tie produced by Dayton Superior, (B) 4
THERMOMASS® composite GFRP pins, (C) THERMOMASS® non-composite GFRP pins, (D) Altus 5
Group CFRP Grid, (E) Universal Building Products GFRP Teplo Tie, and (F) Universal Building Products 6
Basalt FRP RockBar. Traditional steel connections include (G) a galvanized steel C-clip, (H-1) 7
galvanized steel C-clip, (H-2) stainless steel C-Clip, (I) galvanized steel M-Clip, (J) welded wire truss by 8
Meadow Burke, (K) galvanized welded wire truss by Dayton, and (L) galvanized welded wire ladder by 9
Dayton. Ties D, J, K, and L are distributed ties and are placed over the length of the panel. All other ties 10
are designed to be discretely placed in the wall panel to achieve the desired capacity. The overall test 11
matrix is summarized in Table 1. The dimensions of the fourteen ties are summarized in Figure 3. 12
Table 1: Shear Tie Matrix (Note: 1 in. = 25.4 mm) ID Company Tie Type Material Size A Dayton Delta Tie GFRP Grid Standard B THERMOMASS Composite Tie GFRP Pin CC 150-50-50-50 C Non-Composite Tie GFRP Pin MC 20/50
D-11 Altus Group C-Grid w/ EPS CFRP Grid C50 – 1.8 X 1.6 D-2 C-Grid w/ XPS CFRP Grid C50 – 1.8 X 1.6 E Universal Building
Products TeploTie GFRP Tie 10 mm dia. x 150 mm
F RockBar Basalt FRP Bar 7 in. x 5/16 in. G TSA Manufacturing C-Clip Galvanized Steel 5 in. x 1.5 in. wide
H-12 Dayton Superior
C-Clip Galvanized Steel 4 in. x 1.5 in. H-23 C-Clip Stainless Steel 4 in. x 1.5 in.
I M-Clip Galvanized Steel 0.25 in. dia. – 6 in. tall J Meadow Burke Welded Wire Girder 1008 Steel 0.25 in. dia. wire K Dayton Superior Single Wythe Truss Hot Dipped Galvanized Steel See Figure 3 L Single Wythe Ladur Hot Dipped Galvanized Steel See Figure 3
1 Two tests conducted, 2 One test conducted, 3 Four tests conducted

To be submitted to ASCE Structural Journal
Page 6
1 Figure 3: Measured shear tie dimensions (1 in. = 25.4 mm) 2
Experimental Setup 3
An experimental fixture was developed to evaluate the shear response of ties (Figure 4). The testing 4
configuration contains two ties, each of the dimensions described in Table 1, to minimize eccentricity and 5
secondary demands on the connection during evaluation. An alternate fixture specified in ASTM E488 6
Strength of Anchors in Concrete and Masonry Elements (2003) has been used for evaluation of ties. The 7
method illustrated in ASTM E488 consists of a single tie with a shear load applied directly to the tie. This 8
configuration produces prying forces directly on the shear tie that are not representative of the demands 9
on shear ties in sandwich panels. The fixture illustrated in Figure 4 integrates the insulation foam and 10
applies load to the tie through the concrete. This load transfer method more accurately replicates the 11
demands acting on sandwich wall ties under large flexural demands and was used for the research 12
program. 13
Three tests were conducted for each shear tie type unless noted. Each tie was loaded to failure under a 14
monotonically increasing displacement demand. This demand is used to replicate the conditions that 15
would occur on ties located in a sandwich wall panel under a uniform pressure load. Rate effects were 16
not considered in this study. The relation between uniform pressure and blast-generated loads is further 17
discussed in Biggs (1964). Blast pressure demands on walls are characterized by a high-intensity 18
dynamic load that exponentially decays over a short duration (typically less than 100 msec). As a 19
consequence, the predominant flexural response of the panel occurs during either the initial inbound or 20
rebound response of the wall. Similarly, the shear ties are subject to the greatest demand during the initial 21
1'-4"
1'-2"
D
31 2"
9 gage (3.7mm)1.6
" 1.8"
A B C E F
G
K L
5 516"
71 2"
112"
6"
38"
6"
38"
6"
7"
516"
H
5"
11 2" 3"
1 4" 4"
2"11 2"
6"
4"
2"
1"
14"
I31516"315
16"
51 4"
1 4"
J
6"
5mm top & bottom
9 gage (3.7mm)16in. o.c.
5mm top & bottom
6"
8"1'-4"
1'-4"

To be submitted to ASCE Structural Journal
Page 7
inbound or rebound response and subsequently are loaded to a lesser degree as the panel undergoes free 1
vibration response. Consequently, the cyclic response or elastic recovery was not examined in this study. 2
3 Figure 4: Shear tie testing configuration 4
The experiments were conducted with a universal test machine under displacement control. The 5
specimens were examined at quasi-static loading rates. Higher rates of loading similar to those of blast 6
were not conducted in this study. Higher rate loading would result in an increase in capacity due to the 7
dynamic strength increase for the materials used. The quasi-static data presented can be used as a 8
conservative estimate of tie strength. A displacement rate of 12.7 mm (0.50 in.) per minute was used in 9
specimens A through F. Samples G through L were loaded at 6.4 mm (0.25 in.) per minute. Load was 10
measured in line with the machine piston. The shear tie strengths in Table 2 and Table 3 are the force per 11
shear tie (half of the load cell reading). The distributed ties are further divided based on the length tested. 12
For these ties, the strength per shear tie length is presented. The displacement was measured directly on 13
the specimen using a LVDT illustrated in Figure 4. 14
Test Specimen 15
All ties were tested in a standardized specimen configuration. The shear tie specimens use 50 mm (2 in.) 16
of insulation, which is commonly used in sandwich wall construction. The insulation consists of extruded 17
polystyrene (XPS, a.k.a. blue or pink board) in all cases but D1. Expanded Polystyrene (EPS, a.k.a. bead 18
board) is commonly used for the C-grid shear tie (D1) to enhance the shear effectiveness of the panel 19
assembly. For completeness, the C-grid connection is evaluated with both XPS and EPS insulation. 20
A standard embedment is used on each shear tie. To fit the ties within the concrete specimen, 7.6 cm (3 21
in.) exterior concrete layers and a 12.7-cm (5-in.) interior concrete layer were used. The specimen details 22
are illustrated in Figure 5. 23
The specimens were cast from concrete with a specified minimum compressive strength of 27.6 MPa (4 24

To be submitted to ASCE Structural Journal
Page 8
ksi). The strength of each specimen was determined in accordance with ASTM C39 (2005). The samples 1
were fabricated by TCA and PCI contractors who utilize site cast and plant cast concrete. The measured 2
concrete strength varied from 27.6 MPa (4 ksi) to 68.9 MPa (10 ksi) and are summarized along with the 3
shear capacities in Table 2 and Table 3. 4
5 Figure 5: Shear specimen configuration (1 in. = 25.4 mm) 6
EXPERIMENTAL RESULTS 7
A summary of the measured responses of each experiment is presented in this section. The concrete 8
compressive strength at the time of testing, f ’c, the peak shear strength, corresponding displacement, 9
energy absorbed at the peak load, the average strength, and the coefficient of variation on the strength are 10
presented in Table 2 for discrete ties and Table 3 for distributed ties. The strength measured and energy 11
absorbed represents the performance of one shear tie. The characteristic response of each shear tie was 12
determined by averaging the force values at each displacement level for the group of connection results as 13
illustrated in Figure 6. In general the results did not vary considerably within each group. Due to the 14
averaging method used the peak force of the characteristic curves presented in Figure 7 are less than the 15
peak force listed in Table 2 and Table 3 Further information on each test can be found in Naito, et al. 16
(2009). 17

To be submitted to ASCE Structural Journal
Page 9
1 Figure 6: Typical determination of average response (1 in. = 25.4mm) 2
Table 2: Summary results discrete ties (Note: 1 in. = 25.4 mm, 1 lb = 4.45 N)
ID Tie Type f ’c
(psi)
Per Shear Tie Peak Shear
Strength (lb)
Corresponding Displacement
(in.)
Energy Absorbed at 0.2 in. (lb-in.)
Energy Absorbed
at peak (lb-in.)
Average Shear
Strength (lb)
COV
A1 GFRP Truss
6680 2632 0.070 340 107 2017 6.6% A2 6872 2424 0.115 399 220
A3 7039 2672 0.014 340 30 B1 GFRP
Composite Pin
6680 2748 0.325 346 677 1905 3.8% B2 6894 2634 0.340 417 774
B3 7039 2770 0.387 341 819 C1
GFRP Non-Comp. Pin
6680 1119 1.030 104 748 1703 6.7% C2 6894 1088 1.034 58 669
C3 7039 907 0.919 56 494 E1
GFRP Pin 6706 595 0.608 44 258
1924 6.2% E2 6894 825 0.650 76 408 E3 7019 759 1.084 100 698 F1
BFRP Bar 6706 2233 0.556 198 803
2523 20.8% F2 6894 1435 0.415 172 406 F3 7039 1247 0.857 178 917 G1
Galvanized C-Clip
6706 3831 1.519 99 2775 3407 24.3% G2 6894 2452 0.661 228 1067
G3 7039 3938 1.408 156 3000
H11 Galvanized C-Clip 4056 808 1.014 164 373 NA NA
H21
Stainless C-Clip
4056 944 0.942 114 434 1241 22.8% H22 4056 1085 0.665 135 441
H23 4056 1356 0.673 193 456 H24 5110 1579 0.629 164 616 NA NA
0
1000
2000
3000
4000
5000
6000
0 0.25 0.5 0.75 1
Shea
r For
ce [l
bs]
Shear Displacement [in.]
J1J2J3Average

To be submitted to ASCE Structural Journal
Page 10
Table 2: Summary results discrete ties (Note: 1 in. = 25.4 mm, 1 lb = 4.45 N)
ID Tie Type f ’c
(psi)
Per Shear Tie Peak Shear
Strength (lb)
Corresponding Displacement
(in.)
Energy Absorbed at 0.2 in. (lb-in.)
Energy Absorbed
at peak (lb-in.)
Average Shear
Strength (lb)
COV
I1 M type
4056 4781 1.292 173 3503 4138 18.8% I2 4056 3276 1.366 168 1320
I3 4056 4358 1.763 192 4236 1
Table 3: Summary results distributed ties (Note: 1 in. = 25.4 mm, 1 lb = 4.45N)
ID Tie Type f ’c
(psi)
Per Unit Length of Shear Tie Peak Shear
Strength (lb/in.)
Corresponding Displacement
(in.)
Energy Absorbed at
0.2 in. ((lb/in.)-in.)
Energy Absorbed at
peak ((lb/in.)-in.)
Average Shear
Strength (lb/in.)
COV
D11 CFRP Truss (EPS)
10357 240 0.054 38 11 233 NA
D21 10357 225 0.066 31 12 D12
CFRP Truss (XPS)
10357 205 0.007 32 1 192 21.1% D22 10357 225 0.009 36 1
D32 10357 147 0.433 14 47 J1
Truss Girder 5110 289 0.039 52 10
330 13.1% J2 5110 375 0.066 57 13 J3 5110 325 0.020 58 6 K1
Wire Truss 4056 128 0.472 19 37
128 0.4% K2 4056 129 0.429 19 35 K3 4056 128 0.447 21 34 L1
Ladder Truss 4056 99 1.155 4 59
98 16.0% L2 4056 113 0.868 8 59 L3 4056 82 0.710 5 34
Discussion of Results 2
As described in Table 2 and illustrated in Figure 7, shear ties used in sandwich wall panels have a 3
considerable variation in strength, stiffness, and deformability. The average shear strength of the discrete 4
ties is 10.5 kN (2,360 lb) with a minimum average of 5.5 kN (1,240 lb) and maximum average of 18.4 kN 5
(4,138 lb). The maximum average shear response of the distributed ties is 34.0 kN/m (194 lb/in.) with a 6
minimum average of 17.2 kN/m (98 lb/in.) and maximum of 57.8 kN/m (330 lb/in.). The ties exhibited 7
elastic–brittle, elastic–plastic, plastic–hardening, and a variety of other responses. 8
The variation in shear–deformation response is directly related to the variability in shear tie design. The 9
FRP truss type connections (A and D) exhibited an elastic–brittle response because the shear behavior is 10
dominated by FRP in tension. The steel wire truss (K) exhibited an elastic–plastic behavior because the 11

To be submitted to ASCE Structural Journal
Page 11
shear behavior is dominated by steel in tension. The steel M-clip (I) and the C-clip with adequate 1
embedment (G) exhibited an elastic–plastic behavior at low shear deformations as the leg of the 2
connection is subject to dowel action. As the deformation increased, the shear tie legs changed to a 3
tension mode, resulting in the observed increase in strength. A similar behavior was observed in the steel 4
ladder connection (L). However, the forces are lower due to a smaller wire diameter. Post-yield 5
hardening did not occur in the standard C-clip details (H) due to the lack of embedment. Post test 6
inspection revealed that these connections failed due to pullout from the concrete. The FRP non-7
composite pins (C and E) exhibited an elastic–plastic response with minor hardening. These connections 8
failed by combined flexure–tension demands at the concrete interface. The composite FRP pin (B) 9
produced an elastic–plastic response with moderate deformation capacity. The failure mode of these 10
connections was dominated by laminar fracture of the shear tie and a combined flexure–tension mode at 11
the concrete interface. Use of EPS over XPS (compare D1 to D2) was shown to increase the shear 12
strength of the shear tie. The shear strength was influenced by the foam type used. This occurred due to 13
the greater roughness provided by EPS over that of XPS. 14
15 a) Discrete ties b) Distributed ties 16
Figure 7: Shear-deformation performance (1 in. = 25.4 mm, 1 lb = 4.45 N) 17
Approximate Shear Response of Ties 18
To model the response of the ties, a simplified multi-linear curve was developed for each shear tie. The 19
backbone curve was based on the average response computed for each shear tie type. The ranges of 20
response are divided into three regions: (1) elastic, (2) plastic, and (3) unloading. The elastic branch is 21
defined by the secant to 75% of the ultimate load, Vmax. The yield displacement, Δy, is defined at the 22
intercept of the ultimate load and the elastic curve. The ultimate displacement, Δu, is taken at the point 23
when the strength decreases by 50% of the ultimate. The elastic stiffness, K, is tabulated along with the 24
displacement at the ultimate load, Δm. A schematic of the tri-linear curve development is illustrated in 25
Figure 8. The measured properties from the tie tests are summarized in Figure 9 and Table 4. These 26
0
1000
2000
3000
4000
5000
0 0.2 0.4 0.6 0.8 1 1.2 1.4 1.6
Shea
r For
ce [l
bs]
Shear Displacement [in.]
A B C E F G H1 H2 I
F
B
CH1
E
G
H2
I
A
0
100
200
300
400
0 0.2 0.4 0.6 0.8 1 1.2 1.4 1.6
Shea
r For
ce [l
bs/in
.]
Shear Displacement [in.]
D1 D2 J K L
L
D2D1
K
J

To be submitted to ASCE Structural Journal
Page 12
backbone curves can be used to model the shear response of ties. 1
2 Figure 8: Backbone development 3
4
Force
Displacement
Vmax
0.75Vmax
0.50Vmax
∆y ∆u∆m
K
BackboneMeasured
∆e
To be submitted to ASCE Structural Journal
Page 13
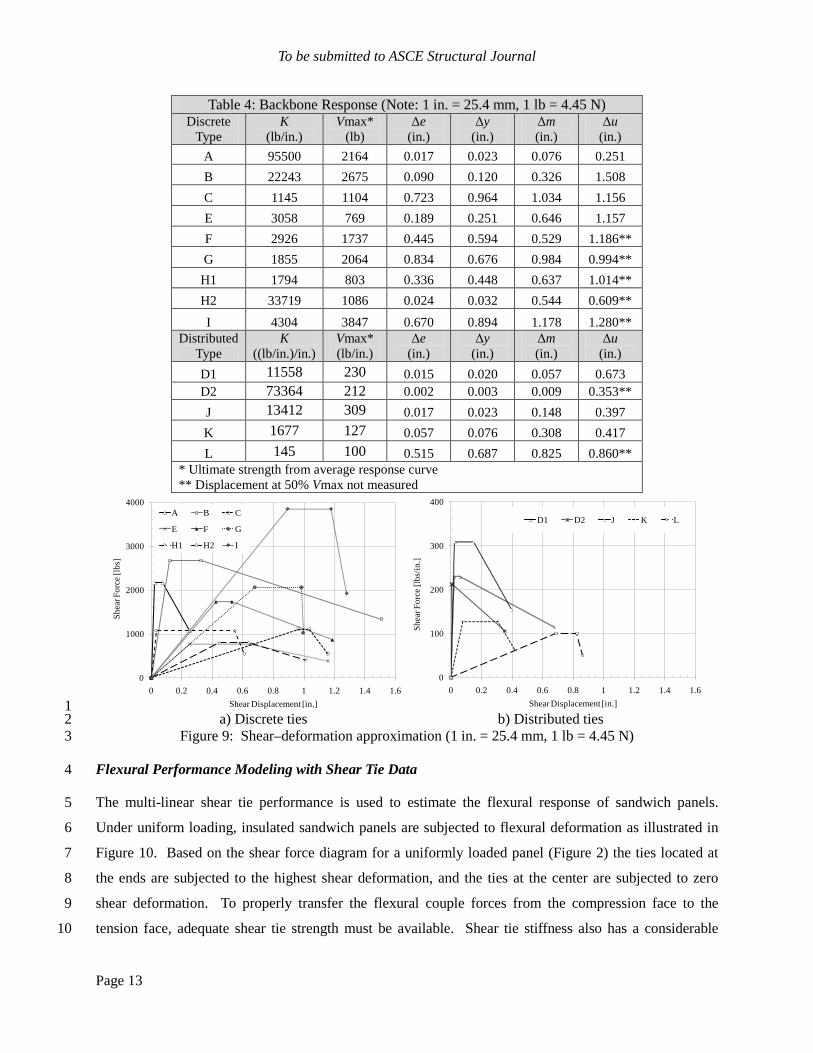
Table 4: Backbone Response (Note: 1 in. = 25.4 mm, 1 lb = 4.45 N) Discrete
Type K
(lb/in.) Vmax*
(lb) Δe
(in.) Δy
(in.) Δm (in.)
Δu (in.)
A 95500 2164 0.017 0.023 0.076 0.251 B 22243 2675 0.090 0.120 0.326 1.508 C 1145 1104 0.723 0.964 1.034 1.156 E 3058 769 0.189 0.251 0.646 1.157 F 2926 1737 0.445 0.594 0.529 1.186** G 1855 2064 0.834 0.676 0.984 0.994**
H1 1794 803 0.336 0.448 0.637 1.014** H2 33719 1086 0.024 0.032 0.544 0.609** I 4304 3847 0.670 0.894 1.178 1.280**
Distributed Type
K ((lb/in.)/in.)
Vmax* (lb/in.)
Δe (in.)
Δy (in.)
Δm (in.)
Δu (in.)
D1 11558 230 0.015 0.020 0.057 0.673 D2 73364 212 0.002 0.003 0.009 0.353** J 13412 309 0.017 0.023 0.148 0.397 K 1677 127 0.057 0.076 0.308 0.417 L 145 100 0.515 0.687 0.825 0.860**
* Ultimate strength from average response curve ** Displacement at 50% Vmax not measured
1 a) Discrete ties b) Distributed ties 2
Figure 9: Shear–deformation approximation (1 in. = 25.4 mm, 1 lb = 4.45 N) 3
Flexural Performance Modeling with Shear Tie Data 4
The multi-linear shear tie performance is used to estimate the flexural response of sandwich panels. 5
Under uniform loading, insulated sandwich panels are subjected to flexural deformation as illustrated in 6
Figure 10. Based on the shear force diagram for a uniformly loaded panel (Figure 2) the ties located at 7
the ends are subjected to the highest shear deformation, and the ties at the center are subjected to zero 8
shear deformation. To properly transfer the flexural couple forces from the compression face to the 9
tension face, adequate shear tie strength must be available. Shear tie stiffness also has a considerable 10
0
1000
2000
3000
4000
0 0.2 0.4 0.6 0.8 1 1.2 1.4 1.6
Shea
r For
ce [l
bs]
Shear Displacement [in.]
A B C
E F G
H1 H2 I
0
100
200
300
400
0 0.2 0.4 0.6 0.8 1 1.2 1.4 1.6
Shea
r For
ce [l
bs/in
.]
Shear Displacement [in.]
D1 D2 J K L

To be submitted to ASCE Structural Journal
Page 14
influence on the panel performance. If the tie has adequate shear strength but is very flexible, 1
compatibility will not be maintained. For this scenario, the exterior and interior wythes will resist flexure 2
independently as two stacked plates. 3
The stiffness and failure mode of the shear tie can influence the ultimate flexural capacity of a sandwich 4
panel. In a related study (Naito, Beacraft, & Hoemann, 2010), a series of sandwich wall panels were 5
subjected to a monotonically increasing uniform load until failure occurred. The loading tree used to 6
simulate uniform pressure on a sandwich panel and two of the panel sections tested are presented in 7
Figure 10. The flexural response of the panel and the relative shear slip of the interior and exterior wythes 8
were measured as illustrated in Figure 10. 9
Figure 10: Uniform load evaluation of sandwich wall panels 10
The shear response of the ties influenced the shear failure modes of the panels. As an example, the results 11
of three experiments are presented in Figure 11. The results include the applied pressure and midspan 12
deflection for three panels with the same flexural design. The type of tie was varied between the panels. 13
Panel PCS4 consisted of a flexible tie, panel PCS5 consisted of a moderately stiff tie, and PCS6 consisted 14
of a stiff tie as illustrated in Figure 11 (right). The variation in types of ties resulted in a variation in the 15
amount of relative slip measured between the wythes and a change in the ultimate capacity of the panels. 16
As illustrated, the shear–deformation behavior is sensitive to the type of tie used. Between cracking and 17
ultimate capacity, the use of a relatively stiff tie increases the strength of the panel. The type of shear tie 18
used can significantly change the available strain energy of the wall panel. 19
6" (3.5" C-Grid)1'-8"
PCS 2
3"
2"3"
8" 1'-4" 8"
2'-8"
11 2"5"
11 2"
3/8" Ø Strands@ 16.1 kips
3/8" Ø Strands@ 16.1 kips
16 x 10 W2.1 x W3.0
EPS Insulation (1#)
C-Grid
3"
2"3"
8" 1'-4" 8"
2'-8"
11 2"5"
11 2"
3/8" Ø Strands@ 16.1 kips
3/8" Ø Strands@ 16.1 kips
8"
16 x 10 W2.1 x W3.0
EPS Insulation
0.25in. Dia. C-Clip @ 12in.
PCS 1
To be submitted to ASCE Structural Journal
Page 15
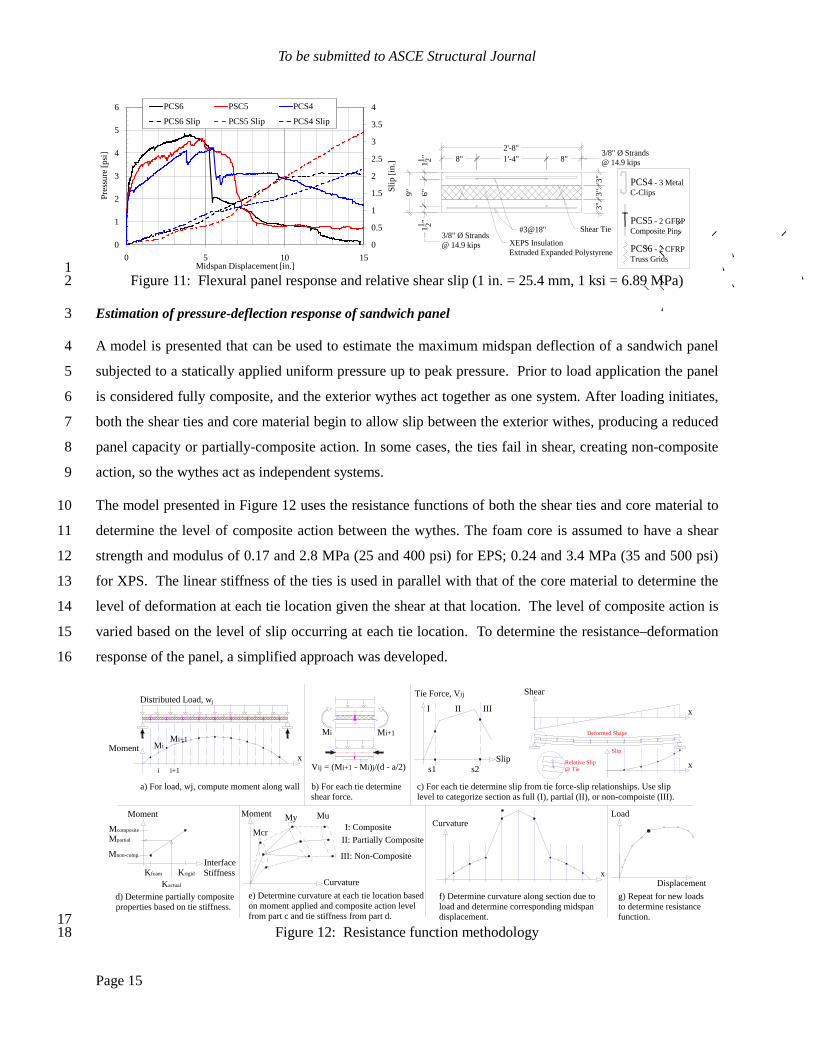
1 Figure 11: Flexural panel response and relative shear slip (1 in. = 25.4 mm, 1 ksi = 6.89 MPa) 2
Estimation of pressure-deflection response of sandwich panel 3
A model is presented that can be used to estimate the maximum midspan deflection of a sandwich panel 4
subjected to a statically applied uniform pressure up to peak pressure. Prior to load application the panel 5
is considered fully composite, and the exterior wythes act together as one system. After loading initiates, 6
both the shear ties and core material begin to allow slip between the exterior withes, producing a reduced 7
panel capacity or partially-composite action. In some cases, the ties fail in shear, creating non-composite 8
action, so the wythes act as independent systems. 9
The model presented in Figure 12 uses the resistance functions of both the shear ties and core material to 10
determine the level of composite action between the wythes. The foam core is assumed to have a shear 11
strength and modulus of 0.17 and 2.8 MPa (25 and 400 psi) for EPS; 0.24 and 3.4 MPa (35 and 500 psi) 12
for XPS. The linear stiffness of the ties is used in parallel with that of the core material to determine the 13
level of deformation at each tie location given the shear at that location. The level of composite action is 14
varied based on the level of slip occurring at each tie location. To determine the resistance–deformation 15
response of the panel, a simplified approach was developed. 16
17 Figure 12: Resistance function methodology 18
0
0.5
1
1.5
2
2.5
3
3.5
4
0
1
2
3
4
5
6
0 5 10 15
Slip
[in.
]
Pres
sure
[psi
]
Midspan Displacement [in.]
PCS6 PSC5 PCS4
PCS6 Slip PCS5 Slip PCS4 Slip
PCS4 - 3 MetalC-Clips
PCS5 - 2 GFRPComposite Pins
PCS6 - 2 CFRPTruss Grids
3"3"
3"
8" 1'-4" 8"2'-8"
11 2"6"
11 2"
3/8" Ø Strands@ 14.9 kips
3/8" Ø Strands@ 14.9 kips
9"
#3@18"XEPS InsulationExtruded Expanded Polystyrene
Shear Tie
MiMi+1
Mi Mi+1
Vij = (Mi+1 - Mi)j/(d - a/2)i i+1
Tie Force, Vij
Slips1 s2
I: Composite
III: Non-Composite
II: Partially Composite
I II III
Moment
Curvature
Curvature
a) For load, wj, compute moment along wall b) For each tie determineshear force.
c) For each tie determine slip from tie force-slip relationships. Use sliplevel to categorize section as full (I), partial (II), or non-compoiste (III).
e) Determine curvature at each tie location basedon moment applied and composite action levelfrom part c and tie stiffness from part d.
f) Determine curvature along section due toload and determine corresponding midspandisplacement.
Load
Displacementg) Repeat for new loadsto determine resistancefunction.
Momentx
Distributed Load, wj
x
Moment
InterfaceStiffnessKfoam Krigid
d) Determine partially compositeproperties based on tie stiffness.
Mcomposite
Mnon-comp.
Kactual
MpartialMcr
My Mu
Shear
x
x
Slip
Deformed Shape
Relative Slip@ Tie

To be submitted to ASCE Structural Journal
Page 16
In Figure 12a, an applied pressure, wj, is applied and moment demand, M, is determined along the length 1
of the panel. In Figure 12b, the horizontal shear demand, Vij, at each tie location, i, for each pressure step, 2
j, is estimated with the following equation. 3
𝑉𝑖𝑗 =(𝑀𝑖+1 − 𝑀𝑖)𝑗
𝑑 − 𝑎2
Equation 5
where Mi+1 and Mi are the internal moments the ends of the current panel division, d is the depth to tensile 4
reinforcement, and a is the depth of the rectangular stress block. For the panels tested, a is 1.27 cm (0.5 5
in.) on average, measured from the exterior face. 6
The shear demand at each tie, Vij, is used along with the appropriate tie response from Figure 9 and core 7
material response to determine the shear slip at each tie, sij. This slip is compared to two limits, s1 and s2, 8
deduced from experimental results shown in Figure 9. If the slip is less than s1, the section is considered to 9
be fully composite. If it is greater than s2, the section is assumed to be non-composite. If the slip is 10
between s1 and s2, the panel is partially composite. The fully–partially composite slip limit, s1, was 11
chosen to be point of maximum shear force, taken as the midpoint between Δy and Δm in Figure 8. The 12
partially–non-composite slip limit, s2, is chosen to be 1.2 s1. Beyond this limit, the ties are no longer at 13
ultimate strength capacity. 14
Given the level of composite action, the curvature, φij, at each panel division for each pressure step can be 15
calculated. A standard section analysis was performed to determine both the fully and non-composite 16
moment–curvature responses. A tri-linear relationship was developed for both responses using cracking, 17
yield, and ultimate moments, calculated using standard ACI or PCI equations (depending on the type of 18
reinforcement). These are shown as dashed lines in Figure 12e. 19
The partially composite moment–curvature response is determined relative to the stiffness provided by 20
the tie and foam. A panel with foam only is assumed to be fully non-composite, while a panel containing 21
foam and the most-rigid tie tested (D2) is assumed to be fully composite. The partially composite 22
moment resistance of the panel at cracking, yield, and ultimate can be determined in accordance with the 23
relationship shown in Figure 12d. From experimental observations, the partially-composite cracking 24
moment best approximates the actual cracking moment of the panel. Therefore, the cracking moments for 25
all three responses are set equal to that of the partially-composite response. The complete moment–26
curvature response of the panel according to level of composite action is shown in Figure 12e as solid 27
lines. 28
With the relationships developed, the curvature for a given moment demand at a section can be 29
determined based on the level of slip and the appropriate moment–curvature relationship. The midspan 30

To be submitted to ASCE Structural Journal
Page 17
deflection for each applied pressure step j, Δj, is calculated using the following virtual work equation. 1
∆𝑗=𝐿𝑖
× 𝛷𝑗 × 𝑚𝑣 Equation 6
where L = panel length, Φj = curvature matrix for applied pressure step j, and mv = virtual moment matrix 2
for all tie locations. This form of the virtual work equation considers Φj and mv the average curvatures 3
and virtual moments over i segments of length L/i. Each Δj and corresponding pressure represents one 4
point in Figure 12g. 5
Figure 14 shows the estimation model for one panel, experimentally tested and presented in a previous 6
paper (Naito, Beacraft, & Hoemann, 2010). The moment–curvature information for the fully and non-7
composite panels is entered into the model as well as basic dimensions and quantities. The shear–8
deformation response of the shear tie is also entered from tests previously performed. This panel, PCS1, 9
has a relatively very flexible steel C-clip (Figure 10). The low stiffness of this tie causes the partially-10
composite moment–curvature to be nearly the same as the non-composite response as shown in Figure 13. 11
Also shown in Figure 14 are the modeled fully and non-composite responses for PCS1. The methodology, 12
sensitive to tie type, provides a good approximation of the measured flexural response. 13
Figure 13. Moment-curvature of PCS1 (1 in. = 25.4 mm, 1 kip-in. = 0.113 kN-m)
Figure 14. Model validation (1 in. = 25.4 mm, 1 ksi = 6.89 MPa)
DISCUSSION AND CONCLUSIONS 14
An experimental program was conducted to examine the shear–deformation relationship of shear tie 15
connections used for insulated precast concrete sandwich wall panels. The strengths of tie connections 16
were measured and averaged, and simplified shear–deformation relationships were developed. The 17
results of the study indicate that the shear performance of ties vary considerably. Average strength varies 18
from 5.5 to 18.4 kN (1241 to 4138 lb) for discrete ties and from 17.2 to 57.8 kN/m (98 to 330 lb/in.) for 19

To be submitted to ASCE Structural Journal
Page 18
distributed ties. The tie stiffness was found to be sensitive to the configuration of the tie geometry. Stiff 1
truss type ties provided greater initial stiffness than pin type ties that work in a flexural mode. The shear 2
strength was improved by 21% by the use of EPS insulation over XPS insulation when used in 3
conjunction with a CFRP truss shear tie. This was attributed to the greater surface roughness of EPS. 4
Simplified tie resistance functions were developed based on the measured performance of the ties and 5
were used to provide an estimate of tie slip–strength response. The tie models were used with a 6
prediction procedure to develop an accurate estimate of the flexural response of insulated sandwich wall 7
panels with different tie types. The use of this model indicates that the post-cracking stiffness of 8
sandwich panels is sensitive to the type of shear tie used. Flexible ties result in lower post-cracking 9
flexural stiffness. In all cases, however, the ultimate strength of the panel is not significantly altered. 10
It is important to note that the relative shear strengths alone should not be used as a measure for choosing 11
a shear tie type. For panels designed as non-composite sections, the tension capacities of the ties are 12
considered more crucial. Typically, the only planned occurrence for structural composite action in the life 13
of a non-composite panel is during the construction phase, when the panels require both concrete layers to 14
act together during the lifting phase. For non-composite panels, the interior concrete layer is usually 15
designed to resist the in-place loads imparted to the structure. The shear strength, tension strength, 16
stiffness, thermal conductivity, installation effort required, and cost of the tie should all be considered 17
when determining which shear tie to use. 18
ACKNOWLEDGEMENTS 19
The authors would like to thank the Air Force Research Laboratory (Dr. Robert Dinan and Dr. Michael 20
Hammons, Program Manager) for funding this work under contracts FA4918-07-D-0001 and FA8903-08-21
D-8768. The experiments were performed at the Air Force Research Laboratory located at Tyndall AFB, 22
FL, and at the University of Missouri – Columbia under Professor Hani Salim. The work was conducted 23
under a Cooperative Research and Development Agreement (CRADA) between the Portland Cement 24
Association, the Prestressed/Precast Concrete Institute, and the Tilt-Up Concrete Association. The 25
authors would like to thank John Sullivan, Jason Krohn, Michael Sugrue, and the member companies of 26
these organizations for technical and fabrication support of the research. The authors would like to thank 27
the Geotechnical and Structures Laboratory for the US Army Corps of Engineers for efforts in revising 28
this document. Citation of manufacturers’ or trade names does not constitute an official endorsement or 29
approval of the use thereof. The U.S. Government is authorized to reproduce and distribute reprints for 30
Government purposes notwithstanding any copyright notation hereon. 31

To be submitted to ASCE Structural Journal
Page 19
REFERENCES 1
1. ACI Committee 318. Building Code Requirements for Structural Concrete and Commentary. 2
American Concrete Institute. Farmington Hills, MI. 2008. www.concrete.org. 3
2. ASTM Standard C39. “Standard Test Method for Compressive Strength of Cylindrical Concrete 4
Specimens.” ASTM International. West Conshohocken, PA. 2005. DOI: 10.1520 / C0039_C0039M-5
05, www.astm.org. 6
3. ASTM Standard E488. “Standard Test Methods for Strength of Anchors in Concrete and Masonry 7
Elements." ASTM International. West Conshohocken, PA. 2003. DOI: 10.1520/E0488-96R03, 8
www.astm.org. 9
4. ASTM Standard C578, “Standard Specification for Rigid, Cellular Polystyrene Insulation.” ASTM 10
International. West Conshohocken, PA. 2009. DOI: 10.1520/C0578-09E01, www.astm.org. 11
5. Biggs, J.M. Introduction to Structural Dynamics. McGraw–Hill. New York, NY. 1964. 12
6. Naito, C., Hoemann, J., Bewick, B., and Hammons, M. “Evaluation of Shear Tie Connectors For Use 13
In Insulated Concrete Sandwich Panels.” Air Force Research Laboratory Report, AFRL-RX-TY-TR-14
2009-4600. December 2009. 15
7. Naito, C., Beacraft, M., Hoemann, J. “Design Limits for Precast Concrete Sandwich Walls Subjected 16
to External Explosions,” 2010 ASCE Structures Congress, Paper 711, Orlando, FL. May 2010. 17
8. PCI Sandwich Wall Committee. State-of-the-Art of Precast/Prestressed Sandwich Wall Panels. 18
Journal of the Precast/Prestressed Concrete Institute, 42 (2), 1–60. 1997. 19
9. Tilt-Up Concrete Association. Tilt-Up Construction and Engineering Manual (6th ed.). Mount 20
Vernon, IA, USA: TCA. 2006. 21
22