Embed Size (px)
DESCRIPTION
Performance Analysis of the Draft 2015 CLRP Amendment
Citation preview
2015 CLRP Performance Analysis 1
PERFORMANCE ANALYSISof The Draft 2015 CLRP
Presentation to the Transportation Planning BoardSeptember 16, 2015
Item 9

2015 CLRP Performance Analysis 2
What is the Long-Range Transportation Plan (CLRP)?
The CLRP identifies regionally significant transportation projects and programs that are planned between now and 2040• Over500Projectsareincludedfromsimplehighwaylandscapingprojectstobillion-dollarhighway
andtransitprojects(includes7%morelanemilesofroadway,and14%moremilesoftransitrail)• Fullfundingtokeeptheregion’shighwayandtransitsystemsinastateofgoodrepair• ProgramsthataimtomakethetransportationsysteminMetropolitanWashingtonbetterandmore
efficient
Some specific projects in the CLRP include:• Metro’sSilverLine-PhaseII(inVA)• ThePurpleLineandtheCorridorCitiesTransitway(inMD)• TheH.St./BenningRd.Streetcar(inDC)• Approx.1,200newlane-milesofroadwayincluding
ExpressTolllanesonI-95inVA
• 20stand-aloneimprovedmajorhighwayinterchanges
For a complete listing of projects and programs in
the CLRP, visit:http://www.mwcog.org/clrp/

2015 CLRP Performance Analysis 3
What is in the 2015 Amendment to the CLRP?
Key Technical Inputs to the 2015 CLRP Performance Analysis:• Round8.4CooperativeForecasts• “RegionallySignificant”TransportationProjects• Version2.3.57oftheTravelDemandModel• 2014VehicleRegistrationData(VIN)• EPA’sMOVES2014MobileEmissionsModel(WithTier3andupdatedCAFE)
Changes in the 2015 Amendment include:• Apackageof10lanereductionprojectsforbicyclelanesinDC• US1BRTfromHuntingtonMetrotoWoodbridgeinVA• ExpressTolllanesandbusserviceonI-66insideI-495inVA• ExpressTolllanesandbusserviceonI-66outsideofI-495toUS15inVA
• RemovaloftheDCStreetcar:MinnesotaAve.SpurinDC• RemovaloftheColumbiaPikeStreetcarprojectinVA• RemovaloftheCrystalCityStreetcarprojectinVA
*VDOTsubmitted2alternatives(AlternativeAandB)fortheI-66HOTlanesprojectsoutsideofthebeltway.TheperformanceanalysisonlyincludesAlternativeB.
2015 CLRP Performance Analysis 4
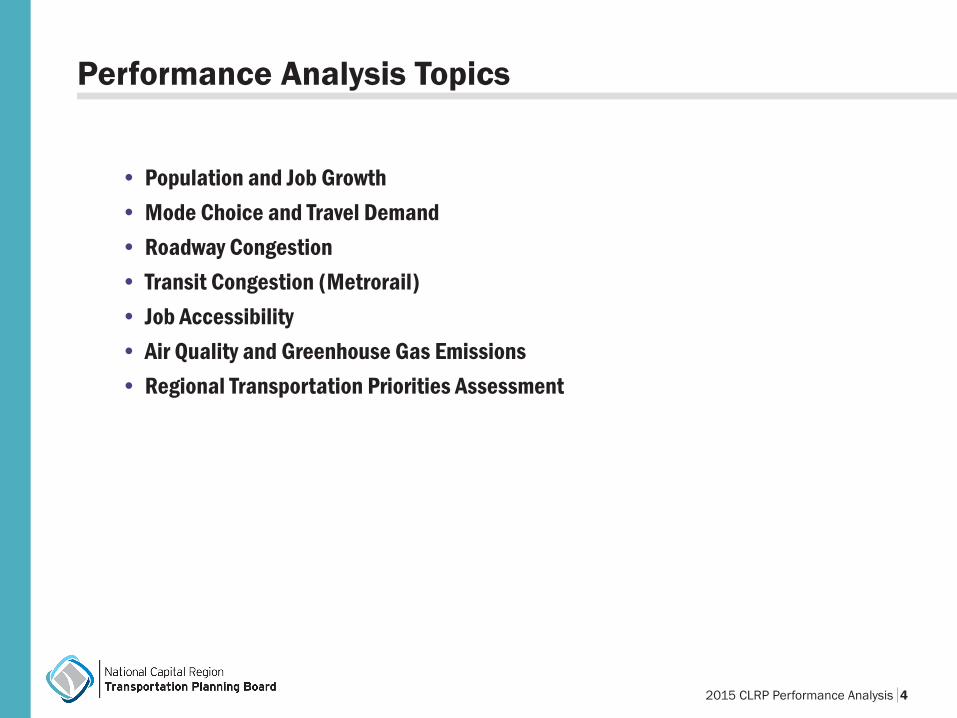
Performance Analysis Topics
• Population and Job Growth• Mode Choice and Travel Demand• Roadway Congestion • Transit Congestion (Metrorail)• Job Accessibility • Air Quality and Greenhouse Gas Emissions• Regional Transportation Priorities Assessment


2015 CLRP Performance Analysis 7
50%
14%
41%
25%2000
3000
Population(in 1000s)
4000
5000
1000
Jobs(in 1000s)
3000
4000
Outside of ACs
Inside of ACs
Outside of ACs
Inside of ACs
InsideCenters
Outside of Centers
Population1,289,000 New People
59%41%
Jobs
76%24%
2015 2040
Inside Centers
Outside of Centers
1,156,000 New Jobs
1000
5000
2015 2040
2000
Population and Job Growth in Activity Centers
• The majority of new jobs and population are forecast to be in Regional Activity Centers. • Though the majority of the regional population will remain outside of Activity Centers in 2040,
population is forecast to increase at a faster rate inside Activity Centers over the next 25 years. • The majority of jobs today are located in Activity Centers, and this trend will continue in the
future.
*Population and job estimates come from the COG Round 8.4 Cooperative Forecast

2015 CLRP Performance Analysis 8
$79B
Population
Employment
All Trips
Vehicle Miles Travelled(VMT)
Lane Miles of Roadway
VMT per capita
Congested Lane Miles(AM Peak)
+24%
+36%
+22%
+23%
+7%
-2%
+72%
Transit Rail Miles(Metro, MARC/VRE, Light Rail) +14%
Transit Trips +34%
Expected changes in Land Use and Regional Travel2015-2040
0% 60%20% 40% % Change
VMT on Congested Roads(AM Peak) +70%
Bicycle and Walk Trips +49%
• The region is forecast to be home to 24% more residents and 36% more jobs in 2040. To accommodate growth, 7% more lane miles of roadway and 14% more transit rail miles are planned to be constructed.
• The total number of trips taken is expected to increase by 23%, while transit, walk, and bike trips together are expected to increase at a faster rate than single driver trips.
• The overall amount of driving (VMT) is expected to grow by 22%. This is slightly less than forecast population growth, which means that VMT per capita is expected to drop by 2%.
• The increase in demand on the roadways is forecast to out-pace the increase in supply, leading to a significantincreaseincongestion.
2015 Performance Analysis Summary

2015 CLRP Performance Analysis 9
Mode Choice: Growth in Trips by Mode (2015-2040)
Growth in carpooling, transit, walking, and bicycling is expected to out pace growth in single occupancy driver trips, for all trips and work trips alike.
15%
8,1697,134
30%
2015 204020152040
Daily Travel - Growth in Single Driver Trips vs. All Other Modes
(trips in 1000s)
Single Driver All Other Modes12,875
9,913
18%
2,5472,159
39%2015 204020152040
Commute Travel - Growth in Single Driver Trips vs. All Other Modes
(trips in 1000s)
Single Driver All Other Modes
1,9011,365
Commute Travel - Growth in Trips by Mode(2015-2040)
389,000
159,000
274,000
Walk+Bicycle
Transit
HOV+Carpool
Single Driver
more trips 104,000 +72% From
2015
more trips
more trips
more trips
+33% From 2015
+40% From 2015
+18% From 2015 1,035,000
1,620,000
396,000
more trips 946,000 +49% From
2015
more trips
more trips
more trips
+34% From 2015
+24% From 2015
+15% From 2015
Daily Travel - Growth in Trips by Mode(2015-2040)
Walk+Bicycle
Transit
HOV+Carpool
Single Driver
WORKTRIPSALLTRIPS
New Trips - All Purposes New Trips - Work
2015 CLRP Performance Analysis 10
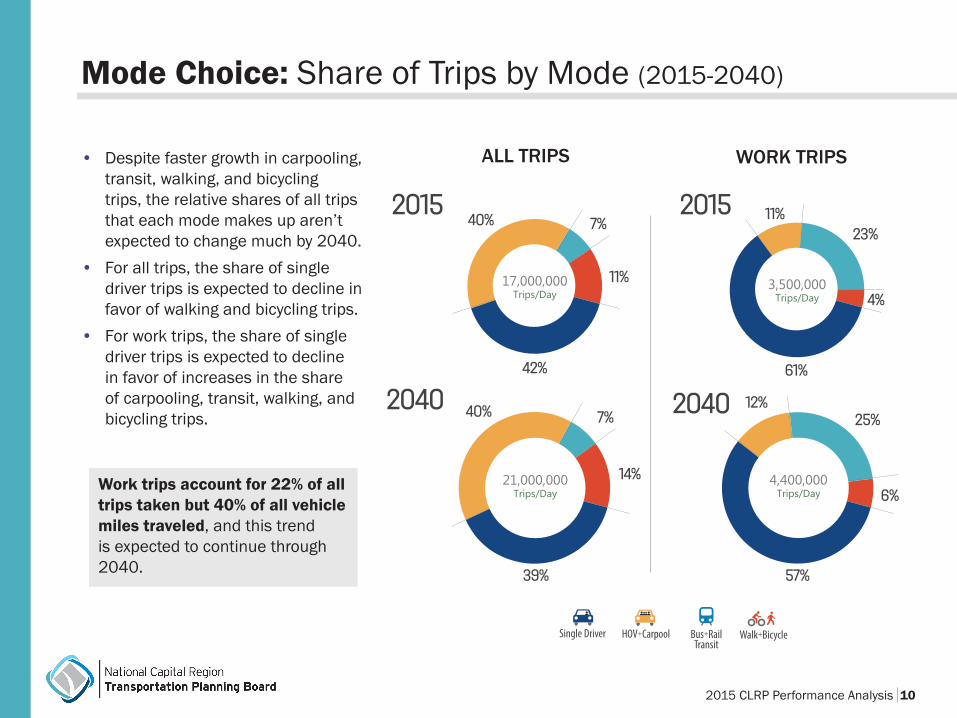
Mode Choice: Share of Trips by Mode (2015-2040)
201523%
4%
11%
3,500,000Trips/Day
2040
4,400,000Trips/Day
57%
25%12%
6%
61%
20157%
11%
40%
17,000,000Trips/Day
2040
21,000,000Trips/Day
39%
7%40%
14%
42%
WORKTRIPSALLTRIPS• Despite faster growth in carpooling, transit, walking, and bicycling trips, the relative shares of all trips that each mode makes up aren’t expected to change much by 2040.
• For all trips, the share of single driver trips is expected to decline in favor of walking and bicycling trips.
• For work trips, the share of single driver trips is expected to decline in favor of increases in the share of carpooling, transit, walking, and bicycling trips.
Walk+Bicycle Bus+Rail Transit
HOV+Carpool Single Driver
Work trips account for 22% of all trips taken but 40% of all vehicle miles traveled, and this trend is expected to continue through 2040.

2015 CLRP Performance Analysis 11
Mode Choice: Transit Constraint (2015-2040)
5000 1000 trips in1000’s
1,134
Number of Transit Work Trips in 2040Constrained vs. Unconstrained
1,099
2040 ConstrainedTransit Trips
2040 UnconstrainedTransit Trips
+35,000Additional
Trips
• In the travel demand model used to analyze future trends under the 2015 CLRP, Metrorail trips through the core of the region were capped to 2020 levels. Therefore, in 2040 approximately 125,000 trips that would have been expected on Metrorail have been reassigned to buses and automobiles.
• If the transit constraint is removed, 35,000 of the automobile trips could be taken on Metrorail, which would increase transit mode share by 0.8%.

2015 CLRP Performance Analysis 12
Commute Travel - Mode Share By Regional Core, Inner Suburbs, and Outer Suburbs(2015-2040)
23%64% 11%
3%
24%61% 11% 4%
1%
14%
6%
79%
8%17%73%
RegionalCore
InnerSuburbs
OuterSuburbs
2015
2040
2015
2040
2015
2040
5%54% 18%23%
5% 14%
24% 56%
Total: 617
Total: 1,755
Total: 2,140
Total: 694
Total: 972
Total: 795
2%
5000 20001000 1500 trips in1000’s
• Throughout all areas of the region, the share of single occupancy vehicle commute trips is expected to decline between now and 2040.
• For commuters living in the Regional Core, walking and biking are forecast to become more popular. • The greatest number of trips will continue to be made by those living in the region’s populous Inner Suburbs.
• In the Outer Suburbs, carpool and transit trips will increase due to the presence of new facilities and services.
Mode Choice: Geographic DifferencesWork Trips By Regional Core, Inner Suburbs, and Outer Suburbs (2015-2040)
Walk+Bicycle Bus+Rail Transit
HOV+Carpool Single Driver
Regional Core: District of ColumbiaArlington Co.Alexandria
Inner Suburbs: Montgomery Co.Prince George’s Co.Fairfax Co.Falls ChurchFairfax City
Outer Suburbs: Charles Co. Frederick Co. Loudoun Co. Prince William Co.ManassasManassas ParkFauquier Co. (Urbanized Area)

2015 CLRP Performance Analysis 13
Mode Choice: Geographic DifferencesDaily Travel - Mode Share
By Regional Core, Inner Suburbs, and Outer Suburbs(2015-2040)
6%42% 42% 10%
7%39% 42% 12%
7%
43%
1%
49%
8%45%46%
RegionalCore
InnerSuburbs
OuterSuburbs
2015
2040
2015
2040
2015
2040
25% 18% 32%25%
26% 26%30% 18%
Total: 2,980
Total: 9,272
Total: 10,999
Total: 3,756
Total: 5,111
Total: 3,693
2%2000 80004000 6000 trips in
1000’s10,000 12,000
All Trips By Regional Core, Inner Suburbs, and Outer Suburbs (2015-2040)
Walk+Bicycle Bus+Rail Transit
HOV+Carpool Single Driver
• The majority of all trips in the region will continue to be generated in the region’s populous Inner Suburbs. • Throughout all areas of the region, the share of single occupancy vehicle commute trips is expected to
decline and the share of walking and bicycling trips is expected to increase. • Compared to work trips, the share of carpool trips will continue to be substantially higher in all areas.• While the percentage of daily transit trips is forecast to double by 2040, this mode will still account for the
smallest number of trips in the outer suburbs.
Regional Core: District of ColumbiaArlington Co.Alexandria
Inner Suburbs: Montgomery Co.Prince George’s Co.Fairfax Co.Falls ChurchFairfax City
Outer Suburbs: Charles Co. Frederick Co. Loudoun Co. Prince william Co.ManassasManassas ParkFauquier Co. (Urbanized Area)
2015 CLRP Performance Analysis 14
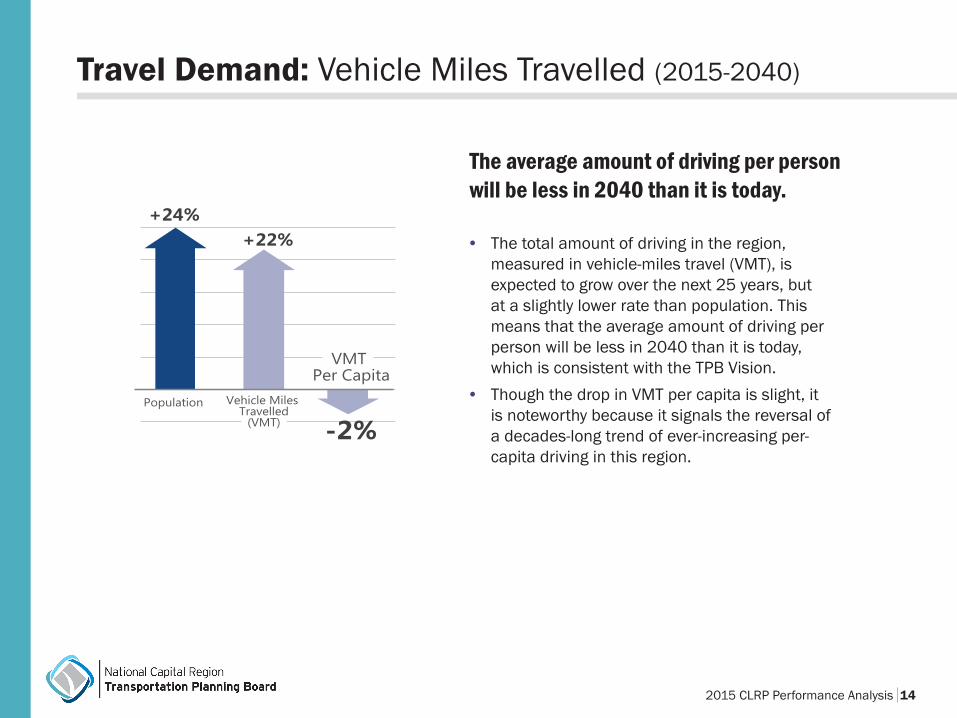
Changes in Population and Vehicle Miles Travelled (VMT)
2015-2040
Population
+24%+22%
-2%Vehicle Miles
Travelled(VMT)
VMT Per Capita
• The total amount of driving in the region, measured in vehicle-miles travel (VMT), is expected to grow over the next 25 years, but at a slightly lower rate than population. This means that the average amount of driving per person will be less in 2040 than it is today, which is consistent with the TPB Vision.
• Though the drop in VMT per capita is slight, it is noteworthy because it signals the reversal of a decades-long trend of ever-increasing per-capita driving in this region.
The average amount of driving per person will be less in 2040 than it is today.
Travel Demand: Vehicle Miles Travelled (2015-2040)

2015 CLRP Performance Analysis 15
Roadway Congestion
2,966
1,728
72%
Congested Lane Miles in The RegionAM Peak
20402015
10% 16%
17,000Total
Lane mi
18,000Total
Lane mi
Share of Lane Miles Congested(AM Peak)
2040201524% 33%
9.3MillionVMT
11.4MillionVMT
Share of VMT on Congested Roadways(AM Peak)
20402015
• Although the number of lane-miles of roadway in the region that are congested during peak periods is expected to increase substantially between now and 2040, congested lanes make up a small portion of the roadways in the region.
• Congestion on this small portion of roadways will affect a greater share of vehicle-miles traveled (VMT) as more and more trips are added to these highly traveled routes.
Congestion will continue to be concentrated in a few key segments of our region’s roadways, but impact a greater share of travelers and trips.
* Lane mile measure includes all facilities except local roads.* Roads are congested if Volume/Capacity>1.00
3,748
2,119
70%
VMT on Congested RoadwaysAM Peak
20402015 (VMT in 1,000s)

2015 CLRP Performance Analysis 16
RegionalCore
InnerSuburbs
OuterSuburbs
2,267
100002000 80004000 6000LanesMiles
2040
12% 2015
18%
2040
2015
2040
2015
15% of lane miles congested
21%
5%
12%
2,300
9,000
2,300
9,700
5,700
6,100
* Lane mile measure includes all facilities except local roads in both directions.
* Roads are congested if Volume/Capacity>1.00
Share of AM Peak Hour Lane Miles that Are Congested
Roadway Congestion: Geographic Differences
• Congested lane miles will make up a relatively small proportion of the total lane miles in all areas of the region both today and in 2040.
• The total number of congested lane miles is forecast to go up in all 3 sub-areas with the greatest expected increase in the inner suburbs.
• The share of lane miles that are congested is also expected to increase in all sub-areas, but the highest rate of increase is expected in the outer suburbs.
Regional Core: District of ColumbiaArlington Co.Alexandria
Inner Suburbs: Montgomery Co.Prince George’s Co.Fairfax Co.Falls ChurchFairfax City
Outer Suburbs: Charles Co. Frederick Co. Loudoun Co. Prince William Co.ManassasManassas ParkFauquier Co. (Urbanized Area)

2015 CLRP Performance Analysis 17
RegionalCore
InnerSuburbs
OuterSuburbs
2040
26% 2015
34%
2040
2015
2040
2015
29% of vehicle miles travelled that are congested
37%
16%
29%
Share of AM Peak Hour Vehicle Miles Travelled (VMT) on Congested Roadways
1,269
5,724
1,128
6,700
2,486
3,331
50001000 40002000 3000Vehicle Miles Travelled (VMT)in 1000s
6000 7000
* AM peak period VMT converted to AM peak hour
* Roads are congested if Volume/Capacity>1.00
• Though a relatively small share of lane miles will continue to be congested, a higher share of Vehicle Miles Traveled (VMT) will be on congested roadways in all areas of the region.
• In 2040, VMT on congested roadways will increase the most in the outer suburbs, followed by the regional core, and the least in the inner suburbs.
Roadway Congestion: Geographic Differences
Regional Core: District of ColumbiaArlington Co.Alexandria
Inner Suburbs: Montgomery Co.Prince George’s Co.Fairfax Co.Falls ChurchFairfax City
Outer Suburbs: Charles Co. Frederick Co. Loudoun Co. Prince William Co.ManassasManassas ParkFauquier Co. (Urbanized Area)

2015 CLRP Performance Analysis 18
Increased CongestionI-70 East toward Frederick
Reduced CongestionI-70 East at I-270
Reduced CongestionVA-267 East
Increased CongestionVA-267 East
Increased CongestionI-66 East in Prince William County
Increased CongestionI-495 Inner and outer loops b/n the American Legion bridge and I-270
Increased CongestionI-495/I-95 South (inner loop) at the Wilson Bridge
Increased CongestionI-95 North Prince William County
Increased CongestionDC-295 South Beltway to I-395
66395
495
295
95
95
270
70
495
9566
695
370
200
295
MARYLANDMARYLAND
VIRGINIAVIRGINIA
DCDC
Frederick County
Frederick County
Prince WilliamCounty
Prince WilliamCounty
Prince George’sCounty
Prince George’sCounty
CharlesCountyCharlesCounty
Loudoun County
Loudoun County
FairfaxCountyFairfaxCounty
Montgomery County
Montgomery County
ArlingtonCounty
Arlington County
No Congestion
Congested Flow
Stop and Go Conditions
Congestion Levels
Though congestion on many segments of the region’s major highway system is expected to get worse over this period of time, some segments of highway will see slight relief in congestion thanks to capacity expansions or changes in travel behavior. Major highways seeing improvements in congestion include portions of I-66 East, I-70 East, and VA-267 East.
Roadway Congestion: 2040 Major Highway Congestion (AM Peak)

2015 CLRP Performance Analysis 19
Transit Congestion: Metrorail Crowding (2012-2040)
Red
Blue
Orange/Silver
Yellow
Green
Line 2015 2040 with
50% 8-car*2040 with
100% 8-car
Extremely Crowded(>120 people per car)
Crowded(100-120 people per car)
Acceptable(<100 people per car)
MetroRail Congestion AM rush hour
*The 2015 CLRP assumes 50% 8-car trains in 2040
• AnalysiscompletedbyWMATAshowsthatfouroutoffivelinesenteringthedowntown core are expected to become congested or highly congested by 2040.
• Without additional capacity, WMATA estimates that the Metrorail system will reach capacity by 2040 on trips to and through the core.
Without additional capacity, four out of five Metrorail lines passing through the region’s core will be congested or highly congested by 2040.

2015 CLRP Performance Analysis 20
Access to Jobs: Average Number of Jobs Accessible (2015-2040)
2015: 2040:
Average number of Jobs Accessible
2015 2040
918 939(in 1000s)
2%
50
1
29
50
301
1
29
340
40
29
50
15
15
301
66395
495
295
95
95
270
70
495
9566
695
370
MARYLANDMARYLAND
VIRGINIAVIRGINIA
DCDC
Frederick County
Frederick County
Prince WilliamCounty
Prince WilliamCounty
Prince George’sCounty
Prince George’sCounty
CharlesCountyCharlesCounty
Loudoun County
Loudoun County
FairfaxCountyFairfaxCounty
Montgomery County
Montgomery County
ArlingtonCounty
Arlington County
5 10 200Miles N
Signi�cant Loss <-300,000
Moderate Loss -300,000 to -100,000
Minimal Impact -100,000 to 100,000
Moderate Gain 100,000 to 300,000
Signi�cant Gain > 300,000
Change in # of Jobs within 45 Minutes
2015: 2040:
Average number of Jobs Accessible
2015 2040
398 543
(in 1000s)
36%
50
1
29
50
301
1
29
340
40
29
50
15
15
301
66395
495
295
95
95
270
70
495
9566
695
370
MARYLANDMARYLAND
VIRGINIAVIRGINIA
DCDC
Frederick County
Frederick County
Prince WilliamCounty
Prince WilliamCounty
Prince George’sCounty
Prince George’sCounty
CharlesCountyCharlesCounty
Loudoun County
Loudoun County
FairfaxCountyFairfaxCounty
Montgomery County
Montgomery County
ArlingtonCounty
Arlington County
5 10 200Miles N
Signi�cant Loss <-300,000
Moderate Loss -300,000 to -100,000
Minimal Impact -100,000 to 100,000
Moderate Gain 100,000 to 300,000
Signi�cant Gain > 300,000
Change in # of Jobs within 45 Minutes
AverageNumberofJobsAccessiblebyTransit
(In 1000’s)
• Though the average number of trips accessible by both automobile and transit is expected to increase,theaveragenumberofjobsaccessiblebytransitwillincreasemoresignificantly.
• The total number of jobs that are accessible by transit, however, will remain less than those accessible by automobile, because transit will continue to not reach all parts of the region.
The average number of jobs accessible within 45 minutes by automobile and transit is expected to increase between now and 2040.
AverageNumberofJobsAccessiblebyAutomobile
(In 1000’s)

2015 CLRP Performance Analysis 21
2015: 2040:
Average number of Jobs Accessible
2015 2040
918 939(in 1000s)
2%
50
1
29
50
301
1
29
340
40
29
50
15
15
301
66395
495
295
95
95
270
70
495
9566
695
370
MARYLANDMARYLAND
VIRGINIAVIRGINIA
DCDC
Frederick County
Frederick County
Prince WilliamCounty
Prince WilliamCounty
Prince George’sCounty
Prince George’sCounty
CharlesCountyCharlesCounty
Loudoun County
Loudoun County
FairfaxCountyFairfaxCounty
Montgomery County
Montgomery County
ArlingtonCounty
Arlington County
5 10 200Miles N
Signi�cant Loss <-300,000
Moderate Loss -300,000 to -100,000
Minimal Impact -100,000 to 100,000
Moderate Gain 100,000 to 300,000
Signi�cant Gain > 300,000
Change in # of Jobs within 45 Minutes
Access to Jobs:Change in Access to Jobs by Automobile (2015-2040)
• Many areas, mainly on the eastern side of the region, will see declines in accessibility.
• These declines are the result of two important factors: one, anticipated increases in roadway congestion, which makeitmoredifficulttoreachotherparts of the region by car within 45 minutes, and, two, the fact that more of the new jobs anticipated between now and 2040 are forecast to be located on the western side of the region, more than 45 minutes from those living on the eastern side.
Significant declines in job accessibility by automobile are expected on the eastern side of the region.

2015 CLRP Performance Analysis 22
2015: 2040:
Average number of Jobs Accessible
2015 2040
398 543
(in 1000s)
36%
50
1
29
50
301
1
29
340
40
29
50
15
15
301
66395
495
295
95
95
270
70
495
9566
695
370
MARYLANDMARYLAND
VIRGINIAVIRGINIA
DCDC
Frederick County
Frederick County
Prince WilliamCounty
Prince WilliamCounty
Prince George’sCounty
Prince George’sCounty
CharlesCountyCharlesCounty
Loudoun County
Loudoun County
FairfaxCountyFairfaxCounty
Montgomery County
Montgomery County
ArlingtonCounty
Arlington County
5 10 200Miles N
Signi�cant Loss <-300,000
Moderate Loss -300,000 to -100,000
Minimal Impact -100,000 to 100,000
Moderate Gain 100,000 to 300,000
Signi�cant Gain > 300,000
Change in # of Jobs within 45 Minutes
Access to Jobs:Change in Access to Jobs by Transit(2015-2040)
• Most places with access to transit, will experience increases in the number of jobs that are accessible within a 45 minute commute.
• However, in 2040 transit will still not be a viable commute options for many people in the region due to lack of access to transit facilities and potentially long travel times.

2015 CLRP Performance Analysis 23
Air Quality: Mobile Source Emissions (2015-2040)
Ozone Season Precursor Nitrogen Oxides (NOx)
2015
2017
40
80
120
Tons/Day
160
2025
2030
2040
2010 Contingency Budget: 144.3 Tons/Day
128.3
91.1
2009 Attainment Budget: 146.1 Tons/Day
Alt A: 42.0Alt B: 42.1
Alt A: 28.4Alt B: 28.4 Alt A: 20.3
Alt B: 20.4
NOTE: The Mobile Budgets shown were developed in 2007, as part of the 8-Hour Ozone SIP, in response to the 1997 Ozone Standard. These budgets, as the most current approved by EPA, are required for use in any conformity analysis assessing ozone season pollutants.
TCMs and TERMS are not included in totals.
Ozone Season Volatile Organic Compounds (VOC)
2015
2017
30
40
Tons/Day
50
10
20
60
70
2025
2030
2040
62.4
50.7
2009 Attainment Budget: 66.5 Tons/Day
Alt A: 35.5Alt B: 35.5
Alt A: 25.2Alt B: 25.2
Alt A: 19.1Alt B: 19.1
NOTE: The Mobile Budgets shown were developed in 2007, as part of the 8-Hour Ozone SIP, in response to the 1997 Ozone Standard. These budgets, as the most current approved by EPA, are required for use in any conformity analysis assessing ozone season pollutants.
TCMs and TERMS are not included in totals.
Emissions of all criteria pollutants are expected to drop steadily between now and 2040.
• Emissions reductions are expected due to tougherfederalfuelandvehicleefficiencystandards.
• Changes in development patterns, investments in transit and other travel options,andimprovedoperationalefficiencyof area roadways will also contribute to reductions in vehicle related emissions.

2015 CLRP Performance Analysis 24
Annual Particulate Matter (PM2.5) Precursor Nitrogen Oxides (NOx)
2015
2017
30,000
40,000
Tons/Year
50,000
10,000
20,000
2025
2030
2040
41,709 Tons/Year
32,790
27,400 Tons/Year
Alt A: 15,421 Alt B: 15,434
Alt A: 10,756Alt B: 10,762 Alt A: 8,103
Alt B: 8,111
46,064
TCMs and TERMS are not included in totals.
Tier 1 Mobile Budgets
Annual Particulate Matter Direct (PM2.5)
2015
2017
1,000
1,500
Tons/Year
500
2,000
2,500
2025
2030
2040
1,860
1,523
1,787 Tons/Year
1,350 Tons/Year
Alt A: 926Alt B: 926 Alt A: 811
Alt B: 811 Alt A: 720Alt B: 720
TCMs and TERMS are not included in totals.
Tier 1 Mobile Budgets
Wintertime Carbon Monoxide (CO)
2015
2017
600
400
Tons/Day
200
1,000
800
1,200
1,600
1,400
1,800
2025
2030
2040
Wintertime CO Emissions Budget: 1,671.5 Tons/Day
381321 Alt A: 223
Alt B: 223 Alt A: 164Alt B: 164 Alt A: 122
Alt B: 122
Air Quality: Mobile Source Emissions (2015-2040)
2015 CLRP Performance Analysis 25
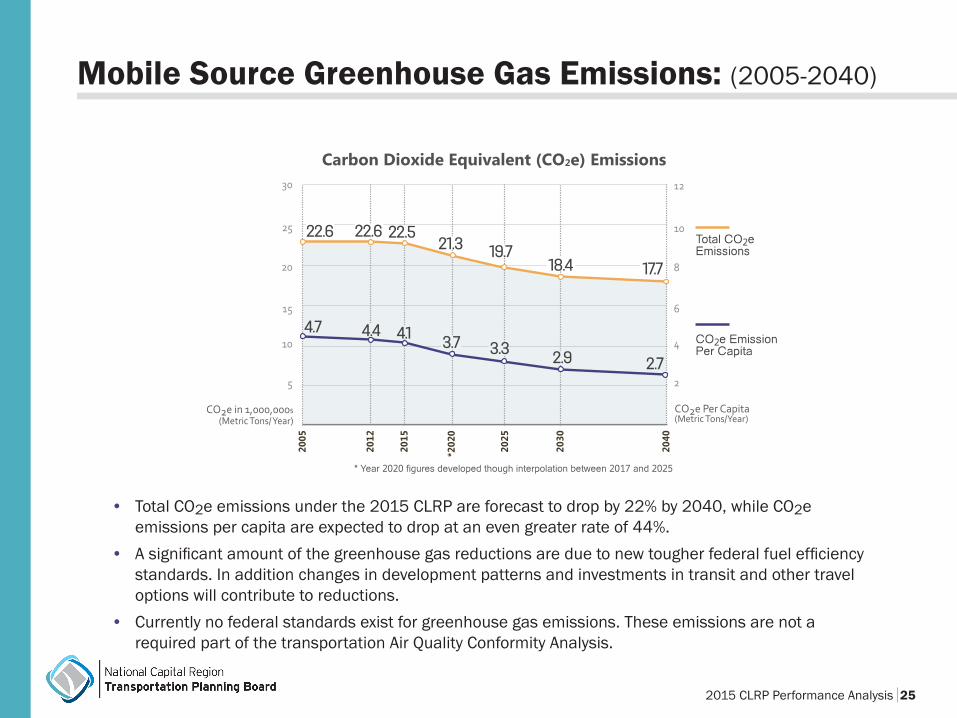
Carbon Dioxide Equivalent (CO2e) Emissions
2015
*202
0
5
15
20
CO2e in 1,000,000s(Metric Tons/ Year)
25
30
10
2025
2030
2040
2012
2
6
8
CO2e Per Capita(Metric Tons/Year)
10
12
4 CO2e Emission Per Capita
Total CO2eEmissions
2005
* Year 2020 figures developed though interpolation between 2017 and 2025
22.6 22.519.7
18.421.3
17.7
4.4 4.1 3.7 3.3 2.9 2.7
4.7
22.6
• Total CO2e emissions under the 2015 CLRP are forecast to drop by 22% by 2040, while CO2e emissions per capita are expected to drop at an even greater rate of 44%.
• Asignificantamountofthegreenhousegasreductionsareduetonewtougherfederalfuelefficiencystandards. In addition changes in development patterns and investments in transit and other travel options will contribute to reductions.
• Currently no federal standards exist for greenhouse gas emissions. These emissions are not a required part of the transportation Air Quality Conformity Analysis.
Mobile Source Greenhouse Gas Emissions: (2005-2040)

2015 CLRP Performance Analysis 26
Regional Transportation Priorities Assessment:
• The Regional Transportation Priorities Plan, adopted by the TPB in January 2014, identifiesstrategieswiththegreatestpotentialtoadvanceregionalgoalsrootedintheTPB Vision.
• The TPB has committed to using the Priorities Plan on a regular basis to assess the CLRP.
Priority 1: Meet Our Existing Obligations• The region’s commitment to
maintenance is solid: The CLRP demonstrates full funding for maintenance, operations, and state of good repair of the region’s highway and transit systems.
Priority 2: Strengthen Public Confidence and Ensure Fairness• Regional economic disparities
continue to affect transportation patterns:
• The TPB is seeking to improve public information and analysis.

2015 CLRP Performance Analysis 27
• Individuals, on average, are expected to drive less in the future than they do today.
• Theregionhasunfinishedbusinesswhen it comes to maximizing use of existing transit systems.
• The region is effectively using its Activity Centers to focus growth, enhance non-motorized circulation, and improve regional connections
- DC bike lane projects
Priority 3: Move More People and Goods More Efficiently• The region is diversifying its public
transit systems by developing new, cost-efficientoptionslikeBRTandstreetcars.
- New BRT Projects in VA
• New tolling projects are managing demand while raising revenue.
- I-66 Projects
• Projects target bottleneck relief.
Regional Transportation Priorities Assessment:
2015 CLRP Performance Analysis 28
Key Findings:
• By2040,theregionisexpectedtobehometo1.3millionmorepeopleand1.1millionmorejobs.
• MostnewpeopleandjobsareforecasttolocateinRegionalActivityCenters,andconcentratetowardthewestsideoftheregion.
• Growthincarpooling,transit,walking,andbicyclingisexpectedtooutpacegrowthintripsbysingledriversbetweennowand2040,bothforworkandnon-worktrips.Singledrivertripswillbethepredominantmodeoftravelforworktrips,buttheaverageamountofdrivingperpersonwillbelessin2040thanitistoday.
• Congestionwillcontinuetobeconcentratedinafewkeysegmentsofourregion’sroadways,butimpactagreatershareoftravelersandtrips.
• Withoutadditionalcapacity,fouroutoffiveMetroraillinespassingthroughtheregion’scorewillbecongestedorhighlycongestedby2040.

2015 CLRP Performance Analysis 29
Key Findings:
• Theaveragenumberofjobsaccessiblewithin45minutesisexpectedtoincreasebetweennowand2040forbothautomobileandtransitcommuters,butsignificantdeclinesinjobaccessibilitybyautomobileareexpectedontheeasternsideoftheregion.
• Emissionsofallcriteriapollutantsareexpectedtodropsteadilybetweennowand2040.
• TotalCO2emissionsareforecasttodropby2040,andCO2emissionspercapitaareexpectedtodropatanevengreaterrate.
• AssessingtheCLRPwiththeRegionalTransportationPrioritiesPlandemonstratesthat:
- The region’s commitment to maintenance is solid - Regional Disparities will continue to affect transportation patterns - Regional Agencies are planning projects that will provide new ways to move people and
goods more efficiently, but there is still work to be done to maximize use of the existing transit system.