Embed Size (px)
Citation preview

www.iam.kit.edu/wetKIT – The Research University in the Helmholtz Association
Performance analysis of Lithium-ion-batteries: status and prospectsDPG conference Erlangen
March 2018
Ellen Ivers-Tiffée, Philipp Braun, Michael Weiss
Karlsruhe Institute of Technology (KIT), Germany

Institute for Applied MaterialsMaterials for Electrical and Electronic Engineering
DPG_Erlangen_E_Ivers-Tiffée.ppt, Slide: 2, 19.03.2018
www.iam.kit.edu/wet
MotivationRagone Diagram
100 101 102 103 104100
101
102
103
lead acid
supercaps
Ni-MH
Wgr
av /
Wh
kg-1
Pgrav / W kg-1
Li-ion
measurement
high power
Ragone diagram on cell level
high energy
high energy&
high powerD
urat
ion
Performance
Institute for Applied MaterialsMaterials for Electrical and Electronic Engineering
DPG_Erlangen_E_Ivers-Tiffée.ppt, Slide: 3, 19.03.2018
www.iam.kit.edu/wet
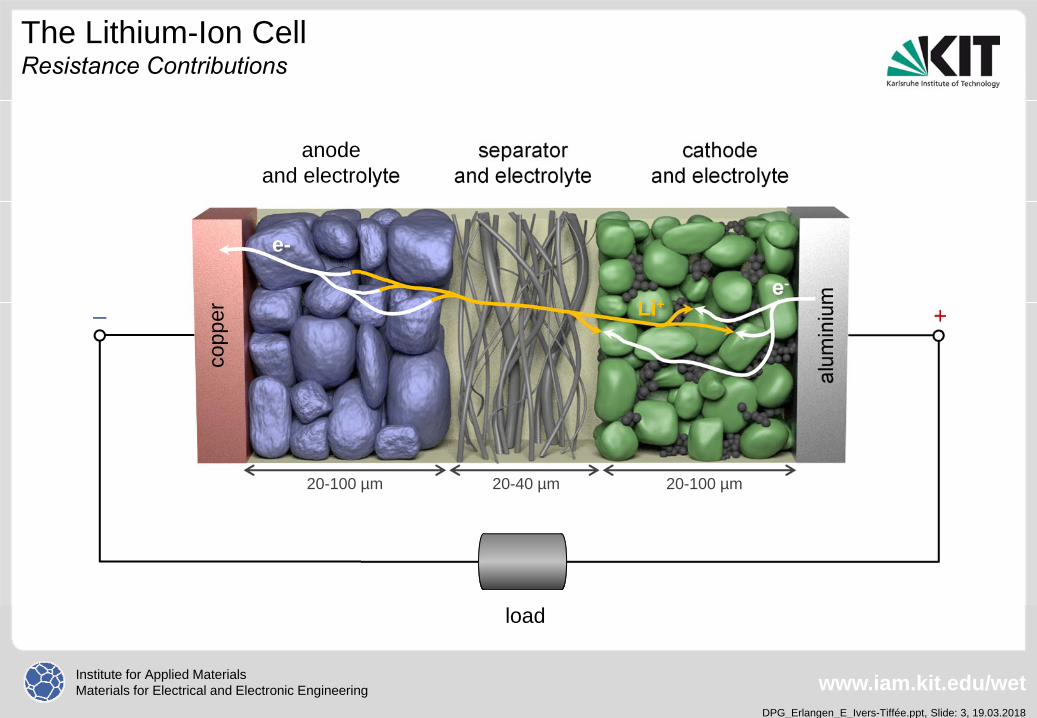
The Lithium-Ion CellResistance Contributions
copp
er
alum
iniu
m
– +
anodeand electrolyte
cathodeand electrolyte
separatorand electrolyte
e-
Li+
e-
20-100 µm 20-100 µm20-40 µm
load
Institute for Applied MaterialsMaterials for Electrical and Electronic Engineering
DPG_Erlangen_E_Ivers-Tiffée.ppt, Slide: 4, 19.03.2018
www.iam.kit.edu/wet
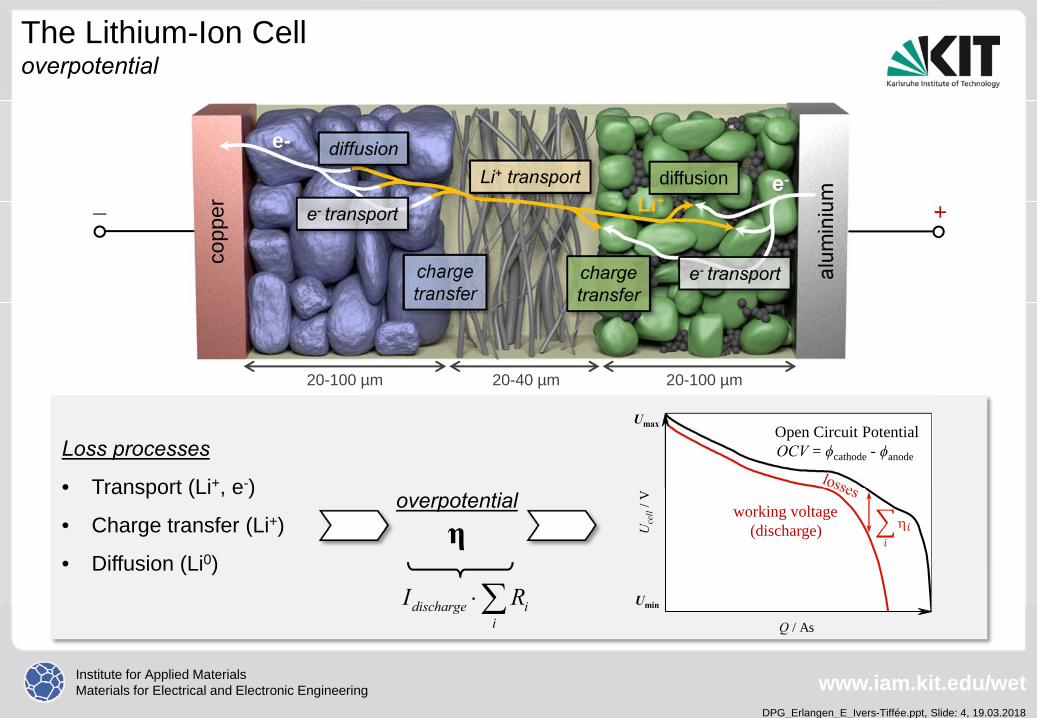
The Lithium-Ion Celloverpotential
Uce
ll / V
Q / As
Umin
Loss processes
• Transport (Li+, e-)
• Charge transfer (Li+)
• Diffusion (Li0)
overpotential
η
copp
er
alum
iniu
m
– +
chargetransfer
e-
Li+
e-
20-100 µm 20-100 µm20-40 µm
chargetransfer
Li+ transport
e- transport
diffusiondiffusion
e- transport
Umax
working voltage(discharge)
Open Circuit PotentialOCV = ϕcathode - ϕanode
discharge ii
I R

Institute for Applied MaterialsMaterials for Electrical and Electronic Engineering
DPG_Erlangen_E_Ivers-Tiffée.ppt, Slide: 5, 19.03.2018
www.iam.kit.edu/wet
The Lithium-Ion Cellenergy- and power density
Uce
ll / V
Q / As
Umin
copp
er
alum
iniu
m
– +
chargetransfer
e-
Li+
e-
20-100 µm 20-100 µm20-40 µm
chargetransfer
Li+ transport
e- transport
diffusiondiffusion
e- transport
Umax Open Circuit PotentialOCV = ϕcathode - ϕanode
arg
arg
disch e
gravcell cell
disch e
gravdischarge cell discharge cell
ii
ii
OCV I dQenergyW
m m
OCV I dQenergy
m m
RP
t t
R
Energy- and Power-density
energy U dQ

Institute for Applied MaterialsMaterials for Electrical and Electronic Engineering
DPG_Erlangen_E_Ivers-Tiffée.ppt, Slide: 6, 19.03.2018
www.iam.kit.edu/wet
Characterization of Lithium-Ion CellsElectrochemical Impedance Spectroscopy (EIS)
chargetransportelectrochemical
reactions
degradation diffusion
formation
1 µs1 ms1 s1 min1 h1 d1 M1 a10 a
f
Electrochemical Impedance Spectroscopy (EIS)
Characteristic time constants of different loss mechanisms in Lithium-ion cells:
frequency
time
1 MHz1 kHz1 Hz1 mHz 1 µHz1 nHz
Institute for Applied MaterialsMaterials for Electrical and Electronic Engineering
DPG_Erlangen_E_Ivers-Tiffée.ppt, Slide: 7, 19.03.2018
www.iam.kit.edu/wet
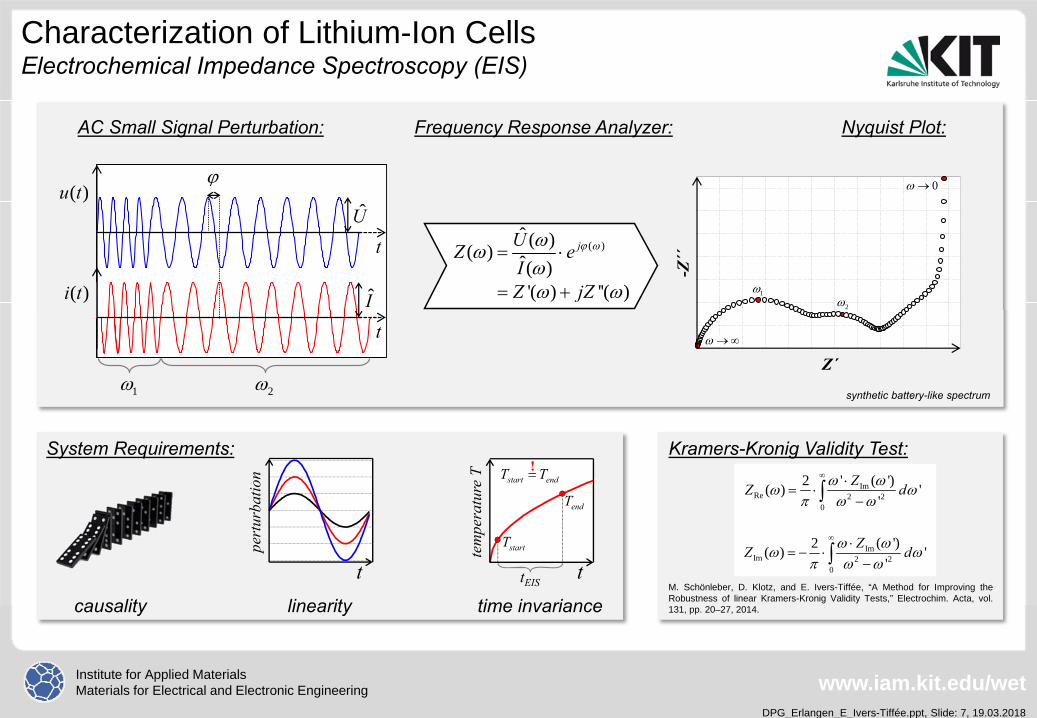
Characterization of Lithium-Ion CellsElectrochemical Impedance Spectroscopy (EIS)
Nyquist Plot:AC Small Signal Perturbation: Frequency Response Analyzer:
System Requirements:
linearitycausality time invariance
Kramers-Kronig Validity Test:
pert
urba
tion
t tEISt
tem
pera
ture
T
startT
endTstart endT T!
ImRe 2 2
0
' ( ')2( ) ''
ZZ d
ImIm 2 2
0
( ')2( ) ''
ZZ d
M. Schönleber, D. Klotz, and E. Ivers-Tiffée, “A Method for Improving theRobustness of linear Kramers-Kronig Validity Tests,” Electrochim. Acta, vol.131, pp. 20–27, 2014.
t
t
( )u t
( )i t
1 2
U
I
0
Z΄
-Z΄΄
12
( )ˆ ( )( ) ˆ( )
jUZ eI
'( ) ''( )Z jZ
synthetic battery-like spectrum

Institute for Applied MaterialsMaterials for Electrical and Electronic Engineering
DPG_Erlangen_E_Ivers-Tiffée.ppt, Slide: 8, 19.03.2018
www.iam.kit.edu/wet
Characterization of Lithium-Ion CellsElectrochemical Impedance Spectroscopy (EIS)
Impedance Analysis:
0 5 10 15 20 25 30 35 400
-5
-10
-15
-20Z'
' /
cm
2
Z' / cm2
Rohmic Rpolarization
What is the physical origin of these contributions?
Institute for Applied MaterialsMaterials for Electrical and Electronic Engineering
DPG_Erlangen_E_Ivers-Tiffée.ppt, Slide: 9, 19.03.2018
www.iam.kit.edu/wet
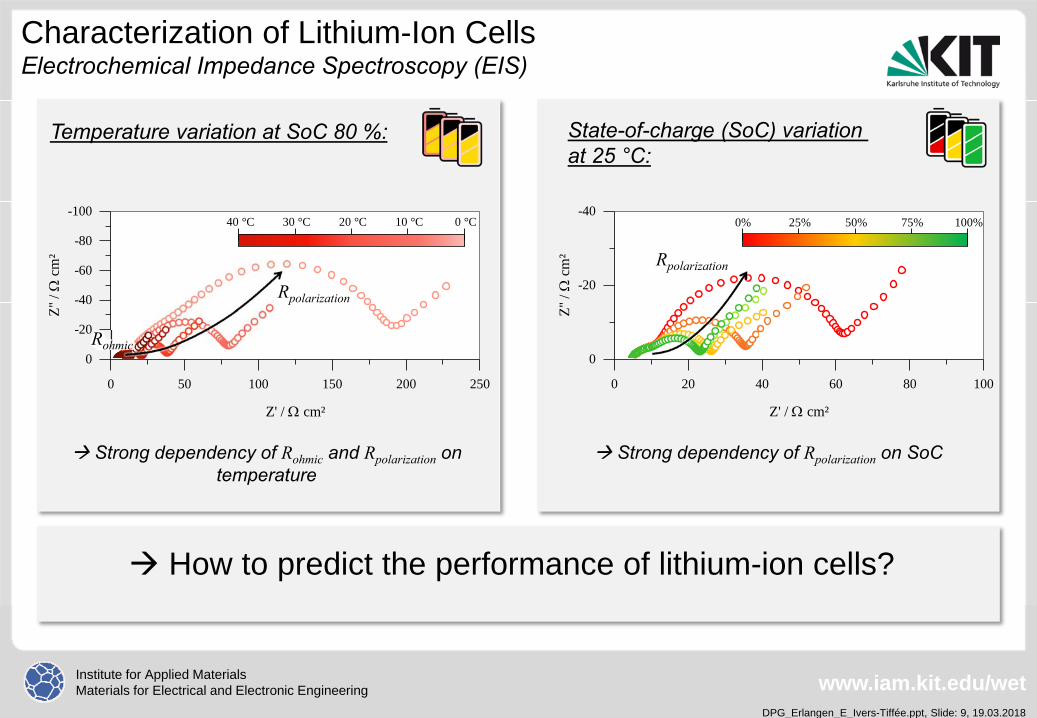
Characterization of Lithium-Ion CellsElectrochemical Impedance Spectroscopy (EIS)
Temperature variation at SoC 80 %: State-of-charge (SoC) variation at 25 °C:
How to predict the performance of lithium-ion cells?
Strong dependency of Rpolarization on SoC
0 50 100 150 200 250
0
-20
-40
-60
-80
-10030 °C 0 °C20 °C 10 °C
Z'' /
c
m²
Z' / cm²
40 °C
0 20 40 60 80 100
0
-20
-40
Z'' /
c
m²
Z' / cm²
0% 25% 50% 75% 100%
Rpolarization
Rohmic
Rpolarization
Strong dependency of Rohmic and Rpolarization on temperature
Institute for Applied MaterialsMaterials for Electrical and Electronic Engineering
DPG_Erlangen_E_Ivers-Tiffée.ppt, Slide: 10, 19.03.2018
www.iam.kit.edu/wet
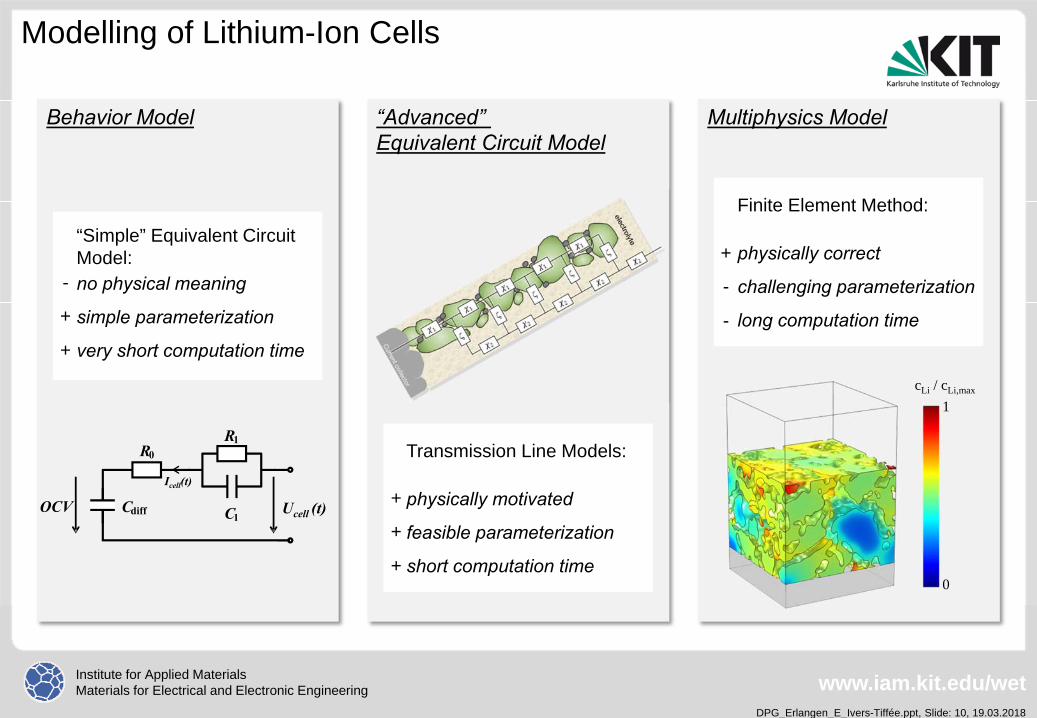
Modelling of Lithium-Ion Cells
Behavior Model
“Simple” Equivalent Circuit Model:no physical meaning
simple parameterization
very short computation time
R0R1
C1OCV Ucell (t)
Icell(t)
Cdiff
“Advanced” Equivalent Circuit Model
Transmission Line Models:
physically motivated
feasible parameterization
short computation time
Multiphysics Model
0
1cLi / cLi,max
Finite Element Method:
physically correct
challenging parameterization
long computation time+
+
-
+
+
+
-
-
+

Institute for Applied MaterialsMaterials for Electrical and Electronic Engineering
DPG_Erlangen_E_Ivers-Tiffée.ppt, Slide: 11, 19.03.2018
www.iam.kit.edu/wet
Modeling of Lithium-Ion CellsTransmission Line Model (TLM)
[1] J. Bisquert, G. Garcia-Belmontea, F. Fabregat-Santiagoa, and A. Compteb,“Anomalous transport effects in the impedance of porous film electrodes,”Electrochemistry Commun., vol. 1, no. 9, pp. 429–435, 1999.
electrolyte
Current collector
1 1 1 1
2 2 2 2 2
1electrode thickness
A
TCT
M
CZ lV a
charge transfer
A
CT
M
Va specific charge transfer resistance
active surface area per unit volume
electrode volume
solid-state diffusion0
0 1
1Diff
diff
Diff IZC D I
l
Finite-Space Warburg Impedance
2Diff
DiffDlj
differential capacity
diffusion length
0
Di
Di
f
ff
fD
l
C
diffusion coefficient
ionic path
21 1
ion A
A
tortuosity (pore)
volume fraction of pores
electrode area
Volume fractions
Tortuosity
Active Surface Area
Particle Size
Diffusion Length
Microstructure parameters:
Institute for Applied MaterialsMaterials for Electrical and Electronic Engineering
DPG_Erlangen_E_Ivers-Tiffée.ppt, Slide: 12, 19.03.2018
www.iam.kit.edu/wet
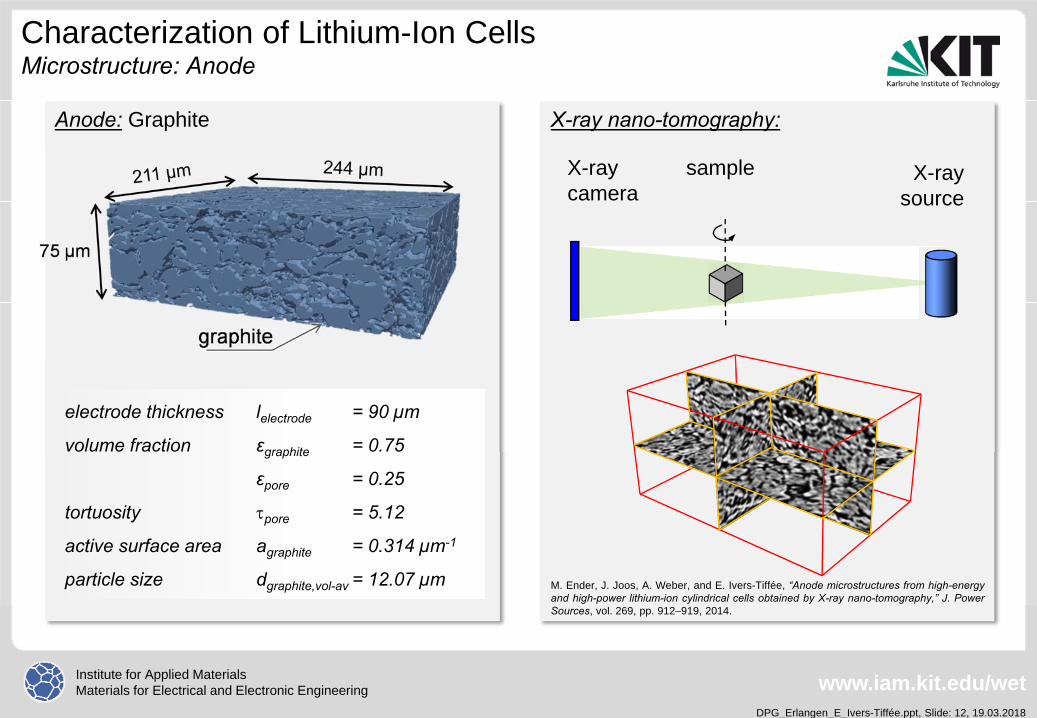
Characterization of Lithium-Ion CellsMicrostructure: Anode
Anode: Graphite X-ray nano-tomography:
X-raysource
X-raycamera
sample
M. Ender, J. Joos, A. Weber, and E. Ivers-Tiffée, “Anode microstructures from high-energyand high-power lithium-ion cylindrical cells obtained by X-ray nano-tomography,” J. PowerSources, vol. 269, pp. 912–919, 2014.
electrode thickness lelectrode = 90 µm
volume fraction εgraphite = 0.75
εpore = 0.25
tortuosity pore = 5.12
active surface area agraphite = 0.314 µm-1
particle size dgraphite,vol-av = 12.07 µm

Institute for Applied MaterialsMaterials for Electrical and Electronic Engineering
DPG_Erlangen_E_Ivers-Tiffée.ppt, Slide: 13, 19.03.2018
www.iam.kit.edu/wet
Characterization of Lithium-Ion CellsMicrostructure: Cathode
Focused ion beam (FIB) tomography: Cathode: NCA/LCO Blend
electron beamGa+ ion beam
sample
e- Ga+
M. Ender, J. Joos, T. Carraro, and E. Ivers-Tiffée, “Three-dimensional reconstruction of acomposite cathode for lithium-ion cells,” Electrochem. commun., vol. 13, no. 2, pp. 166–168, 2011.M. Ender, J. Joos, T. Carraro, and E. Ivers-Tiffée, “Quantitative Characterization of LiFePO4Cathodes Reconstructed by FIB/SEM Tomography,” J. Electrochem. Soc., vol. 159, no. 7,pp. A972–A980, Jan. 2012.
electrode thickness lelectrode = 75 µm
volume fraction εAM = 0.57
εcarbon = 0.17
εpore = 0.26
tortuosity pore = 4.29
active surface area aAM = 0.73 µm-1
particle size dAM,vol-av = 4.06 µm
LiNixCoyAl1-x-yO2 = NCALiCoO2 = LCO
Institute for Applied MaterialsMaterials for Electrical and Electronic Engineering
DPG_Erlangen_E_Ivers-Tiffée.ppt, Slide: 14, 19.03.2018
www.iam.kit.edu/wet
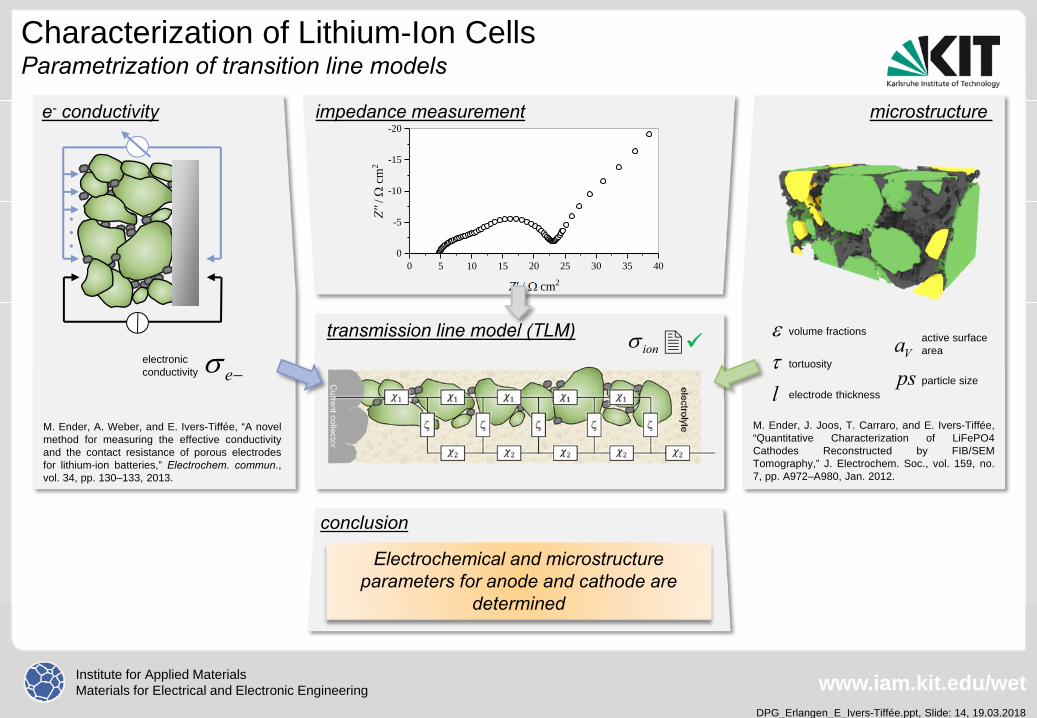
Characterization of Lithium-Ion CellsParametrization of transition line models
transmission line model (TLM)
microstructure e- conductivity impedance measurement
M. Ender, A. Weber, and E. Ivers-Tiffée, “A novelmethod for measuring the effective conductivityand the contact resistance of porous electrodesfor lithium-ion batteries,” Electrochem. commun.,vol. 34, pp. 130–133, 2013.
M. Ender, J. Joos, T. Carraro, and E. Ivers-Tiffée,“Quantitative Characterization of LiFePO4Cathodes Reconstructed by FIB/SEMTomography,” J. Electrochem. Soc., vol. 159, no.7, pp. A972–A980, Jan. 2012.
ionVa
pse electronicconductivity
volume fractions
tortuosity
electrode thickness
active surface area
particle sizel
conclusion
Electrochemical and microstructure parameters for anode and cathode are
determined
0 5 10 15 20 25 30 35 400
-5
-10
-15
-20
Z'' /
c
m2
Z' / cm2
Institute for Applied MaterialsMaterials for Electrical and Electronic Engineering
DPG_Erlangen_E_Ivers-Tiffée.ppt, Slide: 15, 19.03.2018
www.iam.kit.edu/wet
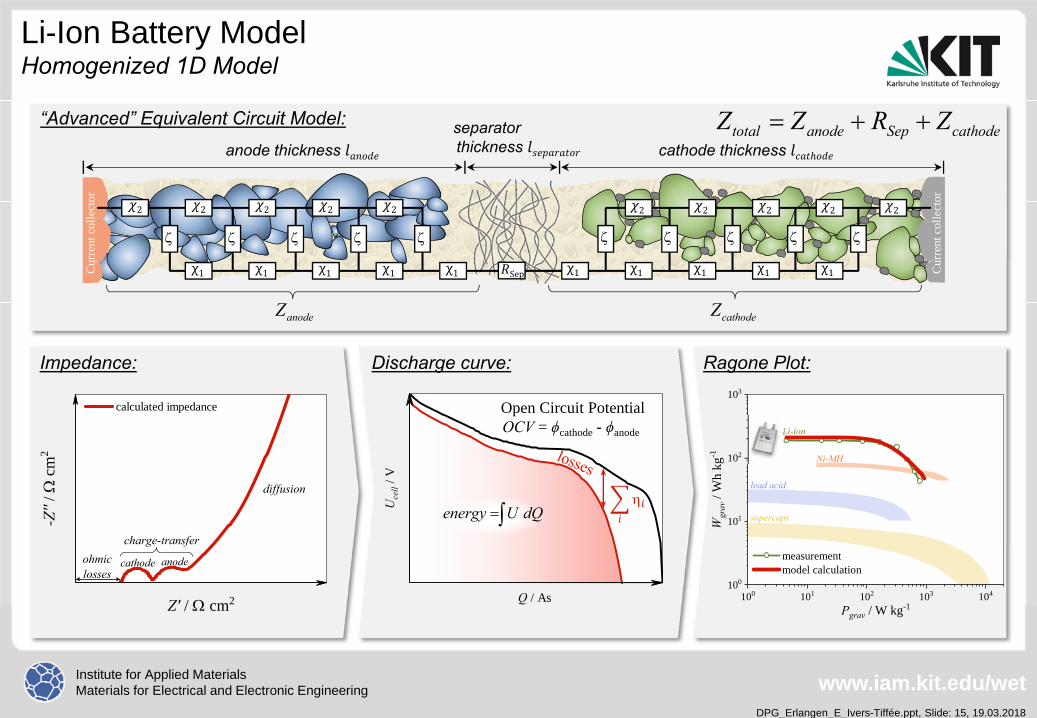
Li-Ion Battery ModelHomogenized 1D Model
charge-transferohmiclosses
anode
diffusion
-Z''
/ c
m2
Z' / cm2
calculated impedance
cathode
Cur
rent
col
lect
or
22222χ1χ1χ1χ1
2 2 2 2 2χ1 χ1 χ1 χ1 χ1 SepC
urre
nt c
olle
ctor
χ1anodeZ cathodeZ
“Advanced” Equivalent Circuit Model:
Impedance: Discharge curve: Ragone Plot:
cathode thickness anode thickness separatorthickness
Uce
ll / V
Q / As 100 101 102 103 104100
101
102
103
lead acid
supercaps
Ni-MH
Wgr
av /
Wh
kg-1
Pgrav / W kg-1
Li-ion
measurement model calculation
Open Circuit PotentialOCV = ϕcathode - ϕanode
energy U dQ
total anode Sep cathodeZ Z R Z
Institute for Applied MaterialsMaterials for Electrical and Electronic Engineering
DPG_Erlangen_E_Ivers-Tiffée.ppt, Slide: 16, 19.03.2018
www.iam.kit.edu/wet
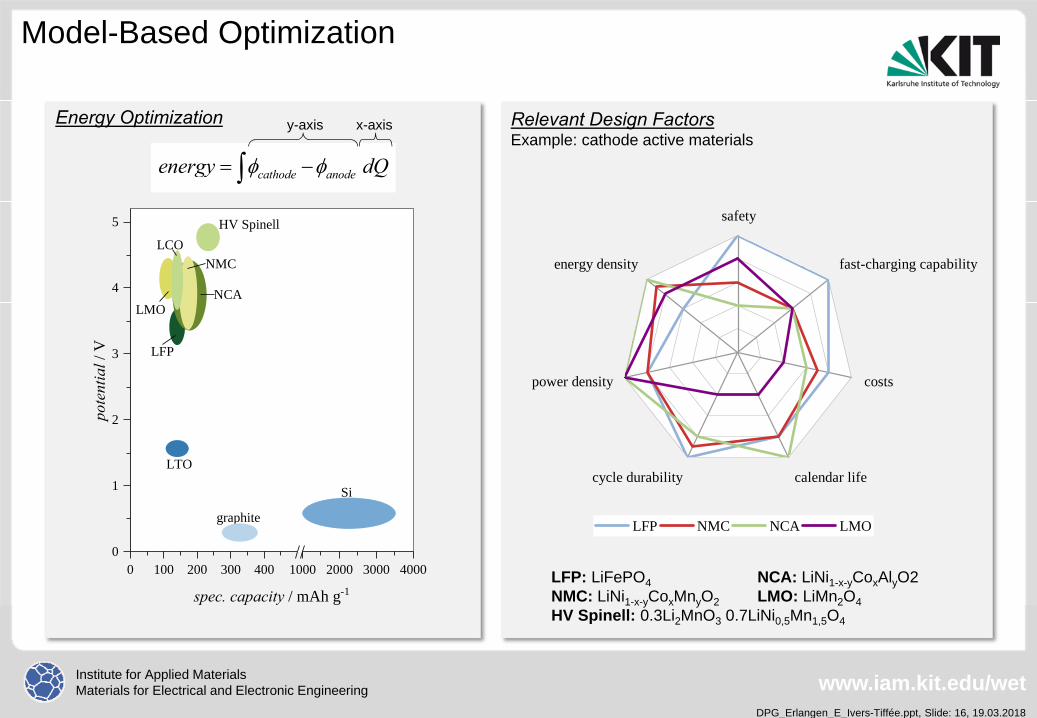
Model-Based Optimization
energy density
power density
cycle durability calendar life
costs
fast-charging capability
safety
LFP NMC NCA LMO
0 100 200 300 400 1000 2000 3000 40000
1
2
3
4
5
LTO
graphite
Si
LMO
LFP
LCO
NCA
NMC
pote
ntia
l / V
spec. capacity / mAh g-1
HV Spinell
Energy Optimization Relevant Design FactorsExample: cathode active materials
cathode anodeenergy dQ
y-axis x-axis
LFP: LiFePO4NMC: LiNi1-x-yCoxMnyO2HV Spinell: 0.3Li2MnO3 0.7LiNi0,5Mn1,5O4
NCA: LiNi1-x-yCoxAlyO2LMO: LiMn2O4
Institute for Applied MaterialsMaterials for Electrical and Electronic Engineering
DPG_Erlangen_E_Ivers-Tiffée.ppt, Slide: 17, 19.03.2018
www.iam.kit.edu/wet
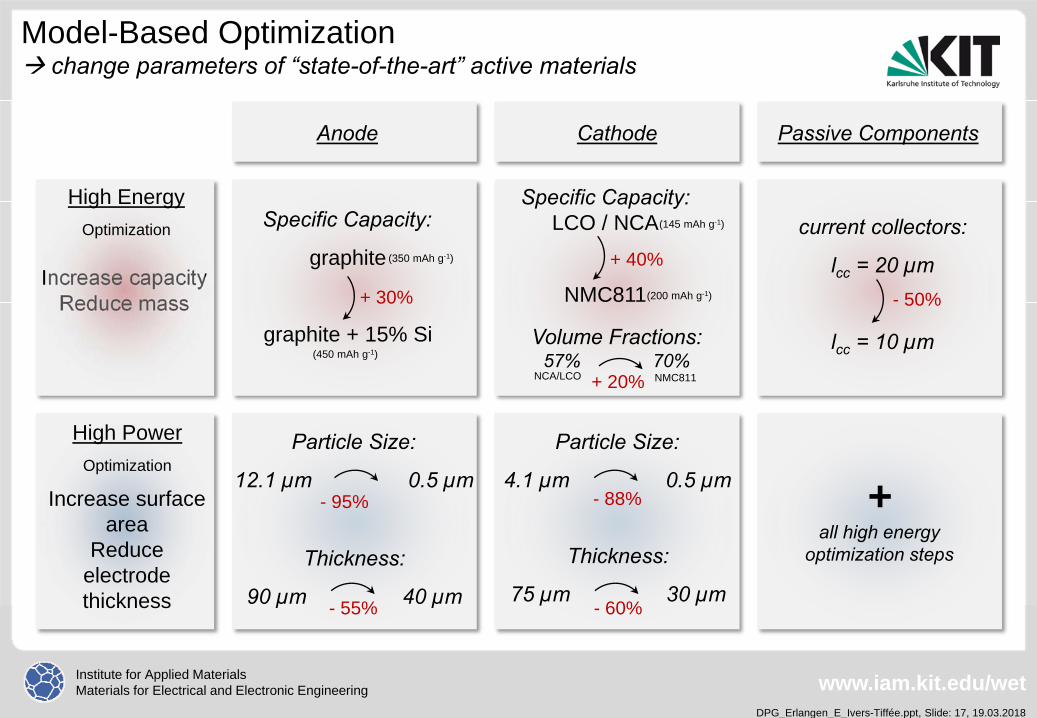
Model-Based Optimization change parameters of “state-of-the-art” active materials
Increase capacityReduce mass
Anode Cathode Passive Components
High EnergyOptimization
High PowerOptimization
Increase surface area
Reduce electrode thickness
Specific Capacity:
graphite
graphite + 15% Si
+ 30%
Specific Capacity:LCO / NCA
NMC811
+ 40%
Volume Fractions:57% 70%
+ 20%
(350 mAh g-1)
(450 mAh g-1)
(145 mAh g-1)
(200 mAh g-1)
NCA/LCO NMC811
current collectors:
lcc = 20 µm
lcc = 10 µm
- 50%
Thickness:
90 µm 40 µm
Thickness:
75 µm 30 µm- 55% - 60%
Particle Size:
4.1 µm 0.5 µm- 88%
Particle Size:
12.1 µm 0.5 µm- 95% +
all high energy optimization steps
Institute for Applied MaterialsMaterials for Electrical and Electronic Engineering
DPG_Erlangen_E_Ivers-Tiffée.ppt, Slide: 18, 19.03.2018
www.iam.kit.edu/wet
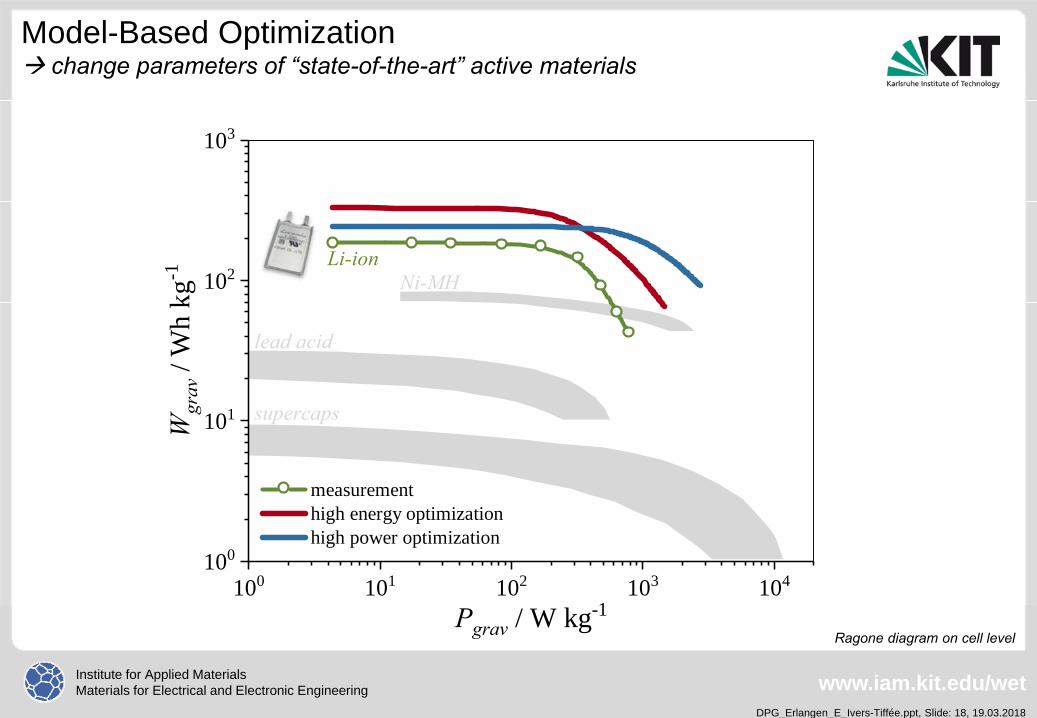
Model-Based Optimization change parameters of “state-of-the-art” active materials
100 101 102 103 104100
101
102
103
Li-ion
lead acid
supercaps
Ni-MH
Wgr
av /
Wh
kg-1
Pgrav / W kg-1
measurement high energy optimization high power optimization
Ragone diagram on cell level
Institute for Applied MaterialsMaterials for Electrical and Electronic Engineering
DPG_Erlangen_E_Ivers-Tiffée.ppt, Slide: 19, 19.03.2018
www.iam.kit.edu/wet
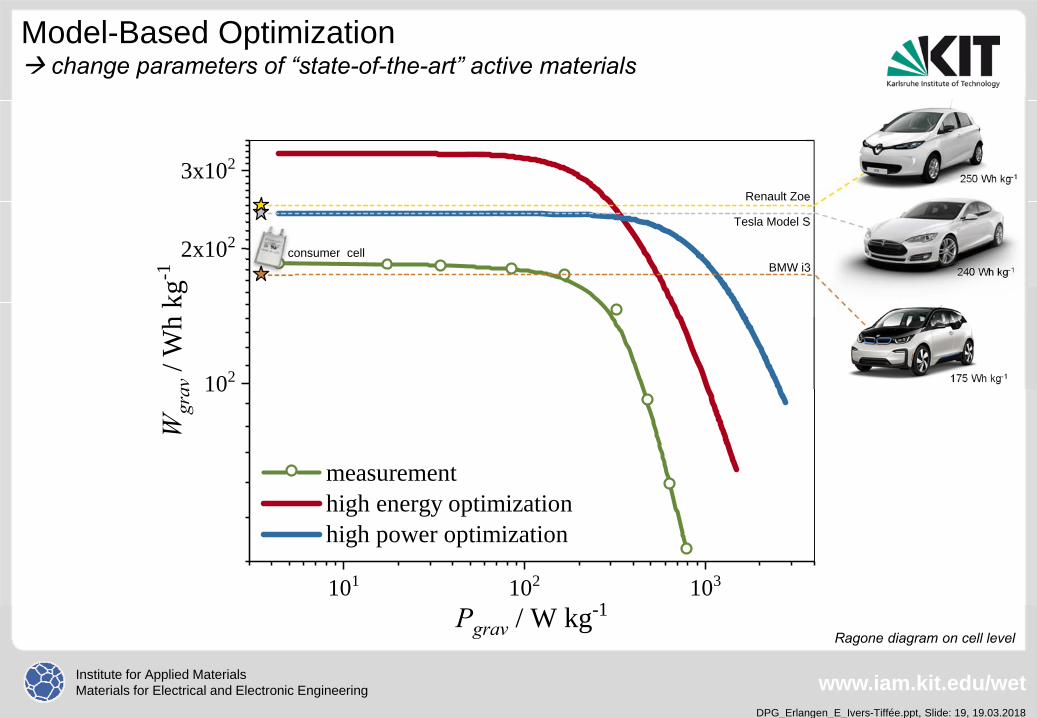
Model-Based Optimization change parameters of “state-of-the-art” active materials
101 102 103
102
2x10²
3x10²W
grav
/ W
h kg
-1
Pgrav / W kg-1
measurement high energy optimization high power optimization
BMW i3
Tesla Model S
Renault Zoe
consumer cell
250 Wh kg-1
175 Wh kg-1
240 Wh kg-1
Ragone diagram on cell level
Institute for Applied MaterialsMaterials for Electrical and Electronic Engineering
DPG_Erlangen_E_Ivers-Tiffée.ppt, Slide: 20, 19.03.2018
www.iam.kit.edu/wet
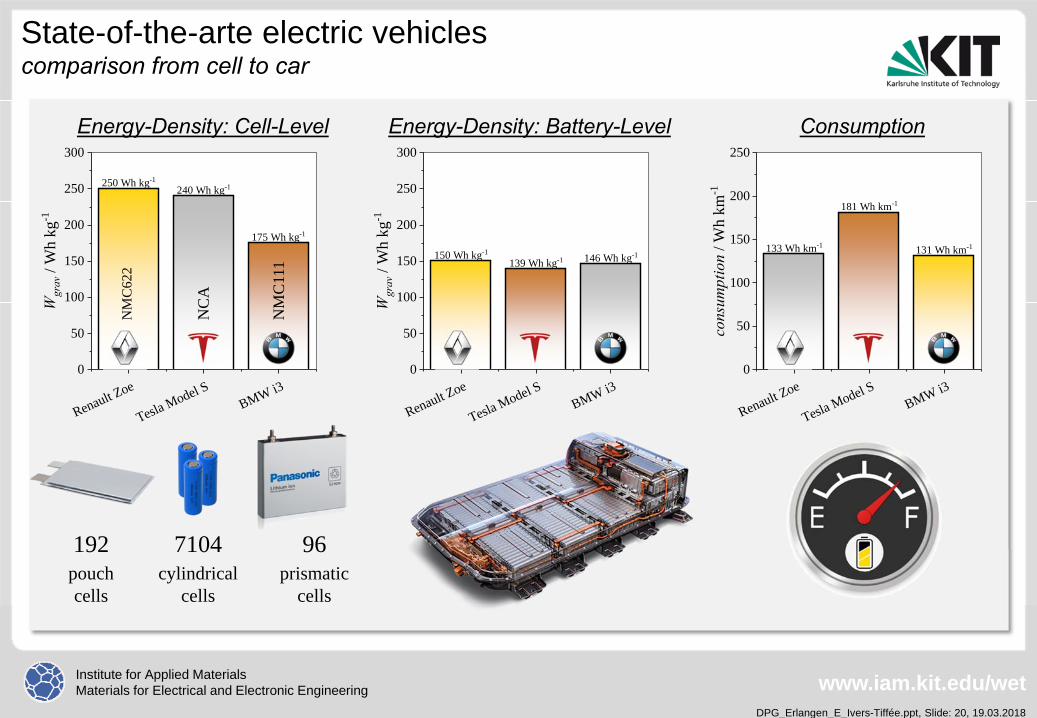
State-of-the-arte electric vehiclescomparison from cell to car
250 Wh kg-1240 Wh kg-1
175 Wh kg-1
150 Wh kg-1
139 Wh kg-1 146 Wh kg-1133 Wh km-1
181 Wh km-1
131 Wh km-1
Renault Zoe
Tesla Model SBMW i3
0
50
100
150
200
250
300
Wgr
av /
Wh
kg-1
Renault Zoe
Tesla Model SBMW i3
0
50
100
150
200
250
300
Wgr
av /
Wh
kg-1
Renault Zoe
Tesla Model SBMW i3
0
50
100
150
200
250
cons
umpt
ion
/ Wh
km-1
Energy-Density: Cell-Level Energy-Density: Battery-Level ConsumptionN
MC
622
NC
A
NM
C11
1
pouchcells
cylindricalcells
prismaticcells
192 7104 96

Institute for Applied MaterialsMaterials for Electrical and Electronic Engineering
DPG_Erlangen_E_Ivers-Tiffée.ppt, Slide: 21, 19.03.2018
www.iam.kit.edu/wet
Electric Range Prediction
State-of-the-art Battery
200 km
800 km(calculated by volume*)Future Prospects

Institute for Applied MaterialsMaterials for Electrical and Electronic Engineering
DPG_Erlangen_E_Ivers-Tiffée.ppt, Slide: 22, 19.03.2018
www.iam.kit.edu/wet
Acknowledgements:Research Partners and Team IAM-WET