Embed Size (px)
Citation preview

European Association for the Development of Renewable Energies, Environment and Power Quality (EA4EPQ)
International Conference on Renewable Energies and Power Quality (ICREPQ’10)
Granada (Spain), 23th to 25th March, 2010
Performance Analysis of a PEM Fuel Cell
J.I. San Martín1, I. Zamora2, J.J. San Martín1 V. Aperribay1, P. Eguía2
Department of Electrical Engineering - University of the Basque Country 1 Escuela Universitaria de Ingeniería Técnica Industrial de Eibar
Avda. Otaola, 29, 20600 Eibar (Spain) – e_mail: [email protected] 2 Escuela Técnica Superior de Ingeniería de Bilbao
Alda. Urquijo s/n, 48013 Bilbao (Spain) – e_mail: [email protected]
Abstract. In this paper, both a theoretical and an experimental study of the dynamic performance of a commercial fuel cell are described. The analysis has been focused in the start up and shutdown processes because they allow analysing the influence of different parameters. In this sense, the evolution of the stack and the environment temperatures can be observed, which allows measuring the heat released by the fuel cell. Moreover, the analysis of the flow of hydrogen and air allow obtaining various models for simulating the fuel cell system. Finally, the graphics associated with the variation of the stack voltage and current make possible to obtain the characteristic equations of these fuel cell systems, in order to provide power for auxiliary devices when the battery is not operating. Key words
Fuel cell start up, Fuel cell shutdown, Microgrids. 1. Introduction Electric market liberalization and environmental conditions configure a future guided to energy diversification, with significant increases in the use of clean energies and energy efficiency. This way, a tendency to the development of flexible and adaptable systems, with enough capacity to satisfy foreseen demand, is configured. In this scenario, fuel cells are devices where chemical reaction energy becomes in electricity without combustion, being one of the most promising technologies as future alternative. Their high efficiency, silent character, low emission of pollutants and flexibility with the use of fuels can be highlighted. They use hydrogen as fuel, being transformed directly into electrical energy in a similar process as in conventional batteries. Hydrogen is not in free form in nature, but appears being part of other fuels like natural gas, methane, propane, ethanol, etc., from where it can be extracted to be used in the fuel cell. Additionally, hydrogen production with renewable sources and its later
use in fuel cells facilitates a clean energy source to which a brilliant future is foreseen. Besides, fuel cells performance does not depend on the Carnot cycle, so that, ideally, the free energy of the reaction could become totally in electricity. In practise, nevertheless, electrodes over potentials produce efficiencies lower than 100%. It must be observed that electrochemical produced reactions are exothermic, so that the combined use of electricity and heat (cogeneration) produces a higher net efficiency. Moreover, because of the complexity of the processes and the high number of devices in fuel cells, the time constant is in the range of several seconds and not in the range of micro or milliseconds. Additionally, the nominal power of fuel cells is from some W up to several MW, for portable and stationary units [1]. Also, they can work at different pressures and temperatures, which vary from the atmospheric pressure up to 100 times its value and from 20 up to 1000ºC, respectively [2]. Within this context, fuel cells present numerous characteristics that grant them a promising future. Thus, their characteristics favour their integration into Distributed Generation systems, Trigeneration and Hybrid Technologies [4-5], as well as in the design of isolated or interconnected Electric Microgrids [3]-[6]. This paper presents the experimental results obtained during the start up and shutdown of the commercial fuel cell Nexa Power Module (Ballard Power Systems, Inc.). 2. PEMFC – Proton Exchange Membrane
Fuel Cell A PEM fuel cell is composed of an active layer, a diffuser layer and the terminals of the anode, the cathode and the membrane [7].
https://doi.org/10.24084/repqj08.456 735 RE&PQJ, Vol.1, No.8, April 2010

The hydrogen is introduced in the anode and arrives by diffusion to the catalytic layer of the anode. Here, an electrochemical reaction that liberates electrons and protons takes place. The electrons produced go towards the anode collector plate and they arrive, through an external load circuit, to the cathode. On the contrary, the protons cross the membrane towards the cathode. The overall process that takes place is represented by (1).
2 2 22H + O 2H O + heat + electrical energy→ (1) Figure 1 presents the disposition of the different elements that constitute this type of fuel cell.
Fig. 1. Schematic representation of a PEMFC fuel cell
Therefore, three different phases react simultaneously in the cathode to produce water: firstly, protons coming from the anode through the membrane; secondly, electrons produced in the anode and arriving to the cathode collector plate through the external circuit; and thirdly, oxygen. The water obtained in this process must be administered appropriately because a water excess causes the oxygen not to arrive efficiently to the active parts. On the contrary, excessive desiccation dries the polymeric membrane, producing a reduction in the protonic conduction. On the other hand, given that the electrochemical reaction that takes place in fuel cells is exothermal, the use of fuel cells to obtain heat and electricity simultaneously (cogeneration and trigeneration) leads to a higher global efficiency. In the next paragraphs the expressions that define the behaviour of these types of fuel cells are presented. The exit voltage of a simple cell can be represented as expressed in (2) [8]:
FC NERNST act ohmic conv E v v v= − − − (2)
where, ENERNST is the thermodynamic potential, and vact, vohmic and vcon are the activation, ohmic and concentration overpotential, respectively.
In relation to the reversible voltage of the cell, the value of ENERNST [9] is given by (3):
2 2
( )2 2
1( ) ( )2 2
NERNST ref
H O
G SE T TF F
RT Ln P Ln PF
Δ Δ= + −
⎡ ⎤⎢ ⎥+ +⎢ ⎥⎣ ⎦
(3)
where ΔG is the change in Gibbs free energy (J/mol); F the Faraday constant; ΔS the change in entropy (J/mol); R the universal gas constant; and PH2 and PO2 the partial pressures of hydrogen and oxygen (atm), respectively. T is the fuel cell operating temperature (K), and Tref the reference temperature. Equation (3) can be simplified by using standard values for ΔG, ΔS and Tref [10].
2 2
3
5
1.229 0.85 10 ( 298.15)14.31 10 ( ) ( )2
NERNST
H O
E T
T Ln P Ln P
−
−
= − ⋅ −
⎡ ⎤⎢ ⎥+ ⋅ ⋅ +⎢ ⎥⎣ ⎦
(4)
Besides, to consider the dynamic model of the fuel cell, we need to take into account the phenomenon called “Charge double layer”, [11]. The differential equation that allows obtaining the dynamic response is represented by equation (5).
1 1dFC d
dvi v
dt C τ= − (5)
where vd represents the dynamic voltage of the fuel cell, C is the equivalent electric capacity (F) and τ is the electric time constant (s), defined as indicated in expression (6).
( ) act cona act con
FC
v vR C C R R C
iτ
⎛ ⎞+ ⎟⎜ ⎟= = + = ⎜ ⎟⎜ ⎟⎜⎝ ⎠ (6)
where Ra represents the equivalent resistance. Assembling terms, it is possible to define the voltage of the fuel cell by means of expression (7).
FC NERNST d ohmicv E v v= − − (7)
On the other hand, for a fuel cell stack fed with pure hydrogen, the fuel consumption can be obtained by means of expression (8).
2
81.05 10 sH
FC
Pm
v−= ⋅ ⋅ (8)
where: 2Hm is the hydrogen mass flow rate (kg/s); vFC is
the fuel cell voltage (V), and Ps is the electric power of the stack (W) obtained from the expression (9).
s FC FCP n v i= ⋅ ⋅ (9)
being n the number of cells, in series connection, that are used to constitute the fuel cell stack. Additionally, the air mass flow rate (kg/s) can be obtained by using expression (10).
https://doi.org/10.24084/repqj08.456 736 RE&PQJ, Vol.1, No.8, April 2010
(10) where λ is the stoichiometric rate. In addition, the rate of water production (kg/s), during the operation of the stack, can be calculated by means of expression (11).
(11)
Most of the variables seen up to now depend on the operating pressure and temperature. The variation of these operating conditions directly affects the operation of the fuel cell. At higher operating temperatures and pressures, the fuel cell voltage will be increased, as well as its efficiency, for a certain current value. The operating temperature of a fuel cell can be obtained by using equation (12).
sdTM C Qdt
⋅ = Δ (12)
where M is the mass of the cell (kg); Cs is the equivalent average specific heat coefficient (J/kgK) and QΔ is the rate of heat variation (J/s). The value of sM C⋅ must be computed as the sum of the products of the individual masses and heat coefficients corresponding to all cell components (as with graphite and iron, for example). The ratio of variation of heat is computed as the difference between the rate of the heat generated during the fuel cell operation and the rate of the heat that is removed by the cooling system, as it is represented by expression (13).
gen remQ Q QΔ = − (13)
Finally, the rate of heat generation by the fuel cell can be obtained by means of expression (14).
1 1gen FCQ Pη
⎛ ⎞⎟⎜ ⎟= −⎜ ⎟⎜ ⎟⎜⎝ ⎠ (14)
where PFC is the electric power provided by the fuel cell and η is its efficiency. 3. Experimental results In this section, the experimental results, obtained in laboratory tests of an electrical micro-grid fed with a fuel cell, are presented. The experimental micro-grid is installed in a laboratory of the Department of Electrical Engineering of the University of the Basque Country. The test bench has been configured to analyse the behaviour of fuel cells in the start up and shutdown processes.
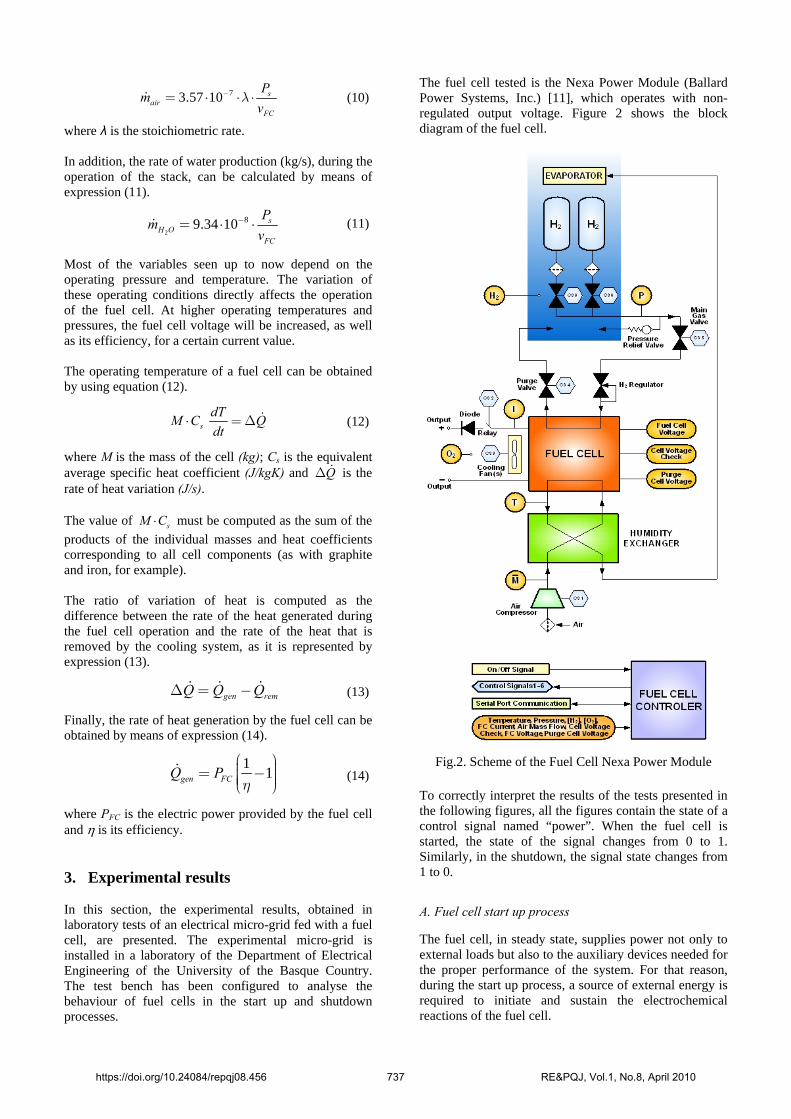
The fuel cell tested is the Nexa Power Module (Ballard Power Systems, Inc.) [11], which operates with non-regulated output voltage. Figure 2 shows the block diagram of the fuel cell.
Fig.2. Scheme of the Fuel Cell Nexa Power Module To correctly interpret the results of the tests presented in the following figures, all the figures contain the state of a control signal named “power”. When the fuel cell is started, the state of the signal changes from 0 to 1. Similarly, in the shutdown, the signal state changes from 1 to 0. A. Fuel cell start up process The fuel cell, in steady state, supplies power not only to external loads but also to the auxiliary devices needed for the proper performance of the system. For that reason, during the start up process, a source of external energy is required to initiate and sustain the electrochemical reactions of the fuel cell.
73.57 10 sair
FC
Pm
v−= ⋅ ⋅ ⋅λ
2
89.34 10 sH O
FC
Pm
v−= ⋅ ⋅
https://doi.org/10.24084/repqj08.456 737 RE&PQJ, Vol.1, No.8, April 2010

Following, a set of graphics are presented, which allow checking the values of the most significant parameters during this start up process of the fuel cell system. Since the polarization curve of the fuel cell depends on the temperature, the evolution of the stack temperature is shown in figure 3. This temperature must be below 73ºC, to preserve the thermal characteristics of the fuel cell.
Fig.3. Stack temperature
With regard to air, the oxygen concentration for the electrochemical reaction of the fuel cell is shown in figure 4. It contains up to 21% oxygen. It must be pointed out that for proper operation of the system, the oxygen sensor must detect an oxygen concentration in air greater than 18.7% (levels lower than 19.5% are biologically inactive).
Fig.4. Oxygen concentration
In relation to the ambient temperature, it has influence in the heat transference from the stack to the surrounding space. Figure 5 shows the evolution of the ambient temperature to operate the fuel cell system.
Fig.5. Ambient temperature
The evolution of the battery voltage is shown in figure 6. In this aspect, it must be said that the manufacturer warns that this voltage should be between 18 and 30 V.
Fig.6. Battery voltage
Moreover, the fan provides the air flow required to dissipate the heat released in the electrochemical reaction of the fuel cell. As the current density increases, the energy released as heat increases. For this reason, the air flow supplied by the fan has to increase to evacuate the excess of thermal energy. Also, the air flow delivered by the compressor should be increased, so that it can oxidize additional fuel. As it is shown in figure 7, immediately after the signal power takes value (1), the fan operates at 50% of its work cycle, and one second later the air compressor starts up.
Fig.7. Fan and compressor working cycles
Besides, the hydrogen valves are opened a second after the ignition signal. Figure 8 shows the flow rate of hydrogen consumed by the stack. The peaks in this graph indicate the purging work to clean the stack impurities.
Fig.8. Flow rate of hydrogen consumed
https://doi.org/10.24084/repqj08.456 738 RE&PQJ, Vol.1, No.8, April 2010

On the other hand, as it can be seen in figures 9 and 10, if the stack voltage is greater than 38 V, the purging cell voltage will be greater than 1.5 V, after 6 seconds. In these conditions, the auxiliary devices will be fed from the fuel cell stack.
Fig.9. Fuel cell stack voltage
Fig.10. Purge cell voltage
Additionally, when the values of the parameters shown in the previous figures have been validated by the control board, the system transfers the fuel cell internal loads from the battery to the fuel cell stack (figure 11). This operation is developed by the Cell Voltage Checker (CVC). The instant the loads are transferred is shown in figures 9 and 10 (around 33 seconds). The peaks of those graphics are caused by a higher demand of air, to feed the internal loads of the fuel cell.
Fig.11. Cell Voltage Cheker (CVC)
The air flow absorbed by the stack is shown in figure 12. Finally, figures 13 and 14 show the evolution of the fuel cell stack current and power, respectively.
Fig.12. Air flow
Fig.13. Fuel cell stack current
Fig.14. Fuel cell stack power
B. Fuel cell shutdown In the process of fuel cell shutdown the auxiliary devices that were supplied from the fuel cell stack pass to receive energy from the battery incorporated to the system. Figures 15 to 17, included in this section, show the behaviour of the fuel cell in this process. Figures 15 and 16 show the performance of the fan and the air compressor, respectively. In figure 15, it can be observed that, since the fan is operating at 35% of its cycle, it does not change its value at the instant when the power signal is inhibited (9 seconds). On the other hand, in Figure 16 we can see that the air compressor is adjusted to 70% of its working cycle, for draining wastewater, when the power signal is inhibited.
https://doi.org/10.24084/repqj08.456 739 RE&PQJ, Vol.1, No.8, April 2010
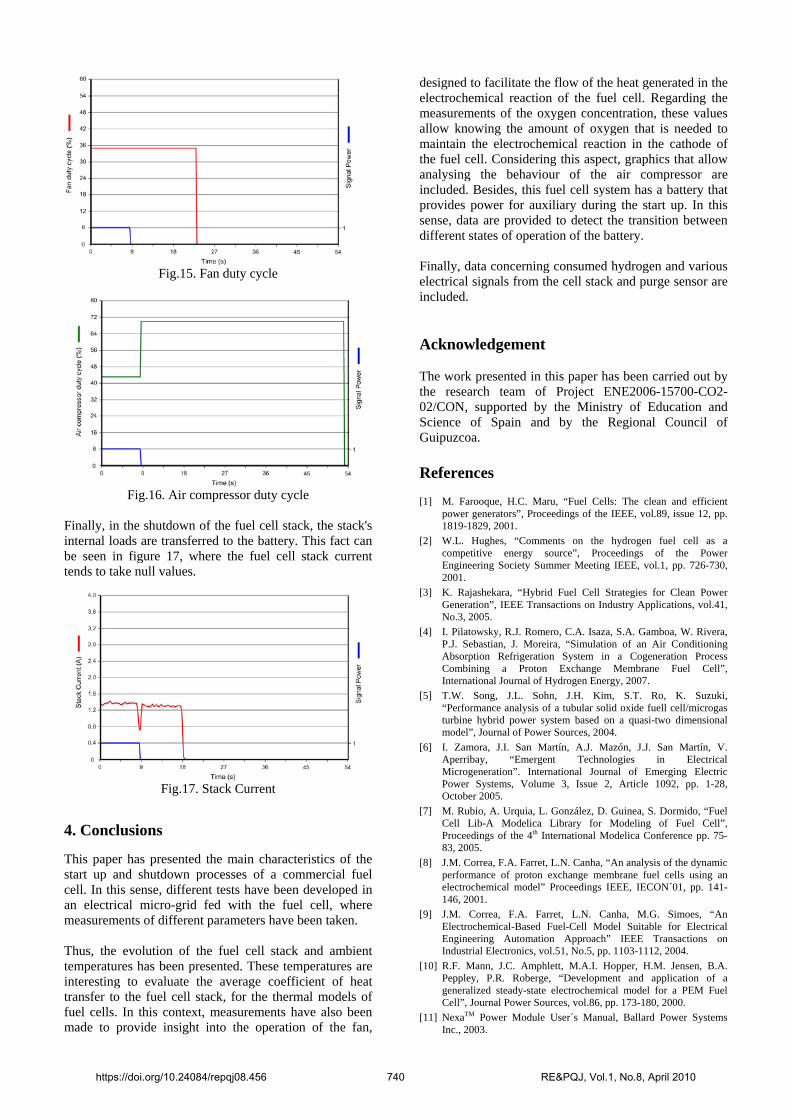
Fig.15. Fan duty cycle
Fig.16. Air compressor duty cycle
Finally, in the shutdown of the fuel cell stack, the stack's internal loads are transferred to the battery. This fact can be seen in figure 17, where the fuel cell stack current tends to take null values.
Fig.17. Stack Current
4. Conclusions This paper has presented the main characteristics of the start up and shutdown processes of a commercial fuel cell. In this sense, different tests have been developed in an electrical micro-grid fed with the fuel cell, where measurements of different parameters have been taken. Thus, the evolution of the fuel cell stack and ambient temperatures has been presented. These temperatures are interesting to evaluate the average coefficient of heat transfer to the fuel cell stack, for the thermal models of fuel cells. In this context, measurements have also been made to provide insight into the operation of the fan,
designed to facilitate the flow of the heat generated in the electrochemical reaction of the fuel cell. Regarding the measurements of the oxygen concentration, these values allow knowing the amount of oxygen that is needed to maintain the electrochemical reaction in the cathode of the fuel cell. Considering this aspect, graphics that allow analysing the behaviour of the air compressor are included. Besides, this fuel cell system has a battery that provides power for auxiliary during the start up. In this sense, data are provided to detect the transition between different states of operation of the battery. Finally, data concerning consumed hydrogen and various electrical signals from the cell stack and purge sensor are included. Acknowledgement The work presented in this paper has been carried out by the research team of Project ENE2006-15700-CO2-02/CON, supported by the Ministry of Education and Science of Spain and by the Regional Council of Guipuzcoa. References [1] M. Farooque, H.C. Maru, “Fuel Cells: The clean and efficient
power generators”, Proceedings of the IEEE, vol.89, issue 12, pp. 1819-1829, 2001.
[2] W.L. Hughes, “Comments on the hydrogen fuel cell as a competitive energy source”, Proceedings of the Power Engineering Society Summer Meeting IEEE, vol.1, pp. 726-730, 2001.
[3] K. Rajashekara, “Hybrid Fuel Cell Strategies for Clean Power Generation”, IEEE Transactions on Industry Applications, vol.41, No.3, 2005.
[4] I. Pilatowsky, R.J. Romero, C.A. Isaza, S.A. Gamboa, W. Rivera, P.J. Sebastian, J. Moreira, “Simulation of an Air Conditioning Absorption Refrigeration System in a Cogeneration Process Combining a Proton Exchange Membrane Fuel Cell”, International Journal of Hydrogen Energy, 2007.
[5] T.W. Song, J.L. Sohn, J.H. Kim, S.T. Ro, K. Suzuki, “Performance analysis of a tubular solid oxide fuell cell/microgas turbine hybrid power system based on a quasi-two dimensional model”, Journal of Power Sources, 2004.
[6] I. Zamora, J.I. San Martín, A.J. Mazón, J.J. San Martín, V. Aperribay, “Emergent Technologies in Electrical Microgeneration”. International Journal of Emerging Electric Power Systems, Volume 3, Issue 2, Article 1092, pp. 1-28, October 2005.
[7] M. Rubio, A. Urquia, L. González, D. Guinea, S. Dormido, “Fuel Cell Lib-A Modelica Library for Modeling of Fuel Cell”, Proceedings of the 4th International Modelica Conference pp. 75-83, 2005.
[8] J.M. Correa, F.A. Farret, L.N. Canha, “An analysis of the dynamic performance of proton exchange membrane fuel cells using an electrochemical model” Proceedings IEEE, IECON´01, pp. 141-146, 2001.
[9] J.M. Correa, F.A. Farret, L.N. Canha, M.G. Simoes, “An Electrochemical-Based Fuel-Cell Model Suitable for Electrical Engineering Automation Approach” IEEE Transactions on Industrial Electronics, vol.51, No.5, pp. 1103-1112, 2004.
[10] R.F. Mann, J.C. Amphlett, M.A.I. Hopper, H.M. Jensen, B.A. Peppley, P.R. Roberge, “Development and application of a generalized steady-state electrochemical model for a PEM Fuel Cell”, Journal Power Sources, vol.86, pp. 173-180, 2000.
[11] NexaTM Power Module User´s Manual, Ballard Power Systems Inc., 2003.
https://doi.org/10.24084/repqj08.456 740 RE&PQJ, Vol.1, No.8, April 2010