Embed Size (px)
Citation preview

Technische Universität München
Performance Analysis for Large ScaleSimulation Codes with Periscope
M. Gerndt, Y. Oleynik,C. Pospiech, D. Gudu
Technische Universität MünchenIBM Deutschland GmbH
May 2011

Technische Universität München
Outline
• Motivation • Periscope overview
− Concepts and features
• GENE analysis results− Applying Periscope− Single Core Performance analysis results − MPI performance analysis results− MPI performance analysis results
• Conclusion

Technische Universität München
• Common performance analysis procedure on Power6 systems– Use Tprof to pinpoint time-consuming subroutines– Use Xprofiler to understand call graph; mpitrace for MPI comm– Use hpmcount (libhpm) to measure HW Counters
• Issues– Routine, error-prone and time-consuming
– Requires deep HW knowledge
Motivation
– Requires deep HW knowledge – Mostly post-development process– Learning multiple tools required– Hard to map bottlenecks to
their source code location• Solution
– Automate the performance analysis– Integrate parallel application
development and performance analysis within the same IDE

Technische Universität München
Periscope • ISAR Project
− Extending functionality of Periscope, porting to new architectures, productization− BMBF funded, IBM as a partner
• Iterative online analysis− Configure, measure and evaluate raw performance data on the fly− No raw performance data stored, no trace files
• Distributed architecture− Scale together with application using multiple distributed hierarchical agents
− Reduce performance data online− Reduce performance data online
• Automatic bottlenecks search− Do analysis automatically – search for most important bottlenecks− Based on performance optimization experts' knowledge
• Enhanced Eclipse-based GUI− Bring discovered bottlenecks back to the programmers environment− Map results to the code lines
• Instrumentation− Fortran, C/C++; MPI / OpenMP / Hybrid, Automatic Overhead Control

Technische Universität München
Periscope distributed architecture
Graphical User Interface
Interactive frontend
Eclipse-based GUI
Analysis control
Agents network
Application
Monitoring Request Interface

Technische Universität München
Candidate Properties
PerformanceRefinement
Instrumented ApplicationAnalysis AgentsGUI
Location
MonitoringRequestsStart
Periscope Analysis Model
Proven Properties
Analysis
PerformanceMeasurements
Refinement
Raw performance data
Precision
FinalProperties
Report

Technische Universität München
Automatic search for bottlenecks
• Analysis automation through tuning knowledge formalization− Potential performance bottlenecks → properties− Efficient search algorithms → search strategies
• Performance property− Tries to map execution domain inefficiencies to algorithm domain− Condition− Confidence− Confidence− Severity
• Performance analysis strategies− Itanium2 Stall Cycle Analysis− IBM POWER6 Single Core Performance Analysis− MPI Communication Pattern Analysis− Generic Memory Strategy− OpenMP-based Performance Analysis− Scalability Analysis – OpenMP codes

Technische Universität München
GENE overview • What is GENE?
− “Plasma microturbulence code which can be used to compute gyroradius-scale fluctuations and the resulting transport coefficients in magnetized fusion/astrophysical plasmas” *
− Solves the nonlinear gyrokinetic equations on a fixed grid in five-dimensional phase space (plus time)
• Statistics and features−− Hybrid MPI/OpenMP parallelization approach− Parallelized over all space coordinates− Highly efficient: adapts to given hardware and problem size, chooses
timestep in an optimal way− 129 source files, 49722 lines of code (FORTRAN 90)− currently 11 developers; collaborators and users from over 24 institutions
• Runs on a large number of computer architectures− IBM BlueGene/P, IBM Power5/6, SGI Altix 4700, Cray XT-XE6, various
Linux clusters
* www.ipp.mpg.de/~fsj/gene/
Technische Universität München
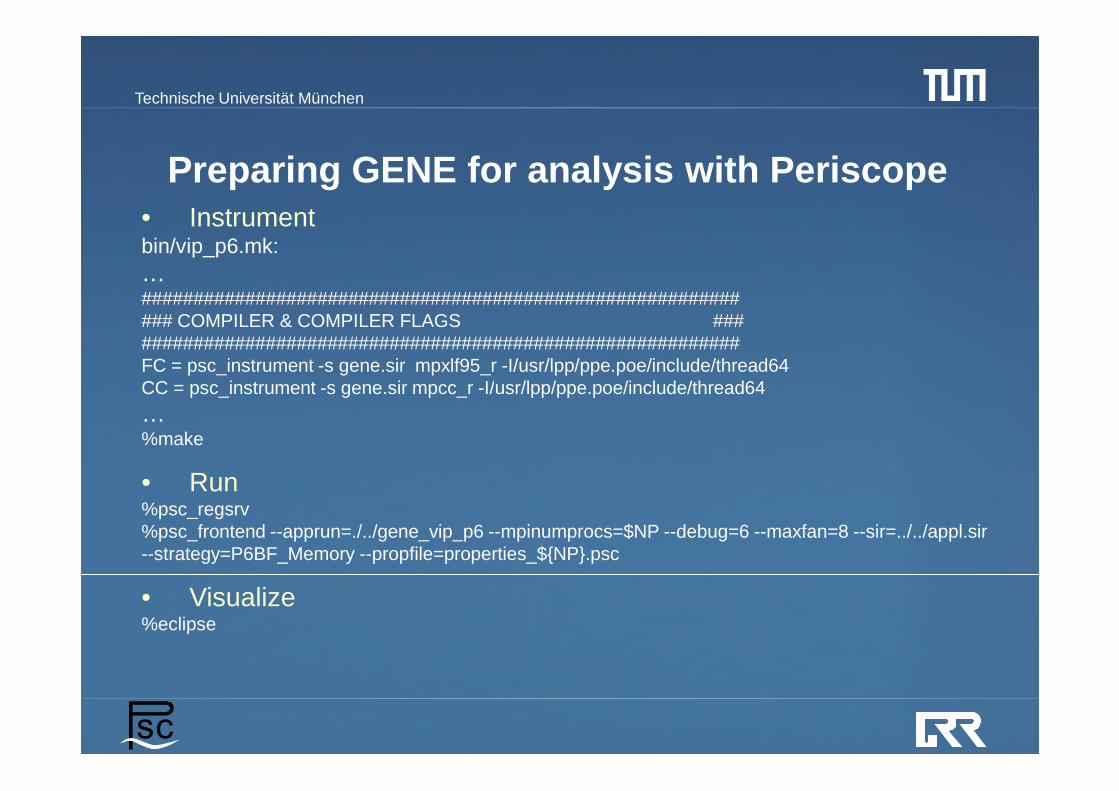
• Instrumentbin/vip_p6.mk:…############################################################# COMPILER & COMPILER FLAGS #############################################################FC = psc_instrument -s gene.sir mpxlf95_r -I/usr/lpp/ppe.poe/include/thread64CC = psc_instrument -s gene.sir mpcc_r -I/usr/lpp/ppe.poe/include/thread64
Preparing GENE for analysis with Periscope
CC = psc_instrument -s gene.sir mpcc_r -I/usr/lpp/ppe.poe/include/thread64
…%make
• Run%psc_regsrv%psc_frontend --apprun=./../gene_vip_p6 --mpinumprocs=$NP --debug=6 --maxfan=8 --sir=../../appl.sir--strategy=P6BF_Memory --propfile=properties_${NP}.psc
• Visualize%eclipse

Technische Universität München
GENE single core performance analysis with Periscope…
Very good performance ☺

Technische Universität München
But there is always room for improvement…All properties above 10% threshold

Technische Universität München
Loop region from GENE: calc_rhs.F90:274:
!computation is done in sub-blocks of g-like arrays to optimize cache usagedo iblock=1,nblocks
lbg1 =(iblock-1)*lbg0+1lbg2 =lbg1+lbg0-1if(.not.with_g_update) rhs_block=>a_rhs(:,:,:,iblock)
….enddo
But there is always room for improvement…Region wasting most of the time
Periscope:Memory access pattern : Insufficient cached data reuse with only 66 % reuse factor
* bandwidth 17985.1 MB/s* Avg cycles per L1 miss 34* Cycles lost due to cache 11% of the phase execution (15% of the region time)* L1 miss rate 1.2%* L2 miss rate 0.7%* L3 miss rate 39%* L1 prefetch ratio 33%* Loaded+stored bytes 15201 MB

Technische Universität München
subroutine nextstage_g(timestep,k_plus,g_old,g_new)real,intent(in)::timestepcomplex,dimension(li1:li2,lj1:lj2,lk1:lk2,ll1:ll2,lm1:lm2, ln1:ln2),intent(in):: k_plus,g_oldcomplex,dimension(li1:li2,lj1:lj2,lk1:lk2,ll1:ll2,lm1:lm2, ln1:ln2),intent(inout):: g_newPERFON('rkupd')
g_new = g_old + timestep*k_plusPERFOFF
end subroutine nextstage_g
Periscope:
But there is always room for improvement…Tiny loop with “bad” pattern
Periscope:Memory access pattern : Store queue flooded, too many consequent storesStreaming from memory (4169.13 MB/s); Severity 2.55%
* bandwidth 4200 MB/s* Avg cycles per L1 miss 575* Cycles lost due to cache 2.55% of the phase execution (60% of the region time)* L1 miss rate 1.58%* L2 miss rate 10%* L3 miss rate 100%* L1 prefetch ratio 100%* Loaded+stored bytes 151 MB* Store queue full rejects per store reference 70%

Technische Universität München
GENE MPI performance analysis with Periscope…
No properties found ☺

Technische Universität München
If it can’t be better, make it worth…Inefficient parallelization choice

Technische Universität München
Thank you for your attention!
• GENE – very good performance ! − But there is always room for improvement
• Periscope − Highly scalable solution for automated performance analysis− Delivers performance problems not the performance data− Tries to formulate problems in programmers language− Tries to formulate problems in programmers language− Covers major performance aspects:
− MPI synchronization problems, time spent− Single core performance− OpenMP overheads, scalability
− Brings performance analysis results directly into IDE − Available on POWER6, BlueGene/P(only MPI), SGI Altix 4700, x86-
based architectures (only MPI)
• Further information:− Periscope web page: http://www.lrr.in.tum.de/periscope


![stm talk 10.ppt - spscicomp.org · Title: Microsoft PowerPoint - stm_talk_10.ppt [Compatibility Mode] Author: bihari1 Created Date: 6/1/2009 3:13:40 PM](https://img.dokumen.tips/doc/110x75/5fa4aacafae3e01f4546bf2b/stm-talk-10ppt-title-microsoft-powerpoint-stmtalk10ppt-compatibility-mode.jpg)