Embed Size (px)
Citation preview

Perekonomian Indonesia Melambat?
Anton H. Gunawan
Chief Economist
PT. Bank Mandiri (Persero), Tbk.

Indonesia Macro Economic Overview: Great Picture, But………
2

3
24.6
7.9
2011 2012 2013 2014 2015 2016 f2017
3
3.02
4.2
4.75
2
3
4
5
6
7
8
1Q15 3Q15 1Q16 3Q16 2017F
Inflation 7 Days RR
4.96 5.04
4.66
5.04
5.18
5.02 5.10
2Q
14
3Q
14
4Q
14
1Q
15
2Q
15
3Q
15
4Q
15
1Q
16
2Q
16
3Q
16
4Q
16
20
17
F
14,603
13,173 13,051
13,473 13,400
1Q15 2Q15 3Q15 4Q15 1Q16 2Q16 3Q16 4Q16 2017F
10-12
GDP growth (% yoy) Inflation and policy rate (%) Loan growth (% yoy)
Currency (USDIDR) Fiscal Balance (% to GDP)
Domestic economic growth will slightly improved this year Inflation will accelerated but still at a manageable level, thus policy rate will be kept at 4.75%
Source : Bloomberg, CEIC, Bank Mandiri forecast
-1.1
-1.8
-2.2 -2.2
-2.6 -2.5 -2.6
2011 2012 2013 2014 2015 2016 2017F
Current Account Balance (% to GDP)
0.2
-2.8 -3.2
-3
-2.1 -2 -1.7
2011 2012 2013 2014 2015 2016 2017F

GDP growth (% yoy) Source of growth (%)
Economic growth was stable at 5.01% in 2Q17 Investment improved but government spending weakened
Source : BPS
25
Components growth (%)
Proportions (%)
5.19
5.01
3Q
13
4Q
13
1Q
14
2Q
14
3Q
14
4Q
14
1Q
15
2Q
15
3Q
15
4Q
15
1Q
16
2Q
16
3Q
16
4Q
16
1Q
17
2Q
17
1Q
14
2Q
14
3Q
14
4Q
14
1Q
15
2Q
15
3Q
15
4Q
15
1Q
16
2Q
16
3Q
16
4Q
16
1Q
17
2Q
17
Private Cons Exp NP Inst Cons Exp
Gov exp Investments
Net Export Ch in Stcks, stt discr
2016 2Q16 1Q17 2Q17
Household Exp 5.01 5.07 4.93 4.95
NP Inst Exp 6.62 6.71 8.02 8.33
Gov Exp -0.15 6.23 2.71 -1.94
Investments 4.48 4.18 4.81 5.35
Exports -1.74 -1.52 8.04 0.27
Imports -2.20 30.79 5.74 7.39
Net Exports 0.07 -2.18 16.90 12.33
GDP Growth 5.02 9.13 5.01 5.01
2016 2Q16 1Q17 2Q17 Household Exp 54.35 53.68 55.06 53.65 NP Inst Exp 1.12 1.09 1.14 1.13 Gov Exp 8.21 7.96 5.98 7.44 Investments 32.25 31.55 31.99 31.66 Exports 20.88 20.97 21.89 20.64 Imports 16.55 16.59 17.01 18.52 Net Exports 4.33 4.38 4.88 4.88

Agriculture (% yoy) Mining (% yoy) Industrial Processing (% yoy)
Construction Trading
Primary sectors Secondary sector
Transportation Communication Financial Services
Tertiary sectors
Industries shown mixed performance in 2Q17 compared to 1Q17 Industrial processing sector grew slower in 2Q17. Construction sector growth up but its employment down
Source : BPS 5
1.47
3.44 3.03
5.31
7.12
3.33
1Q16 2Q16 3Q16 4Q16 1Q17 2Q17
1.2 1.15
0.29
1.6
-0.64
2.24
1Q16 2Q16 3Q16 4Q16 1Q17 2Q17
4.68 4.63 4.52
3.36
4.21
3.54
1Q16 2Q16 3Q16 4Q16 1Q17 2Q17
6.76
5.12 4.95 4.21
5.95 6.96
1Q162Q163Q164Q161Q172Q17
4.15 4.1 3.59
3.9
4.96
3.78
1Q162Q163Q164Q161Q172Q17
7.9 6.91
8.26 7.85 8.03 8.37
1Q16 2Q16 3Q16 4Q16 1Q17 2Q17
7.58
9.33 8.95 9.57 9.1
10.88
1Q162Q163Q164Q161Q172Q17
9.32
13.59
9.04
4.18
5.99 5.94
1Q16 2Q16 3Q16 4Q16 1Q17 2Q17

5.58
5.19 5.01
4.0
4.5
5.0
5.5
6.0
3Q
13
4Q
13
1Q
14
2Q
14
3Q
14
4Q
14
1Q
15
2Q
15
3Q
15
4Q
15
1Q
16
2Q
16
3Q
16
4Q
16
1Q
17
2Q
17
5.35
4.95
4.0
4.5
5.0
5.5
6.0
-
2.0
4.0
6.0
8.0
10.0
12.0
1Q
11
2Q
11
3Q
11
4Q
11
1Q
12
2Q
12
3Q
12
4Q
12
1Q
13
2Q
13
3Q
13
4Q
13
1Q
14
2Q
14
3Q
14
4Q
14
1Q
15
2Q
15
3Q
15
4Q
15
1Q
16
2Q
16
3Q
16
4Q
16
1Q
17
2Q
17
Investment (LHS) Household consumption (RHS)
9.8
7.9
5.3
3
4
5
6
7
8
9
10
11
Feb
-07
Au
g-0
7
Feb
-08
Au
g-0
8
Feb
-09
Au
g-0
9
Feb
-10
Au
g-1
0
Feb
-11
Au
g-1
1
Feb
-12
Au
g-1
2
Feb
-13
Au
g-1
3
Feb
-14
Au
g-1
4
Feb
-15
Au
g-1
5
Feb
-16
Au
g-1
6
Feb
-17
GDP growth (% YoY) Investment and household cons growth (% YoY)
Unemployment (%) Employment (mn people)
Economic growth and employment absorption (1/2)
Every 1% growth only creates approximately 400 thousand employment
Source : BPS
GDP has only been growing by 5-5.5% not enough to absorb labor force
House hold consumption had been slowing since 2012
89
118
60
70
80
90
100
110
120
130
19
99
20
00
20
01
20
02
20
03
20
04
20
05
20
06
20
07
20
08
20
09
20
10
20
11
20
12
20
13
20
14
20
15
20
16

Tahun GDP Growth (% YoY) Employment (mn
people) Emplyment addition (mn
people) Employment addition to
GDP (th people)
2004 5.03 93.72 2.94 583.82
2005 5.69 93.96 0.24 41.52
2006 5.50 95.46 1.50 272.42
2007 6.35 99.93 4.47 705.01
2008 6.01 102.55 2.62 436.09
2009 4.63 104.87 2.32 500.75
2010 6.22 108.21 3.34 536.18
2011 6.49 109.67 1.46 225.52
2012 6.26 110.81 1.14 181.65
2013 5.73 110.80 (0.00) (0.72)
2014 5.01 114.63 3.82 763.78
2015 4.88 114.82 0.19 39.20
2016 5.02 118.41 3.59 716.33
Economic growth and employment absorption (2/2)
In the past 5 years, every 1% growth increase in GDP resulted in addition of employment of 320 th people
In the past 10 years, every 1% growth increase in GDP resulted in addition of employment of 410 th people

1.13
3.05
3.88
9.27
-8
-6
-4
-2
0
2
4
6
8
10
12
14
16
18
20
0
5
10
15
20
Jul-1
0
Nov
-10
Mar
-11
Jul-1
1
Nov
-11
Mar
-12
Jul-1
2
Nov
-12
Mar
-13
Jul-1
3
Nov
-13
Mar
-14
Jul-1
4
Nov
-14
Mar
-15
Jul-1
5
Nov
-15
Mar
-16
Jul-1
6
Nov
-16
Mar
-17
Jul-1
7
Volatile Food (LHS) Core Inflation (RHS) Headline Inflation (RHS) Administered (RHS)
Source: BPS
(%) (%) Inflation by components
Core Inflation remained subdued a weak domestic demand

(4.68)
(2.4)
-14
-12
-10
-8
-6
-4
-2
0
2
4
6
8
1Q
13
3Q
13
1Q
14
3Q
14
1Q
15
3Q
15
1Q
16
3Q
16
1Q
17
Goods Services
Primary Income Secondary Income
CAD
16.0%
27.9%
-17.2%
-30%
-20%
-10%
0%
10%
20%
30%
-0.7
-0.2
0.3
0.8
1.3
1.8
Jul-
15
Sep
-15
No
v-1
5
Jan
-16
Mar
-16
May
-16
Jul-
16
Sep
-16
No
v-1
6
Jan
-17
Mar
-17
May
-17
Tho
usa
nd
s
Trade balance (USD bn)-LHS
Export growth-RHS
Import growth-RHS
-0.99 -0.87
-1.9
BOP (USD bn) Trade Balance
CAD to GDP ratio improved since 3Q16-1Q17 from -1.9 to
0.99%
Part of it because weakening imports
Current account deficit improved since 2014, but ….
But the improvement was also because of weakening imports of capital goods
Import Growth (% YoY)
% to GDP
13.76 17.34
(1.93)
(60)
(40)
(20)
-
20
40
60
Jun
-14
Sep
-14
De
c-1
4
Mar
-15
Jun
-15
Sep
-15
De
c-1
5
Mar
-16
Jun
-16
Sep
-16
De
c-1
6
Mar
-17
Jun
-17
Consumption Raw materials
Capital goods
Imports of capital goods and raw materials weakened
sharply
Source : BPS

4.0%
4.5%
5.0%
5.5%
6.0%
6.5%
-20%
-10%
0%
10%
20%
30%
40%
Mar
-12
Jul-
12
No
v-1
2
Mar
-13
Jul-
13
No
v-1
3
Mar
-14
Jul-
14
No
v-1
4
Mar
-15
Jul-
15
No
v-1
5
Mar
-16
Jul-
16
No
v-1
6
Mar
-17
VAT Growth GDP growth
629 676 760 752
865 893
Jun-12 Jun-13 Jun-14 Jun-15 Jun-16 Jun-17
72 79 84 78
139 145
Jun-12 Jun-13 Jun-14 Jun-15 Jun-16 Jun-17
GDP growth and value added tax growth
6M accumulation of government spending
6M accumulation of material and capital expenditure
Government spending realization (IDR tn)
Value added tax growth is in the process of returning to its normal pattern, and government capital expenditures jumped since last year
Source : BPS
21.2% 22.7%
23.6%
15.1%
27.2% 29.5%
% of budget
% of budget
40.7%
39.2%
40.5% 37.9%
41.5% 42.9%
Abnormal pattern due to “ijon”

Selected Indicators of the Real Sector (some Micro-data)
11
Agriculture, Forestry and Fishing
Mining and Quarrying
Manufacturing
Electricity and Gas
Water supply, Sewerage, Waste Management and Remediation
Activities
Construction
Wholesale and Retail Trade, Repair of Motor Vehicle
and Motorcycles
Transportation and Storage
Accommodation and Food Service Activities
Information and Communication
Financial and Insurance Activities
Real Estate Activities
Business Activities
Public Administration and Defence, Compulsory Social
Security
Education
Human Health and Social Work Activities
Other Services Activities
-2%
0%
2%
4%
6%
8%
10%
12%
-5% 0% 5% 10% 15% 20% 25%
12
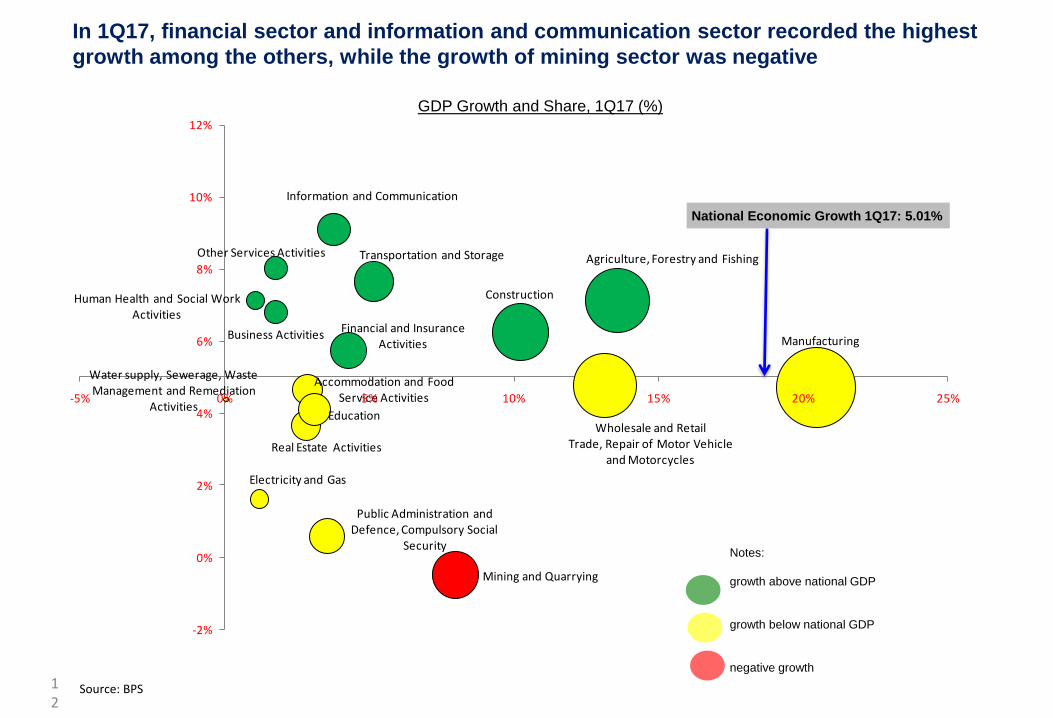
In 1Q17, financial sector and information and communication sector recorded the highest growth among the others, while the growth of mining sector was negative
GDP Growth and Share, 1Q17 (%)
Source: BPS
Notes: growth above national GDP growth below national GDP negative growth
National Economic Growth 1Q17: 5.01%

Agriculture, Forestry & Fishing Mining & Quarrying
Manufacturing
Electricity & Gas
Water Supply, Sewerage, Waste Management & Remediation
Construction
Wholesale & Retail Trade, Repair of motor vehicles
Transportation & Warehousing
Accommodation & Food Service
Information & Communication
Financial & Insurance
Real Estate
Business Activities
Public Adm. & Defence, Compulsory Social Securities
Education
Human Health & Social Work Activities
Other Service Activities
-6
-4
-2
0
2
4
6
8
10
12
14
-5 0 5 10 15 20 25
Gro
wth
, % y
oy
Share Nominal (%) 13
In 2Q2017, information and communication sector recorded the highest growth among the others, while the growth of electricity & gas sector and public administration are the lowest (negative growth)
GDP Growth and Share, 2Q2017 (%)
Source: BPS
Notes: growth above national GDP growth below national GDP negative growth
National Economic Growth 2Q2017:5.01%

Agriculture, Forestry & Fishing
Mining and Quarrying
Manufacturing
Electricity & Gas
Water Supply, Sewerage, Waste Management & Remediation
Construction
Wholesale & Retail Trade, Repair of motor vehicles
Transportation & Warehousing
Accommodation &Food Service
Information & Communication
Financial & Insurance
Real Estate
Business Activities
Public Adm. & Defence, Compulsory Social Securities
Education
Human Health & Social Work Activities
Other Service Activities
-2
0
2
4
6
8
10
12
-5 0 5 10 15 20 25
Gro
wth
, % y
oy
Share Nominal (%) 14
In 1H2017, information and communication sector recorded the highest growth among the others, while the growth of electricity and gas sector is the lowest
GDP Growth and Share, 1H2017 (%)
Source: BPS
Notes: growth above national GDP growth below national GDP negative growth
National Economic Growth 1H2017:5.01%

15
Economic Growth by Sector
Sector (%, YoY) 2011 2012 2013 2014 2015 2016 1Q17 2017F
Agriculture, Livestock, Forestry and Fisheries 4.0 4.6 4.2 4.2 3.8 3.3 7.1 4.1
Mining and Quarrying 4.3 3.0 1.7 0.4 -3.4 1.1 -0.5 0.5
Manufacturing Industries 6.3 5.6 4.5 4.6 4.3 4.3 4.2 4.8
Electricity and Gas 5.7 10.1 5.2 5.9 0.9 5.4 1.6 6.4
Water Supply, Waste Treatment and Recycle 4.7 3.3 4.1 5.2 7.1 3.6 4.4 3.5
Construction 9.0 6.6 6.1 7.0 6.4 5.2 6.3 6.7
Wholesale and Retail Trade, Repair of Motor Vehicle and Motorcycles 9.7 5.4 4.7 5.2 2.6 3.9 4.8 4.2
Transportation and Storage 8.3 7.1 8.4 7.4 6.7 7.7 7.6 7.8
Accommodation, Food and Beverages Supply 6.9 6.6 6.8 5.8 4.3 4.9 4.7 5.4
Information and Communication 10.0 12.3 10.4 10.1 9.7 8.9 9.1 9.5
Insurance and Financial Service 7.0 9.5 9.1 4.7 8.6 8.9 5.7 9.0
Real Estate 7.7 7.4 6.5 5.0 4.1 4.3 3.7 4.5
Company Services 9.2 7.4 7.9 9.8 7.7 7.4 6.8 7.7
Gov't Administration, Defense, Social Security 6.4 2.1 2.4 2.4 4.6 3.2 0.6 4.5
Education Service 6.7 8.2 8.2 5.5 7.3 3.8 4.1 4.7
Health and Social Services 9.3 8.0 7.8 8.0 6.7 5.0 7.1 6.8
Other Services 8.2 5.8 6.4 8.9 8.1 7.8 8.0 8.0
Gross Domestic Product (GDP) 6.2 6.0 5.6 5.0 4.9 5.0 5.0 5.1

Sectoral sales performance: Slow recovery
16
Sector
Indicator
Growth (% yoy) Growth Jun-17
(%mom) Cum 1H17
Cum 1H16
Jun-17
May-17
Jun-16
2016 2015
Retail1
Ramayana sales (IDR)
14.2 27.0 30.1 7.2 97.7 5.8 -2.0 200.1
Ace Hardware sales (IDR)
17.2 6.4 32.2 17.1 14.7 4.8 4.7 17.4
Automotive2
Total car sales (Unit)
0.3 1.3 -27.4 5.9 11.3 4.9 -16.1 -29.2
Commercial vehicle (Unit)
8.4 -29.0 2.9 46.3 -
32.0 -27.4 -15.8 -32.3
Passenger vehicle (Unit)
-1.7 12.7 -32.7 -1.7 25.1 17.0 -
16.2 -28.3
Total motorcycle sales (Unit)
-8.9 -6.7 -26.9 15.2 -9.7 -8.5 -17.6 -28.6
Property3
Total marketing sales of eight companies (IDR)
1.3 -39.6 -34.2 7.0 n.a. -10.0 -4.3 -41.5
Cement4
Total sales (Ton)
-1.3 2.7 -26.8 7.0 1.4 -0.6 3.5 -31.9
Heavy Equipment
5
Total sales (Unit)
69.6 -24.7 49.4 68.7 16.8 2.7 -39.5 -12.9
Agro segment (Unit)
121.6 -46.8 161.5 473.6 -
58.4 -26.7
-
63.2 -28.3
Construction segment (Unit)
-25.7 19.9 70.8 -55.9 -
10.3 31.2
-
22.3 22.9
Forestry segment (Unit)
61.5 -48.3 49.4 5.4 -
30.7 -31.5 -9.3 -12.9
Mining segment (Unit)
267.6 -45.1 29.1 367.8 5.6 6.2 -
49.9 -18.6
Sea Transport6
Loading and unloading activities in the five main ports (Ton)
2.0 a)
-3.3b)
11.2
c)
9.3d)
-7.3
e)
-1.3 -8.2 7.4 c)
CPO6
Volume of exports (Ton)
5,3 a)
-11,3
b)
4,1 c)
-
15,0d)
-24,2
e)
-14,0 -10,1 7,2 c)
Value of exports (USD)
29,0
a)
-18,4
b)
6,8 c)
-5,1d)
-
18,6
e)
-6,60
-23,2
3,7 c)
Coal6
Volume of exports (Ton)
8,5 a)
-9,7 b)
8,1 c)
16,8d)
-4,1
e)
0,5 -10,1 -5,3 c)
Value of exports (USD)
52,2
a)
-28,3
b)
60,9
c)
67,2d)
-
25,2
e)
-9,3 -
23,2 -3,1
c)
Notes : a) Jan-May 2017, b) Jan-May 2016, c) May 2017, d)Apr 2017, e) May 2016 Sources: 1) ACE Hardware and Ramayana; 2) CEIC and Gaikindo; 3) Mansek; 4) Kementerian Perindustrian, Kementerian Perdagangan, and ASI. The data are still preliminary; 5) United Tractor; 6) BPS

17
Labor & natural resource industries have a down trend growth; Domestic market industries have an increasing trend growth
Source: BPS
No Industri Proporsi (%) Pertumbuhan (%,YoY)
2014 2015 2016 1Q17 2014 2015 2016 1Q17
1 Batubara dan Pengilangan Migas 11.7 11.1 11.0 11.7 -2.1 -1.1 3.2 0.3
2 Makanan dan Minuman 27.1 28.0 29.1 29.0 9.5 7.5 8.5 8.1
3 Pengolahan Tembakau 4.3 4.3 4.2 4.5 8.3 6.2 1.6 2.9
4 Tekstil dan Pakaian Jadi 6.3 5.8 5.5 5.4 1.6 -4.8 -0.1 0.0
5 Kulit, Barang dari Kulit dan Alas Kaki 1.2 1.2 1.3 1.4 5.6 4.0 8.2 7.4
6 Kayu, Barang dari Kayu dan Gabus dan Barang Anyaman dari Bambu, Rotan dan Sejenisnya
3.3 3.1 3.1 3.1 6.1 -1.6 1.8 -2.2
7 Kertas dan Barang dari Kertas; Percetakan dan Reproduksi Media Rekaman 3.8 3.6 3.6 3.5 3.6 -0.2 2.2 4.7
8 Kimia, Farmasi dan Obat Tradisional 8.3 8.5 8.6 8.8 4.0 7.6 5.5 8.3
9 Karet, Barang dari Karet dan Plastik 3.9 4.0 3.5 3.5 1.2 5.0 -8.3 7.5
10 Barang Galian bukan Logam 3.4 3.4 3.5 3.4 2.4 6.0 5.5 3.7
11 Logam Dasar 3.9 4.0 3.8 3.5 6.0 6.2 0.8 -3.0
12 Barang Logam; Komputer, Barang Elektronik, Optik dan Peralatan Listrik 9.6 10.0 10.0 9.4 2.9 7.8 4.3 2.6
13 Mesin dan Perlengkapan 1.4 1.5 1.5 1.6 8.7 7.6 5.1 3.5
14 Alat Angkutan 9.6 9.4 9.4 9.1 4.0 2.4 4.5 2.7
15 Furnitur 1.3 1.3 1.2 1.3 3.6 5.2 0.5 3.9
16 Pengolahan Lainnya; Jasa Reparasi dan Pemasangan Mesin dan Peralatan 0.9 0.9 0.8 0.8 7.7 4.7 -2.9 -0.4
Total 100.0 100.0 100.0 100.0 4.6 4.3 4.3 4.2
18
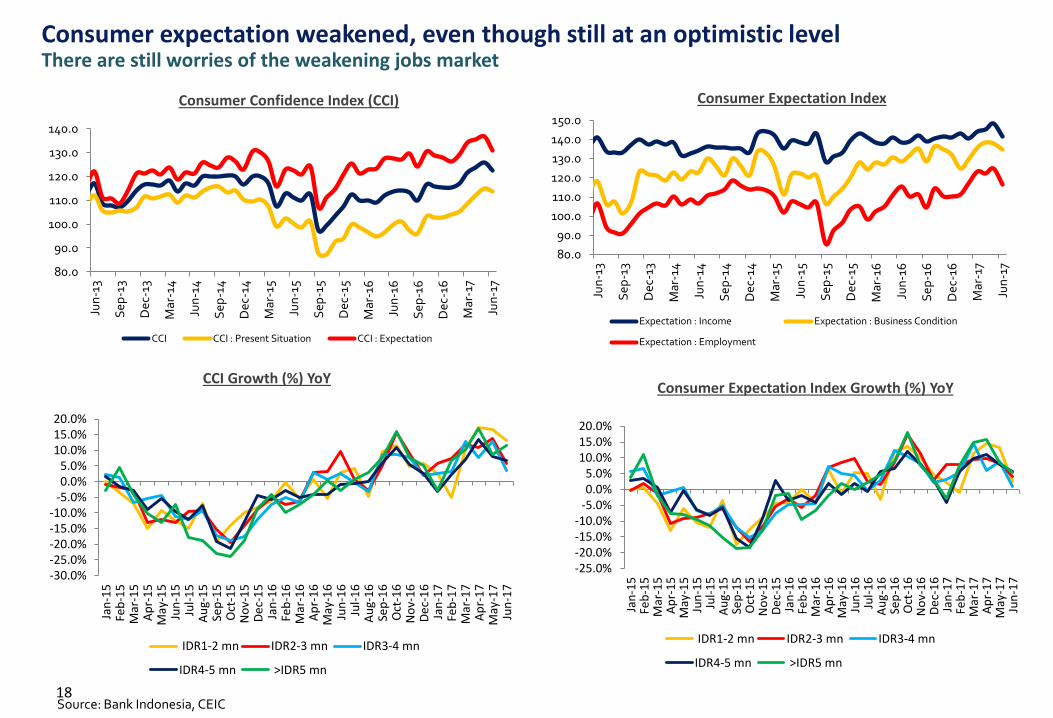
Consumer Expectation Index Growth (%) YoY CCI Growth (%) YoY
Consumer Confidence Index (CCI) Consumer Expectation Index
Source: Bank Indonesia, CEIC
Consumer expectation weakened, even though still at an optimistic level There are still worries of the weakening jobs market
80.0
90.0
100.0
110.0
120.0
130.0
140.0
Jun
-13
Sep
-13
Dec
-13
Mar
-14
Jun
-14
Sep
-14
Dec
-14
Mar
-15
Jun
-15
Sep
-15
Dec
-15
Mar
-16
Jun
-16
Sep
-16
Dec
-16
Mar
-17
Jun
-17
CCI CCI : Present Situation CCI : Expectation
80.0
90.0
100.0
110.0
120.0
130.0
140.0
150.0
Jun
-13
Sep
-13
Dec
-13
Mar
-14
Jun
-14
Sep
-14
Dec
-14
Mar
-15
Jun
-15
Sep
-15
Dec
-15
Mar
-16
Jun
-16
Sep
-16
Dec
-16
Mar
-17
Jun
-17
Expectation : Income Expectation : Business Condition
Expectation : Employment
-30.0%-25.0%-20.0%-15.0%-10.0%
-5.0%0.0%5.0%
10.0%15.0%20.0%
Jan
-15
Feb
-15
Mar
-15
Ap
r-1
5M
ay-1
5Ju
n-1
5Ju
l-1
5A
ug-
15
Sep
-15
Oct
-15
No
v-1
5D
ec-
15
Jan
-16
Feb
-16
Mar
-16
Ap
r-1
6M
ay-1
6Ju
n-1
6Ju
l-1
6A
ug-
16
Sep
-16
Oct
-16
No
v-1
6D
ec-
16
Jan
-17
Feb
-17
Mar
-17
Ap
r-1
7M
ay-1
7Ju
n-1
7
IDR1-2 mn IDR2-3 mn IDR3-4 mn
IDR4-5 mn >IDR5 mn
-25.0%-20.0%-15.0%-10.0%
-5.0%0.0%5.0%
10.0%15.0%20.0%
Jan
-15
Feb
-15
Mar
-15
Ap
r-1
5M
ay-1
5Ju
n-1
5Ju
l-1
5A
ug-
15
Sep
-15
Oct
-15
No
v-1
5D
ec-
15
Jan
-16
Feb
-16
Mar
-16
Ap
r-1
6M
ay-1
6Ju
n-1
6Ju
l-1
6A
ug-
16
Sep
-16
Oct
-16
No
v-1
6D
ec-
16
Jan
-17
Feb
-17
Mar
-17
Ap
r-1
7M
ay-1
7Ju
n-1
7
IDR1-2 mn IDR2-3 mn IDR3-4 mn
IDR4-5 mn >IDR5 mn

Groceries growth has decreased, which may reflect that the low income group has weaker purchasing power
19

20
Again, retail and food industries have a decreasing ternd, which may reflect that the low income group has weaker purchansing power

5.8
27.0
14.2
5.8 5.0
9.7
2016 1H16 1H17
RALS RALS_sa
4.8 6.4
17.2
5.2 5.2
15.5
2016 1H16 1H17
ACES ACES_sa
Ramayana Semi Annualy Sales growth (%)
ACE Hadware Semi Annualy Sales growth (%)
Furniture and householdappliances
Televisi, radio andelectrionics appliance
Computer andcommunication
apparatus
(Rp
Tri
llio
n)
2012 2013 2014 2015 2016 Jun-17
13
2.7
13
3.5
14
5.6
13
5.7
15
8.4
14
1.4
Volume (in Million Transaction) Value (in Trillion Rupiah)
2011 2012 2013 2014 2015 2016 1H15 1H16 1H17
Growth of Consumer Loan for Household Apparatus The use of Credit Card to Purchase
The sales performance of the retail companies for middle and high income groups shows mix results
Source : Companies, Bank Indonesia

-30
-20
-10
0
10
20
30
40
50
60
70
0
200
400
600
800
1,000
1,200
1,400
20
08
20
09
20
10
20
11
20
12
20
13
20
14
20
15
20
16
1H
16
1H
17
%
Tho
usa
nd
un
its
Car Sales Growth Seasonal adjusted growth
-20
-15
-10
-5
0
5
10
15
20
25
30
0
1
2
3
4
5
6
7
8
9
20
08
20
09
20
10
20
11
20
12
20
13
20
14
20
15
20
16
1H
16
1H
17
%
Mill
ion
un
its
Motorcycle Sales Growth Seasonal adjusted growth
Car Sales Growth
Motorcycle Sales Growth
Car and motorcycle sales growth weakened in 1H17 Room for motorcycle sales growth in Indonesia may be tighter as 71% households have already motorcycles
Source : Astra, Gaikindo

23
9.5
18.0
6.6
1.4
-3.4
23.9 21.6
2.2
5.3
18.0
37.3
23.7
14.7
21.5
13.6
-10.0
-5.0
0.0
5.0
10.0
15.0
20.0
25.0
30.0
35.0
40.0
1H13 1H14 1H15 1H16 1H17
MPPA sales growth ACES sales growth AMRT sales growth
MPPA operating margin ACES operating margin AMRT operating margin
More details on the sales growth and operating margin (%) of retail selected companies: weakening

More details on the tales growth and operating margin (%) of food & beverages selected companies: weakening
24
9.5
17.0
3.7 4.4 4.6
24.7
12.7 14.8
5.1
0.9
23.9
29.4
13.6 14.8
-0.8
-10.0
0.0
10.0
20.0
30.0
40.0
50.0
1H13 1H14 1H15 1H16 1H17
INDF sales growth ULTJ sales growth ROTI sales growth
INDF operating margin ULTJ operating margin ROTI operating margin

Sales growth and operating margin (%) of pharmacy selected companies: also weakening
25
18.9
12.9
4.1
9.6
5.3
3.0
8.7
10.6
17.0
-1.9
9.9 9.1 11.0
18.1
5.8
-5.0
0.0
5.0
10.0
15.0
20.0
1H13 1H14 1H15 1H16 1H17
KLBF sales growth TSPC sales growth KAEF sales growth
KLBF operating margin TSPC operating margin KAEF operating margin

26
9.4
16.1
7.7
1.5
-1.0
17.2
12.9
2.4
11.7
4.3
-5.0
0.0
5.0
10.0
15.0
20.0
1H13 1H14 1H15 1H16 1H17
TGKA sales growth EPMT sales growth
TGKA operating margin EPMT operating margin
Sales growth and operating margin (%) of wholesale selected companies: also weakening

2.9
7.0
1.7 1.1 1.5
0.2 0.7 0.7 0.7 0.7
21.0
6.6
4.0
1.8 1.6 1.5 1.0 0.4 0.8 0.4
-
5.0
10.0
15.0
20.0
25.0
PT PP Exelcomindo BCA Indocement PP Properti Ciputra PerdanaGapura
Mayora SawitSumbermas
BumiResources
MNC
Capex 1H16 Capex 1H17IDR tn
Construction Telco Bank Cement Property
Company
Sector Consumer
Goods CPO Coal Media
+ 637%
-6% yoy
+ 6% + 45% + 85%
+ 54% -47% + 20% -47%
Source : Kontan
The realization of private sector capital expenditure remained weak in 1H17 Companies are still cautious as demand is still weak

An Update on Purchasing Power
28

Household expenditure growth has a decreasing trend, while the younger people proportion is also decreasing
29

Real income of low income group decreases, which implies a weakening purchasing power.
30
Source: BPS

Unfortunately, food subsidy delivery is late making the low income group worse
31

32
Meanwhile, the middle up to high income groups are postponing their spending because consumer confidence is declining

Selected Indicators of the Banking Sector
33

Source : Indonesian banking statistic
Loan growth decelerated while deposit growth increased in May-17 LDR and LFR decreased in May-17, suggesting a better liquidity
Loan and deposit growth Loan to deposit ratio (%) Loan to funding ratio (%)
8.71%
11.18%
3%
6%
9%
12%
15%
18%
21%
24%
May
-13
Sep
-13
Jan
-14
May
-14
Sep
-14
Jan
-15
May
-15
Sep
-15
Jan
-16
May
-16
Sep
-16
Jan
-17
May
-17
Loan growth (YoY %)
Deposit growth (YoY %)
91.5
89.1
88.3 Ju
n-1
6
Jul-
16
Au
g-16
Sep
-16
Oct
-16
No
v-16
Dec
-16
Jan
-17
Feb
-17
Mar
-17
Ap
r-17
May
-17
87.6
86.9
Jun
-16
Jul-
16
Au
g-16
Sep
-16
Oct
-16
No
v-16
Dec
-16
Jan
-17
Feb
-17
Mar
-17
Ap
r-17
May
-17

NPL Stable in May 17 at 3.07%
35
Non Performing Loans Credit quality (IDR tn)
Source : Indonesian banking statistic, as of May 2017
Special mention fell to IDR219 tn (vs IDR234tn in April 2017)
NPL + special mention
3.07%
1.5%
1.7%
1.9%
2.1%
2.3%
2.5%
2.7%
2.9%
3.1%
3.3%
3.5%
May
-13
Sep
-13
Jan
-14
May
-14
Sep
-14
Jan
-15
May
-15
Sep
-15
Jan
-16
May
-16
Sep
-16
Jan
-17
May
-17
8.0%
4.5%
5.0%
5.5%
6.0%
6.5%
7.0%
7.5%
8.0%
8.5%
9.0%
May
-13
Sep
-13
Jan
-14
May
-14
Sep
-14
Jan
-15
May
-15
Sep
-15
Jan
-16
May
-16
Sep
-16
Jan
-17
May
-17
234.4 219.8
150
200
250
300
350
400
May
-16
Jun
-16
Jul-
16
Au
g-1
6
Sep
-16
Oct
-16
No
v-1
6
De
c-1
6
Jan
-17
Feb
-17
Mar
-17
Ap
r-1
7
May
-17
Special mention Sub-standard
Doubtful Loss

7.48%
3.39%
4.02%
4.42%
4.97%
0.0%
1.0%
2.0%
3.0%
4.0%
5.0%
6.0%
7.0%
8.0%
% N
PL
Agriculture
Mining
Manufacturing
Utilities
Construction
Trade, Hotel, Restaurant
Transportation andTelecommunication
Business Services
Social Services
Consumption Credit
NPLs in Mining, Transportation and Trade-hotel & restaurant are still high
Source: OJK
NPLs by Sector

High NPLs found in Kaltim, Papua Barat, dan Papua
13 August 2017 37
NPL (%) Credit Growth (%) Kredit Value (Rp Triliun)
0.8%
1.4%
1.4%
1.6%
1.6%
1.6%
1.7%
2.1%
1.9%
2.3%
2.3%
2.6%
2.5%
2.3%
2.5%
2.8%
2.6%
3.0%
2.1%
2.6%
2.9%
2.7%
2.9%
2.7%
2.8%
3.4%
3.6%
3.2%
3.4%
3.4%
3.4%
4.5%
4.3%
7.3%
2.9%
0.8%
1.5%
1.5%
1.7%
1.8%
1.8%
1.8%
2.1%
2.3%
2.4%
2.6%
2.7%
2.7%
2.7%
2.8%
2.9%
2.9%
2.9%
3.0%
3.0%
3.1%
3.2%
3.2%
3.3%
3.3%
3.5%
3.6%
3.6%
3.6%
3.8%
3.9%
5.2%
5.4%
9.0%
3.1%
Lainnya
Sulawesi Barat
Kalimantan Tengah
Bengkulu
Maluku
Nusa Tenggara Barat
Maluku Utara
Banten
Kepulauan Riau
Sulawesi Selatan
D.I Yogyakarta
Aceh
Lampung
Nusa Tenggara Timur
Sumatera Utara
Sumatera Barat
Jambi
DKI Jakarta
Bali
Jawa Timur
Kalimantan Selatan
Sulawesi Tengah
Kalimantan Barat
Sulawesi Tenggara
Jawa Tengah
Bangka Belitung
Jawa Barat
Sumatera Selatan
Riau
Gorontalo
Sulawesi Utara
Papua
Papua Barat
Kalimantan Timur
Nasional
Apr-17
2016
13.6%
23.6%
9.1%
10.8%
10.6%
30.9%
12.7%
16.0%
5.4%
9.3%
10.2%
10.0%
7.5%
12.4%
5.4%
7.6%
6.7%
6.8%
9.9%
6.8%
8.6%
11.3%
16.2%
13.5%
9.4%
12.6%
9.1%
9.2%
3.4%
7.5%
6.4%
9.4%
19.2%
0.9%
7.9%
-22.7%
20.9%
17.4%
9.2%
8.8%
24.9%
12.0%
6.6%
3.5%
8.2%
12.8%
11.6%
7.8%
12.8%
10.8%
6.7%
4.3%
11.7%
10.0%
5.8%
11.0%
11.3%
11.4%
10.2%
9.7%
13.1%
9.1%
9.1%
3.1%
7.8%
7.5%
7.1%
13.7%
2.3%
9.5%
55
6
20
16
9
31
6
113
34
104
30
30
45
22
188
44
31
2,117
67
399
43
23
44
18
236
11
364
71
58
10
31
24
10
68
4,377
54
6
22
16
9
31
7
113
33
105
31
31
45
22
191
45
31
2,114
68
389
45
24
44
19
240
10
369
71
58
10
32
24
10
67
4,386

38
579
584
619
717
1,016
1,093
1,744
1,956
4,913
8,175
8,329
9,773
BNLI
BJTM
BTPN
BJBR
BBTN
BNGA
BDMN
PNBN
BBNI
BMRI
BBCA
BBRI
22
6
4
9
86
33
26
14
10
9
7
BJTM
BTPN
BJBR
BBTN
BNGA
BDMN
PNBN
BBNI
BMRI
BBCA
BBRI
Net profit (IDR bn) Net profit growth (% yoy)
Average net profit growth : 16% (yoy)
916
1,023
1,157
1,611
1,717
1,994
2,980
3,106
9,337
10,837
16,015
21,938
BJTM
BJBR
BTPN
BBTN
BNLI
PNBN
BDMN
BNGA
BBNI
BBCA
BMRI
BBRI
4
1
4
11
13
7
3
19
18
1
10
24
BJTM
BJBR
BTPN
BBTN
BNLI
PNBN
BDMN
BNGA
BBNI
BBCA
BMRI
BBRI
PPOP (IDR bn) PPOP growth (% yoy)
Average PPOP growth : 13% (yoy)
112
122
284
320
498
692
848
1,008
1,648
3,143
5,864
10,000
BJBR
BJTM
BBTN
BTPN
BBCA
PNBN
BDMN
BNLI
BNGA
BBNI
BMRI
BBRI
52
-43
-9
5
-65
-20
-33
-60
-10
20
9
36
BJBR
BJTM
BBTN
BTPN
BBCA
PNBN
BDMN
BNLI
BNGA
BBNI
BMRI
BBRI
Provision expense (IDR bn) Provision growth (% yoy)
3.5
4.2
4.3
5.5
5.6
5.6
6.1
6.7
7.2
7.8
7.9
9.6
BNLI
BBTN
PNBN
BMRI
BBNI
BNGA
BBCA
BJBR
BDMN
BJTM
BBRI
BTPN
Net interest margin (%)
5M17 banks performances Weak loan growth and lower NIM compensated by lower provisioning charges
Source : Companies, Mandiri Sekuritas

Policy Recommendations
39

Rekomendasi Kebijakan
1. Penerapan anti-cyclical policy dengan mengefektifkan penerimaan dan belanja negara (APBN) balancing long-run spending push with short-run ones. 2. Mengisi program inter-connnectivity dengan kebijakan meningkatkan industri (industrial policies) yang memperhatikan sisi spatial yang ada.
1. Percepatan pelaksanaan secara efektif sistem voucher untuk program subsidi makanan bagi maskarakat kelompok miskin
2. Menciptakan proyek-proyek padat karya, terutama proyek-proyek yang dibiayai pemerintah (misalnya proyek infrastruktur) agar lebih bisa menyerap tenaga kerja lebih banyak (labor intensive).
3. Tax incentives untuk mendorong sektor industri, terutama sektor industri padat karya dan industri skala menengah-kecil.
4. Penggunaan Dana Desa secara optimal untuk mendorong ekonomi lokal pedesaan sekaligus menciptakan lapangan kerja di desa.
Kebijakan umum:
Kebijakan khusus:

The end of slide Thank you
41