Embed Size (px)
Citation preview
PERCEPTUAL RIGIDITY: AN EXPERIMENTWITH THE RORSCHACH TEST AND
THE AUTOKINETIC EFFECT
By
LOUIS WILLIAM BOVA, JR.
A DISSERTATION PRESENTED TO THE GRADUATE COUNQL OFTHE UNIVERSITY OF FLORIDA
IN PARTIAL FULFILLMENT OF THE REQUIREMENTS FOR THEDEGREE OF DOCTOR OF PHILOSOPHY
UNIVERSITY OF FLORIDA
June, 1958

3 1262 08552 2125

ACKNOVLKDGMEMTS
The author vlshes to express bis very sincere appreciation
to Dr. E. P. Home, Chalnaan of the Supervisory Conmlttee, for his
able and ready assistance in the formulatioa and direction of this
study.
Thanks are also due to the other members of the advisory
committee. Dr. J. C. Dixon, Dr. B. D. Hinckley, Dr. H. H. Ehrmann,
and Dr. H. tfunderlich, for their continued Interest and guidance.
11

TABLE OF CONTENTS
Page
ACKNOWLEDGMENTS ii
LIST OF TABLES AND FIGURES Iv
Chapter
I. INTRODUCTION I
II. PROCEDURE AND APPARATUS 6
III. RESULTS 13
IV. CONCLUSIONS AND SUMMARY 18
APPENDIX A 22
REFERENCES 25
ill

LIST OF TABLES AND FIGURES
Table Page
!• Intercorrelatlons Aai^ng Rigidity Scores, AutoklnetlcMovement Scores, azkl Reaction Tines for the NormalSaoiple . . . . , 14
2. Intercorrelatlons Amoog Rigidity Scores, AutokliietlcHoveinent Scores, and Reaction Tioies for the BrainDasaaged Sample 14
3. Correlations Between Ages and Rigidity Scores forthe Normal and Brain Damaged Samples 16
4. Correlations Between Ages and Autoklnetlc MovementScores for the Normal and Brain Damaged Samples ... 16
5. Mean Differences Between Samples for RigidityScores , and Autoklnetlc Movement Scores 17
Figure
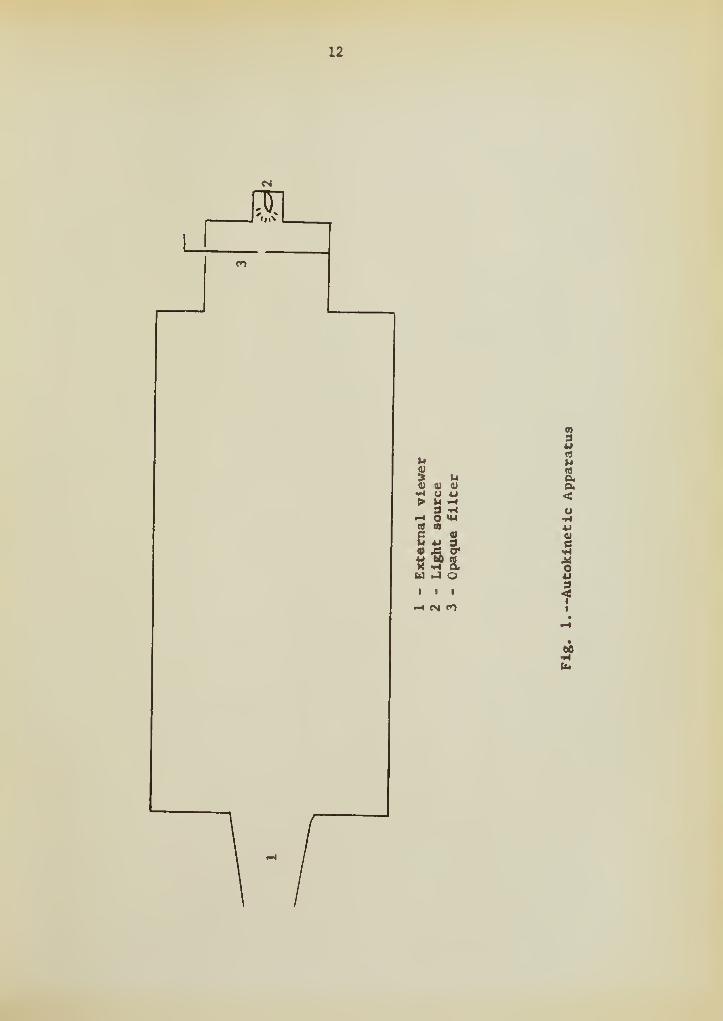
1. Autoklnetlc Apparatus 12
!
CHAPTER I
INTRODUCTION
The purpose of this study is to exasiine the relationship
between two measures of rigidity: (I) a measure which nay be de-
rived from the perceptual responses to the Rorschach test, and
(2) a measure based on the perceptual responses to the autokinetic
phenomenon.
The definition and measurement of "rigidity" have been
handled in a number of different ways as evidenced by a review of
the literature (3, 6, 11). One definition is that it is a reduction
and/or loss of perceptions and ideas as a result of the organism's
attempt to control overwhelming feelings of anxiety. Rigidity,
therefore, can be measured by a person's responses to various per-
ceptual tasks. Fisher (7) has developed such a measure for the
Rorschach test. This measure will be used in this study.
It is a technique whereby the perceptual responses to the
Rorschach test can be described along a continuum of rigidity such
that the lower the score the less the manifestation of the trait.
This in turn can be related to the autokinetic effect when it is
measured by the movement traced by the observer in reporting his
autokinetic experience. A limited expression, i.e., low score, of
perceived movement reflects a greater degree of rigidity than an
extensive perception of movement or high score.

The specific hypotheses proposed to examine the relationship
between these specific expressions of rigidity are:
1. Those subjects who express a greater aaiount of rigidity
on the Rorschach test will perceive a correspondingly
snaller amount of autokinetic nvovement.
2. Those subjects who express a greater amount of
rigidity on the Rorschach test will show a corres-
pondingly greater reaction time between the presen-
tation of the autokinetic stimulus and the perception
of movement.
3. Those subjects who express a greater amount of auto-
kinetic movement will have a correspondingly shorter
reaction time between the perception of the autokinetic
stimulus and their perception of movement.
A review of the literature provides limited evidence which
supports the conceptualization and feasibility, although not the
validity, of these hypotheses. And, although the contents of the
investigations are somewhat related to one another, three main areas
or purposes may be highlighted as they pertain to this study. Thus,
the first type of study provides evidence that there is consistency
la an Individual's behavior such that we expect a rigid subject to
respond to similar situations in rigid ways. The second kind of
investigation provides evidence that the Rorschach test Is a suit*
able measure of rigidity; and the third area of experimentation
supplies evidence that the autokinetic phenomenon is a sensitive

effect such that it can be expected to reflect differences and
variations in rigidity.
Klein and Schlesinger (10) conducted a study to determine
the consistency of behavior by investigating the difference in the
ability of two groups to perceive apparent movetnent. One group was
characterized as being stimulus bound and the second as completely
opposite in nature, i.e., flexible. Both groups were selected on
the basis of the individuals' Rorschach protocols; the analysis of
the data indicated that both groups exhibited consistent behavior.
The constricted stimulus bound members were unable to perceive
apparent movement over as wide a range of frequencies or stimulus
configurations as were the members of the flexible group.
Johnson and Stern (9) also oriented their research directly
at the concept: ". . .a contribution to the validation of one of
the basic tenets of such theories of personality, namely, that a
person will respond in a relatively constant manner to different
perceptual situations." The procedure they followed was to select
a rigid and a labile group on the basis of Fisher's rigidity scale
for the Rorschach test. They then compared the two groups'
responses to intermittent photic stimulation. The conclusion
reached was: "... individuals who respond in a perceptually rigid
manner in one task will respond in a like manner to a different
perceptual situation. The one factor that both have in common is
that they are ambiguous perceptual situations."

The development of Fisher's technique for measuring rigidity
on the Rorschach test follows from clinical usage and various investi-
gations by others in the field (5, 8, 12, 14). The scale includes
a nusgiber of ratios and "signs" which have been weighted to provide
an overall score reflecting the degree of rigidity expressed. Since
his publication of the scale it has been used in a variety of investi-
gatlons which desoonstrate its acceptance as a valid instrument.
DeVos (4), for example, used it in his study of the acculturation of
the Japanese American. In the study he selected various levels of
acculturation and found that he was able to distinguish these on the
basis of their Fisher rigidity scores.
Becker (2) also used Fisher's rigidity scoring method in a
study directed at showing the relationship between the perception of
distortion from aniseikonic lenses and the degree of rigidity mani-
fested by normal male and female subjects. He hypothesized that
individuals who take a longer tine to see the effect and/or report
less distortion will reveal a greater amount of rigidity. The
hypothesis was supported by the results of the investigation.
The sensitivity of the autokinetlc phenomenon to various
personality characteristics has been established by many investi-
gations. Young and Gaier (18), for exas^le, conducted an investi-
gation concerned with the autokinetlc phenomenon as a means of pre-
dicting the difference between suggestible and non-suggestible
subjects. The two groups of ten subjects each were selected on the
basis of their answers to the Bemreuter Personality Inventory,
scales B3-I, B2-S, B4-D, and the Hysteria scale of the MMPI. The
results o£ the investigation indicated that there was a statistically
significant difference in the amount of autokinetic effect perceived
by the tvo groups. The suggestible group experienced nore novenent.
A related study was carried out by Rechtschaffen and Hednlck
(13). Although they were concerned with the application of the
pbenooenon as a projective technique for personality testing, they
did deiBonstrate the influence of suggestion or set. Nine subjects
were told that the experiment was concerned with the perception of
words being written by the light. All of the subjects reported the
perception of words, many of which were enotionally toned and
relevant to the Individual's personality characteristics.
The most extensive investigation of the sensitivity of the
phenomenon to personality characteristics was carried out by Voth
(17). Some 845 psychiatric patients were tested and the results
indicated that the phenomenon is more pronounced in schizophrenia,
epilepsy, psychasthenla and anxiety states. As a general rule it
was absent or greatly reduced in hysteria, manic-depressive psychosis,
and involutional psychosis. A retest of flftyfour of the subjects
sho«red a high degree of reliability for the phenomenon.
The purpose of this study is to examine the relationship
bettreen a measure of rigidity derived from the perceptual responses
to the Rorschach test and a measure of rigidity based on the per-
ceptual responses to the autokinetic effect.

CHAPTER II
PROCEDURE AND APPARATUS
Procedure
The procedure was to test each subject on the autokinetic
pbenoutenon £irst; secondly, to administer the Rorschach test; and
then to repeat the autokinetic situation. When first introduced to
the experimental situation each subject was asked for some general
information such as his name, age, and educational background, and
encouraged to feel comfortable and to express any doubts or fears he
might have about being a subject. He was then shown the chair in
front of the apparatus and given the following instructions
:
Here is a sheet of paper. It is to provide a record ofyour observations. Sit In this chair (the experimenter ad-
justs the clip board in the subject's lap) and when directedplace yot r face here (experimenter points to the viewer).Then look ahead of you and you will see a point of light.
If . . . and when the light begins to move I want you first to
operate he switch at your left (experimenter points out switchand how o operate It). Do nothing more with the switch.Devote your attention then to tracing (experimenter gives thesubject a pencil) the movements of the light on the paper. Youshould start tracing from the center of the paper. There is a
large "X" placed there for that purpose. Get ready. Theroom lights will be turned out when we begin.
If a subject indicated that he did not understand the
instructions or if there were any questions they were reread with
explanation. When the subject was ready the experimenter ex-
tinguished the room lights from the back of the apparatus, turned
on the autokinetic light source and recorded the reaction tine o£
the subject. He was then allowed two ainutes of viewing from the
mooent he signaled that he had perceived the movement of the light.
In those cases where no movement was seen the subject was permitted
to observe for a total period of five minutes.
The subject was then allowed a short rest period before the
Rorschach test was administered. The procedure here was according
to the method outlined by Beck (1). After another short rest
period the subject was retested in the autokinetic situation.
The Instructions for the second trial in the autokinetic
situation were abbreviated in that there was no reference to the
chair, clip board, etc. He was simply told:
Look ahead of you and you will see a point of light. If
. . . and when the light begins to move I want you first to
operate the switch at your left. Do nothing more with the
switch. Devote your attention to tracing the movements of
the light on the paper. You should start tracing from the
center of the paper. Get ready. The room lights will be
turned out «rhen we begin.
The raw data consisted of a Rorschach protocol from each
subject as well as his reaction time (RT), and graphic recordings
of the autokinetic movement perceived in two trials.
In order to transform the Rorschach data to rigidity scores
(RS) capable of statistical analysis each protocol was scored by
Beck's (I) method. These In turn were scored for rigidity according
to Fisher's outline. The essential factors in the rigidity scoring
are: F7.» F*Z, W%, Dd7., A7., sum M, sum FC, sum FY, T/IR, total number
of responses, content, and card turning. Appendix A provides an

outline of the important variables and the weighting assigned to
them In order to arrive at a total rigidity score.
The amount of movement. I.e., total distance the light was
seen to travel during the two minute period, expressed by the subjects'
graphic recordings was measured to the nearest tenth of an Inch to
give a single score for the autoklnetlc effect. To measure the
distance of the recordings from the starting point proved to be
difficult since many of them were very erratic and not subject to
accurate measurement by a graduated wheel. Consequently the lines
were "straightened" for each subject by tracing them on another sheet
of paper while manipulating the recording so that each part of it was
covered while directing the tracing pencil in a vertical line. The
resultant line was measured to the nearest tenth of an inch.
Reaction time was the third variable measured and consisted
of the time lapse in seconds between the presentation of the light
and the subject's perception of movement. The score here was taken
to the nearest second as measured by a stop watch.
Subjects
In deciding on the sample to be used in the investigation it
was felt that much information could be gained by including subjects
from an abnormal population. Therefore, since a hospital population
was available to the experimenter, the study was repeated with a
sample of brain damaged patients.
The normal sample consisted of fifty white male students
drawn from the population enrolled at the time at the University of
Florida. They were students who for the most part were taking
introductory courses in psychology » but were naive concerning the
autokinetic phenomenon and the interpretation of the Rorschach
test. The method of selection was voluntary in that sheets of
paper announcing the scheduled times for participation in the
experiment were submitted to the various classes and the students
were allowed to participate as they pleased; their cooperation in
the experiment was thus obtained. In some cases friends of the
students also volunteered and were allowed to participate if they
were enrolled in any college. In all cases the subjects had to be
physically able to participate in the experiment as outlined as well
as be mentally alert and show no signs of mental disturbance.
The brain damaged sample was collected from the patients at
the General Medical and Surgical Veterans Hospital at Coral Gables,
Florida. This saoq>le consisted of thirty«one subjects. The
selection was based on the records of the patients available to the
experimenter and Included patients who had a medical diagnosis lndl»
catlve of brain damage of some nature. Thus, such medical diagnoses
as brain tumor, cerebral vascular accident, multiple sclerosis, brain
encephalopathy, cancer of the brain, i.e., metastases, brain syndrome
associated with cerebral arteriosclerosis, and traumatic head injury
were Included. Lobotomy and chronic brain syndrome associated with
alcohol were not Included.
All of the patients were screened for physical ailments which

10
would prevent their cooperation. Thus a hemlpleglc patient who had
brain damage but could not hold a pencil or operate a switch was
excluded from the sample when his name came up in the records. The
same was true of patients who had a record of mental Illness, and
others who had displayed negativism and uncooperative behavior on
Che ward. Thus, the final sample consisted of only those patients
who were physically able to cooperate, whose attitude was cooperative,
who had no history of mental Illness, and who were white males with
diagnoses indicative of brain pathology.
In the two samples age and Intelligence were not matched
since Tburstone (15) has shown that the relationship between the
autoklnetlc effect and intelligence is negligible; and Voth (17) has
shown that there is no significant relationship between the auto*
kinetic effect and age. However, there were factors inherent in
the selection of the subjects which had a limited matching effect.
For example, the selection of brain damaged subjects from a group of
veterans assures a standard of Intellectual endowment and literacy
not too different from that of the normal sample. The average age
and educational level for the brain damaged sample was 45 years and
10.1 grades. The average age and educational level for the normal
sample was 21.6 years and 14. A grades. The range of ages was from
24 to 66 for the brain damaged sample and 17 to 27 for the normal
sample.

11
Apparatus
The apparatus used to elicit the autokinetic phenomenon con-
sisted of a large black box 18 3/4" x 18 3/4" x 52 1/2" with an ex-
ternal viewer at one end and a light source at the other. See
Figure 1. The source itself, a milk white 7W G. E. screw base
candle bulb, was fixed behind a removable black opaque metal plate.
All illumination to the subject was screened out except for a circle
of light of a 1 OD. radius.
Large black curtains suspended from the ceiling screened off
an area large enough to shield the apparatus and the experimenter,
who operated the light from the back of it. Consequently, the
subject saw only the viewer with a small toggle switch to the left
which was used to signal the beginning of the autokinetic effect to
the experimenter.
The tunnel was supported behind the curtains on a table
approximately three feet above the floor and the viewing apparatus
adjusted to eye level for the subject when in a sitting position.
Thus the subject's face was kept in a position which provided a
direct line between his eyes and the light source.
A clip board, to be held in the lap, held an eighteen inch
square piece of paper on which the subject was to record any per-
ceived movement of the light. A large red "X" to help guide the
subject had been placed in the center of each sheet of paper. Each
subject was provided with a sharp combination red and blue pencil.
12
J.
<n
u

CHAPTER III
RESULTS
The statistical methods used to analyze the data consisted
o£ the Pearson product-moment correlation technique and the t- test
o£ significance of a difference. The correlation technique was
used to determine the relationship between: autokinetic movement
scores and rigidity scores, rigidity scores and reaction time, and
reaction time and autokinetic movement scores. It was also used
to determine the relationship between: age and rigidity scores, age
and autokinetic movement scores, as well as the reliability of the
autokinetic movement scores. The t* test was used to determine the
significance of the difference between the two samples' means for
autokinetic movement scores and rigidity scores.
The results for the normal sample have been tabulated in
Table 1. As can be seen, the relationship between rigidity scores
and the autokinetic movement scores vas not significant, r s -.06
(p) .05). In addition, the relationship between reaction time and
rigidity scores failed to reach a 5 per cent level, r s .11 (p^ .05).
However, the correlation between reaction time and autokinetic move-
ment scores was significant, r s -.29 (p^.05).
As shown in Table 2, the correlations between the three
variables were all significant for the brain damaged sample. The
correlation coefficient between rigidity scores and autokinetic
13

14
TABLE I
INTERCORRELATIONS AMONG RIGIDITY SCORES, AlTTOKINETIC MOVEMENTSCORES, AND REACTION TIMES FOR THE NORMAL SAMPLE
Variables Coefficient of Fiducial . ,.
Correlated Correlation Limits ^ °^
^——1^-i^»^M« I !——W—1———^—W>^»^—^^^W^—^W^^^^^— i n! W I I I III — » I—
RS and AKM -.06 0.00 - .39
RS and RT .11 0.00 - .37
RT and AFM -.29* 0.02 - .57
#8ignl£icant at .05 level.
TABLE 2
INTERCORRELATIONS AMONG RIGIDITY SCORES, AUTOKINETIC MOVEMENTSCORES, AND REACTION TIMES FOR THE BRAIN DAMAGED SAMPLE
Variables Coefficient of FiducialCorrelated Correlation Limits ^^^
RS and AKM -.58* .28 - .77
RS and RT .37# .01 - .63
RT and AKM -.53* .21 - .74
*8ignificant at .01 level.#Significant at .05 level.
15
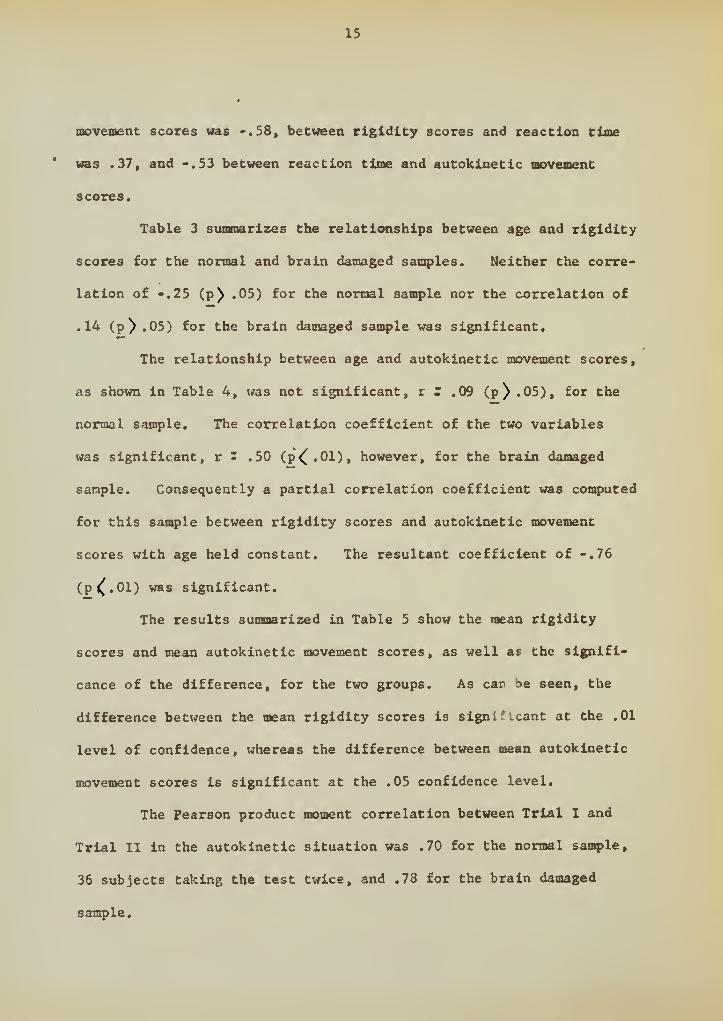
movement scores was '.SS, between rigidity scores and reaction time
' was .37, and -.53 between reaction time and autokinetlc movement
scores.
Table 3 summarizes the relationships between age and rigidity
scores £or the normal and brain damaged saoq>les. Neither the corre-
lation of -.25 (p^ .05) for the noxmal sample nor the correlation of
.14 (p^.05) for the brain damaged sample was significant.
The relationship between age and autokinetlc movement scores,
as shown in Table U, was not significant, r : .09 (p^ .05), for the
normal sample. The correlation coefficient of the two variables
was significant, r - .50 (p^.Ol), however, for the brain damaged
sample. Consequently a partial correlation coefficient was computed
for this sample between rigidity scores and autokinetlc movement
scores with age held constant. The resultant coefficient of -.76
(p 4^.01) was significant.
The results sumoarized in Table 5 show the mean rigidity
scores and mean autokinetlc movement scores, as well as the signifi-
cance of the difference, for the two groups. As can be seen, the
difference between the mean rigidity scores is significant at the .01
level of confidence, whereas the difference between mean autokinetlc
movement scores is significant at the .05 confidence level.
The Pearson product moment correlation between Trial I and
Trial II in the autokinetlc situation was .70 for the normal sanq>le,
36 subjects taking the test twice, and .78 for the brain damaged
sample.

16
^^^m<mm
TABLE 3
CORRELATIONS BETWEEN AGES AND RIGIDITY SCORESFOR THE NORMAL AND BRAIN DAMAGED SAMPLES
» <-«^" * m ^ IIISa]^>I«
Coefficient ofCorreLatlon
FiducialLl^ts (57o)
Normal
Brain Datnaged
'.25
.14
0.00 - .49
0.00 - .46
TABLE 4
CORRELATIONS BETWEEN AGES AND AUTORINETIC MOVEMENTSCORES FOR THE NORMAL AND BRAIN DAMAGED SAMPLES
SasqpleCoefficient ofCorrelation
FiducialLlalts (5%)
Normal
Brain Danaged
.09
.50*
0.00 - .27
0.16 - .72
*Slgnlfleant at .01 level.

17
TABLE 5
MEAN DIFFERENCES BETWEEN SAMPLES FOR RIGIDITY SCORES, ANDAUTOKINETIC MOVEMENT SCORES
RigidityScores
AutokineticMovementScores
Sample Normal BrainDamaged
Normal BrainDamaged
Mean 23.7 49.2 7.7 5.9
t- test 6.3* 2.1#
^Significant at .01 level.
#Signi£icaat at .05 level.

CHAPTER IV
OONCLUSIONS AMD SUMMARY
The hypothesis that subjects who display higher rigidity
scores would perceive correspondingly smaller amounts of autoklnetic
movement was accepted for the brain damaged sample on the basis of a
correlation coefficient equal to -.58. For the normal group the
correlation coefficient of -.06 was not significant.
The second hypothesis, which stated that subjects with greater
rigidity scores will have longer reaction times, was also accepted
for the brain damaged sample, but rejected for the normal sample.
The correlation coefficient between the two variables was .37 for
the brain damaged sample and .11 for the normal sample.
The third hypothesis, that subjects who perceive greater
amounts of autoklnetic movement would have shorter reaction times,
was considered to be tenable for both samples. The correlation
coefficient for the brain damaged sample was -.53, whereas that for
the normal sample was -.29.
The reliability of the autoklnetic effect was escamined by the
test-retest method and the results showed the correlation coefficient
was .70 for the normal group and .78 for the brain damaged group. An
acceptable degree of reliability was demonstrated for measurement of
the phenomenon.
The influence of age on rigidity scores was examined by
18

19
computing a correlation between the two variables £or both of the
samples. The correlation coefficient was .14 for the brain damaged
sample, and -.25 for the normal sample. Since neither correlation
is significant it is concluded that age is not an important variable
contributing to the rigidity of perception shown by the subjects on
the Rorschach test.
In addition the influence of age on autokinetic movement
scores was examined by computing a correlation between the two
variables for both of the samples. The correlation was significant,
r : .50 for the brain damaged sample, but not for the normal sample,
r s .09. Moreover, a partial correlation coefficient of -.76 between
rigidity scores and autokinetic movement scores with age held constant
indicated that age was not contributing to this degree of relationship
between them. In this study age is not the important variable con-
tributing to the subjects' perception of autokinetic movement.
From the results it can also be concluded that for the brain
damaged and normal subjects the quicker autokinetic movement is per-
ceived the greater the distance it is likely to travel in a restricted
period of time. In this instance the brain damaged sample showed a
significant relationship bet«feen rigidity scores and amount of auto-
kinetic movement perceived, and between rigidity scores and reaction
time, but the normal sample did not; thus there may be a certain
critical minimum degree of rigidity necessary for this relationship
to manifest itself on these particular tests. There was a signifi-
cant difference between the degree of rigidity manifested by the two

20
groups on the Rorschach test. The brala damaged group had a tneaa
rigidity score of 49.2, nore than twice that of the normal group %^o
showed a mean rigidity score of 23.7. Consequently it appears that
a critical minimum rigidity score must be reached.
In summary, a normal sample composed of fifty white, male
college students, and a second sample of thirty-one brain damaged
hospital patients were administered a Rorschach test and also placed
in an autoklnetic situation in an effort to determine the relation-
ship between the two when each is used as an instrument to measure
rigid behavior.
The Rorschach test protocols were scored for rigidity accord-
ing to Fisher and the recordings of the amount of movement perceived
were measured to the nearest tenth of an inch. These data repre-
sented the degree of rigidity manifested by the subject in each
situation and a Pearson product-moment correlation was used to
establish the relationship. A t^- test was also used to determine
whether a significant difference existed between the samples'
rigidity scores, and the amount of autoklnetic movement recorded.
The results failed to show a significant relationship between
age and rigidity scores for either group, and between age and auto-
klnetic movement scores for the normal group. However, a significant
relationship between age and autoklnetic movement scores for the
brain damaged sample was shown. A partial correlation, between
their rigidity scores and autoklnetic movement scores with age held
constant, was significant, indicating age was not the significant

21
variable. The results also ladlcated a significant relationship
between rigidity score and autoklnetlc movement, reaction tiaoe and
rigidity score, and amount of autoklnetlc movement and reaction time,
for the brain damaged sample, but only between reaction time and
autoklnetlc movement for the normal sample. The difference between
rigidity scores and autoklnetlc movement was also significant for
the two groups. Thus, it was concluded that quicker perception of
movement is positively related to the amount of movement perceived,
but that there is probably a critical minimum degree of rigidity
necessary before there is a relationship shown between rigidity
score and autoklnetlc movement, and between reaction time and
rigidity score.

APPENDIX A
SCORING FOR RORSCHACH RIGIDITY
Each of the weights below is a penalty £or what is considered to beexcess rigidity or restrictiveness. The larger the final sunntation
of weights, the greater is the ii^lied rigidity.
I. F per cent (F %)
1. If the nuad»er of responses is 22 or fewer •
a. An F 7. of 55-60 gives a score of 3
b. An F % of 61-70 gives a score of 4c. An F 7o of 71-80 gives a score of 6
d. An F % of 81-90 gives a score of 8
e. An F % of 91-100 gives a score of 11
2. If the nunber of responses is over 22 •
a. An F % of 55-60 gives a score of 4b. An F 7. of 61-70 gives a score of 5
c. An F % of 71-80 gives a score of 7
d. An F % of 81-90 gives a score of 9
e. An F % of 91-100 gives a score of 12
II. Nuiid>er of responses (R)
1. If the number of responses lies between 9 and 15, Inclusive,the score is 9.
2. If the nu^er of responses lies between 16 and 20, Inclusive,the score is 6.
III. Percentage of Anioal Responses (A)
1. If the percentage of "animal" responses is 60-70, the scoreis 6.
2. If the percentage of "animal" responses is 71-80, the scoreis 8.
3. If the percentage of "animal" responses is 81-90, the scoreis 10.
IV. Form Accuracy (F )
1. If the number of responses lies between 15 and 22, inclusive •
a. and if the F 7. is at least 40 and not higher than 50 -
an F 7. of 85-90 gives a score of 5
an F • % of 90-91 gives a score of 8
22

23
b. Or i£ the F % is 51 or higher •
an F % o£ 85-90 gives a score of 6
an F 7« of 91-100 gives a score of 9
If a record contains fewer than fifteen responses only 1/2of any given veight applies.
2. If the nuaiber of responses exceeds 22 -
a. and if the F % is at 35 and not higher than 50 -
an F 7o of 85-90 gives a score of 6
an F % of 91-100 gives a score of 10
b. Or if the F % is 51 or higher -
An F « % of 85*90 gives a score of 6
An F « % of 91-100 gives a score of 12
V. Card Turning
Less than two responses in which the card is viewed other
than in the upright position gives a score of 4.
VI. Color
Less than two FC is scored 6.
(M.FC is not counted as an FC)
VII. Whole Responses (W)
1. If the percentage of W, responses is 40-50 -
a. The score is 5 in records where the number of responses
is 22 or under.
b. The score is 6 in records where the number of responses
exceed 22.
2. If the W % is 51-60 -
a. The score is 7 where the number of responses is 22 or less.
b. The score is 9 where the nuiid>er of responses is over 22.
3. If the W % is 61 or overa. The score is 10 where the number of responses is 22 or
less.
b. The score is 12 where the number of responses is over 22.

24
VIII. Small Detail Responses (Dd)
1. If the Dd 7. is 18-23
a. The score is 3 where the nuniber o£ responses is under 22.
b. The score is 4 where the nunber of responses is over 22.
2. If the Dd % is 24-30a. The score is 5 where the nuxaber of responses is 22 or
under.b. The score Is 6 where the nundjer of responses is over 22.
3. If the Dd % is 31-40 -
a. The score is 8 where the atud}er of responses is 22 orunder.
b. The score is 8 where the nunber of responses is over 22.
4. If the D d % is 41 or over -
a. The score is 10 where the number of responses is 22 orunder.
b. The score is 11 where the number of responses is over 22.
DC. Movement Responses (M)
1. If the number of movement responses is less than two, thescore is 15.
2. If the number of movement responses is less than one, the
score is 20.
X. Content
1. If four or more responses fall into the same content category(aside from "human" and "animal" responses) -
a. and if the number of responses is 1 through 25, the scoreis 7.
b. and if the number of responses is 26 through 40, the
score is 6.
c. and if the number of responses is 41 or over, the scoreis 5.
XI. Average Time of Initial Response (T/HR)
1. If the average reaction time per initial response is
a. 25 through 29 seconds, the score is 2.
b. 30 through 40 seconds, the score is 5.
c. Over 40 seconds, the score is 7.
XII. Shading Responses (FY)
Less than two FY responses gives a score of 3.
REFERENCES
1. Beck, S. J. Rorschach's Test: I. Basic Processes. Gruae andStratton, New York, 1950.
2. Becker, W. C. Perceptual rigidity as measured by aniseikoniclenses. J. abnorm. soc. Psychol .. 1954, 49, 419-22.
3. Cattell, R. B. , and Tiner, L. The varieties of structuralrigidity. J. Pers . . 1949, 17, 321-41.
4. DeVos, G. A quantitative Rorschach assessment of maladjustmentand rigidity in acculturing Japanese Americans. Genet .
Psychol. Monogr . . 1955, 52, 51-87.
5. Fabrikant, B. Rigidity and flexibility on the Rorschach. J.Clin. Psychol .. 1954, 10, 255-58.
6. Fisher, S. An overview of trends in research dealing withpersonality rigidity. J. Pers .. 1949, 17, 342-51.
7. . Patterns of personality rigidity and some of theirdeterminants. Psychol. Monogr . , 1950, 64, No. 1. (WholeNo. 307).
8. Hertz, M. Suicidal configuration in Rorschach records. R.
Research Exchange . , 1948, 1^, 3-58,
9. Johnson, Laverne C, and Stem, John A. Rigidity on theRorschach and response to intermittent photic stimulation.J. consult. Psychol . . 1955, 19, 311-17.
10. Klein, G. S. , and Schlesinger, H. J. Perceptual attitudestoward instability: I. Prediction of apparent movementfrom Rorschach responses. J. Pers . , 1951, J£, 289-302.
11. Kounin, J. S. The meaning of rigidity: A reply to HeinzWerner. Psychol. Rev. . 1948, 55, 157-66.
12. KcAndrew, H. Rigidity and Isolation: A study of the deaf andthe blind. J. abnorm. soc. Psychol . . 1948, 43, 476-94.
13. Rechtschaffen, A., and Mednick, S. The autokinetic wordtechnique. J. abnorm. soc. Psychol .. 1955,^, 346,
25
26
14. Reichard, S. Rorschach study of prejudiced personality . Aaer .
J. Orthopsychiat . . 1948, 18, 280-86.
15. Thurstone, L. L. A factorial study of perception. Psychometr .
Monogr . • 1944, No. 4.
16. Voth, A. C. Individual differences in the autokineticphenomenon. J, exp, Psychol ., 1941, 29, 306-22.
17. . An experimental study of mental patients throughthe autokinetic phenomenon. Amer. J. Psychiat . . 1947,103 . 793-805.
18. Young, N. , and Gaier, E. A preliminary investigation into theprediction of suggestibility from selected personalityvariables. J. soc. Psychol . . 1953, ^, 53*60.

BIOGRAPHICAL ITEMS
The author was born on September 5, 1927, in Bay City,
Michigan. He attended Bay City Junior College following army
service and received an Associate of Science degree before trans-
ferring to Michigan State University. While at Michigan State
University he raajored in psychology and received a Bachelor of Arts
degree in June, 1951.
In September, 1951, he entered the graduate school of the
University of Florida and in June, 1953, he received a Master of
Arts degree with a psychology major The following year was devoted
to internship with the V. A. Clinical Psychology Training Program
and then study for the doctoral degree was resumed at the University
of Florida. During that period he was a graduate assistant and
later half-time clinician with the Psychological Clinic at the
University. He was also elected to membership in Alpha Kappa Delta,
sociology honorary society, and served as chairman of the Graduate
Seminar Committee.
He is a member of the American Psychological Association and
the Florida Psychological Association. He is currently finishing
his V. A. clinical training in the V. A, G. M. & S. Hospital at
Coral Gables, Florida.
This dissertation was prepared under the direction of the
chaiman of the candidate's supervisory committee and has been
approved by all members of the consaittee. It was submitted to
the Dean of the College of Arts and Sciences and to the Graduate
Council and was approved as partial fulfillment of the requirements
for the degree of Doctor of Philosophy.
June 9, 1958
S'^- l-ly>-
Dean, College of Arts and Sciences
Dean, Graduate School
Chairman
^>^/^/
LL (^U . ^ Uh^-i^i a^ c. w-^x-

28560