Embed Size (px)
Citation preview
International Journal of Development and Sustainability
ISSN: 2186-8662 – www.isdsnet.com/ijds
Volume 7 Number 1 (2018): Pages 34-59
ISDS Article ID: IJDS17081703
Perceptions of social cohesion: Evidence from Kenya
Gitile Naituli 1*, King’oro Sellah Nasimiyu 2
1 Multimedia University, Faculty of Business and Economics, Kenya 2 National Cohesion and Integration Commission, Research Division, Kenya
Abstract
This paper examines the views of Kenyans regarding the concept of social cohesion. A total of 27 focus group
discussions (FGDs) were conducted nationally with a small group of 8 - 10 knowledgeable community members
alongside key informant interviews (KII). Participants were drawn from Government, the private sector, Faith Based
Organizations and NGOs. The FGD and KII sessions were used to tease out detailed qualitative information on the
status of cohesion in the country. 86% percent of the respondents indicated that they trust people from another
ethnic group while 14% said that they ‘do not trust at all’ members of another ethnic group. 88% of the respondents
perceived that religious groups are getting along well while 10% felt that they were not. Kenyans were less
optimistic about relations between different socio-economic groups, with about only 16% feeling that they were
getting along well and a high of 78% stating that socio-economic groups were getting along poorly. Most of the
respondents indicated a relatively high level of trust in the Government of Kenya while 9% of them said that they
‘never’ trust the government. The paper concludes that Kenyans are increasingly aware of the differences in socio-
economic status in society and there is an underlying skepticism on the implementation of the progressive
Constitution and other policy initiatives.
Keywords: Social Cohesion; Ethnic Diversity; Inclusion
* Corresponding author. E-mail address: [email protected]
Published by ISDS LLC, Japan | Copyright © 2018 by the Author(s) | This is an open access article distributed under the
Creative Commons Attribution License, which permits unrestricted use, distribution, and reproduction in any medium,
provided the original work is properly cited.
Cite this article as: Naituli, G. and Nasimiyu, K.S. (2018), “Perceptions of social cohesion: Evidence from Kenya”, International
Journal of Development and Sustainability, Vol. 7 No. 1, pp. 34-59.

International Journal of Development and Sustainability Vol.7 No.1 (2018): 34-59
ISDS www.isdsnet.com 35
1. Introduction
The majority of African countries who were colonized between late nineteenth century and early twentieth
century attained independence either in the late 1950s or early 1960s. The Europeans who participated in
the so-called “Scramble for and Partition of Africa” created territories whose citizens experienced difficulties
living in peace with other ethnic groups (Michalopoulos, 2011). The Organization of African Union (OAU)
which was created in 1963 opted not to rationalize the boundaries of its newly independent member states
and those of the remaining colonies. The core concern of OAU’s was over the likelihood of opening a plethora
of claims and counter-claims, in the middle of intellectual debates over the most feasible road-map to a
United States of Africa. As a result, newly independent African states inherited fundamental differences that
would need consummate statesmanship to transform them into nation states (Huillery, 2009). Nevertheless,
the African experience suggests failed statesmanship: the things that have divided have seemed greater than
those that unite. This has resulted in weak social cohesion manifested in widespread blood-letting even over
issues that are amenable to round-table resolution. A significant number of African states have failed to
harmonize their diversity of customs, language and natural heritage, partly because of the mismanagement of
independence era opportunities that could have fostered national unity (Englebert et. al, 2002). Thus, instead
of such opportunities fostering national social cohesion and growth, they have often bred mistrust, social
unrest, weak prosperity and inequality. The resulting suspicions have undermined the scope for economic
growth and human welfare enhancement, in turn undermining the scope for nationwide development.
1.1. Study objectives
Over the last few decades, Kenya has experienced a web of violence which is politically instigated. However,
the post-election violence witnessed in 2007/2008 general election demonstrated the weaknesses of social
cohesion in Kenya and as such, this study sought to examine the status of social cohesion in Kenya with a
view of improving the situation. This study was guided by the following primary objective: a) Exploring the
perception of Kenya people regarding the concept of social cohesion.
2. Literature review
2.1. The social cohesion concept
There is lack of consensus among scholars regarding the term “Social Cohesion”. Markus (2010) is of the
opinion that there is an agreed definition of the term as a result of its concentration on intangibles, including
the extents of wellness, group attachment as well as belonging and participating in shared outcomes.
Drawing on Easterly (2006), social cohesion is in most cases associated with social capital (Easterly, 2006).
However, Green et al. (2003) emphasize the possible distinction between the two phenomena, pointing out
that the trust and reciprocity that enable collective action and bonds within communities – social capital – do
not always exist at higher levels of aggregation of society. This distinction between the community and

International Journal of Development and Sustainability Vol.7 No.1 (2018): 34-59
36 ISDS www.isdsnet.com
society (national) levels is also underscored by Botterman et al. (2012) who distinguish the characteristics of
a rural from an urban aspect of cohesion, by implication, questioning the usefulness of a single nationwide
cohesion index. Based on a wide literature review, Acket et al. (2011) distinguish analyses of social cohesion
based on sociological and psychological concerns with integration and social stability, from those which are
policy oriented, seeing the phenomenon as a pre-condition for economic prosperity. Social cohesion is seen
to have multiple facets that influence different spheres of human life, as well as different types of social
relations.
Mwabu et al. (2013) considers social cohesion and social conflict as two sides of the same phenomenon.
Social cohesion has two key aspects: (a) An equilibrium probability of peaceful coexistence; and (b) A stable
equilibrium of the probability of peaceful coexistence (Mwabu et al., 2013). When a society is at a stable
equilibrium, expectations of individuals and communities are generally being met. The term ‘stable
equilibrium’ denotes the ability of communities to return to a non-conflict state within a ‘short’ duration after
a disturbance. Frequent conflicts of a deliberate nature are incompatible with a cohesive society. Social
cohesion is not a static social equilibrium, but rather a dynamic one. It is a stable equilibrium of peaceful
desires, attitudes and behaviors’. Change and peace are the norm in a cohesive society, with conflicts
occurring rarely and over short durations. The study measured social cohesion as 1-p: where: p is the
probability of social conflict; and 1-p is the probability of peace. Social cohesion is defined as “peace” and
conflict as “absence of peace”
In this case, social cohesion had one component (peace) and one determinant of major policy interest,
namely trust – with controls for regional, gender, and education attainment. This model provided a simplified
analytical tool but could easily be criticised as being under-parameterized. This simplified framework has
since been extended through further reviews discussions. Langer and Stewart (2012) conceptualise social
cohesion (good social relations) to be composed of 3 components (a triangle): The extent of equity (fairness);
the level of trust among people; and people’s propensity to prefer national to their group (or ethnic) identity.
When people have a common identity, they tend to trust one another and also remain fair to one another.
The relations here are good in the sense that the critical outcome is peace, an instrument for economic
prosperity. Based on a review of the literature, the current study extends this triangular conceptualization to
a ‘hexagon’ of six components of social cohesion (good social relations), namely: peace (absence of social
conflict); generalised trust (complete confidence or faith in people with whom one coexists irrespective of
background or circumstance); equity (just distribution of resources and power across individuals and groups
in a society); cultural diversity25 (the extent to which individuals embrace varieties in ethnic backgrounds
and heritages, religious beliefs, marriages, political ideologies and associations; national identity (such as
whether individuals express preferences for a national identity) and prosperity. Social cohesion, according to
this hexagon, is “peace with equity, trust, cultural diversity, national identity and prosperity.” (Langer et. al.,
2015).
Peace is a necessary but not a sufficient component for social cohesion (peaceful and meaningful
coexistence of different communities). Peace is meaningless if it exists, but is inaccessible to communities
which consequently hurt needlessly, or to a majority of people steeped in abject poverty. Cultural diversity is
a sign of tolerance and appreciation of differences in identity or other characteristic. The ultimate outcome is
International Journal of Development and Sustainability Vol.7 No.1 (2018): 34-59
ISDS www.isdsnet.com 37
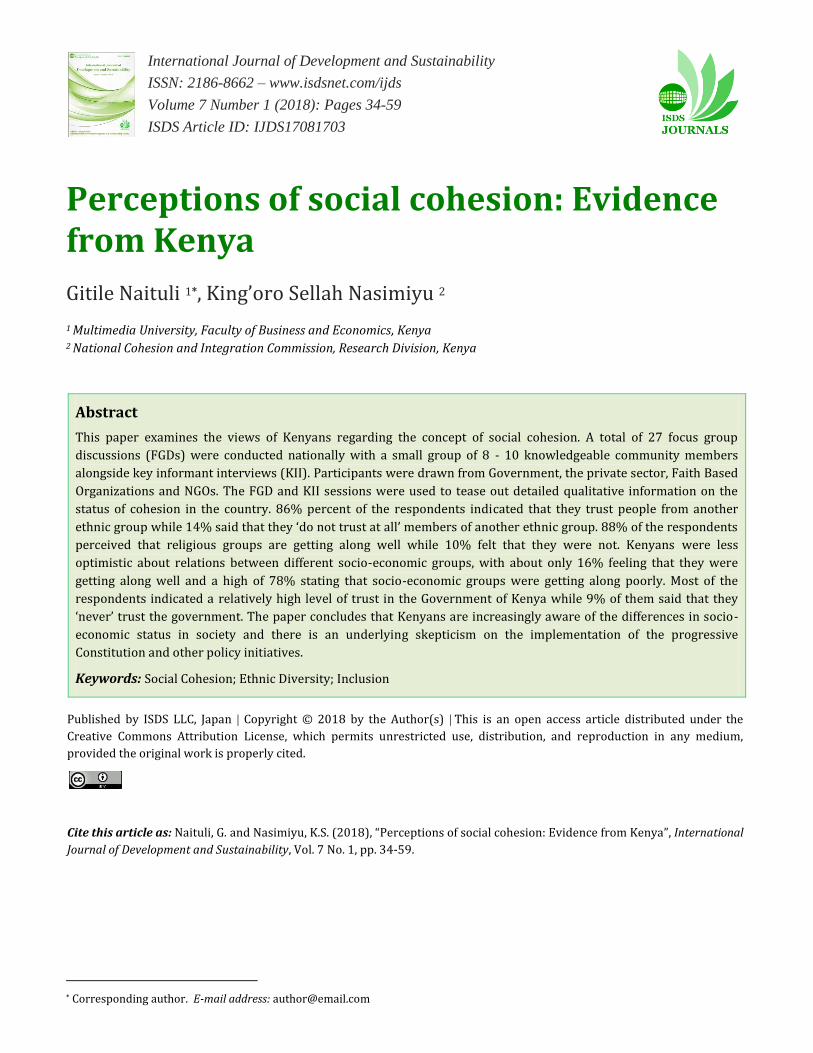
sustainable development, which is a function of peace. We note that sustainable development goes beyond
mere economic growth to include inclusive development which focuses on the resulting quality of life. The
hexagon illustrates how we envisage the assessment and analysis of social cohesion in formulating a social
cohesion index. The factors explaining the variation of the index over space and over time will of course not
be included in the computation of the respective indices.
Figure 1. Components of Social Cohesion
2.2. Significance of social cohesion for Kenya
Social cohesion – conceptualised as a social phenomenon whose elements include equity, growth and
legitimacy of institutions – is important for its own sake and for creating an environment of peaceful co-
existence. But it also has instrumentality in generating the growth of assets and opportunities whose wise
management can fuel harmony and improve human welfare. The importance of social cohesion for Kenya can
be gleaned from other countries’ experiences. In a review of the EU Cohesion Policy, Farole et al. (2010) refer
to various growth models that condition performance on the status of human capital, entrepreneurship,
innovation and its assimilation, exploitation of scale economies, access to markets, and on institutions. Farole
et al (2010) argue that differences in these respects across EU countries undermine the scope for lagging EU
economies to tend towards their respective production frontiers, fostering “regional unevenness” that
perpetuates “persistent underdevelopment” of the laggards. The Kenyan context is analogous in two ways
driving persistent under-development: it under-achieves for each of the conditions listed above; and it has
wide internal disparities in the same.
For Kenya’s natural, socio-economic and political heritage, a preferred conception of cohesion would
focus initially on institutional legitimacy – such as implied in the Constitution (2010) – which would
consequently create the framework for equitable growth. The creation of the Kenyan colonial territory
brought more than 40 ethnic groups together, but subsequently balkanised them along those very lines. The
country’s divergent natural heritage biased colonial era investments in favour of the higher potential parts of
the country. Independence era policies and practices have not mitigated that colonial heritage, resulting in
extensive regional inequalities that undermine national cohesion. While the frequency of ethnic, social and
other resource conflicts is low, their very existence undermines a nationwide view of the country’s
development potential. Successive independence governments have failed to take advantage of opportunities
for equitable interventions that lead the way for private initiatives and promote trust, peace, harmonious

International Journal of Development and Sustainability Vol.7 No.1 (2018): 34-59
38 ISDS www.isdsnet.com
diversity and national identity, and consequent prosperity. In enhancing national social cohesion, such a
turn-around would enhance opportunities for economic growth and improved human welfare.
2.3. Theoretical framework
The present study’s theoretical framework draws on Rajulton et al., (2007), focusing on the conceptual issues
in the relationships between socioeconomic wellbeing, inequalities and social cohesion. In keeping with the
perception that social relations revolve around economic, political and/or socio-cultural concerns, Rajulton
et al. (2007) develop a framework within which to conceptualize and analyze social cohesion, suggesting
various characteristics of the phenomenon. They also suggest the application of a two-stage factor analysis
process to select the most suitable observed variables that load most heavily on the unobserved factor, social
cohesion. The framework has six dimensions measuring economic, political and socio-cultural factors whose
elements are subjected to Principal Components Analysis (PCA), which distinguishes the significant ones to
be combined to produce an overall indicator of social cohesion.
Figure 2. Dimensions of Social Cohesion (Source: Rajulton et al., 2007)
It is important to gauge the direction and extent of social cohesion, especially against the backdrop of
realities that divide – as well as unite – society. Yet, as in the case of social capital, there is no universally
agreed measure of social cohesion. Thus, it is its tangible, measurable underlying facets that the analyst must
consider, rather than the concept itself. Of the facets, too, Markus (2010) argues that the measure must be

International Journal of Development and Sustainability Vol.7 No.1 (2018): 34-59
ISDS www.isdsnet.com 39
based on perceptions of reality – generated from surveys, rather than some objective measure of belonging,
pride in or satisfaction with life, mistrust, discrimination and service delivery (infrastructure). The
implication of its multidimensionality is that its measure focuses on various indicators rather than a single
one (as conceptualised by Mwabu et al. (2013). Such a set of indicators must lend themselves to effective
intertemporal/ longitudinal monitoring (Markus, 2010), based on survey and other panel data. However, a
combination of both perceptions data and attribute data has been used in other social cohesion studies, such
as by Rajulton et al. (2007). Such a framework can also enable the comparison of cohesion across regions,
and indeed, across counties.
On transforming variables in the multi-dimensional context, Barcena et al (2010) that the function should
satisfy two minimum requirements. First, since the attributes are measured in different units, they must be
translated into a common scale for aggregation. Second, the functions should avoid assigning high relative
importance to extreme values that might exist in the original distribution. One of the most commonly used
transformation methods is standardisation based on the range. There is no normative guideline on the most
appropriate method, and the different methods can produce different results.
The structure of the weighting factors of the different attributes that make up a multidimensional index is
critical. According to Barcena et al (2010), any weighting scheme involves a trade-off among the dimensions
considered, and therefore represents an implicit value judgment regarding the elements that determine (and
to what extent they determine) the numerical value of the indicator being analysed. Various weighting
strategies have been discussed in the literature including equal weighting for all attributes, weighting based
on data, market prices, or a normative approach.
3. Sampling methodology and survey organization
3.1. Introduction
Data collection for the Social Cohesion Index was undertaken in June to July 2013. The survey instruments
were organised in one questionnaire - Focus group discussion (FGD)/key informant interview (KII) guides.
There were twenty seven FGD sessions covered involving participants across all the counties. Each of Kenya’s
former provinces had at least one FGD session.
3.2. The FGD and KII interviews
The focus group discussions (FGDs) were administered to a small group of a minimum of eight (8)
knowledgeable community members. The members were selected with the assistance of the National
Cohesion Integration Commission (NCIC) which in turn mainly relied on its extensive local network of
Cohesion Monitors. The FGD and KII sessions were used to tease out detailed qualitative information on the
status of cohesion in the country. A total of 27 FGD were conducted nationally. Nairobi region had one FGD
while each of the other regions (former provinces) had 3 to about 12 FGD sessions each. There were a similar

International Journal of Development and Sustainability Vol.7 No.1 (2018): 34-59
40 ISDS www.isdsnet.com
number of key informant interviews (KII) interviews. Participants in the FGD and KIIs were drawn from
Government, the private sector, faith based organisations, and NGOs.
4. Result presentation and analysis
4.1. Perception on social cohesion in Kenya
There are strong linkages between social cohesion and the socio-economic status of a country, government
effectiveness, and the predictability of the policy environment, including the quality of policies. Among the
important factors that threaten social cohesion in contemporary society include the widening social and
cultural gaps, weakening institutional and governance structures, the erosion of traditional sources of a
sense of belonging, and levels of trust for political institutions. This section of this report uses data collected
by the 2013 household survey to provide a snapshot of where the country is with respect to cohesion. It is
worth repeating at this stage that the survey questionnaire was standard across a country with wide
differentials in human welfare and other development indicators. Such a standard questionnaire approach
runs the risk of inadequately capturing the key local issues in the regions, undermining the strength of
regional findings. Yet, such an approach is vindicated in the search for a national index; regional issues have
been gleaned separately through focus group discussions (FGD) and key informant interviews.
4.2. Characteristics of survey respondents
Table 1 below presents the age distribution, education characteristics and employment status of the sampled
respondents during the national cohesion household survey. Nearly half of the respondents (about 49%)
were aged between 18 and 35 years, while another 35% were aged between 36 and 55 years. With respect to
educational status, about 14% of the respondents stated that they had no education, while 48% and 28%,
respectively, had primary and secondary level education as their highest attainments. The remaining
11%either had tertiary college or university education.
Table 1. Age, education and employment characteristics of survey respondents Source: SCI survey, 2013
Age(Years) Education Status Employment Status 18-35 48.6% None 13.8% Paid Employee 24.1% 36-55 34.8% Primary 47.5% Working employer 2.6% 56-65 9.3% Secondary 27.9% Own account worker 44.2% 66-above 7.3% Tertairy college 7.6% Unpaid family worker 27.7% University 3.1% Apprentice 1.5% Observations(N) 4,553 4,566 3,303
The respondents were mainly ‘own account workers’ – self-employed – who made up about 44% of the
sample, followed by unpaid family workers (27.7%) and paid employees (24%). Working employers (2.6%)
and apprentices (1.5%) accounted for about 5% of the worker sample.

International Journal of Development and Sustainability Vol.7 No.1 (2018): 34-59
ISDS www.isdsnet.com 41
4.3. Trust
The survey enabled an investigation of the extents of trust of other groups, such as family and ethnicity.
Nationwide, the levels of reported generalised trust for people of another ethnic group are relatively high.
Eighty six (86) percent of the respondents indicated that they either ‘trust completely’ or ‘trust somewhat’
‘people from another ethnic group’, as shown in Table 2 Respondents who stated that they ‘do not trust at all’
members of another ethnic group were about 14% in 2013.
Table 2. Trusting another Ethnic Group
Trust completely Trust somewhat Do not trust
National 38.3 48.0 13.7
Region
Rural 42.8 43.4 13.9
Urban 31.8 54.8 13.4
Gender
Male 41.2 44.8 14.0
Female 36.5 50.0 13.5
Education
None 41.8 41.4 16.8
Primary 41.2 45.7 13.1
Secondary 35.0 51.8 13.2
Tertiary college 34.9 51.7 13.4
University 23.0 62.0 15.1
Age(Years)
18-35 35.0 48.9 16.0
36-55 39.7 48.3 12.0
56-65 42.8 46.7 10.5
66-above 48.4 42.4 9.2
Source: SCI Survey, 2013
A larger proportion of males than females ‘trust completely’ compared to the larger share of females who
‘trust somewhat’ members of another ethnic group. The share of those who ‘trust completely’ declines with
education, while that of those who ‘trust somewhat’ grows, and the respective shares increase and decrease
consistently across age groups. Complete trust is also greater in rural areas.
4.3.1. Relations
The perceptions of Kenyans were gauged on the “nature of relationships” among certain groups, such as
whether these groups are getting along well, including family members, neighbours, different ethnic groups,
races, religious groups and socioeconomic groups. Across all the categories inquired about, the shares of
respondents feeling that the various groups were getting on ‘very well’ or simply ‘well’ stood above
70%.Perceptions of good relations were highest for the family (96%) and least high for races (76%). Indeed,
International Journal of Development and Sustainability Vol.7 No.1 (2018): 34-59
42 ISDS www.isdsnet.com
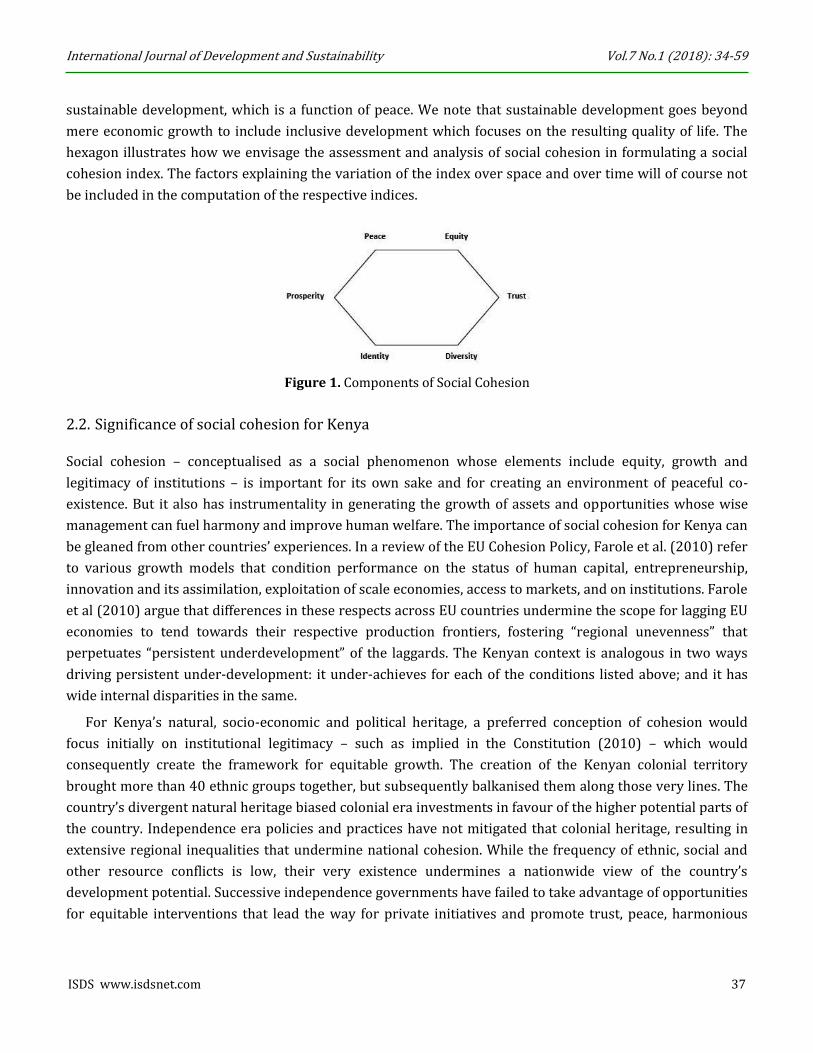
the largest share of non-commitment among the respondents was the 17% on the race question. About 88%
of the respondents perceived that religious groups are getting along well. One out of every ten Kenyans
(10%) and 78% of the respondents perceive that people of different religions and socio-economic groups
were getting along well, respectively. In relative terms, Kenyans are less optimistic about relations between
different socio-economic groups, with about 78% feeling that different socio-economic groups were getting
along “very well” or “somewhat well” – with a high of 16% respondents stating that socio-economic groups
were getting along “poorly” or “very poorly.” About 7% did not respond to this particular issue.
Figure 3. Perception on nature of groups relations “these days” (% of respondents)
4.3.2. Trust in Institutions
There was relatively high support for government policy and administration of justice. However, this
perception varied between rural and urban areas, with residents in urban areas having higher perception on
performance of political institutions relative to the rural counterparts. Perhaps this is due to higher level of
information sharing in urban areas relative to rural areas. There was marked low level of perception
response in relation to confidence in government. Majority of the respondents indicated confidence that the
government will always or most of the time do what is right to improve the lives of Kenyans.
The 2013 survey data shows that about 63% of respondents indicated that the government of Kenya can
be trusted ‘always’ and another 29% stated that the government can be trusted ‘most of the time’ indicating a
relatively high level of trust for the government. Respondents who indicated that they ‘never’ trust the
government were about 9%. With respect to region of residence, rural residents are more likely to ‘always’
trust the government relative to urban residents.
Table 3. How often do you think the government can be trusted to do the right thing for Kenyans? 2013

International Journal of Development and Sustainability Vol.7 No.1 (2018): 34-59
ISDS www.isdsnet.com 43
Always Most of the time Some of the time Never
National 35.6 29.3 25.7 9.4
Region
Rural 38.8 27.1 25.7 8.5
Urban 31.0 32.5 25.8 10.7
Gender
Male 36.8 28.1 25.2 9.9
Female 34.8 30.1 26.0 9.1
Education
None 39.8 30.8 21.2 8.3
Primary 38.0 28.7 24.3 9.1
Secondary 34.2 28.4 26.8 10.6
Tertiary college 25.4 31.6 33.7 9.3
University 24.3 34.0 33.3 8.4
Age group (Years)
age18-35 33.8 29.4 27.0 9.7 age36-55 36.2 29.5 24.0 10.2
age56-65 36.6 29.9 25.6 7.9 age66-above 43.7 25.7 25.0 5.6
Source: SCI Survey, 2013
Table 4. How often do you think human rights institutions can be trusted to do the right think for Kenyans? 2013
Always Most of the time Some of the time Never
National 42.7 31.1 20.8 5.3
Region
Rural 46.9 28.8 19.0 5.3
Urban 36.8 34.4 23.4 5.4
Gender
Male 43.1 30.3 20.2 6.4
Female 42.5 31.6 21.2 4.6
Education
None 48.0 31.0 14.0 7.0
Primary 45.7 30.2 19.9 4.2
Secondary 40.4 30.2 23.4 6.0
Tertiary college 34.8 33.5 25.0 6.6
University 26.0 42.9 25.3 5.9
Age group (Years)
age18-35 43.8 30.2 20.4 5.6
age36-55 40.8 31.9 22.1 5.3
age56-65 41.7 33.6 19.2 5.5
age66-above 47.1 29.8 19.3 3.8
Source: SCI Survey, 2013

International Journal of Development and Sustainability Vol.7 No.1 (2018): 34-59
44 ISDS www.isdsnet.com
A larger proportion of Kenyans always ‘trust’ and trust ‘most of the time’ human rights institutions than
they do the government. In 2013, about 43% of respondents indicated that human rights institutions can be
trusted ‘always’ while another 31% stated that these institutions can be trusted ‘most of the time’.
Levels of trust bestowed upon the judiciary appear to be relatively high. About 42% of Kenyans trust the
judiciary ‘always’ and another 29% trusts the judiciary ‘most of the time.’ Only 7.5% ‘never’ trust the
judiciary, with urban and rural rates of about 10% and 6%, respectively. Females have higher levels of trust
than males. Education also seems to dampen the proportion of those who trust ‘always’ (Table 5).
Table 5. How often do you think the courts (judiciary) can be trusted to do the right thing for Kenyans? 2013
Always Most of the time Some of the time Never
National 42.3 29.0 21.2 7.5
Region
Rural 48.0 26.6 20.0 5.5 Urban 34.0 32.5 22.9 10.4
Gender
Male 40.3 28.9 21.6 9.2
Female 43.6 29.1 20.9 6.4
Education
None 44.1 32.8 18.0 5.1
Primary 47.6 27.8 19.1 5.4
Secondary 38.2 27.7 22.9 11.2
Tertiary college 33.6 30.9 26.4 9.0
University 22.3 36.8 31.8 9.2
Age group (Years)
18-35 41.2 29.5 20.6 8.7
36-55 41.5 29.4 22.8 6.4
56-65 47.8 25.7 20.5 6.0
66-above 48.6 26.4 19.1 5.9
Source: SCI Survey, 2013
Figure 4. How often do you think the courts (judiciary) can be trusted to do the right thing for Kenyans? 2013
International Journal of Development and Sustainability Vol.7 No.1 (2018): 34-59
ISDS www.isdsnet.com 45
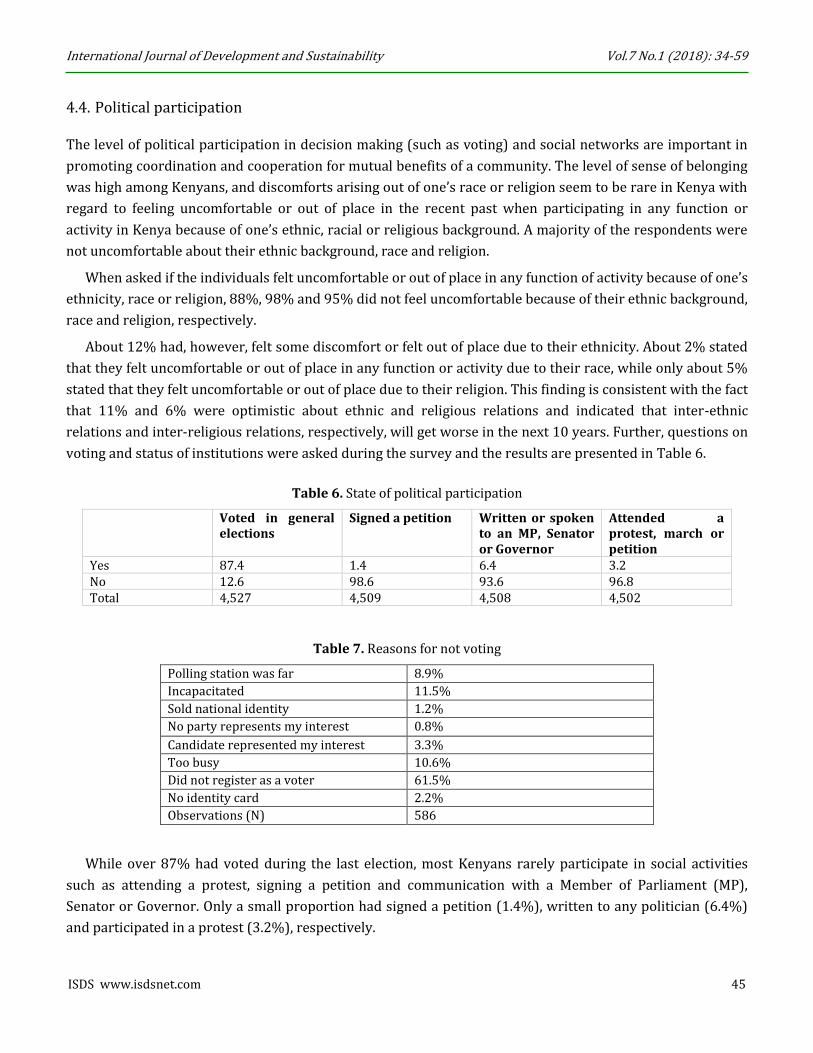
4.4. Political participation
The level of political participation in decision making (such as voting) and social networks are important in
promoting coordination and cooperation for mutual benefits of a community. The level of sense of belonging
was high among Kenyans, and discomforts arising out of one’s race or religion seem to be rare in Kenya with
regard to feeling uncomfortable or out of place in the recent past when participating in any function or
activity in Kenya because of one’s ethnic, racial or religious background. A majority of the respondents were
not uncomfortable about their ethnic background, race and religion.
When asked if the individuals felt uncomfortable or out of place in any function of activity because of one’s
ethnicity, race or religion, 88%, 98% and 95% did not feel uncomfortable because of their ethnic background,
race and religion, respectively.
About 12% had, however, felt some discomfort or felt out of place due to their ethnicity. About 2% stated
that they felt uncomfortable or out of place in any function or activity due to their race, while only about 5%
stated that they felt uncomfortable or out of place due to their religion. This finding is consistent with the fact
that 11% and 6% were optimistic about ethnic and religious relations and indicated that inter-ethnic
relations and inter-religious relations, respectively, will get worse in the next 10 years. Further, questions on
voting and status of institutions were asked during the survey and the results are presented in Table 6.
Table 6. State of political participation
Voted in general elections
Signed a petition Written or spoken to an MP, Senator or Governor
Attended a protest, march or petition
Yes 87.4 1.4 6.4 3.2 No 12.6 98.6 93.6 96.8 Total 4,527 4,509 4,508 4,502
Table 7. Reasons for not voting
Polling station was far 8.9%
Incapacitated 11.5%
Sold national identity 1.2%
No party represents my interest 0.8%
Candidate represented my interest 3.3%
Too busy 10.6%
Did not register as a voter 61.5%
No identity card 2.2%
Observations (N) 586
While over 87% had voted during the last election, most Kenyans rarely participate in social activities
such as attending a protest, signing a petition and communication with a Member of Parliament (MP),
Senator or Governor. Only a small proportion had signed a petition (1.4%), written to any politician (6.4%)
and participated in a protest (3.2%), respectively.
International Journal of Development and Sustainability Vol.7 No.1 (2018): 34-59
46 ISDS www.isdsnet.com
Further, respondents who did not vote were asked to provide a reason for not voting. Surprisingly,
majority of those who did not vote (62%) had not registered as voters. This constitutes the proportion of
respondents who were not willing to participate in a political process such as voting.
4.5. Diversity
Most respondents (65%), ‘strongly agreed’ that intermarriage across ethnic groups promotes ethnic
complementarities. Only about 10% either ‘disagreed’ or ‘strongly disagreed.’ When the proportion of those
who ‘strongly agree’ or ‘agree’ are amalgamated, the variations across sex and education are small.
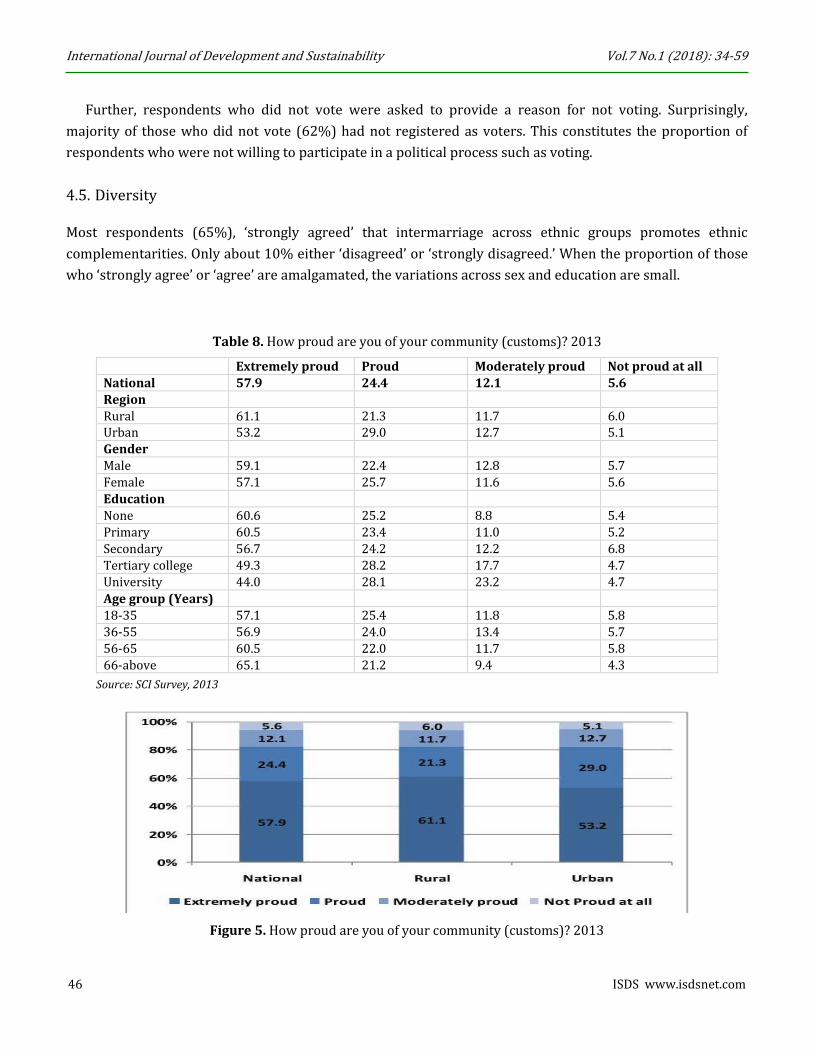
Table 8. How proud are you of your community (customs)? 2013
Extremely proud Proud Moderately proud Not proud at all
National 57.9 24.4 12.1 5.6
Region
Rural 61.1 21.3 11.7 6.0 Urban 53.2 29.0 12.7 5.1
Gender
Male 59.1 22.4 12.8 5.7
Female 57.1 25.7 11.6 5.6
Education
None 60.6 25.2 8.8 5.4
Primary 60.5 23.4 11.0 5.2
Secondary 56.7 24.2 12.2 6.8
Tertiary college 49.3 28.2 17.7 4.7
University 44.0 28.1 23.2 4.7
Age group (Years)
18-35 57.1 25.4 11.8 5.8
36-55 56.9 24.0 13.4 5.7
56-65 60.5 22.0 11.7 5.8
66-above 65.1 21.2 9.4 4.3
Source: SCI Survey, 2013
Figure 5. How proud are you of your community (customs)? 2013

International Journal of Development and Sustainability Vol.7 No.1 (2018): 34-59
ISDS www.isdsnet.com 47
It appears many respondents have close friends who have other ethnic identity (rather than their own).
About 79% stated that they ‘always’ have close friendship with people of other ethnic identity. Urban
residents (about 89%) are more likely to have close friendship than rural residents (about 71%). Education
also increases the proportion of those who are likely to ‘always’ have close friendship with people of other
ethnicity. Even with the stated levels of friendship among Kenyans, the levels of interactions across
ethnicities may be modest given that most Kenyans (47%) spend ‘only some of the time’ with people of other
ethnicity rather than ‘most of the time’ (about 28%). Besides other factors, the levels of interactions may be
determined by area of residence.
Table 9. How often do you spend your free time with people of other ethnic groups? 2013
Extremely proud Proud Moderately proud Not proud at all
National 57.9 24.4 12.1 5.6
Region
Rural 61.1 21.3 11.7 6.0 Urban 53.2 29.0 12.7 5.1
Gender
Male 59.1 22.4 12.8 5.7
Female 57.1 25.7 11.6 5.6
Education
None 30.6 25.2 8.8 5.4
Primary 60.5 23.4 11.0 5.2
Secondary 56.7 24.2 12.2 6.8
Tertiary college 49.3 28.2 17.7 4.7
University 44.0 28.1 23.2 4.7
Age group (Years)
18-35 57.1 25.4 11.8 5.8
36-55 56.9 24.0 13.4 5.7
56-65 60.5 22.0 11.7 5.8
66-above 65.1 21.2 9.4 4.3
Source: SCI Survey, 2013
Individuals were asked to describe their frequency of communication with people of other ethnicities’.
Most of the respondents (44%) communicated with people of other ethnicity ‘only some of the time’ followed
by 29% who communicated ‘most of the time’, while about 16% communicated ‘always.’ Only 10% indicated
that they never communicated with people of other ethnicity.
4.6. Identity
Identity is measured using pride one has over the national identity as well as other social identities.
Respondents were asked to state their levels of pride at being Kenyan. Most respondents (about 91%) were
either ‘extremely proud’ or ‘proud’ to be Kenyan. Only under 2% were ‘not proud at all’ while about 7% were
moderately proud. Rural and urban rates are not conspicuously different.

International Journal of Development and Sustainability Vol.7 No.1 (2018): 34-59
48 ISDS www.isdsnet.com
Table 10. How proud are you to be Kenyan?
Extremely proud Proud Moderately proud Not proud at all
National 72.0 18.9 7.3 1.7
Region
Rural 71.4 18.6 7.8 2.1 Urban 72.9 19.5 6.5 1.1
Gender
Male 73.8 17.2 6.4 2.6
Female 71.0 20.0 7.9 1.2
Education
None 60.9 27.3 9.1 2.6
Primary 73.6 17.6 7.6 1.2
Secondary 74.8 17.4 6.1 1.7
Tertiary college 70.0 19.8 8.3 1.9
University 72.6 17.7 4.6 5.1
Age group (Years)
18-35 71.8 19.7 7.1 1.4
36-55 71.3 18.4 8.3 2.1
56-65 73.5 16.9 8.0 1.6
66-above 75.2 19.2 3.6 1.9
Source: SCI Survey, 2013
Table 11. To what extent do you agree with the view that “your community has a strong sense of identity? 2013
Always Most of the time Sometimes Never
National 60.5 27.8 9.4 2.3
Region
Rural 64.6 25.8 8.2 1.4 Urban 54.4 30.6 11.3 3.7
Gender
Male 62.4 27.1 9.0 1.5
Female 59.3 28.2 9.7 2.8
Education
None 64.7 29.8 4.4 1.1
Primary 60.0 27.9 9.8 2.2
Secondary 59.3 26.3 11.3 3.1
Tertiary college 6.9 28.3 7.2 1.5
University 55.2 30.3 11.8 2.8
Age group (Years)
18-35 59.0 28.4 10.5 2.2
36-55 61.3 26.2 9.1 3.3
56-65 61.5 30.1 7.8 0.6
66-above 66.0 27.0 6.4 0.5
Source: SCI Survey, 2013

International Journal of Development and Sustainability Vol.7 No.1 (2018): 34-59
ISDS www.isdsnet.com 49
4.7. Peace
In earlier sections, peace was defined as the absence of conflict. Questions to gauge the state of peace in the
country revolved around both individual and group variables and characteristics. With respect to ethnic
groups, respondents were asked to rate how people of different ethnic groups get along. At the national level,
most respondents stated that different ethnic groups get along ‘very well’ (40%) or ‘well’ (47%). Only about
9% said the ethnic groups were getting along either ‘poorly’ or ‘very poorly.’ A larger proportion of rural
respondents (about 88%) than the urban residents (about 84%) stated either that ethnic groups were
getting along ‘very well’ or ‘well’. Relative to their views on how people of different ethnic groups were
getting along, respondents were generally less optimistic about how people of different socioeconomic class
were getting along. Most respondents stated that peoples of different socio-economic class were getting
along ‘well’ (43%) followed by ‘very well’ 34%, ‘poorly’ (12%) and ‘very poorly’ (5%).
Table 12. Overall, how would you say people of different socio-economic class are getting along these days? 2013
Very well Well Poorly Very poorly Don’t know
National 34.3 42.7 12.1 4.8 6.2
Region
Rural 37.2 42.1 11.6 3.8 5.3 Urban 30.0 43.5 12.8 6.3 7.4
Gender
Male 35.6 41.0 13.8 4.4 5.2
Female 33.5 43.7 11.0 5.1 6.7
Education
None 42.0 43.0 6.6 3.2 5.2
Primary 35.3 41.9 11.7 4.7 6.5
Secondary 30.9 42.9 13.8 5.6 6.7
Tertiary college 32.8 39.0 17.8 5.6 4.9
University 24.5 57.1 9.6 4.4 4.4
Age group (Years)
18-35 32.9 43.7 12.5 5.6 5.3
36-55 36.0 40.9 12.0 4.6 6.6
56-65 36.8 42.5 11.3 3.2 6.2
66-above 34.0 42.9 10.3 3.2 9.6
Source: SCI Survey, 2013
Most respondents seem to attest that they relate ‘very well’ (44% or ‘well’ (43%) with people of other
ethnic groups even after the effects of the post-election violence of 2007. The rural proportion is slightly
higher than the urban proportion among those whose response was “very well”. The relatively high levels of
good relations are supported by peoples’ experiences on conflicts. Asked whether they had constant conflicts
with their neighbours’, most respondents (95%) stated that it was ‘not true’ that this was the case. This
applied in approximately equal measure across rural and urban areas.

International Journal of Development and Sustainability Vol.7 No.1 (2018): 34-59
50 ISDS www.isdsnet.com
Table 13. You have constant conflicts with your immediate neighbours?
True Somewhat true Not true
National 1.3 3.9 94.9
Region
Rural 1.4 3.8 94.8 Urban 1.1 4.0 94.9
Gender
Male 1.2 3.2 96.6
Female 1.3 4.3 94.4
Education
None 1.6 7.2 91.2
Primary 1.1 3.5 95.5
Secondary 1.6 2.6 95.8
Tertiary college 0.4 6.2 9.34
University 2.2 2.5 95.3
Age group (Years)
18-35 1.1 4.2 94.7
36-55 1.6 3.6 94.7
56-65 1.1 4.4 94.5
66-above 0.8 2.2 96.9
Source: SCI Survey, 2013
Only about 13% of the respondents stated that they have been victims of crime over the last one year. The
proportion of those who have been victims of crime is larger in urban (about 17%) than rural areas (about
10%). With respect to sex, males and females have proportions of about 15% and 12%, respectively –
suggesting slightly higher levels for males being victims of crime.
Table 14. Have you ever been a victim of crime in the last one year?
Yes No National 13.0 87.0 Region Rural 10.4 89.6 Urban 16.6 83.4 Gender Male 14.5 85.5 Female 12.0 88.0 Education None 10.0 90.0 Primary 12.6 87.4 Secondary 13.5 86.5 Tertiary college 15.3 84.7 University 18.7 81.3 Age group (Years) 18-35 13. 6 86.4 36-55 13.2 86.8 56-65 10.2 89. 8 66-above 11.8 88.2
Source: SCI Survey, 2013

International Journal of Development and Sustainability Vol.7 No.1 (2018): 34-59
ISDS www.isdsnet.com 51
4.8. Prosperity
Respondents were asked to describe the status of socio-economic problems facing their society during the
study period. Youth unemployment, food insecurity, income inequalities, poor access to public services,
including poor road infrastructure and access to clean and safe water were characterised or perceived as
greater problems facing the country.
4.8.1. Youth unemployment
Youth unemployment affects service delivery to under-represented groups and/or regions. Further,
employment inequities also undermine the capacity of underrepresented groups to resort to successful self-
provisioning in the face of failed service delivery. Employment inequities also undermine employment
potential for the under-represented, affecting their scope for remittances and contributing to poverty
alleviation. A majority (92%) of the respondents rate youth unemployment to be one of the major challenges
affecting their communities, and hence has implications on social cohesion of their community.
4.8.2. Inaccessibility to water
Access to clean and safe water is an important aspect of socio-economic status of any community, and has
implications on status of social cohesion. However, access to water can be limited by factors such as long
distance to water source, environmental factors and unaffordable costs. Poor access to water is a source of
conflict especially in arid and semi-arid lands, thus perpetuating peaceful coexistence among the affected
communities. Access to safe and clean water was ranked the fifth in the list of the most critical challenges
affecting communities. About 47% of the respondents had indicated that access to safe and clean water was a
problem. During the survey, the respondents were further asked to rate the state of access to safe and clean
water resource. From the study findings, safe and clean water was accessible to about 52% of the
respondents; 38.6% accessed water but with difficulty, while 10% did not access water at all (Figure 6).
Figure 6. How do you rate of access to clean and safe drinking water?
International Journal of Development and Sustainability Vol.7 No.1 (2018): 34-59
52 ISDS www.isdsnet.com
Majority of the respondents in urban areas (59%) had access to this basic commodity compared to 47% of
respondents in rural areas. More urban residents compared to rural residents had access to clean and safe
water. Extinction of cultural practices (19%) and extinction of ethnic identities (18%) were not characterised
as major problems.
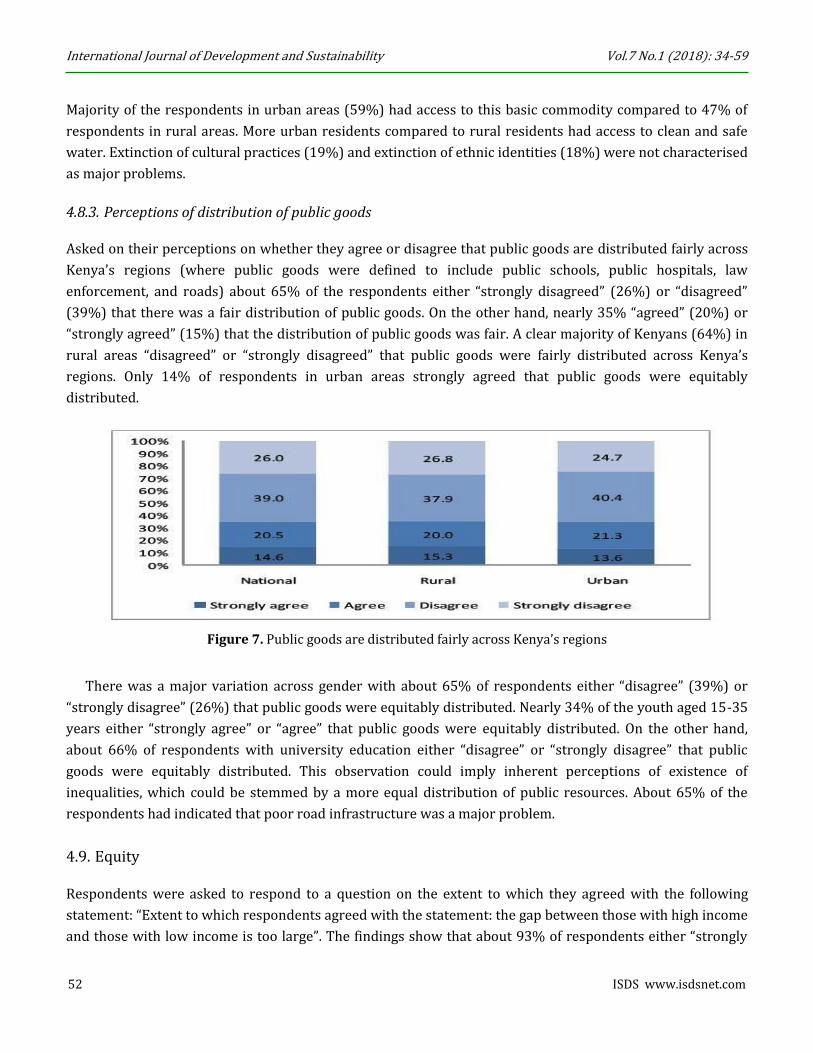
4.8.3. Perceptions of distribution of public goods
Asked on their perceptions on whether they agree or disagree that public goods are distributed fairly across
Kenya’s regions (where public goods were defined to include public schools, public hospitals, law
enforcement, and roads) about 65% of the respondents either “strongly disagreed” (26%) or “disagreed”
(39%) that there was a fair distribution of public goods. On the other hand, nearly 35% “agreed” (20%) or
“strongly agreed” (15%) that the distribution of public goods was fair. A clear majority of Kenyans (64%) in
rural areas “disagreed” or “strongly disagreed” that public goods were fairly distributed across Kenya’s
regions. Only 14% of respondents in urban areas strongly agreed that public goods were equitably
distributed.
Figure 7. Public goods are distributed fairly across Kenya’s regions
There was a major variation across gender with about 65% of respondents either “disagree” (39%) or
“strongly disagree” (26%) that public goods were equitably distributed. Nearly 34% of the youth aged 15-35
years either “strongly agree” or “agree” that public goods were equitably distributed. On the other hand,
about 66% of respondents with university education either “disagree” or “strongly disagree” that public
goods were equitably distributed. This observation could imply inherent perceptions of existence of
inequalities, which could be stemmed by a more equal distribution of public resources. About 65% of the
respondents had indicated that poor road infrastructure was a major problem.
4.9. Equity
Respondents were asked to respond to a question on the extent to which they agreed with the following
statement: “Extent to which respondents agreed with the statement: the gap between those with high income
and those with low income is too large”. The findings show that about 93% of respondents either “strongly

International Journal of Development and Sustainability Vol.7 No.1 (2018): 34-59
ISDS www.isdsnet.com 53
agreed” (65%) or “agreed” (28%) with the statement. There was no major variation among respondents in
urban and rural areas, with over 95% of the respondents either strongly agreeing or agreeing with the
statement.
Table 15. Perceptions on distribution of public goods by region, age, gender and education
Strongly agree Agree Disagree Strongly disagree
National 14.6 20.5 39.0 26.0
Region
Rural 15.3 20.0 37.9 26.8
Urban 13.6 21.3 40.4 24.7
Gender
Male 16.5 19.4 38.1 26.0
Female 13.3 21.2 39.5 25.9
Education
None 12.7 19.9 43.6 23.8
Primary 16.2 21.1 36.8 25.8
Secondary 13.9 20.3 40.4 25.4
Tertiary college 9.9 20.0 40.5 29.5
University 15.7 18.1 35.1 31.1
Age group (Years)
18-35 14.5 19.8 39.7 26.0
36-55 15.0 20.9 38.3 25.8
56-65 16.2 21.7 37.8 24.2
66-above 11.5 21.1 38.3 29.1
About nine to every 10 Kenyans aged 18-35 years and 36-55 years (about 93.7%), either strongly agreed
or agreed with the statement that the gap between the high and low income groups was too large. In slight
contrast, about 93.7% of Kenyans aged 66 years and above stated that the gap was too large. 69% of the
respondents indicated that income inequalities were a major problem affecting their communities.
In response to the sentiments that Kenya is a land of economic opportunity where in the long run, hard
work brings better life, 93% of the respondents either strongly agreed (70%) or agreed (23%) with the
statement. At the same time, 93% of the respondents either strongly agreed (65%) or agreed (28%) that the
gap between those with low incomes and those with high incomes was too large. With regard to access to
social services among the low income groups, 74% were of the opinion that people living on low income
were not receiving adequate financial support from government, with 38% disagreeing with the statement
that low income groups receive adequate financial support from government and 37% strongly disagreeing
with the statement.

International Journal of Development and Sustainability Vol.7 No.1 (2018): 34-59
54 ISDS www.isdsnet.com
Figure 8. Extent to which respondents agree with the statement: the gap between those with high income and those with low income is too large
Table 16. Indicate the extent to which you agree with the various statements
Kenya is a land of economic opportunity
Large gap exist between rich and poor
Low income group receives adequate financial support
Support programmes have contributed to peaceful community coexistence
Strongly agree 70.3 65.4 10.0 30.4
Agree 22.9 27.6 15.7 34.8
Disagree 5.5 5.9 37.8 21.4 Strongly disagree 1.3 1.1 36.5 13.3
Observations (N) 4,395 4,390 4,390 4,381
Further, 64% of the respondents either strongly agreed (30%) or agreed (35%) with the statement that
social government programmes have contributed to peaceful coexistence in their communities.
4.9.1. Food security
Another major challenge affecting Kenyans was food insecurity, with 76% of the response rate. About 38% of
the households were either never (9%) or only some of the time (30%) able to afford three meals per day.
This is a disturbing finding and could have implications on the overall social cohesion of the country.
4.10. Future expectation
Individual expectations about the future are important in analysing the level of individual satisfaction with
life, and hence indication of potential sustainability of measured social cohesion levels across various socio-
economic groups. During the survey, respondents were asked to indicate their level of expectation of life in
the next ten years with respect to relations with other ethnic groups, races and religions. The results are
presented in Table below.

International Journal of Development and Sustainability Vol.7 No.1 (2018): 34-59
ISDS www.isdsnet.com 55
Table 17. How often did your household afford buying food for three meals a day in the last 1 month?
Always Most of the time Only some of the time Never
National 33.1 28.1 30.1 8.6
Region
Rural 28.2 25.9 36.1 9.8 Urban 40.3 31.3 21.6 6.8
Gender
Male 33.2 27.5 30.7 8.6
Female 33.1 28.5 29.8 8.6
Education
None 11.8 24.3 48.9 15.1
Primary 26.2 29.2 34.3 10.3
Secondary 42.8 28.1 23.2 5.9
Tertiary college 55.7 29.2 14.2 1.0
University 65.5 25.8 6.1 2.6
Age group (Years)
18-35 37.2 29.4 25.7 7.7
36-55 32.9 26.0 31.5 9.6
56-65 24.6 31.3 34.7 9.3
66-above 17.7 24.7 49.1 8.5
Table 18. Future expectations about relationships across social groups (%)
Inter-ethnic relations
Intra-ethnic relations
Race relations Inter-religious relations
Intra-religious relations
Improve very much
40.6 43.5 34.9 42.2 44.8
Improve slightly 33.3 31.5 28.7 29.7 28.1
Remain unchanged
15.4 20.2 31.8 22.3 23.5
Get worse 10.7 4.8 4.5 5.8 3.6
Observations (N) 4,510 4,510 4,497 4,511 4,506
The findings indicate that a moderate proportion of the respondents were optimistic that inter- ethnic
(41%), intra-ethnic relations (45%), inter-religious (42%) and intrareligious relations (45%) will improve in
the next 10 years, respectively. About 32% were of the perception that relations among races in the country
will remain unchanged.
As depicted in the following table, 74% of Kenyans are not worried of becoming victims of crime due to
their ethnic background. With respect to possibilities of becoming victims of crime, one’s socio-economic
status and religion offers less worries for Kenyans (than ethnic background). About 78% and 85% of
Kenyans were “not worried” of becoming victims of crime because of their socio-economic background and
religion, respectively.
International Journal of Development and Sustainability Vol.7 No.1 (2018): 34-59
56 ISDS www.isdsnet.com
Table 19. How worried are you about ethnic becoming a victim of crime in Kenya because of your ethnicity, socio-economic status and religion?
Ethnic background Socio-economic status Religion Very worried 11.6 9.2 6.5 Worried 13.7 12.6 8.3 Not worried 74.7 78.2 85.2 Total 4,536 4,532 4,532
5. Discussion and policy implications
The objective of the study was to explore the perception of Kenyans regarding the concept of social cohesion.
This objective has been met in the preceding pages to the extent permitted by existing information. In
various parts of Kenya, the FGDs showed that unemployment is a major cause of socio-economic disquiet.
The discussions pointed to idle youth with varying levels of education who are unable to find work and
consequently elide into delinquency and crime. In some parts of the country, the importation of social values
was upsetting communities, as such values overshadowed traditions and religious beliefs. While class has
never been a core area of contestation, it was clear from the FGDs that people were increasingly aware of the
differences in socio-economic status in society. There was also an awareness of inequity in the government’s
sharing out of employment opportunities and general service delivery. There is an underlying cynicism that
neither the spirit of the Constitution nor initiatives such as the Truth Justice and Reconciliation Commission’s
report will receive adequate attention. The literature emphasises the role of social cohesion in national
development (Ferroni et al. 2008; Markus, 2010). For Latin America, it was quite clear that rising social
cohesion is associated with various desirable circumstances for national development: political stability
enabled the development of good policies and their effective delivery, which in turn enabled technological
change for economic growth.
The current study’s correlation matrix also pointed to the potential benefits of improved social cohesion,
including improved access to water and sanitation, electricity, literacy, school enrolment and incomes. Many
of these are interventions whose supply is an obligation of the government, especially to the extent that the
regions that already have them also got them from the government.
But the government must also be interested in their supply as a means of enhancing social cohesion,
including safe water, human capital, and physical infrastructure (for improved access). Additionally, fidelity
to evidence of underlying tensions – such as are in the TJRC and Ndung’u reports– would also enhance
prospects for local and indeed national cohesion.
Chapter 11 of the Constitution provides for the equitable devolution of development, but the political will
with which to achieve this has been lacking, hence the persisting vertical and horizontal inequalities.
Secondly, the starting inequalities mean that the leading areas are better placed in multiple respects to reap
the benefits of devolution than the lagging hitherto marginalised areas.
Vision 2030 on the need for equitable development that reduces marginalization, and makes the provision
of key basic needs a right whose denial the government is mandated to explain to the courts (Articles 20 and

International Journal of Development and Sustainability Vol.7 No.1 (2018): 34-59
ISDS www.isdsnet.com 57
21).Meanwhile, Article 201 creates the Equalization Fund to “to provide basic (social and infrastructure)
services to marginalized areas to the extent necessary to bring the(m)… to the level generally enjoyed by the
rest of the nation, so far as possible,” the Fund’s one-half percent of national revenue pales in comparison to
Kenya’s extents of poverty, inequality and marginalization. Therefore, more decisive national and sub-
national political wills are necessary to ring-fence the resources required for substantive remedies to the
factors that undermine national and sub-national social cohesion.
Policy suggestions emerging from the study include the need to address the following areas:
Horizontal and vertical inequalities, including access to public services and Opportunities;
Poverty through a growth, redistribution and productivity oriented strategy.
This is critical for improved livelihoods and prosperity;
Social cohesion is imperative for sustainable development of the country;
There is need to promote social values, trust, peace and positive management of ethnic diversities
in the county. Investing in systems for early warning, conflict management and peace building is
critical;
Sustained human capital development by investing in health and education, and targeting
counties with low human capital outcomes;
Establish a social cohesion data and information system and ensure regular data and information
collection. This would ensure effective monitoring of social cohesion in the country;
Human and infrastructure capital development should also be strengthened, notwithstanding
devolution of service delivery;
At the national level, Equity and Peace are the worst dimensions of social cohesion; and
Mitigating the harsh environments among pastoralists;
In concluding, we point out some possible areas of action going forward:
The interest in social cohesion in Kenya has been the product of the post-2007 election violence,
inevitably so given the findings especially of the Waki Report (GoK, 2008). However, the current
report has illustrated that social cohesion is important even in contexts where there is no
violence.
Consequently, there is need for a national debate on what focus Kenya’s cohesion debate should
take, providing appropriate guidance to which social cohesion should be estimated with which
indicators, based on what sequencing of interventions. A national database should be created for
such data. It is likely most suitable to estimate sub-national cohesion based on sub-national
priorities, while a national cohesion index is estimated using nationwide indicators.
Meanwhile, there is still baggage from the 2007/08 violence, the Ndung’u Report and indeed from
various other historical injustices such as are reported in the TJRC report. Consequently,
initiatives should continue in the direction of resolving the same.
International Journal of Development and Sustainability Vol.7 No.1 (2018): 34-59
58 ISDS www.isdsnet.com
Cohesion initiatives should be harnessed across the country. The grassroots cohesion initiatives
should be strengthened to diminish the risk of local in cohesion. However, the national initiatives
that drive development – e.g. human and infrastructure capital development – should also be
strengthened, notwithstanding devolution of service delivery. This is because of the wide
development statuses across counties at the March 2013 onset of devolution.
At the national level, Equity and Peace are the worst dimensions of social cohesion. At the sub-
national level, the ASAL counties invariably have the weakest cohesion indices. While these
findings are based on the indicators entered into the PCA analysis, the Gini coefficients showed
the country to have wide (spending) inequalities. Additionally, pastoralist livelihoods are
insecure and conflict prone, and more must be invested into mitigating the harsh environments in
which such people live.
References
Acket, S., Borsenberger, M., Dickes P. and Sarracino, F. (2011) “Measuring and Validating Social Cohesion: A
Bottom-up Approach”, Paper presented at an International Conference on Social Cohesion and Development
organized by the OECD, 20-21st January 2011, Development Centre, Paris, available at:
https://www.oecd.org/dev/pgd/46839973.pdf (accessed 20 May 2017).
Barcena, A., Prado, A., Beccaria, L. and Malchik, S. (2010), Social Cohesion in Latin America: Concepts Frames of
Reference and Indicators, New York, NY.
Botterman, S., Hooghe, M. and Reeskens T. (2012), “One Size Fits All”? An Empirical Study into the
Multidimensionality of Social Cohesion Indicators in Belgian Local Communities, Urban Studies, Vol. 49 No. 1,
pp. 185-202.
Easterly, W. (2006), “Social Cohesion, Institutions, and Growth”, Working Paper Number 94, Center for Global
Development, August 2006
Englebert, P., Tarango S. and Carter M. (2002), “Dismemberment and Suffocation: A Contribution to the
Debate on African Boundaries”, Comparative Political Studies, Vol. 35 No. 10, pp. 1093-1118.
Farole, T., Rodríguez-Pose, A. and Storper, M. (2011) “Cohesion Policy in the European Union: Growth,
Geography, Institutions”, JCMS: Journal of Common Market Studies, Vol. 49 No. 5, pp. 1089-1111.
Government of Kenya, (2004), Report of the Commission of Inquiry into the Illegal/Irregular Allocation of
Public Land (The Ndung’u Report), Nairobi.
Government of Kenya, (2008), Report of the Commission of Inquiry into Post Election Violence (CIPEV), Nairobi.
Government of Kenya, (2010), The Constitution of Kenya, 2010, Nairobi.
Government of Kenya, (2013), Report of the Truth, Justice and Reconciliation Commission, Nairobi.
Green, A., Preston, J. and Sabates, R. (2003), “Education, Equity and Social Cohesion: A Distribution Model”,
Research Report No. 7, London: Centre for Research on the Wider Benefits of Learning.
International Journal of Development and Sustainability Vol.7 No.1 (2018): 34-59
ISDS www.isdsnet.com 59
Huillery, E. (2009), “History Matters: The Long Term Impact of Colonial Public Investments in French West
Africa”, American Economic Journal - Applied Economics, Vol. 1 No. 2, pp. 176—215.
Langer, A. and Stewart, F. (2012), Measuring Social Cohesion: The Case of Kenya. London.
Langer, A., Stewart, F., Smedts, K. and Demarest, L. (2015), “Conceptualizing and Measuring Social Cohesion
in Africa: Towards a Perceptions-Based Index”, CRPD Working Paper Issue No. 21 Center for Research on
Peace and Development, July 2015.
Markus, A. (2010), Mapping Social Cohesion: The Scanlon Foundation Surveys Summary Report 2010, Caulfield East. Michalopoulos, S. (2011), “The long-run Effects of the Scramble for Africa”, Working Paper Series No. 17620,
NBER, November 2011
Mwabu, G., Munga, B., Onsomu, E., Nyanjom, O. and Nafula, N. (2013), Linking Social Cohesion to National
Development, Nairobi.
Rajulton, F., Ravanera, Z.R. and Beaujot, R. (2007), “Measuring Social Cohesion: An Experiment using the
Canadian National Survey of Giving, Volunteering and Participation”, Social Indicators Research, Vol. 80, pp.
461-492.

![NATIONAL COHESION AND INTEGRATION ACT - Kenya …€¦ · LAWS OF KENYA NATIONAL COHESION AND INTEGRATION ACT No. 12 of 2008 Revised Edition 2012 [2008] Published by the National](https://img.dokumen.tips/doc/110x75/5b5855ed7f8b9a6a5d8bd245/national-cohesion-and-integration-act-kenya-laws-of-kenya-national-cohesion.jpg)