Embed Size (px)
Citation preview
Perceptions and price:
Evidence from CEO presentations at IPO roadshows
Elizabeth Blankespoor
Stanford University
Graduate School of Business
Bradley E. Hendricks
University of North Carolina at Chapel Hill
Kenan-Flagler Business School
Gregory S. Miller
University of Michigan
Stephen M. Ross School of Business
January 2017
Forthcoming, Journal of Accounting Research
Abstract
This paper examines the relation between cognitive perceptions of management and firm
valuation. We develop a composite measure of investor perception using 30-second content-
filtered video clips of initial public offering (IPO) roadshow presentations. We show that this
measure, designed to capture viewers’ overall perceptions of a CEO, is positively associated with
pricing at all stages of the IPO (proposed price, offer price and end of first day of trading). The
result is robust to controls for traditional determinants of firm value. We also show that firms with
highly perceived management are more likely to be matched to high-quality underwriters. In
further exploratory analyses, we find the impact is greater for firms with more uncertain language
in their written S-1. Taken together, our results provide evidence that investors’ instinctive
perceptions of management are incorporated into their assessments of firm value.
Keywords: investor perception, valuation, CEO, IPO, roadshow
JEL Codes: G12, G14, M12, M13, M41
Accepted by Philip Berger. We thank Bill Baber, Mary Barth, Camelia Kuhnen, Bob Libby, Bill Mayew, Eddie Riedl,
Mohan Venkatachalam, two anonymous reviewers, and workshop participants at the 2014 Duke/UNC Fall Camp,
Georgetown University, the 2016 Journal of Accounting Research conference, London Business School, MIT Sloan
School of Management, the 2015 Penn State Accounting Conference, Temple University, the University of Arizona,
the 2015 University of Colorado Accounting Conference, the University of Southern California, Vanderbilt
University, and the Victor L. Bernard Memorial Conference for helpful suggestions. We also thank Mae Bethel, Carlie
Cunningham, Christina Maimone, and Alex Storer for excellent research assistance; Michael Haupt, Schinria Islam,
and the Stanford Graduate School of Business Behavioral Lab for support with survey creation and administration;
and Jay Ritter for providing the Carter-Manaster rankings and each IPO firm’s founding date on his website.
Blankespoor ([email protected]) received financial support from the Michelle R. Clayman Faculty Fellowship,
Hendricks ([email protected]) from the Kenan-Flagler Business School and the Deloitte
Foundation, and Miller ([email protected]) from the Michael R. and Mary Kay Hallman Fellowship and Ernst and
Young.
1
1. Introduction
In this study, we examine the relation between investors’ perceptions of management and
firm valuation. A large body of literature argues that as humans interact, they form social
perceptions of others (Adams, et al., 2011). These perceptions provide information that people use
when attempting to attain their goals (McArthur and Baron, 1983). The perceptions are formed
rapidly and unconsciously, and they are based on a wealth of non-verbal information, including
gestures, body movement, dynamic facial expressions and eye gaze (Rosenthal, et al., 1979;
Ambady, Bernieri, and Richeson, 2000). We predict that perceptions created from observations of
management affect investors’ assessment of firm value.
We create a measure of perception using a “thin-slice” approach common in social vision
research. Specifically, we ask viewers to provide their perceptions of CEOs after watching 30-
second video clips of a CEO’s initial public offering (IPO) roadshow presentation with verbal
content filtered out. This filtering isolates the nonverbal visual and auditory signals that determine
rapidly-formed perceptions. Consistent with our prediction, we find a positive association between
cognitive perceptions of management and measures of firm value throughout the IPO process.
Our work builds on a body of research that shows investors find value in meeting with
management. Surveys of investor relations firms and of analysts show direct interactions with
management are highly sought after (Bushee and Miller, 2012; Brown, et al., 2015). Empirical
studies confirm the value of such meetings for analysts and investors (Bushee, Jung, and Miller,
2016; Green, et al., 2014; Soltes, 2014). There is also evidence of a capital market response to
managers’ affect as revealed by vocal cues during conference calls (Mayew and Venkatachalam,
2012). Specific to our setting, Ann Sherman testified to the U.S. Senate in 2012 that investors
primarily attend IPO roadshows “to get a feel for [management], because [investors] are not just
investing in the idea or the product; [investors] are investing or betting on the management team”

2
(Sherman, 2012). We combine this evidence with the psychology literature’s documentation of
individuals forming intuitive perceptions to argue that investors form perceptions and incorporate
them into firm value. That is, firms with more highly perceived managers receive higher
valuations.1
While we argue that perceptions of management are priced, we know that investors have a
large amount of verifiable, objective information about the firm. Firm financial reports provide
historical performance of the firm and detailed biographies that discuss the managers’ experience,
education, and general background. This information-rich environment is different from that in
many psychology studies and may reduce the role of basic cognitive assessments. Investors are
still likely to form cognitive perceptions of managers through interactions, but the investors might
focus solely on the “hard” information provided in regulatory filings and other disclosures to form
expectations of future cash flows. This tension suggests the impact of basic perceptions on firm
valuation is an empirical question.
Valuation implications are our primary focus, but it is also interesting to consider whether
any valuation response from investors is rational. If perceptions are an accurate measure of
manager quality, they should be priced (Drucker, 1954). Prior research has shown such perceptions
have accurately predicted educational, sales, and medical evaluation outcomes, especially when
based on dynamic behavior rather than static photos (Ambady, et al., 2000; Ambady, Connor, and
Hallahan, 1999). It is possible they are predictive in a corporate setting as well. Observing a CEO’s
dynamic behavior may provide information about their leadership skills and ability to interact with
stakeholders, which are important components of the CEO’s task. Alternatively, the perceptions
1 Investors could also be hoping that managers will provide additional “hard” information beyond that in the
registration statement, either intentionally or unintentionally. In fact, it is likely that investors hope to get both as these
are not mutually exclusive. As discussed later, we have designed our perceptions construct to remove potential “hard”
information.
3
may not capture information about skills which result in longer term value creation. We make no
prediction, but investigate future returns to assess the rationality of the valuation decisions.
Our empirical analysis begins by examining the association between basic perceptions of
management and firm valuation for a sample of 224 US IPOs filed from 2011 through 2013. We
estimate investors’ perception of management using naïve participants who view 30-second
content-filtered slices of CEOs’ roadshow presentations. To develop a rich, robust measure of
perception, we ask participants to assess each CEO’s competence, trustworthiness, and
attractiveness on a seven-point Likert scale. These are classic traits examined in the psychology
and economics literature. We select these traits because they are characteristics investors are likely
to naturally incorporate when perceiving management. Our goal is to prompt raters to consider
perception from various angles to make sure that idiosyncratic interpretations of a single
characteristic or its description do not skew our results. We focus our analysis on overall
perception, which is created by combining these three attributes to provide a composite measure
of perception. Each video clip is rated by at least 40 participants. We calculate mean ratings of
CEO-specific perceptions of competence, trustworthiness, and attractiveness, and then average the
characteristics for our summary CEO-specific measure of perception. This measure is designed to
capture investors’ overall instinctive perception of the CEO at the time of the firm’s IPO.2
We gain several advantages by using information-rich expressive behavior from CEO IPO
roadshow presentations. First, the IPO roadshow is the initial major exposure of management to
IPO investors prior to the market’s initial valuation of the firm, providing a clear link between
2 Our measure relies on two assumptions supported by prior literature: (1) perceptions based on thin slices of behavior
are reasonable proxies for judgments based on longer interactions (Ambady and Rosenthal, 1992). (2) Third party
ratings are reasonable proxies for investors’, given that perceptions are not affected by intelligence or effort (Ambady,
Bernieri, and Richeson, 2000).
4
investor perceptions in that period and valuation (Ernst & Young, 2008).3 Second, the use of
content-filtered video clips allows us to base perceptions on rich, dynamic information about CEOs
while controlling for the content of what is being said. Third, the IPO setting allows us to focus on
younger firms where financial performance is less informative and assessment of management is
considered more important, increasing the power of our tests of the impact of perceptions of
management (Kim and Ritter, 1999; Chemmanur, et al., 2013). 4
We examine the valuation of perception throughout the IPO period. The valuation process
begins with underwriters providing an initial proposed IPO price before the roadshow presentation.
This price is modified based on investor feedback via limit orders after the roadshow presentation
to create the final offer price. Finally, the firm begins public trading, creating a final market value
at the end of the first day of trading. We find a positive relation between perceptions of
management and the IPO firm’s valuation at all three of these valuation points. The relation is
robust to the inclusion of important determinants of price (i.e., firm, offer, and CEO characteristics
such as executive age, gender, and facial width-to-height ratio). Including perception increases the
explanatory power of the final market valuation model by 2.3 percentage points.
In addition to valuation, the matching of firms and underwriters is an important part of the
IPO process. The literature examining this matching indicates that higher quality firms are matched
to higher quality underwriters. Accordingly, we predict that higher quality underwriters will prefer
firms with higher perceived managers. Our results support this prediction.
3 This survey of institutional investors reports that more than 88% of institutional investors cite the quality of the
roadshow as a key nonfinancial measure in their buying decisions and that the roadshow is generally “the only time a
company’s senior management meets the investor.” 4 In support of this, Kaplan and Stromberg (2004) examine venture capital firms’ reasons for investing in a given firm
and find that 60% cite managerial quality, while only 27% cite performance to date. While the IPO setting increases
the power of the tests, the findings are less generalizable to other settings.
5
We next perform several exploratory tests to better understand how perception is
incorporated during the IPO valuation process, as well as to assess the sufficiency of alternative
proxies of perception. We first examine the relation between perceptions and price revision. If the
underwriters fully incorporate their perceptions into the proposed price, there would be no relation
between perceptions and price revision after the initial proposed price.5 However, reputational
concerns may constrain underwriters to focus on more objective, verifiable information when
valuing issuers, thus underweighting the perceptions. Accordingly, underwriters’ perceptions of
management would have a smaller impact on the initial proposed price, and perception would
impact price revision as underwriters receive information from investors during the book building
process (Benveniste and Spindt, 1989). We find that perception is associated with the price
revision from the proposed price to the closing price on the firm’s first day of secondary market
trading.6
In our second set of exploratory tests, we examine the role that uncertainty might play in
the impact of perceptions. We find that the relation between perception and valuation is more
positive when there is more uncertain language in the firm’s final prospectus, consistent with
perception of management being more informative when there is more uncertainty in disclosure.
This is consistent with work by Milovac and Sanchez-Burks (2014) that shows investors are more
likely to place value on items such as managerial emotion when information is less certain.
While our preceding tests are attempts to more fully understand the economic phenomenon
of perception in the market, we also provide some additional analyses on the efficacy of an
5 Note that this is true whether the underwriters’ assessment of management exactly matches the market or it varies
from the market, but in a random way (i.e., noisy, but unbiased assessments). 6 However, the results should be viewed with a strong caveat. We cannot observe underwriters’ perceptions of
management, thus while our dependent variable is the change in valuation, our independent variable continues to be
the level of perception.
6
alternative proxy for perception. Specifically, in our third set of tests, we examine whether a
measure of perception based on static photos would be sufficient to capture investors’ perception
of management based on interactions. We find that the video-based perception measure dominates
the photo-based proxy when they are included in the same regression. The dynamic measure
remains positive and significant at the 5% level or better in our main analyses, while the static
measure is significantly positive in only one of the four models at the 10% level. When we examine
the static perception measure on its own, we find that it is positively associated with firm valuation
at a 5% level but does not reproduce the significant relation in the underwriter matching analysis.
Overall, a video-based proxy appears to more completely capture investors’ perception of
management interactions. However, if a video-based proxy is not available, a photo-based measure
does serve as a noisier proxy of investors’ perception that may find similar results in tests with
strong, clean research designs.
We next turn to investigating whether the pricing of perception is rational by examining
the association between perception and firms’ subsequent stock returns. If perceptions of CEOs
capture an aspect of manager quality, perceptions should not be correlated with future returns.
However, if perceptions are not actually informative in the CEO context and investors
inappropriately respond to perceptions in the moment rather than focusing on more objective
information included in the IPO filings, any short-term correlation between perceptions and firm
value would reverse in future stock returns.
Using several time periods, we fail to find a robust statistically significant relationship
between perception and firms’ post-IPO buy-and-hold abnormal returns, suggesting that investors
rationally incorporated perceptions of management. We then examine the relation between
perception and two outcomes – future CEO turnover and future return on assets (ROA) – as
7
potential reasons for rational incorporation of perceptions into firm value. We find evidence of a
negative relation with CEO turnover, but no relation with future accounting performance. While
the CEO turnover relation suggests perceptions may accurately reflect a weaker manager (or at
least a bad fit with the current firm), the expected shortcomings of a weaker manager are not
captured by the accounting performance during this period. Given the lack of consistent findings,
we advise caution in drawing a definitive conclusion.
We perform extensive robustness tests to confirm that results are not driven by CEO
gender, rater quality, or rater characteristics, and we find that our results are robust in all cases.
Overall, the evidence suggests that managers’ expressive behavior evokes instinctive perceptions
from investors, and that these perceptions influence investors’ assessment of firm value.
Our study contributes to several research streams. First, our study contributes to the
literature examining the impact of perceptions of individuals on economic outcomes. Prior and
concurrent work estimates perceptions of facial features based on still photos and examines their
relation to political outcomes, personal loan funding, market reactions to job and merger
announcements, and CEO compensation (e.g., Todorov, et al., 2005; Duarte, Siegel, and Young,
2012; Halford and Hsu, 2014; Graham, Harvey, and Puri, 2016). We add to the literature by
examining market pricing implications of perception, using “thin slices” of video. These
perceptions are based on information-rich excerpts of CEOs’ dynamic, physical behavior that
incorporate their mannerisms, movements, and vocal quality in addition to facial features, allowing
us to capture investors’ complex yet instinctive overall assessments of management.
Second, we bring additional evidence to the more general literature on whether and how
management impacts firm market value. A number of studies work to disentangle management
from the firm by testing for changes in investor behavior around a change in management (e.g.,
8
Johnson, et al., 1985; Bennedsen, Perez-Gonzalez, and Wolfenzon, 2012), or modeling
management characteristics such as education, gender, or founder-status (e.g., Cohen and Dean,
2005; Hendricks and Miller, 2014). Our setting and evidence provide an alternative and distinct
set of findings that imply firm management impacts firm value.
Third, we contribute to the disclosure literature by examining a disclosure channel that
includes a variety of nonverbal components. Several studies find evidence of an impact of
investors’ and analysts’ one-on-one meetings with management, implying that information may
be conveyed through multiple channels (Bushee, Jung, and Miller, 2016; Solomon and Soltes,
2015; Green, et al., 2014). Consistent with the potential importance of nonverbal behavior,
managerial affect conveyed through vocal cues in conference calls contains information about
financial misreporting and future performance (Hobson, Mayew, and Venkatachalam, 2012;
Mayew and Venkatachalam, 2012). Our study turns to the sensory-rich channel of roadshow video
presentations and finds evidence that valuable information about management is conveyed through
their nonverbal behavior.
Fourth, our study contributes to the IPO literature by being the first to examine how
information learned during the IPO roadshow influences IPO pricing. While practitioners have
suggested that investors learn valuable, nontangible information from attending an IPO firm’s
roadshow (NYSE/NASD, 2003; Sherman, 2012), our study is the first to provide empirical
evidence of the value of roadshow information, focusing on qualitative information.
2. Setting, motivation, and predictions
2.1. Perception
A large body of literature argues that through interaction humans form social perceptions
of others (Adams, et al., 2011). The ability to form such perceptions appears to be adaptive and
used as information to guide biological and social function behaviors (McArthur and Baron, 1983).

9
Research has found people draw on a wide range of nonverbal information in forming these
perceptions including gestures, general body movement, eye gaze, gait, posture, facial expression
and changes in tone of speech (Rosenthal, et al., 1979; Adams, et al., 2011). Although some of
these items may be broken into individual inputs, it appears that the richest sensory information
comes from dynamic, fluid behavior where there is multimodal input – particularly visual stimuli
(McArthur and Baron, 1983; Ambady, Connor, and Hallahan, 1999; Grahe and Bernieri, 1999;
Ambadar, Schooler and Cohn, 2005). As a package, these nonverbal actions are often termed to
be “expressive behavior” (Ambady and Rosenthal, 1992). The value of these dynamic situations
is not just in providing more pieces of information than a static picture, but also in dynamic
unfolding of the emotional display (Ambadar, Schooler and Cohn, 2005).
The assessment of expressive behavior appears to be unconscious to the person making the
evaluation.7 There is no evidence of rater fatigue over time or due to increased cognitive load, and
requiring explicit justification for perceptions can often reduce their accuracy (Ambady, Bernieri,
and Richeson, 2000). These basic perceptions are akin to System 1 thinking processes (Kahneman
and Frederick, 2002; Evans, 2008), which are described as more rapid, intuitive, and universal,
relative to System 2 thinking processes that are slower, controlled, and logical. System 1 processes
are the primary response in a given situation, which is consistent with the automatic, unconscious
nature of perceptions.
The expressive behavior is potentially an informative, unmanipulated signal about the
individual’s true disposition because the behavior is unconscious, difficult for individuals to
7 The cognitive schema involved in these decisions remain unclear. While some studies try to isolate individual stimuli
in an attempt to identify the schema, others argue it is more useful to focus on the predictive power of the process as
a whole (Adams, et al., 2011). For example, early work on brain imaging appeared to identify parts of the brain that
respond to facial stimuli. However, later work found the same areas also respond to body movement. Follow-up work
showed that body language and facial signals are combined to reach an overall conclusion (see De Gelder and Tamietto
(2011) for a discussion of this literature).
10
control or suppress, yet easily observed (DePaulo, 1992). Consistent with the potentially
informative nature of this signal, a large body of research shows that “naïve viewers” 8 can
accurately assess emotional states and long term personality traits, as well as more objective traits
such as intelligence (Gangestad, et al., 1992, Borkenau and Liebler, 1992; Murphy, Hall and
Colvin, 2003; Harrigan, Wilson, and Rosenthal, 2004).9 In addition, these social perceptions can
be predictive of longer-term evaluations and performance outcomes, such as teacher ratings
(Ambady and Rosenthal, 1993), sales evaluations (Ambady, Krabbenhoft, and Hogan, 2006),
political elections (Todorov, et al., 2005), criminal activities (Troscianko, et al., 2004), trial
outcomes (Blanck, Rosenthal, and Cordell, 1985), medical student performance (Rosenblum, et
al., 1994; Tickle-Degnen, 1998), and malpractice outcomes (Ambady, et al, 2002).
In sum, the literature shows that humans gather a wide range of information about other
humans, much of it unconsciously. This information is richest in a dynamic setting that allows
viewers to see body language, facial expression and other characteristics, as well as the emotional
progression of the subject. The perceptions formed during such encounters are often accurate, but
have the potential to be biased. For firm valuation, the perception literature implies that investors
are likely to form perceptions of management based on dynamic behavior in settings such as a
roadshow presentation, and to incorporate these perceptions into their firm valuations.
Accordingly, we predict firms with more highly perceived managers receive higher valuations
throughout the IPO process.
8 A “naïve viewer” is an external judge who has never met or interacted with the subject and who often does not even
know the situation in which the subject is pictured/filmed. 9 Obviously, these studies required measures of the characteristics being judged. Personality characteristics and
internal states were identified via asking the subjects and/or close acquaintances of the subjects. Intelligence was
measured using a short test.

11
In order for us to test the impact in financial markets using the IPO setting, we need to
develop a measure for perceptions of management. An ideal measure would use dynamic media
to capture management in a setting that is consistent with those seen by investors, so as to most
closely replicate the nonverbal cues present during capital market interactions (Borkenau, et al.,
2004, Yeagley, Morling and Nelson, 2007). To create such a measure, researchers frequently use
a “thin slices” approach. This involves taking several short “slices” of a dynamic media and
providing these to a naïve judge for rating across several characteristics. These thin slices are an
effective way of capturing individuals’ dynamic expressive behavior that is the basis for
perceptions (Ambady and Rosenthal (1992). In fact, such thin slices are equally effective in
comparison to much longer video, even when viewed by trained raters (Murphy, 2005).
The primary goal of our study is to examine whether instinctive perceptions influence
pricing in the IPO process; it is not necessary for the thin slice perceptions to be long-term
predictive. However, a natural question is whether such pricing of perceptions is rational.
Consistent with the broader perception literature, perceptions based on thin slices of expressive
behavior often predict future outcomes. Using segments of behavior ranging from as little as 10 to
60 seconds, studies find evidence that judgments of thin slices of behavior are associated with
longer-term evaluations and final outcomes in a broad range of fields, from teaching to sales and
even medical practice. (e.g., Ambady and Rosenthal, 1993; Rosenblum, et al., 1994; Tickle-
Degnen, 1998; Tickle-Degnen and Puccinelli, 1999; Ambady, et al., 2002; Ambady, Krabbenhoft,
and Hogan 2006).10
10 This implies that the initial perception remains influential even when information from subsequent interactions is
incorporated (e.g., Lord, Ross, and Lepper, 1979; Rabin and Schrag, 1999). However, our study does not attempt to
answer whether or to what extent initial perceptions impact later perceptions.
12
Within the setting of CEOs and firm value, it is not clear whether perceptions will predict
future outcomes. On one hand, the connection between CEOs’ expressive behavior and firm
outcomes may not be as direct as for teaching and sales, where the core job requirement is direct
communication of information to students or potential customers using expressive behavior. In
contrast, the position of CEO requires assessing investment opportunities and making sound
operational decisions. Thus, intuitive perceptions may not be relevant for firm value, with any
short-term correlation reversing in future stock returns. On the other hand, the core component of
the CEO’s task is to lead the company and convey their vision to stakeholders such as employees,
customers, suppliers, or investors. In this role, the perception of the CEO’s leadership abilities is
important to persuade others of their vision and motivate necessary actions. This suggests that
perceptions of a CEO could predict the abilities of the CEO in a variety of firm activities and thus
be relevant for firm value.
2.2. The role of roadshows in the IPO process
Uncertainty is pervasive throughout the IPO process. Potential investors usually know little
about the issuer, and the issuer knows neither the interested investors nor their level of interest. To
reduce this bilateral information asymmetry, an issuer is required to file an SEC registration
statement that provides extensive information about the firm (Leone, Rock, and Willenborg, 2007;
Loughran and McDonald, 2013). After filing, issuers enter into a designated quiet period that
extends through the completion of the offering. If an issuer learns new information during the quiet
period, the issuer has a responsibility under the Securities Act of 1933 to amend its filing to
communicate this information to investors. The registration process is designed to provide
investors with all the information they need to make an informed investment decision in a single
document.
13
After filing the S-1, the issuing firm’s management team promotes the offering via a series
of roadshows at financial centers (see Fig. 1).11 Typically, the firm’s management gives multiple
presentations a day to institutional investors over the final two to three weeks of the registration
period. Management is counseled to only make factually accurate statements that coincide with
the registration statements (Arcella, 2011). Despite the information being repetitive, Ann Sherman
testified to the U.S. Senate in 2012 that investors primarily attend roadshows to observe the
managers and “find value in watching them on their feet” (Sherman, 2012). The NYSE/NASD
advisory committee formed in 2003 to examine the fairness of the IPO process expressed a similar
view. In considering institutional investors’ selective access to roadshows, the committee
concluded:
[E]ven the opportunity to see and hear senior management may provide significant
information for an investment decision. Many potential investors, both in the IPO
and in the aftermarket, having been excluded from the roadshow, are not privy to
this information. To dispel the perception of unfairness, this must change.
(NYSE/NASD, 2003)
Following the committee’s recommendation, the 2005 Securities Offering Reform stated
that issuers that conduct roadshows in conjunction with an equity offering are required to file an
electronic copy of one of their roadshows with the SEC or make a “bona fide” electronic roadshow
available to unrestricted audiences during the registration period.12
11 A roadshow is defined under Rule 433 of the Securities Act of 1933 as an offer (other than a statutory prospectus
or a portion of one filed as part of a registration statement) that contains a presentation made by one or more members
of the issuer’s management team.
12 A bona fide electronic roadshow is defined in the final regulation as “a roadshow that is a written communication
transmitted by graphic means that contains a presentation by one or more officers of an issuer … [that] includes
discussion of the same general areas of information … that are written communications. To be bona fide, the version
need not address all of the same subjects or provide the same information as the other versions of an electronic
roadshow. It also need not provide an opportunity for questions and answers or other interaction.” Refer to Rule 433,
“Conditions to permissible post-filing free writing prospectuses,” for additional details.
14
In addition to providing information to investors, the roadshow also provides the
underwriter an opportunity to gauge the amount of investor demand that exists for the offering
(Rock, 1986; Benveniste and Spindt, 1989). In fact, the majority of final offerings price outside of
the initially proposed range, suggesting that investors’ indications of interest are often significantly
different from underwriters’ expectations (Cornelli and Goldreich, 2001, 2003; Lowry and
Schwert, 2004).
2.3. Related literature
Many studies find evidence of managers affecting firm performance and valuation.
Bertrand and Schoar (2003) find that manager fixed effects are related to firm practices and
performance, and Bennedsen, Perez-Gonzalez, and Wolfenzon (2010) show that CEO deaths are
correlated with changes in firm profitability, investment, and growth. Johnson, et al., (1985) find
a relation between executive characteristics and market reaction to their unexpected deaths, and
Hayes and Schaefer (1999) show that market reaction to managers’ job movements is associated
with manager characteristics. Similarly, Adams, Almeida, and Ferreira (2005) find that returns are
more variable for powerful CEOs, supporting the theory that CEO characteristics can influence
performance and firm valuation.
The impact of management on valuation may be greater for young firms, such as IPO and
pre-IPO firms (e.g., Kaplan and Stromberg, 2004). Management characteristics like education and
experience (e.g., Cohen and Dean, 2005; Higgins and Gulati, 2006), gender (Bigelow, et al., 2014),
and founder-status (Hendricks and Miller, 2014) impact IPO investor interest and valuation.
Bernstein, Korteweg, and Laws (2016) provide further evidence that investors place significant
value on information about management of young firms by using a randomized field experiment
15
to show that investors respond more to information about the founding team than to firm traction
or lead investors.
This literature assumes that investors somehow observe and incorporate manager ability
into firm valuation, but it is difficult to directly identify investors’ assessments and match them
with the relevant firm valuation because investor perception of management is typically not
observable. A stream of literature has begun trying to estimate perceptions of facial features based
on still photos. In the political sphere, Todorov, et al. (2005) find a relation between perceptions
of political candidates’ competence and outcomes of political races. Duarte, Siegel, and Young
(2012) show that perceptions of individuals’ trustworthiness are positively associated with
personal loan funding and outcomes. Turning to perceptions of management, Rule and Ambady
(2008) capture perceptions of power based on still photos of 46 CEOs, and they find a relation
between power and average gross revenue but not CEO compensation, controlling for age, affect,
and attractiveness. Graham, Harvey, and Puri (2016) examine perceived competence and
attractiveness of 134 CEOs based on still photos, and they find a positive relation between
perceptions and the level of compensation, controlling for sales and industry fixed effects. They
also examine firm performance, but find no relation. Finally, a concurrent working paper (Halford
and Hsu, 2014) measures CEO attractiveness using an algorithmic analysis of facial structure and
symmetry based on static photos. They find a positive relation between facial symmetry and the
market response to job and merger announcements.
We add to this literature in several ways. First, we investigate market pricing of the
perception of CEOs, which is a different economic question from all except the Halford and Hsu
(2014) working paper. Second, we focus on a fundamentally different construct by turning to
CEOs’ expressive, dynamic behavior and capturing inherent perceptions of managerial traits using
16
video clips. Incorporating CEOs’ mannerisms, movements, and vocal quality as well as facial
features results in a rich source of information on which to base judgments of management. Third,
while many of these prior papers suggest interesting relations, they do so with relatively small
samples and use research designs with limited controls and robustness tests. Our larger sample in
a setting where we control for a number of items such as firm performance, managerial background
and certainty of other information allow us the ability to develop a cleaner research design.
3. Data
3.1. IPO roadshows
We use video capture software to obtain IPO roadshows from RetailRoadshow.com, a
website that posts roadshow presentation videos for public offerings. To comply with the 2005
Securities Offering Reform, firms provide RetailRoadshow with a “bona fide” version of their
roadshow. During the final weeks of the registration period, individuals may view the roadshow
as often as they like. However, once the offering is priced, the roadshow presentation is no longer
available.
3.2. Sample Selection
We obtain a listing of all U.S. firms that completed an original IPO on NASDAQ or NYSE
in the United States from March 24, 2011 (the first day we began capturing videos) to December
31, 2013. Consistent with prior research on IPO firms, we exclude: financial firms, minor offerings
(OTC listings and filings less than $10 million), limited partnerships, and unit offerings. In
addition, we remove firms whose financial information was either incomplete or missing. Finally,
we exclude firms whose roadshows did not include video, did not feature presentations from their
management team, or were not captured from RetailRoadshow.com. As detailed in Table 1, 224
IPO filings remain in our study after applying these criteria.
17
3.3. Perceptions of management
To measure perceptions of management, we follow the thin slice literature and extract a
brief portion of each roadshow video to examine. The goal is for each thin slice to represent the
entire behavioral sequence from which it is extracted. To this end, prior research has generally
extracted three samples from a behavioral sequence rather than use a single excerpt (Ambady,
Bernieri, and Richeson, 2000). We follow this approach and construct a 30-second thin slice using
three 10-second excerpts from the first five minutes of each CEO’s roadshow presentation. We
take the first excerpt from the beginning and combine it with two 10-second excerpts taken two
and four minutes after the initial 10-second excerpt has ended.13
Although we only use 30 seconds from each video, there is still the concern that viewers’
perceptions may be influenced by factual information about the firm conveyed during these
excerpts. To capture investor perception of management independent of firm characteristics, we
follow Ambady, Krabbenhoft and Hogan (2006) and content-filter the video. Specifically, we use
both a lowpass and highpass filter to remove frequencies that aid in word recognition. This process
makes the CEO’s words indiscernible, but preserves the sequence and rhythm of their speech.
Our goal is to capture the overall perception of the manager. To encourage raters to
consider the broad construct of overall perception from various angles, we ask for ratings of three
characteristics that investors are likely to use to assess manager quality: competence,
trustworthiness, and attractiveness. These are classic constructs in the psychology and economics
literature, and these attributes provide concrete manifestations of perception for raters to consider.
Competence, or the ability to do something successfully or efficiently, is closely related to the
13 An alternative is to take samples from the entire presentation, rather than just the first five minutes. However, a
linear trend such as fatigue would have a more significant impact on those clips taken from the middle and end portions
of longer presentations. Our approach removes these concerns while still capturing some of the linear trends that might
appear in the manager presentations.
18
construct of CEO quality. Trustworthiness, or the ability to be relied on to do what is needed or
right, is another potential component of perception of management. A number of studies find a
relation between perceived competence and/or trustworthiness and economic outcomes, such as
political elections, teaching evaluations, compensation, and personal loan funding (Ambady and
Rosenthal, 1993; Todorov, et al., 2005; Duarte, Siegel, and Young, 2012; Graham, Harvey, and
Puri, 2016). Finally, a manager’s general attractiveness could impact assessment of the manager’s
value to the firm, given the evidence of a relation between attractiveness and compensation,
confidence, perceived ability, and market reaction to firm events (Hamermesh and Biddle, 1994;
Mobius and Rosenblat, 2006; Halford and Hsu, 2014; Graham, Harvey, and Puri, 2016). We focus
on the combination of these attributes as the overall intuitive perception of a CEO at the time of a
firm’s IPO based on our belief that investors’ perceptions are formed by information encompassed
in multiple traits. In addition, while individual raters may have idiosyncratic differences in their
view of individual traits, the composite measure should help overcome any noise this introduces.
We use Amazon’s Mechanical Turk (MTurk) service to analyze each of the 224 thin slices
created from the roadshow presentations.14 This online labor market allows requesters to post jobs
for an on-demand workforce. Numerous studies provide evidence that MTurk is a viable
alternative to the traditional lab setting for behavioral research in a variety of fields (e.g., Paolacci,
Chandler, and Ipeirotis, 2010; Buhrmester, Kwang, and Gosling, 2011; Mason and Suri, 2012;
Crump, McDonnell, and Gureckis, 2013). In finance and accounting research, MTurk is being used
as an alternative to traditional lab experiments (e.g., Rennekamp, 2012; Koonce, Miller, and
Winchel, 2015; Asay and Hales, 2015), and there is also potential for its use to generate a construct
not available via archival sources (e.g., Duarte, Siegel, and Young, 2012). For our setting,
14 See Appendix A for survey design and implementation details, and Section 5 for robustness tests related to rating
quality.
19
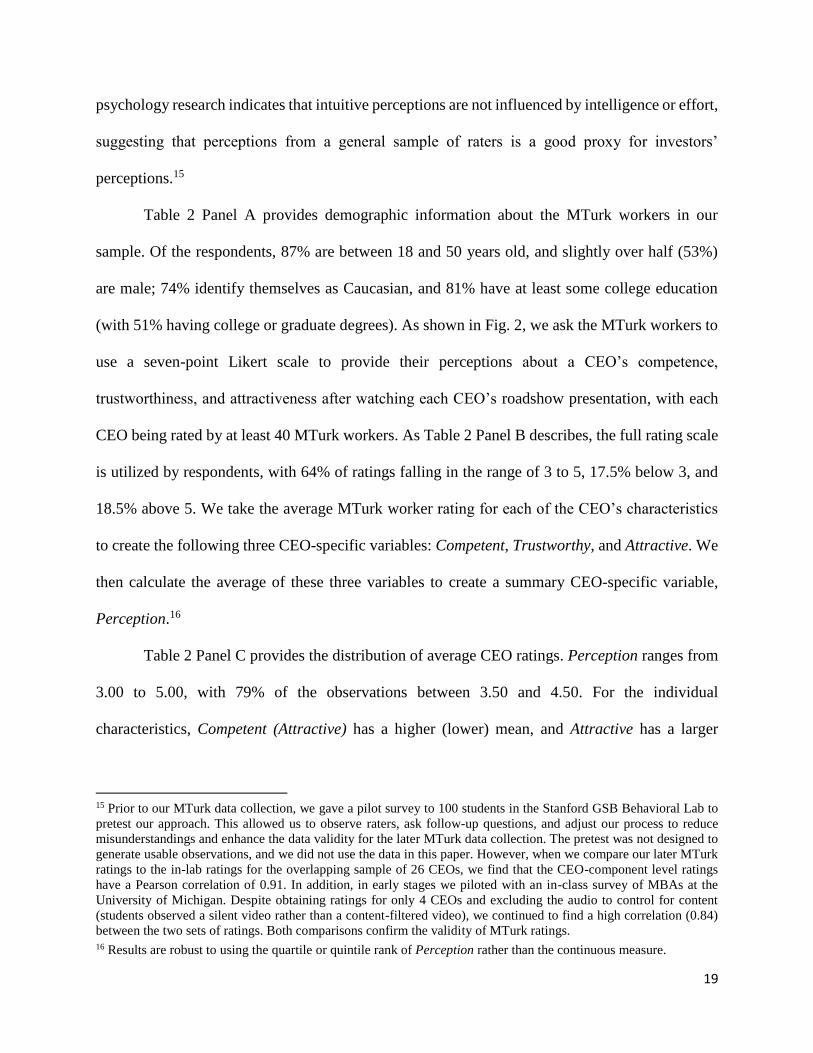
psychology research indicates that intuitive perceptions are not influenced by intelligence or effort,
suggesting that perceptions from a general sample of raters is a good proxy for investors’
perceptions.15
Table 2 Panel A provides demographic information about the MTurk workers in our
sample. Of the respondents, 87% are between 18 and 50 years old, and slightly over half (53%)
are male; 74% identify themselves as Caucasian, and 81% have at least some college education
(with 51% having college or graduate degrees). As shown in Fig. 2, we ask the MTurk workers to
use a seven-point Likert scale to provide their perceptions about a CEO’s competence,
trustworthiness, and attractiveness after watching each CEO’s roadshow presentation, with each
CEO being rated by at least 40 MTurk workers. As Table 2 Panel B describes, the full rating scale
is utilized by respondents, with 64% of ratings falling in the range of 3 to 5, 17.5% below 3, and
18.5% above 5. We take the average MTurk worker rating for each of the CEO’s characteristics
to create the following three CEO-specific variables: Competent, Trustworthy, and Attractive. We
then calculate the average of these three variables to create a summary CEO-specific variable,
Perception.16
Table 2 Panel C provides the distribution of average CEO ratings. Perception ranges from
3.00 to 5.00, with 79% of the observations between 3.50 and 4.50. For the individual
characteristics, Competent (Attractive) has a higher (lower) mean, and Attractive has a larger
15 Prior to our MTurk data collection, we gave a pilot survey to 100 students in the Stanford GSB Behavioral Lab to
pretest our approach. This allowed us to observe raters, ask follow-up questions, and adjust our process to reduce
misunderstandings and enhance the data validity for the later MTurk data collection. The pretest was not designed to
generate usable observations, and we did not use the data in this paper. However, when we compare our later MTurk
ratings to the in-lab ratings for the overlapping sample of 26 CEOs, we find that the CEO-component level ratings
have a Pearson correlation of 0.91. In addition, in early stages we piloted with an in-class survey of MBAs at the
University of Michigan. Despite obtaining ratings for only 4 CEOs and excluding the audio to control for content
(students observed a silent video rather than a content-filtered video), we continued to find a high correlation (0.84)
between the two sets of ratings. Both comparisons confirm the validity of MTurk ratings. 16 Results are robust to using the quartile or quintile rank of Perception rather than the continuous measure.
20
standard deviation, ranging from below 2.25 through 5.00. Table 3 confirms these statistics,
showing a mean Perception of 4.05, mean Competent of 4.72, and mean Attractive of 3.28. Turning
to personal characteristics of the CEOs in our sample, we find that the average CEO is 51 years
old, 4% are female, 14% earned a degree outside the United States, 59% earned a postgraduate
degree, and 36% are founder-CEOs. For roadshow characteristics, 65% of the roadshows are
captured from live presentations to investors, and 8% of CEOs are seated during their
presentations.
4. Empirical results
4.1. Perception and firm value
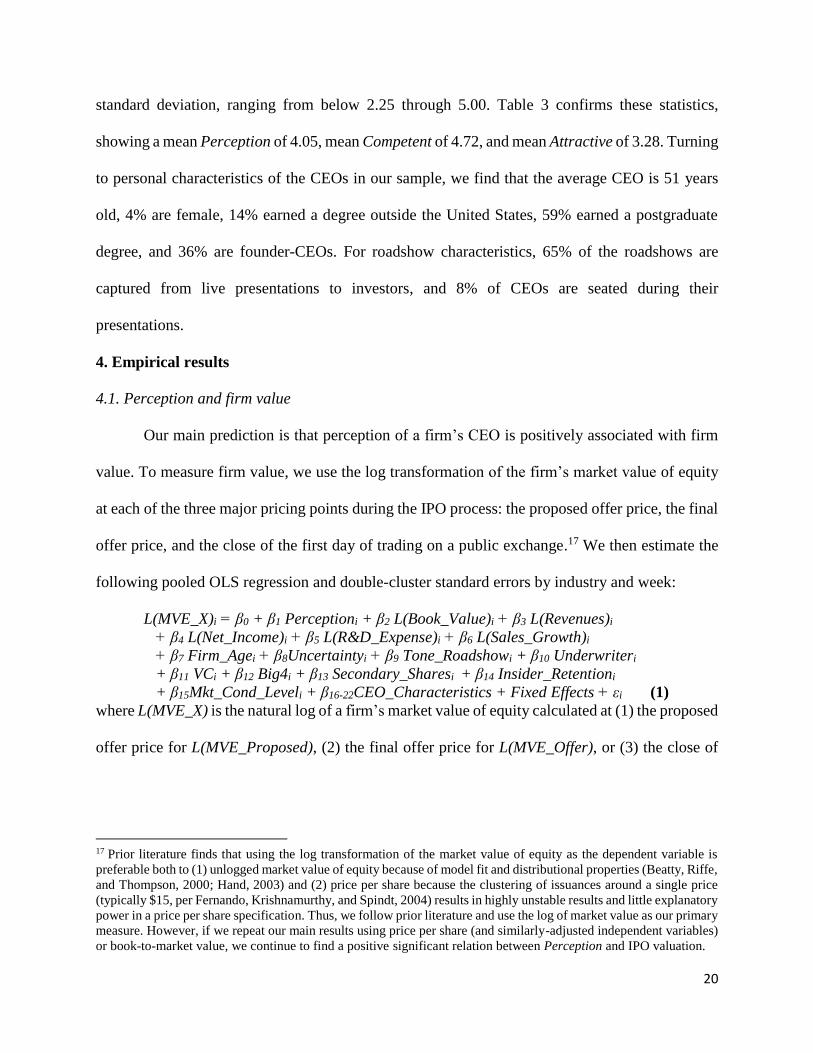
Our main prediction is that perception of a firm’s CEO is positively associated with firm
value. To measure firm value, we use the log transformation of the firm’s market value of equity
at each of the three major pricing points during the IPO process: the proposed offer price, the final
offer price, and the close of the first day of trading on a public exchange.17 We then estimate the
following pooled OLS regression and double-cluster standard errors by industry and week:
L(MVE_X)i = β0 + β1 Perceptioni + β2 L(Book_Value)i + β3 L(Revenues)i
+ β4 L(Net_Income)i + β5 L(R&D_Expense)i + β6 L(Sales_Growth)i
+ β7 Firm_Agei + β8Uncertaintyi + β9 Tone_Roadshowi + β10 Underwriteri
+ β11 VCi + β12 Big4i + β13 Secondary_Sharesi + β14 Insider_Retentioni
+ β15Mkt_Cond_Leveli + β16-22CEO_Characteristics + Fixed Effects + εi (1)
where L(MVE_X) is the natural log of a firm’s market value of equity calculated at (1) the proposed
offer price for L(MVE_Proposed), (2) the final offer price for L(MVE_Offer), or (3) the close of
17 Prior literature finds that using the log transformation of the market value of equity as the dependent variable is
preferable both to (1) unlogged market value of equity because of model fit and distributional properties (Beatty, Riffe,
and Thompson, 2000; Hand, 2003) and (2) price per share because the clustering of issuances around a single price
(typically $15, per Fernando, Krishnamurthy, and Spindt, 2004) results in highly unstable results and little explanatory
power in a price per share specification. Thus, we follow prior literature and use the log of market value as our primary
measure. However, if we repeat our main results using price per share (and similarly-adjusted independent variables)
or book-to-market value, we continue to find a positive significant relation between Perception and IPO valuation.

21
its first trading day for L(MVE_Final). Perception is our primary variable of interest and is the
average of Competent, Trustworthy, and Attractive, as defined in Section 3.3 and Appendix B.
We include several control variables in our model that have been shown to be important
indicators of IPO firm value. Following Xiao and Yung (2015), we include the log transformations
of each firm’s book value of equity, revenues, net income, R&D expense, and sales growth.18 We
also include other nonfinancial measures of firm quality as suggested by prior research and
appropriate for our setting. Specifically, we include Firm_Age calculated as the natural log of 1
plus the firm’s age at IPO (Fernando, Gatchev, and Spindt, 2005), Uncertainty as the percent of
words in the firm’s final registration statement that are in the uncertain, negative, or weak modal
word lists (Loughran and McDonald, 2013), Tone_Roadshow as the difference between the
number of positive words and the number of negative words in the CEO’s roadshow presentation
divided by the total number of words in the CEO’s presentation (Loughran and McDonald,
2013).19 Underwriter as the average Carter-Manaster ranking of the firm’s lead underwriters
(Leland and Pyle, 1977; Carter and Manaster, 1990),20 VC as an indicator variable that takes the
value of one if the firm has venture-capital backing (Barry, et al., 1990; Megginson and Weiss,
1991), Big4 as an indicator variable for whether the firm has a Big4 auditor at the time of IPO
18 Consistent with prior studies, we log transform these variables by taking the natural log (1+value) when the original
value is positive and –log (1-value) when the value is negative, which retains the negative values as well as the
monotonic relation of the original values. In addition, to be consistent with the dependent variable capturing post-IPO
firm value, we adjust the book value of equity to include the value of shares issued during the IPO. 19 Results are robust (i.e., coefficients of interest in the main regressions remain significant at the 1% level or better)
to alternative tone measures: tone of the entire roadshow rather than just the CEO portion, net tone excluding negated
positive or negated negative words, and net tone scaled by total words rather than just words in Loughran and
McDonald’s dictionary. In addition, results are robust to including the intensity of roadshow language (strong modal
in Loughran and McDonald’s dictionary) and the extent of forward-looking language using several variants of the
word list from Li (2010). 20 Results are robust (i.e., coefficients of interest in the main regressions remain significant at the 1% level or better)
to removing the continuous measure of underwriter quality and instead including (1) indicator variables based on
discrete categories of the average underwriter quality for each firm, or (2) indicator variables for each individual
underwriter quality level (1 through 9), where a firm with multiple underwriters of different quality has multiple
indicators set to one.
22
(Titman and Trueman, 1986), Secondary_Shares as the percentage of a firm’s shares being offered
that are owned by existing shareholders (Brau, Li, and Shi, 2007), Insider_Retention as the
percentage of a firm’s total shares that are retained by executives and directors after the offering
(Jain and Kini, 1994), and Mkt_Cond_Level as the NASDAQ level at the time of a firm’s IPO
(Ritter, 1984; Ljungvist and Wilhelm, 2003).
Finally, we include several CEO characteristics to confirm that Perception does not simply
capture an observable CEO characteristic previously studied.21 Specifically, Female is an indicator
variable that takes the value of one if the CEO is female. Foreign is an indicator variable for
whether the CEO completed a degree from a non-US university. CEO_Age is the natural log of
the CEO’s age. Grad_School is an indicator variable for whether the CEO earned a postgraduate
degree. Experience is an indicator variable that takes the value of one if the CEO’s prior employer
was a publicly traded firm. Founder is an indicator variable for whether the CEO is also the founder
of the IPO firm. WHR is the facial width-to-height ratio of the CEO, following Jia, van Lent, and
Zeng (2014).22 This measure is typically interpreted as masculinity, aggression, and/or risk-taking.
We winsorize continuous variables at 1% and 99%, and we include both calendar-year and industry
fixed effects (based on the Fama French 12-industry classifications) in several of the
specifications, as noted in the tables.
Table 4 Panel A presents the results from estimating Eq. (1) for each of L(MVE_Proposed),
L(MVE_Offer), and L(MVE_Final). Consistent with our main prediction, Columns 1, 2, and 3
show positive coefficients for Perception: 0.2793 (t-stat 2.99) for the proposed market value,
21 Results are robust to excluding CEO characteristics. 22 Using the best resolution picture on Google Images of the CEO’s face facing forward with a neutral expression, two
research assistants measure the width and height of the face using ImageJ software. We use the average of the RAs’
measures as WHR if the difference between the two is less than 5%; otherwise, a third rater’s measures are averaged
with the closer of the original two measures.
23
0.3244 (t-stat 3.00) for the final offer market value, and 0.4050 (t-stat 3.54) for the final trading
market value. The model includes seven CEO-specific characteristics, showing that our finding is
not driven by these other CEO-specific qualities. Rather, this finding is consistent with the
NYSE/NASD (2003) IPO Advisory Committee’s statement that “even the opportunity to see and
hear senior management may provide significant information for an investment decision.” In terms
of economic magnitude, these results suggest that a one standard deviation improvement in the
perception of the CEO is associated with a final valuation between 7.2% and 27.9% higher, taking
into account a 95% confidence interval.
Panel B of Table 4 provides the results of regressing the three market values on the
components of Perception. As shown, the coefficients for Competent, Trustworthy, and Attractive
are all positive, with seven of nine coefficients significantly different from zero at the 10% level
or better, again providing evidence of a positive relation between perceptions of management and
firm valuation.23 However, our survey measure was designed to capture overall perception rather
than specific characteristics, so results based on individual attributes should be interpreted with
caution.
4.2. Perception and underwriter matching
In the first major step of the IPO process, firms and underwriters associate by mutual
choice, with prior research providing evidence that the quality of issuing firms is positively
associated with underwriter quality (Chemmanur and Fulghieri, 1994; Fernando, Gatchev, and
Spindt, 2005). If underwriters rely on their perceptions of a firm’s manager as valuable information
about firm quality or as expectations of the market’s likely assessment of the firm, then these
23 While all three attributes have a positive relation with firm value, the results for Trustworthy here and in future tests
are the weakest. One possible explanation is that investors might rely on monitoring mechanisms, such as regulators
and auditors, to ensure that management is not undertaking inappropriate or fraudulent activities.
24
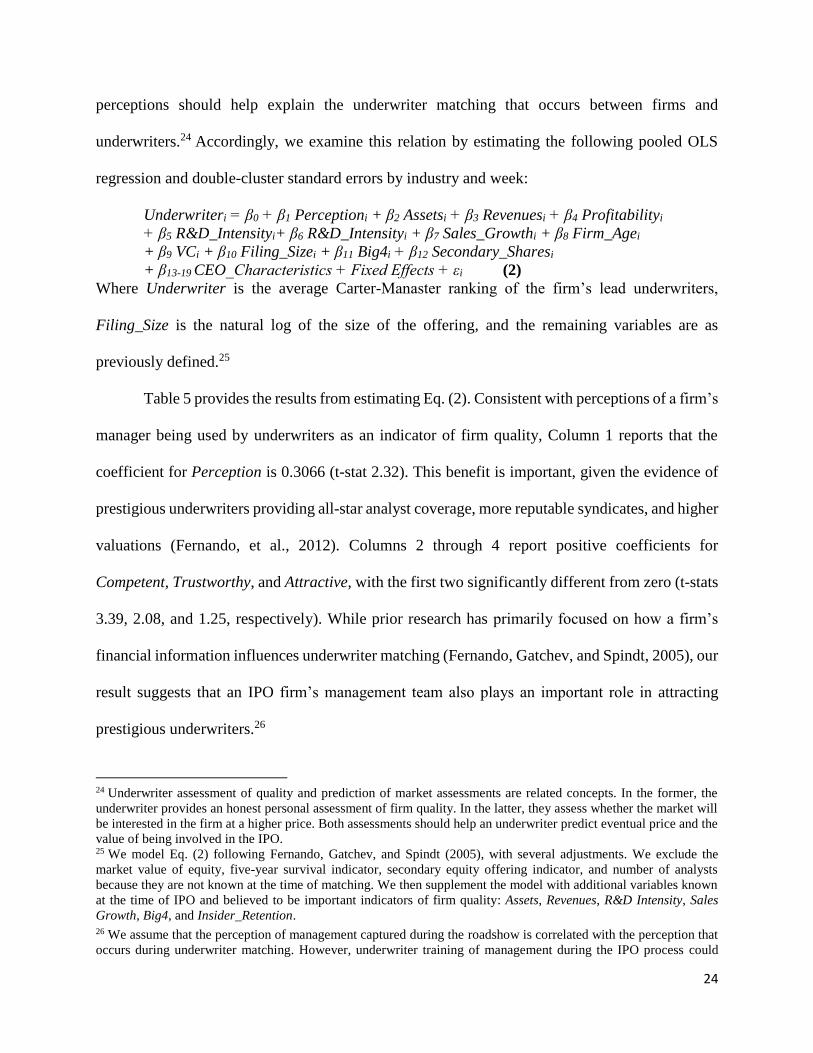
perceptions should help explain the underwriter matching that occurs between firms and
underwriters.24 Accordingly, we examine this relation by estimating the following pooled OLS
regression and double-cluster standard errors by industry and week:
Underwriteri = β0 + β1 Perceptioni + β2 Assetsi + β3 Revenuesi + β4 Profitabilityi
+ β5 R&D_Intensityi+ β6 R&D_Intensityi + β7 Sales_Growthi + β8 Firm_Agei
+ β9 VCi + β10 Filing_Sizei + β11 Big4i + β12 Secondary_Sharesi
+ β13-19 CEO_Characteristics + Fixed Effects + εi (2)
Where Underwriter is the average Carter-Manaster ranking of the firm’s lead underwriters,
Filing_Size is the natural log of the size of the offering, and the remaining variables are as
previously defined.25
Table 5 provides the results from estimating Eq. (2). Consistent with perceptions of a firm’s
manager being used by underwriters as an indicator of firm quality, Column 1 reports that the
coefficient for Perception is 0.3066 (t-stat 2.32). This benefit is important, given the evidence of
prestigious underwriters providing all-star analyst coverage, more reputable syndicates, and higher
valuations (Fernando, et al., 2012). Columns 2 through 4 report positive coefficients for
Competent, Trustworthy, and Attractive, with the first two significantly different from zero (t-stats
3.39, 2.08, and 1.25, respectively). While prior research has primarily focused on how a firm’s
financial information influences underwriter matching (Fernando, Gatchev, and Spindt, 2005), our
result suggests that an IPO firm’s management team also plays an important role in attracting
prestigious underwriters.26
24 Underwriter assessment of quality and prediction of market assessments are related concepts. In the former, the
underwriter provides an honest personal assessment of firm quality. In the latter, they assess whether the market will
be interested in the firm at a higher price. Both assessments should help an underwriter predict eventual price and the
value of being involved in the IPO. 25 We model Eq. (2) following Fernando, Gatchev, and Spindt (2005), with several adjustments. We exclude the
market value of equity, five-year survival indicator, secondary equity offering indicator, and number of analysts
because they are not known at the time of matching. We then supplement the model with additional variables known
at the time of IPO and believed to be important indicators of firm quality: Assets, Revenues, R&D Intensity, Sales
Growth, Big4, and Insider_Retention. 26 We assume that the perception of management captured during the roadshow is correlated with the perception that
occurs during underwriter matching. However, underwriter training of management during the IPO process could

25
5. Further Exploratory Analyses
In the following sections, we perform several additional descriptive analyses to explore
the documented relation between perception and valuation and improve our understanding of it.
5.1 Perception and price revision
Perception and the proposed IPO price are positively related, suggesting that underwriters
at least partially incorporate their perceptions of CEOs in the valuations they propose. However,
it is not clear if the perceptions are fully incorporated into the proposed IPO price, or if the
perceptions are initially underweighted and incorporated more fully in subsequent pricing stages.
Several studies provide reasons why the incorporation might increase at each stage. Hong and Page
(2004) show that a diverse group of problem solvers arrives at a different, better solution than a
group with greater ability but less diversity, and Eisenkraft (2013) finds that a group of raters’
aggregated intuitive assessment of a thin slice of expressive behavior is more predictive than
individual raters’ assessment of an interview. Thus, the greater number and diversity of investors
versus underwriters could result in meaningful differences in perceptions of management. Given
the inherent noise in underwriters’ proxy for market perceptions, these perceptions may be
purposely underweighted in the proposed price. Consistent with the idea of purposeful
underweighting, Roosenboom (2007) shows that underwriters often discount softer or less certain
information due to reputational concerns. Thus, underwriters and investors could impound this soft
information into price adjustments during the book building process.
improve the perception of management. If high-quality underwriters provide better communication training for
management than low-quality underwriters, the positive relation between the perception of CEOs and underwriter
quality could be partly due to underwriter training rather than underwriter matching. We control for pre-IPO training
possibilities, such as interaction with venture capital firms and the prior public firm experience of the CEO, and we
repeat valuation tests using alternative underwriter controls, as noted earlier. In addition, given the inherent,
subconscious nature of the expressive behavior being assessed, it is unlikely that individuals could learn to completely
control or influence their behavior in the few months of underwriter interactions before an IPO (Ambady, et al. 2000).

26
We examine the price revision that occurs from the proposed price to the closing market
price on firms’ first day of trading. We caution, though, that this test regresses a change in price
(Revision) on a level (Perception). Ideally, we would incorporate the underwriter’s perception, as
well as any difference between underwriter and market perceptions, to examine whether and how
perception and changes in perception influence the price revision during the roadshow. Because
this information is not available, we use Perception as the proxy, but we recognize that it reduces
the strength of the test and recommend caution in interpreting the results. We estimate the
following pooled OLS regression, double-clustering standard errors by industry and week:
Revisioni = β0 + β1 Perceptioni + β2 Assets + β3 Revenuesi + β4 Profitabilityi
+ β5 R&D_Intensityi + β6 Sales_Growthi + β7 Firm_Agei + β8 Uncertaintyi
+ β9 Tone_Roadshowi + β10 Underwriteri + β11 VCi + β12 Filing_Sizei + β13 Big4
+ β14 Secondary_Shares + β15 Insider_Retentioni + β16 Mkt_Cond_Changei + β17-
23CEO_Characteristics + Fixed Effects + εi (3)
where Revision is defined as the percentage change between an issuing firm’s closing price per
share on its first day of trading on the secondary market and the price per share initially proposed.
Mkt_Cond_Change is the average daily change on NASDAQ between the date when the firm filed
its initial registration statement and the offer date. This variable captures new information about
the macroeconomic conditions that arise during this period and has been shown to be a powerful
determinant of the price revision (Lowry and Schwert, 2004). All other variables are as previously
defined.
Table 6 provides the results from estimating Eq. (3). Consistent with investors providing
additional information about perceptions of management during the book building process, the
coefficient for Perception in Column 1 is 0.2205 (t-stat 2.70). To gain further insight into this
result, we decompose Revision into two components: the change from the proposed to the final
offer price (Price_Update) and the change from the final offer price to the closing price on the

27
first trading day (Initial_Returns).27 As shown in Columns 2 and 3, the coefficients between
Perception and each of these two subcomponents (Price_Update and Initial_Returns) are
positive, with Initial_Returns significantly different from zero (t-stats 1.34 and 1.84,
respectively). Overall, this evidence suggests that perception continues to be incorporated into
firm value estimates throughout the book building process.28
5.2. Perception and Uncertainty
We next examine a setting where we expect perception to be more important for firm value.
Firm communication during the IPO process begins with the S-1, and this written disclosure is
followed by the oral roadshow presentations. Prior research has shown that variation in the level
of uncertainty in this document impacts the valuation process (Loughran and McDonald, 2013).
We argue that when there is greater uncertainty in the written disclosure, the subsequent
communication of the roadshow and the perception of management is likely to be more important
for assessing firm value.
To test this, we re-estimate Eqs. (1) and (2), substituting an indicator for filings with highly
(top quintile) uncertain language in the registration statement (High_Uncertain) in place of the
continuous Uncertainty, and including the interaction Perception*High_Uncertain. As shown in
Table 7 Panel A, the interaction of Perception and High_Uncertain is positive for all models and
significantly different from zero at the 10% level or better for three of the four models. The
27 Although we tabulate results for each partition of Revision, we caution against making conclusions about which
investors are incorporating the perceptions. Prior literature finds that information revealed during bookbuilding is not
fully impounded into the offer price (Benveniste and Spindt 1989; Hanley 1993; Lowry and Schwert 2004). This
suggests that even if institutional investors incorporate perception fully into their limit orders, underwriters may
choose not to fully impound this information into the final offer price. In that case, institutional investors’ perceptions
would “spill over” into the revision during the first day of trading. 28 A positive Perception coefficient in Initial_Returns could suggest welfare implications for the firm as well, i.e.,
firms with more highly perceived CEOs may not be able to capture as high a proportion of the benefit these CEOs
bring during the IPO process. However, the allocation of funds between the firm and initial investors is complicated
due to incentives of firms and/or underwriters to intentionally underprice firms. Disentangling welfare implications
of the CEO perception is beyond the scope of our analyses.
28
Perception*High_Uncertain coefficient ranges from 0.3510 (t-stat 1.64) to 0.5417 (t-stat 2.40),
while the coefficient on Perception for firms without high uncertainty is smaller at 0.1663 (t-stat
1.83) to 0.2538 (t-stat 1.71). These findings suggest that investors value the perception of
management approximately twice as much when there is high uncertainty surrounding a firm’s
written disclosures. However, we caution against drawing strong conclusions given the difficulty
in measuring investors’ ex-ante uncertainty.
As an additional test exploring perception and uncertainty, we examine the relation
between perception and post-IPO return volatility. Loughran and McDonald (2013) find that
uncertain language in the S-1 is positively associated with return volatility in the 60-day period
just after the IPO. Because perception is more relevant for valuation when the firm’s written
disclosure is more uncertain, another potential outcome of high perceptions is the reduction of
capital market uncertainty in the period just following the IPO. Using a model of post-IPO
uncertainty similar to Loughran and McDonald (2013), we find (untabulated) that Perception is
negatively correlated with post-IPO stock volatility, with a coefficient of -0.4216 and t-statistic of
2.49.29 Overall, these findings suggest that perception of management might be another way in
which investors resolve uncertainty.
5.3. Measurement of perception - videos and pictures
Our primary measure of perception is based on ratings of thin slices of dynamic,
information-rich video of management. We choose this approach due to prior literature’s findings
of the wealth of information in expressive, dynamic behavior. This information enables the
29 Specifically, we regress the standard deviation of the firm’s stock returns in the 60-day post-IPO period (+5, +64)
on the firm’s perception, price update, VC indicator, underwriter quality, revenues, sales growth, profitability,
roadshow presentation tone, market condition change, firm linguistic uncertainty, share overhang, and market
volatility, as well as year and industry fixed effects and standard errors double-clustered by industry and week.
Consistent with Loughran and McDonald (2013), we also find that Uncertainty is positively associated with post-IPO
return volatility (coefficient 0.5094, t-stat 1.80).
29
creation of a rich, ecologically valid proxy for the interaction that actually occurred. However, an
alternative basis for the measurement of perception is a static picture. A number of papers in
finance and economics use static pictures to capture perceptions of individuals in other settings
(e.g., Todorov, et al. 2005; Duarte, Siegel, and Young 2012; Graham, Harvey, and Puri 2016), and
static pictures are more broadly available and lower cost to use. Thus, two questions exist. First,
do perceptions formed by viewing dynamic behavior provide additional insight over perceptions
based on static pictures? Second, would perceptions based on static pictures be sufficient to capture
the underlying construct of investor interaction with management?
To test these questions, we obtain pictures of all 224 CEOs and repeat the same Mturk
surveys of perception of the three attributes, using pictures rather than video clips. The survey
instrument and procedures are identical to those used for the main perception of video clips, except
for wording changes in the survey to replace video (and related terms) with picture (and related
terms). Thus, each picture was rated on the same three attributes by at least 40 individual raters
per CEO. We refer to this picture-based perception as Perception_Pic.
We address question one by including both the dynamic- and static-based perception
measures in a single regression. Ex-ante there are several possible outcomes. We may find that
both variables consistently explain some portion of the variation in price, suggesting they capture
different components of perception. Alternatively, we may find that one measure consistently
explains valuation, while the other is less useful. That would suggest the consistent measure is a
better construct for capturing market perceptions. As shown in Table 8 Panel A, we continue to
find a positive significant relation between Perception and the valuation levels and underwriter
quality, even after including Perception_Pic. In contrast, Perception_Pic has a significant positive
30
coefficient in only one of the four specifications. Thus, the evidence suggests that perception based
on video clips is the superior proxy for individuals’ perceptions of management.
We appreciate that there are times when researchers may only have static evidence to create
proxies for perceptions based on interactions. This leads us to the second question of whether
perceptions based on static pictures would be sufficient to capture our construct. Simple correlation
tests suggests that the dynamic- and static-based perceptions share some variation. The overall
rating (Perception_Pic) has a mean of 4.17, median of 4.2, and standard deviation of 0.41, similar
to Perception, and the two measures are positively correlated (0.5224). As shown in Table 8 Panel
B, when we repeat our main tests using only Perception_Pic, the static perception has a positive
and significant coefficient in three of the four main tests. For those three tests, though, the
significance is slightly weaker than for Perception (t-stats of 2.13 to 2.49 rather than 2.99 to 3.54).
Based on this second test, we conclude that perception based on static pictures captures some
portion of the market perception construct, but with additional noise. Thus, it appears that static
pictures may serve as a proxy when dynamic videos are not available. However, researchers should
be aware that static-based measures are likely a lower power construct for creating a measure of
perception.30
5.4. Post-IPO performance
Our finding that perceptions of management are positively related to firm value raises the
question of whether investors are rationally pricing this information about firms. This is difficult
to test empirically as there is not an obvious time horizon to examine for an unraveling of the
30 Of course, static pictures may be the preferred approach if they capture the experience that would actually occur in
the research question. For example, Pope and Sydnor (2011) study biases in on-line lending. Their research question
addresses the impact of a picture that shows an applicant is African-American. In that setting, a picture would
obviously be the appropriate construct. Similarly, Duarte, Siegel, and Young (2012) examine perceptions of online
borrowers, again using pictures because they are the actual evidence available to online lenders making decisions.

31
valuation premium. Despite these limitations, we examine the association between Perception and
subsequent returns for our sample of firms. Specifically, we re-estimate Eq. (3) using BHAR2Y as
the dependent variable, where BHAR2Y is firms’ post-IPO buy-and-hold abnormal returns over the
subsequent two years minus the buy-and-hold returns earned by that firm’s Fama-French 10x10
portfolio (i.e., the matrix of 100 portfolios formed on deciles for the market value of equity and
the book-to-market ratio) over the same period.31 Control variables are included similar to the price
revision model (Equation 3) and are as defined in Appendix B. While a two-year post-IPO horizon
is admittedly ad hoc, we choose this period of time for two reasons. First, our sample concludes at
the end of 2013, making two years the longest horizon we are able to examine for the entire sample.
Second, using a two-year horizon allows two prominent features that impact the secondary market
pricing of IPOs to expire (insiders’ lockup provisions (Field and Hanka, 2001) and underwriters’
overallotment options (Lewellen, 2006)), removing concerns that the final price is not a true
market price.
As Columns 1 and 2 of Table 9 Panel A shows, we fail to find a statistically significant
relation between perception and post-IPO stock returns, whether or not control variables are
included (t-stats 1.12 and 0.32). This suggests that incorporating perceptions of management into
firm value during the IPO process was either rational, or at least that investors did not unwind the
pricing of perception during the two years after the IPO. As shown in Columns 3 and 4, we
continue to find no evidence of a relation with future stock performance when we expand the
BHAR period to the maximum post-IPO period available for each firm (three years for the average
firm).32
31 Results are robust to using raw returns or CRSP value-weighted returns instead. 32 Although CEO turnover is a binary variable, we estimate the CEO turnover model using OLS due to the difficulty
of incorporating fixed effects in probit models. However, when we repeat the analysis using a probit model, we find
similar results for both periods under consideration.

32
To better understand why perception would be rationally incorporated into price, we
examine several avenues. First, we test whether CEOs with worse perceptions are more likely to
experience turnover after the IPO. If the perception of the CEO captures some aspect of manager
ability, low perception could predict future job loss. As shown in Table 9, Panel B Columns 1 and
2, there is no evidence of a relation between perception and CEO turnover in the two years after
IPO (t-stats 0.15 and 0.27). However, columns 3 and 4 expand the post-IPO period to all available
years (which is three years on average), and in this slightly longer time period, we find a
significant, negative relation between perception and future CEO turnover (t-stats 2.15 and 1.82
for models without and with control variables). Perception’s ability to predict which CEOs retain
their jobs suggests that it captures meaningful aspects of manager quality and provides one reason
for the market’s incorporation of perception into price.
As a second test, we explore why poorly perceived CEOs might need to be replaced in the
future: poor subsequent performance. As a proxy for poor performance, we examine subsequent
accounting performance (i.e., two-year post-IPO cumulative return on assets (ROA2Y)). As shown
in Columns 1 and 2 of Table 9 Panel C, we do not find evidence of a relation between perception
and future ROA (t-stats 0.32 and 0.25). When we extend ROA to include all future periods for
each firm (Columns 3 and 4), we again do not find evidence of a relation. These results do not
provide a reason for the rational incorporation of perceptions into long-run price or the subsequent
turnover of poorly perceived CEOs. However, it is possible that a difference in value due to
perception would not manifest in ROA within a few years of the IPO. IPO firms are typically
young and unprofitable when going public (Barth, Landsman, and Taylor, 2016) and are still
maturing several years post-IPO. In summary, we do not find evidence of a stock price reversal in
the years after the IPO, suggesting that perceptions are rationally included in price. Although future
33
performance does not emerge as a mechanism or reason for the market’s incorporation of
perception into price, we do find evidence of perception affecting CEO employment duration as
well.
6. Additional analyses
6.1. Determinants of perception
Another interesting area for analysis is examining the determinants of Perception. Our
motivation for this analysis is to investigate how CEO, roadshow, and firm characteristics
influence perceptions of management, and to confirm that these perceptions are more strongly
associated with CEO characteristics than with roadshow or firm characteristics. To do so, we
estimate the following pooled OLS model:
Perceptioni = β0 + β1 Femalei + β2 Foreigni + β3 CEO_Agei + β4 Grad_Schooli
+ β5 Experiencei + β6 Founderi + β7 WHRi + β8 Livei + β9 Sittingi
+ β10 Backgroundi + β11 Assetsi + β12 Profitabilityi + β13 R&D_Inteni
+ β14 Firm_Agei + β15 VCi +Fixed Effects + εi (4)
where Perception and the CEO characteristics are as previously defined. We also include variables
relating to the roadshow presentation that could influence investor perceptions. Live is an indicator
variable for whether the retail roadshow appears to be recorded from an actual presentation made
to institutional investors. Sitting is an indicator variable for whether the CEO is sitting during the
presentation. Background is an indicator variable that takes the value of one if an investment
bank’s logo is visible in the background during the CEO’s presentation. Finally, we also include
several firm characteristics in our model. If higher-quality CEOs match with higher-quality firms,
then it is possible that firm characteristics will be informative about Perception. Variables are as
defined in Appendix B.
Table 10 Panel A provides the results of estimating Eq. (4). Columns 1, 2, and 3 present
the results of regressing Perception on the CEO-specific, roadshow presentation, or firm
34
characteristics, respectively. Consistent with perceptions about an individual being primarily
determined by individual-specific information, we observe that the adjusted R-squared is much
larger in Column 1 than in Columns 2 and 3. Further, Column 4 includes all the variables and
indicates that six of the seven significant variables are CEO-specific variables. Specifically,
CEO_Age, Foreign, Founder, and WHR are all negatively associated with Perception, while
Female and Grad_School are both positively associated. Table 10 Panel B provides the
determinants at the attribute level. The relations previously noted are similar across attributes, with
some differences in statistical significance. Overall, Table 10 provides new insight into how a
CEO’s personal characteristics influence investor perception. In addition, the adjusted R-squared
of only 0.272 highlights the fact that investor perception encompasses more than just observable
characteristics, which is consistent with our findings of a relation between perception and firm
value even controlling for these characteristics.
6.2 Selection Concerns
When examining the relation between CEO perception and firm valuation, a potential
concern is the existence of correlated omitted variables or endogenous matching between firms
and CEOs. If the observed relation between perception and valuation is driven instead by another
variable such as the quality of the firm, it is difficult to draw conclusions about the role of CEO
perception. However, our research design and observed results mitigate such concerns.
Our research design was created to ex-ante address potential confounding variables. It
includes an extensive set of controls for firm, CEO and environmental variables such as firm
performance, underwriter and auditor quality, market conditions, information content of
roadshows, etc. To the extent that our perception variable is somehow proxying for one of these
35
items, or some combination of them, inclusion of the control variables should remove any
correlation.
Turning to our observed results, several findings suggest that correlated variables or
endogenous matching are not the primary driver of our findings. First, we find evidence of higher
future job turnover for more poorly perceived CEOs. This evidence is consistent with Allgood and
Farrell’s (2003) findings of frictions in firm-CEO matching that result in high CEO turnover in the
early years of tenure.33 In our sample, this suggests that not all CEOs were ideally matched at the
IPO date and that the market appears to assess these CEOs distinct from the firm.
Second, in our analysis of the determinants of perception, the majority of the correlations
observed are with CEO characteristics. Very few firm or event characteristics are correlated with
CEO perception. This again indicates that firms and CEOs are not perfectly matched based on
perception of the CEO. Even observable CEO characteristics found to matter for firm value in
prior studies explain only a portion of perception (R-squared of 0.249), and the relation between
perception and valuation remains after controlling for these characteristics. Finally, we find that
perception is not only related to valuation and underwriter matching, but also to price revision.
Additionally, we find the relation varies based on the firm uncertainty. This pattern of findings is
consistent with our interpretation of perception and its role in the market. If the valuation relation
is driven by some other correlated omitted variable, that variable would need to explain this larger
set of results as well, which becomes less likely. The combination of these research design choices
and results reduce the likelihood that the observed relation between perception and valuation is
due to firms selecting CEOs of the same quality or other correlated omitted variables.
33 The classic assumption in the assortative matching literature of firms and managers perfectly matching has been
questioned by a number of papers. Suggested frictions preventing perfect matches include geographic segmentation
and local hiring bias (Law 2016, Yonker 2016), a minimum length of time or stability to create the match (Mendes,
van den Berg, and Lindebook 2010), and the need to optimize over several firm and CEO characteristics (Pan 2015).

36
7. Robustness tests
7.1. Gender of CEO
In the psychology literature on perception, the gender of the subject is often raised as a
consideration or a conditioning variable. Accordingly, studies not specifically studying gender
often choose to examine only one gender, especially in the corporate setting where the majority of
CEOs are male (e.g., Rule and Ambady, 2008; Graham, Harvey, and Puri, 2016). In our primary
results, we include both male and female CEOs. However, to ensure that our findings are not
affected by gender considerations, we repeat our analyses using the subsample of male CEOs. As
shown in Table 11 Panel A, the coefficients of interest are similar and remain statistically
significant at the 10% level or better.
7.2. Results including all attributes individually
Our focus throughout the draft is on the overall perception of management, although we
also tabulate results using the individual attributes separately. An alternative way to examine their
relation with firm valuation is to include all three attributions within the same regression. We
provide the primary regression results using this alternative specification in Table 11, Panel B. As
shown, at least one of the three attributes maintains the positive and significant relation, but which
one varies somewhat across the specifications, with the coefficients on Attractive and Competent
being significant more often than Trustworthy. Including them all in the same regression enables
easier comparison across coefficients and significance. However, it also raises the concern of
multicollinearity, given the high correlation between the individual attributes (i.e., 0.80 Pearson
correlation between Competent and Trustworthy, 0.46 between Competent and Attractive, and 0.41
between Trustworthy and Attractive). Our goal in using the average of the three components is to
incorporate different aspects of perception, and our focus throughout has been on the overall
37
perception. When we perform a principal component analysis of the three measures, we find that
one common factor clearly emerges, with an eigenvalue of 2.13 for the principal component and
loadings of 0.63 for Competent, 0.61 for Trustworthy, and 0.47 for Attractive. This provides
additional support for the use of the overall factor.34
7.3. Data quality
Prior research indicates several data-quality concerns may arise when using MTurk to
perform behavioral research (Mason and Suri, 2012; Crump, McDonnell, and Gureckis, 2013). In
this section, we examine whether these concerns are present in our data and investigate their impact
on our results.
We used every rating that we received from the MTurk workers in our calculation of
Perception, Competent, Trustworthy, and Attractive. However, some of the MTurk worker ratings
may be compromised either because the rater recognized the CEO, wasn’t paying close attention,
or was engaged in otherwise suspicious behavior (Crump, McDonnell, and Gureckis, 2013). This
suspicious behavior may include providing the same response to each request or providing
responses that are uncorrelated with the group average. Accordingly, we exclude the ratings that
manifest these behaviors from the data and re-estimate each of the main regressions in our paper.
Table 12 provides the results of re-estimating the main regressions in our paper after
excluding abnormal ratings provided by MTurk workers. Panel A provides the results after
excluding all ratings where an MTurk worker indicated having recognized the CEO in the video.
Panel B provides the results after excluding all ratings where MTurk workers failed to answer our
two attention-check questions correctly. Panel C provides the results after removing all ratings
34 In addition, if we use the first principal component instead of the average of the three attributes, the first principal
component has a positive and statistically significant coefficient at the 5% level for all regressions included in our
primary analysis (Tables 4-5).
38
where MTurk workers indicated the same value for a characteristic across the videos they rated.
Panel D provides the results after excluding all raters whose ratings were not positively correlated
with the group average (p-value < 0.10). Panel E provides the results after removing all ratings
that were excluded in Panels A-D. In each panel, we note that the qualitative inferences made when
using the restricted set of ratings are identical to those made when using the complete set of ratings.
7.4. Rater characteristics
Perceptions are unconscious assessments made without effort or awareness, independent
of intelligence or working memory (Ambady, Bernieri, and Richeson, 2000; Evans, 2008).
Because these are fundamental, universal perceptions, we don’t expect results to be driven by rater
characteristics. In addition, we follow the content analysis literature’s recommendation to use a
large number of raters when capturing variables that involve judgment (Neuendorf, 2002), with
the goal of estimating a common perception. Thus, we are hesitant to estimate perceptions using
significantly smaller groups of raters. Nevertheless, we repeat our analyses using ratings from
various subsamples of raters to examine whether we observe this fundamental assumption in our
setting. We find qualitatively similar inferences for our main tests when using subsamples limited
to any of the following demographics: male raters, female raters, raters under 30 years old, raters
30 years of age or greater, Caucasian raters, non-Caucasian raters, raters that have attended at least
some college or have a college degree, and raters that have not attended college.35 These findings
provide support that we are capturing fundamental human perceptions that are not unique to any
particular demographic.
8. Conclusion
35 Specifically, we continue to find a positive relation between investor perception of managers and proposed firm
valuation, final offer valuation, final market valuation, and underwriter matching across all subsamples, with 29 out
of 32 specifications significant at the 10% level or better.
39
This study examines how investors’ perceptions of management are associated with firm
valuation. We examine whether perceptions of management, formed from watching 30-second
content-filtered video excerpts of a CEO’s IPO roadshow presentation, are correlated with
investors’ assessment of firm value, controlling for known determinants of firm value. We find
that a composite measure of perception based on competence, trustworthiness, and attractiveness
is positively associated with an IPO firm’s market value at the initial proposal price date, the final
offer date, and the end of the first day of trading. We also examine how this information influences
IPO price formation process, finding that our composite measure of perception is positively
associated with underwriter quality and the price revision that occurs from the proposed price to
the closing price on the firm’s first day of trading on the secondary market. Finally, we find that
our proxy of perception based on dynamic behavior is preferable to a measure based on static
photos, although a photo-based measure does serve as a noisier proxy of investors’ perception.
We contribute to the existing literature in several areas. First, we provide evidence that
perceptions of management are associated with timely measures of firm value. Second, our study
contributes to the literature examining perceptions of management by (1) focusing on the market
impacts of perceptions and (2) using a construct of perception based on information-rich dynamic
behavior. Third, our study contributes to the disclosure literature by providing evidence that
valuable information about management is conveyed through visual and auditory nonverbal
behavior. Fourth, we contribute to the IPO literature by providing the first empirical evidence that
investors learn valuable, non-tangible information from attending an IPO firm’s roadshow.
Although we have a unique setting that allows us to match perception with concurrent
valuation, three caveats apply. First, when constructing ratings of management, we remove
contextual information about the firm, firm performance, the history of the CEO, and even the fact
40
that the presentation is part of an IPO. Our goal is to focus on the most basic human perceptions,
irrespective of additional information, and this approach is consistent with the vast prior literature
of perceptions. However, this means that we do not capture a measure of investor perception that
is influenced by the content of conversations or historical information about management. Second,
we rely on prior literature’s findings that intuitive perceptions are unconscious, automatic, and not
easily influenced by outside factors such as cognitive load or intelligence. To the extent that these
basic perceptions could be influenced by financial incentives, our measure of perception would be
incomplete because our raters are not making investment decisions based on their assessments.
Third, although the IPO setting provides several advantages for a clean research design, it is not
clear whether results learned from our chosen setting are generalizable to other settings.
41
References
Adams, R., H. Almeida, Ferreira, D., 2005. Powerful CEOs and their impact on corporate
performance. Review of Financial Studies 18(4), 1403-1432.
Adams, R., N. Ambady, K. Nakayama, Shimojo, S., 2011. The Science of Social Vision. Oxford
Series in Visual Cognition. Oxford University Press.
Aggarwal, R., S. Bhagat, Rangan, S., 2009. The impact of fundamentals on IPO valuation.
Financial Management 38(2), 253-284.
Ambadar, Z., J. Schooler, Cohn, J., 2005. Deciphering the enigmatic face: The importance of facial
dynamics in interpreting subtle facial expressions. Psychological Science 16(5), 403-410.
Ambady, N., F. Bernieri, Richeson, J., 2000. Toward a histology of social behavior: Judgmental
accuracy from thin slices of the behavioral stream. Advances in Experimental Social Psychology
32, 201-271.
Ambady, N., B. Connor, Hallahan, M., 1999. Accuracy of judgments of sexual orientation from
thin slices of behavior. Journal of Personality and Social Psychology 77(3), 538-547.
Ambady, N., M.A. Krabbenhoft, Hogan, D. 2006. The 30-sec sale: Using thin-slice judgments to
evaluate sales effectiveness. Journal of Consumer Psychology 16(1), 4-13.
Ambady, N., D. Laplante, T. Nguyen, R. Rosenthal, N. Chaumeton, Levinson, W., 2002.
Surgeons’ tone of voice: A clue to malpractice history. Surgery 132(1), 5-9.
Ambady, N., Rosenthal, R., 1992. Thin slices of expressive behavior as predictors of interpersonal
consequences: a meta-analysis. Psychological Bulletin 111(2), 256-274.
Ambady, N., Rosenthal, R., 1993. Half a minute: Predicting teacher evaluations from thin slices
of nonverbal behavior and physical attractiveness. Journal of Personality and Social Psychology,
64(3), 431-441.
Arcella, C., 2011. The nuts and bolts of roadshows. Practical Law (May), 50-59.
Asay, H.S., J. Hales, 2015. Building a safe harbor for whom? A look at cautionary disclaimers and
investors’ reactions to forward-looking statements. Working paper.
Barry, C., C. Muscarella, J. Peavy III, Vetsuypens, M., 1990. The role of venture capital in the
creation of public companies: Evidence from the going-public process. Journal of Financial
Economics 27(2), 447-471.
Barth, M., W. Landsman, Taylor, D., 2016. The JOBS Act and Information Uncertainty in IPO
Firms. Working paper.
Beatty, R., S. Riffe, Thompson, R., 2000. IPO pricing with accounting information. Working
paper.
Benveniste, L., Spindt, P., 1989. How investment bankers determine the offer price and allocation
of new issues. Journal of Financial Economics, 24(2), 343-361.
Bennedsen, M., F. Perez-Gonzalez, Wolfenzon, D., 2010. Do CEOs matter? Working paper.
Bennedsen, M., F. Perez-Gonzalez, Wolfenzon, D., 2012. Evaluating the impact of the boss:
Evidence from CEO hospitalization events. Working paper.

42
Bernstein, S., A. Korteweg, Laws, K., 2016. Attracting Early Stage Investors: Evidence from a
Randomized Field Experiment. Journal of Finance, Forthcoming, doi: 10.1111/jofi.12470.
Bertrand, M., Schoar, A., 2003. Managing with style: The effect of managers on firm policies.
Quarterly Journal of Economics 118(4), 1169-1208.
Bigelow, L., L. Lundmark, J.M. Parks, Wuebker, R., 2014. Skirting the issues: Experimental
evidence of gender bias in IPO prospectus evaluations. Journal of Management 40(6), 1732-1759.
Blanck, D., Rosenthal, R., Cordell, L.D., 1985. The appearance of justice: Judges’ verbal and
nonverbal behavior in criminal jury trials. Stanford Law Review, 38, 89-164.
Borkenau, P., Liebler, A., 1992. Trait inferences: Sources of validity at zero acquaintance. Journal
of Personality and Social Psychology, 62(4), 645-657.
Borkenau, P., N. Mauer, R. Riemann, F. Spinath, Angleitner, A., 2004. Thin Slices of Behavior as
Cues of Personality and Intelligence. Journal of Personality and Social Psychology. 86(4), 599-
614.
Brau, J., M. Li, Shi, J., 2007. Do secondary shares in the IPO process have a negative effect on
aftermarket performance? Journal of Banking and Finance 31(9), 2612-2631.
Brown, L.D., Call, A.C., Clement, M.B., Sharp, N.Y., 2015. Inside the “black box” of sell-side
financial analysts. Journal of Accounting Research. 53(1), 1-47.
Buhrmester, M., T. Kwang, Gosling, S., 2011. Amazon’s Mechanical Turk: A new source of
inexpensive, yet high-quality, data? Perspectives on Psychological Science 6(3), 3-5.
Bushee, B.J., M.J. Jung, Miller, G.S., 2016. Do investors benefit from selective access to
management? Working paper.
Bushee, B.J. and G.S. Miller (2012), Investor relations, firm visibility, and investor following. The
Accounting Review, 87 (3), 867-897.
Carter, R., Manaster, S., 1990. Initial public offerings and underwriter reputation. Journal of
Finance, 45 1045-1067.
Chemmanur, T., Fulghieri, P., 1994. Investment bank reputation, information production, and
financial intermediation. Journal of Finance 49, 57-79.
Chemmanur, T., K. Simonyan, Tehranian, H., 2013. The Role of Management quality in the IPOs
of Venture-Backed Entrepreneurial Firms. Working paper.
Cohen, B., Dean, T., 2005. Information asymmetry and investor valuation of IPOs: Top
management team legitimacy as a capital market signal. Strategic Management Journal 26(7),
683-690.
Cornelli, F., Goldreich, D., 2001. Bookbuilding and strategic allocation. Journal of Finance 56,
2337-2370.
Cornelli, F., Goldreich, D., 2003. Bookbuilding: How informative is the order book? Journal of
Finance 58, 1415-1443.
Crump, M., J. McDonnell, Gureckis, T., 2013. Evaluating Amazon’s Mechanical Turk as a tool
for experimental behavioral research. PLoS ONE 8(3), e57410.
43
de Gelder, B., Tamietto, M. 2011. Faces, bodies, social vision as agent vision and social
consciousness. In Adams, R., Ambady, N., Nakayama, K., Shimojo, S., The Science of Social
Vision (pp. 51-74). New York: Oxford University Press.
DePaulo, B., 1992. Nonverbal behavior and self-presentation. Psychological Bulletin 111(2),
203-243.
Drucker, P.F. 1954. The Practice of Management. New York: Harper & Row.
Duarte, J., S. Siegel, Young, L., 2012. Trust and credit: The role of appearance in peer-to-peer
lending. Review of Financial Studies 25(8), 2455-2483.
Eisenkraft, N., 2013. Accurate by way of aggregation. Should you trust your intuition-based first
impressions? Journal of Experimental Social Psychology 49, 277-279.
Ernst & Young, 2008. Top 10 IPO readiness challenges: A measures that matter global study.
Evans, J., 2008. Dual-processing accounts of reasoning, judgment, and social cognition. Annual
Review of Psychology 59, 255-278.
Fernando, C., V. Gatchev, A. May, Megginson, W., 2012. The benefits of underwriter reputation
to banks and equity issuing firms. Working paper.
Fernando, C., V. Gatchev, Spindt, P., 2005. Wanna dance? How firms and underwriters choose
each other. Journal of Finance 60(5), 2437-2469.
Fernando, C., S. Krishnamurthy, Spindt, P., 2004. Are share price levels informative? Evidence
from the ownership, pricing, turnover and performance of IPO firms. Journal of Financial Markets
7, 377-403.
Field, L.C., Hanka, G. 2001. The expiration of IPO share lockups. Journal of Finance 56(2), 471-
500.
Gangestad, S., J. Simpson, K. DiGeronimo, Biek, M., 1992. Differential accuracy in person
perception across traits: Examination of a functional hypothesis. Journal of Personality and Social
Psychology 62(4), 688-698.
Graham, J., C. Harvey, Puri, M., 2016. A corporate beauty contest. Management Science,
Forthcoming, http://dx.doi.org/10.1287/mnsc.2016.2484.
Grahe, J., Bernieri, F., 1999. The Importance of nonverbal cues in judging rapport. Journal of
Nonverbal Behavior 23(4), 253-269.
Green, T.C., R. Jame, S. Markov, Subasi, M., 2014. Access to management and the
informativeness of analyst research. Journal of Financial Economics 114, 239-255.
Halford, J., Hsu, H., 2014. Beauty is wealth: CEO appearance and shareholder value. Working
paper.
Hammermesh, D., Biddle, J., 1994. Beauty and the labor market. American Economic Review
84(5), 1174-1194.
Hand, J., 2003. Profits, losses and the nonlinear pricing of internet stocks. In: Hand, J., Lev, B.
(Eds.), Intangible Assets: Values, Measures, and Risks. New York, New York: Oxford University
Press, pp. 248-268.

44
Hanley, K.W., 1993. The underpricing of initial public offerings and the partial adjustment
phenomenon. Journal of Financial Economics 34(2), 231-250.
Harrigan, J., Wilson, K., Rosenthal, R., 2004. Detecting state and trait anxiety from auditory and
visual cues: A meta-analysis. Personality and Social Psychology Bulletin 30(1), 26-66.
Hayes, R., Schaefer, S., 1999. How much are differences in managerial ability worth? Journal of
Accounting and Economics 27, 125-148.
Hendricks, B., Miller, G., 2014. Does the founder’s premium really exist? Evidence from a
longitudinal study of IPO firms. Working paper.
Higgins, G., 2006. Stacking the deck: the effects of top management backgrounds on investor
decisions. Strategic Management Journal 27(1), 1-25.
Hobson, J., W. Mayew, Venkatachalam, M., 2012. Analyzing speech to detect financial
misreporting. Journal of Accounting Research 50(2), 349-392.
Hong, L., S.E. Page, 2004. Groups of diverse problem-solvers can outperform groups of high-
ability problem solvers. Proceedings of the National Academy of Sciences 101(46), 16385-16389.
Jain, B., Kini, O., 1994. The post-operating performance of IPO firms. The Journal of Finance
49(5), 1699-1726.
Jia, Y., L. van Lent, Zeng, Y., 2014. Masculinity, Testosterone, and Financial Misreporting.
Journal of Accounting Research 52, 1195-1246.
Johnson, B., R. Magee, N. Nagarajan, Newman, H., 1985. An analysis of the stock price reaction
to sudden executive deaths: Implications for the managerial labor market. Journal of Accounting
and Economics 7, 151-174.
Kahneman, D., Frederick, S., 2002. Representativeness revisited: attribute substitution in intuitive
judgment. In: Gilovich, T., Griffin, D., Kahneman, D., (Eds.), Heuristics and Biases: The
Psychology of Intuitive Judgment. Cambridge, UK: Cambridge University Press, pp.49-81.
Kaplan, S.N., Stromberg, P., 2004. Characteristics, contracts, and actions: Evidence from venture
capitalist analyses. Journal of Finance 59, 2173-2206.
Kim, M., Ritter, J., 1999. Valuing IPOs. Journal of Financial Economics 53, 409-437.
Koonce, L., J.S. Miller, J. Winchel, 2015. The effects of norms on investor reactions to derivative
use. Contemporary Accounting Research 32(4), 1529-1554.
Leland, H., Pyle, D., 1977. Information asymmetries, financial structure and financial
intermediaries. Journal of Finance 32, 371-387.
Leone, A., S. Rock, Willenborg, M., 2007. Disclosure of intended use of proceeds and
underpricings in initial public offerings. Journal of Accounting Research 45, 111-153.
Lewellen, K. 2006. Risk, reputation, and IPO price support. Journal of Finance 61(2), 613-653.
Li, F. 2010. The information content of forward-looking statements in corporate filings – A
naïve Bayesian machine learning approach. Journal of Accounting Research 48(5), 1049-1102.
Ljungvist, A., Wilhelm, W., 2003. IPO pricing in the dot-com bubble. Journal of Finance 58,
723-752.

45
Lord, C., L. Ross, Lepper, M., 1979. Biased assimilation and attitude polarization: The effects of
prior theories on subsequently considered evidence. Journal of Personality and Social
Psychology 37(11), 2098-2109.
Loughran, T., McDonald, B., 2013. IPO first-day returns, offer price revisions, volatility, and form
S-1 language. Journal of Financial Economics 19, 307-326.
Lowry, M., Schwert, G.W., 2004. Is the IPO pricing process efficient? Journal of Financial
Economics 71, 3-26.
Mason, W., Suri, S., 2012. Conducting behavioral research on Amazon’s Mechanical Turk.
Behavioral Research Methods 44(1), 1-23.
Mayew, W., Venkatachalam, M., 2012. The power of voice: Managerial affective states and future
firm performance. Journal of Finance 67(1), 1-43.
McArthur, L., Baron, R., 1983. Toward an Ecological Theory of Social Perception. Psychological
Review 90(3), 215-238.
Megginson, W., Weiss, K., 1991. Venture capitalist certification in initial public offerings. Journal
of Finance 46(3), 879-903.
Milovac, M., Sanchez-Burks, J., 2014. Positivity Makes for Poor Pitches: Affective Tone
Conveyed by Entrepreneurs Shapes Support for Creative Ideas. In John Humprheys (Ed.),
Proceedings of the 74th Annual Meeting of the Academy of Management. Online ISSN: 2151-6561.
Mobius, M.M., Rosenblat, T.S., 2006. Why Beauty Matters. American Economic Review 96(1),
222-235.
Murphy, N., 2005. Using thin slices for behavioral coding. Journal of Nonverbal Behavior 29(4),
235-246.
Murphy, N., Hall, J., Colvin, C.R., 2003. Accurate intelligence assessments in social interactions:
Mediators and gender effects. Journal of Personality 71(3), 465-493.
Neuendorf, K.A., 2002. The Content Analysis Handbook. Thousand Oaks, CA: Sage.
NYSE/NASD, 2003. Report and recommendations of a committee convened by the New York
Stock Exchange, Inc. and NASD at the request of the U.S. Securities and Exchange Commission.
May, 2003.
Paolacci, G., J. Chandler, Ipeirotis, P., 2010. Running experiments on Amazon Mechanical Turk.
Judgment and Decision Making, 5(5) 411-419.
Pope, D.G., Sydnor, J.R., 2011. What’s in a Picture? Evidence of Discrimination from
Prosper.com. The Journal of Human Resources 46(1): 53-92.
Rabin, M., Schrag, J., 1999. First impressions matter: A model of confirmatory bias. Quarterly
Journal of Economics 114(1), 37-82.
Rennekamp, K., 2012. Processing fluency and investors’ reactions to disclosure readability.
Journal of Accounting Research 50(5), 1319-1354.
Ritter, J., 1984. The ‘hot issue’ market of 1980. Journal of Business 57, 215-240.
Ritter, J., 2011. Equilibrium in the Initial Public Offerings Market. Annual Review of Financial
Economics 3, 347-374.
46
Rock, K., 1986. Why new issues are underpriced. Journal of Financial Economics 15(1), 187-212.
Roosenboom, P. 2007. How do underwriters value IPOs?: An empirical analysis of the French IPO
market. Contemporary Accounting Research 24(4), 1217-1243.
Roosenboom, P. 2012. Valuing and pricing IPOs. Journal of Banking and Finance 36(6), 1653-
1664.
Rosenblum, N., M. Wetzel, O. Platt, S. Daniels, S. Crawford, Rosenthal, R., 1994. Predicting
medical student success in a clinical clerkship by rating students’ nonverbal behavior. Archives of
Pediatrics & Adolescent Medicine 148(2), 213-219.
Rosenthal, R., J. Hall, M. DiMatteo, P. Rogers, Archer, D. 1979. Sensitivity to Nonverbal
Communication: THE PONS TEST. The Johns Hopkins University Press.
Rule, N., Ambady, N., 2008. The face of success: Inferences from chief executive officers’
appearance predict company profits. Psychological Science 19, 109-111.
Sherman, A., 2012. Examining the IPO process: Is it working for ordinary investors? Testimony
before the Subcommittee on Securities, Insurance, and Investment of the United States Senate
Committee on Banking, Housing and Urban Affairs.
Solomon, D., Soltes, E., 2015. What are we meeting for? The consequences of private meetings
with investors. Journal of Law and Economics 58(2), 325-355.
Soltes, E. 2014. Private interaction between firm management and sell-side analysts. Journal of
Accounting Research 52: 245-272.
Tickle-Degnen, L., 1998. Working well with others: The prediction of students’ clinical
performance. American Journal of Occupational Therapy 52(2), 133-142.
Tickle-Degnen, L., Puccinelli, N., 1999. The nonverbal expression of negative emotions: Peer and
supervisor responses to occupational therapy students’ emotional attributes. Occupational Therapy
Journal of Research 19(1), 18-29.
Titman, S., Trueman, B., 1986. Information quality and the valuation of new issues. Journal of
Accounting and Economics 8, 159-172.
Todorov, A, A. Mandisodza, A. Goren, Hall, C., 2005. Inferences of competence from faces
predict election outcomes. Science 308, 1623-1626.
Troscianko, T., Holmes, A., Stillman, J., Mirmehdi, M., Wright, D., Wilson, A., 2004. What
happens next? The predictability of natural behaviour viewed through CCTV cameras. Perception
33(1), 87-101.
Xiao, Y., Yung, C., 2015. Extrapolation errors in IPOs. Financial Management 44(4), 713-751.
Yeagley, E., Morling, B., Nelson, M., 2007. Nonverbal zero-acquaintance accuracy of self-
esteem, social dominance orientation, and satisfaction with life. Journal of Research in
Personality 41, 1099-1106.
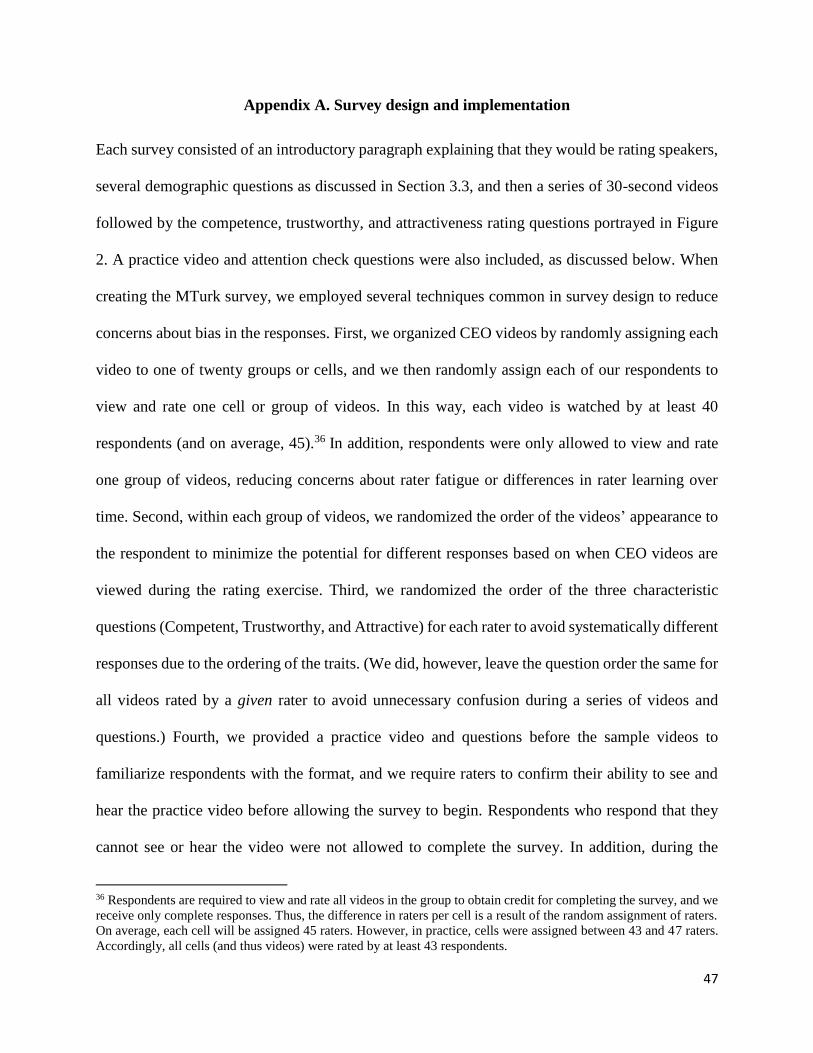
47
Appendix A. Survey design and implementation
Each survey consisted of an introductory paragraph explaining that they would be rating speakers,
several demographic questions as discussed in Section 3.3, and then a series of 30-second videos
followed by the competence, trustworthy, and attractiveness rating questions portrayed in Figure
2. A practice video and attention check questions were also included, as discussed below. When
creating the MTurk survey, we employed several techniques common in survey design to reduce
concerns about bias in the responses. First, we organized CEO videos by randomly assigning each
video to one of twenty groups or cells, and we then randomly assign each of our respondents to
view and rate one cell or group of videos. In this way, each video is watched by at least 40
respondents (and on average, 45).36 In addition, respondents were only allowed to view and rate
one group of videos, reducing concerns about rater fatigue or differences in rater learning over
time. Second, within each group of videos, we randomized the order of the videos’ appearance to
the respondent to minimize the potential for different responses based on when CEO videos are
viewed during the rating exercise. Third, we randomized the order of the three characteristic
questions (Competent, Trustworthy, and Attractive) for each rater to avoid systematically different
responses due to the ordering of the traits. (We did, however, leave the question order the same for
all videos rated by a given rater to avoid unnecessary confusion during a series of videos and
questions.) Fourth, we provided a practice video and questions before the sample videos to
familiarize respondents with the format, and we require raters to confirm their ability to see and
hear the practice video before allowing the survey to begin. Respondents who respond that they
cannot see or hear the video were not allowed to complete the survey. In addition, during the
36 Respondents are required to view and rate all videos in the group to obtain credit for completing the survey, and we
receive only complete responses. Thus, the difference in raters per cell is a result of the random assignment of raters.
On average, each cell will be assigned 45 raters. However, in practice, cells were assigned between 43 and 47 raters.
Accordingly, all cells (and thus videos) were rated by at least 43 respondents.

48
survey, we do not allow the rater to progress to the questions until the time required to view the
video has elapsed. In this way, we minimize the risk that respondents ignore the video and respond
with random ratings.37
In addition, we followed the recommendations for maximizing data quality from studies that
examine the reliability of data originating from MTurk. Specifically, we require that each MTurk
worker requesting to complete our Human Intelligence Task (HIT) be located in the United States
and have an approval rating of at least 95% on their previous assignments. We also included an
attention-check question at both the beginning and the end of the HIT. The questions followed the
same format as the primary perception questions (with the Likert scale as displayed in Figure 2),
and consisted of the following text: (First question) Mt. Everest is the tallest mountain in the world,
measuring 29,029 feet high. On a scale of 1 (Not at all) to 7 (Very), how likely is it that Mt.
McKinley, a mountain in North America, is taller than Mt. Everest? (Second question) Lake Baikal
is the deepest lake in the world, at 5,369 feet deep. On a scale of 1 (Not at all) to 7 (Very), how
likely is it that Lake Superior, a lake in North America, is deeper than Lake Baikal? We perform
robustness tests in Section 5 using only responses from MTurk workers that correctly answered
these attention-check questions.
37 Also see robustness tests in Section 5.2 eliminating ratings that are potentially of lower quality.
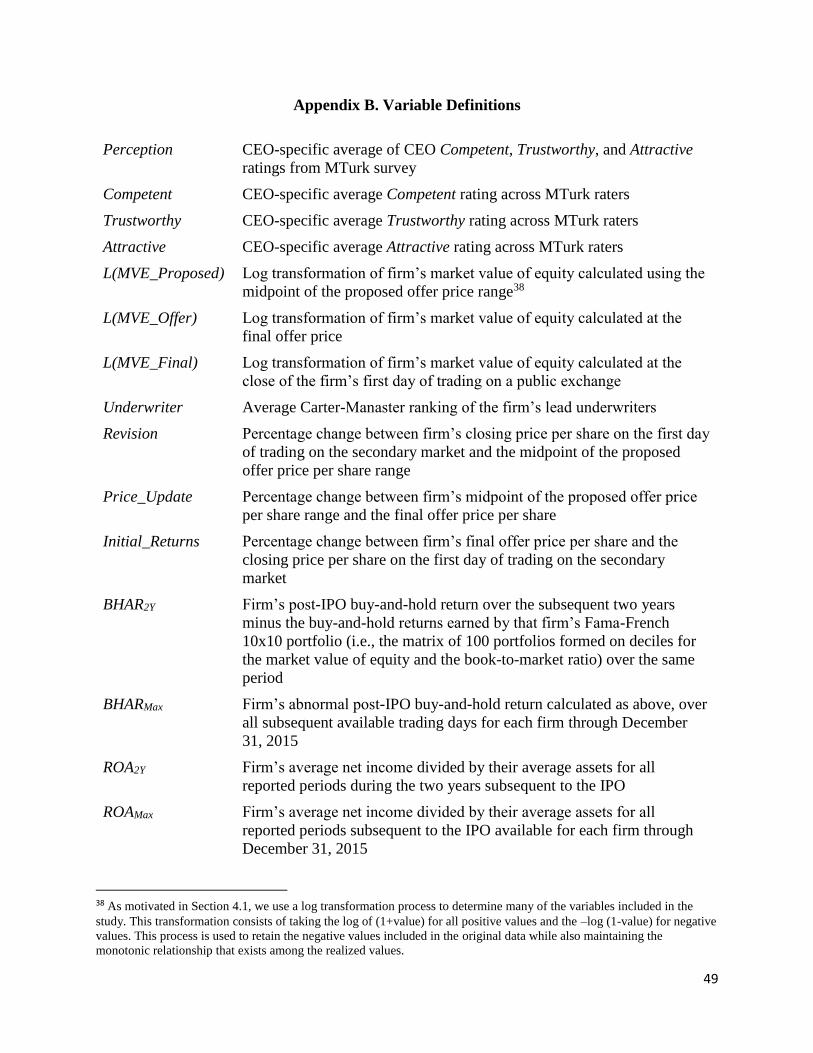
49
Appendix B. Variable Definitions
Perception CEO-specific average of CEO Competent, Trustworthy, and Attractive
ratings from MTurk survey
Competent CEO-specific average Competent rating across MTurk raters
Trustworthy CEO-specific average Trustworthy rating across MTurk raters
Attractive CEO-specific average Attractive rating across MTurk raters
L(MVE_Proposed) Log transformation of firm’s market value of equity calculated using the
midpoint of the proposed offer price range38
L(MVE_Offer) Log transformation of firm’s market value of equity calculated at the
final offer price
L(MVE_Final) Log transformation of firm’s market value of equity calculated at the
close of the firm’s first day of trading on a public exchange
Underwriter Average Carter-Manaster ranking of the firm’s lead underwriters
Revision Percentage change between firm’s closing price per share on the first day
of trading on the secondary market and the midpoint of the proposed
offer price per share range
Price_Update Percentage change between firm’s midpoint of the proposed offer price
per share range and the final offer price per share
Initial_Returns Percentage change between firm’s final offer price per share and the
closing price per share on the first day of trading on the secondary
market
BHAR2Y Firm’s post-IPO buy-and-hold return over the subsequent two years
minus the buy-and-hold returns earned by that firm’s Fama-French
10x10 portfolio (i.e., the matrix of 100 portfolios formed on deciles for
the market value of equity and the book-to-market ratio) over the same
period
BHARMax Firm’s abnormal post-IPO buy-and-hold return calculated as above, over
all subsequent available trading days for each firm through December
31, 2015
ROA2Y Firm’s average net income divided by their average assets for all
reported periods during the two years subsequent to the IPO
ROAMax Firm’s average net income divided by their average assets for all
reported periods subsequent to the IPO available for each firm through
December 31, 2015
38 As motivated in Section 4.1, we use a log transformation process to determine many of the variables included in the
study. This transformation consists of taking the log of (1+value) for all positive values and the –log (1-value) for negative
values. This process is used to retain the negative values included in the original data while also maintaining the
monotonic relationship that exists among the realized values.
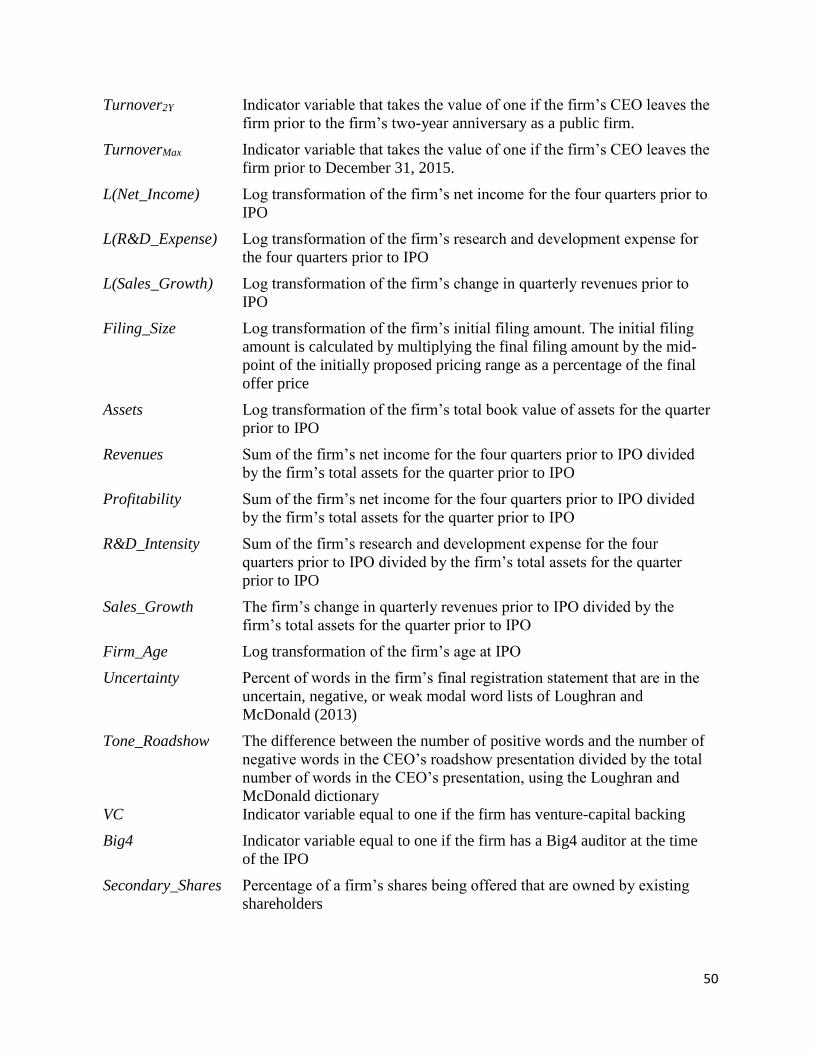
50
Turnover2Y Indicator variable that takes the value of one if the firm’s CEO leaves the
firm prior to the firm’s two-year anniversary as a public firm.
TurnoverMax Indicator variable that takes the value of one if the firm’s CEO leaves the
firm prior to December 31, 2015.
L(Net_Income) Log transformation of the firm’s net income for the four quarters prior to
IPO
L(R&D_Expense) Log transformation of the firm’s research and development expense for
the four quarters prior to IPO
L(Sales_Growth) Log transformation of the firm’s change in quarterly revenues prior to
IPO
Filing_Size Log transformation of the firm’s initial filing amount. The initial filing
amount is calculated by multiplying the final filing amount by the mid-
point of the initially proposed pricing range as a percentage of the final
offer price
Assets Log transformation of the firm’s total book value of assets for the quarter
prior to IPO
Revenues Sum of the firm’s net income for the four quarters prior to IPO divided
by the firm’s total assets for the quarter prior to IPO
Profitability Sum of the firm’s net income for the four quarters prior to IPO divided
by the firm’s total assets for the quarter prior to IPO
R&D_Intensity Sum of the firm’s research and development expense for the four
quarters prior to IPO divided by the firm’s total assets for the quarter
prior to IPO
Sales_Growth The firm’s change in quarterly revenues prior to IPO divided by the
firm’s total assets for the quarter prior to IPO
Firm_Age Log transformation of the firm’s age at IPO
Uncertainty Percent of words in the firm’s final registration statement that are in the
uncertain, negative, or weak modal word lists of Loughran and
McDonald (2013)
Tone_Roadshow The difference between the number of positive words and the number of
negative words in the CEO’s roadshow presentation divided by the total
number of words in the CEO’s presentation, using the Loughran and
McDonald dictionary
VC Indicator variable equal to one if the firm has venture-capital backing
Big4 Indicator variable equal to one if the firm has a Big4 auditor at the time
of the IPO
Secondary_Shares Percentage of a firm’s shares being offered that are owned by existing
shareholders

51
Insider_Retention Percentage of a firm’s total shares that are retained by executives and
directors after the offering
Mkt_Cond_Level Average closing price of the NASDAQ composite index (in thousands)
between the time the firm files its initial registration statement and
completes its IPO
Mkt_Cond_Change Average daily percentage change of the NASDAQ composite index
between the time the firm files its initial registration statement and
completes its IPO
Female Indicator variable equal to one if the firm’s CEO is female
Foreign Indicator variable equal to one if the firm’s CEO completed a degree
from a university located outside of the United States
CEO_Age Log transformation of the age of the firm’s CEO at IPO
Grad_School Indicator variable equal to one if the firm’s CEO earned a postgraduate
degree
Experience Indicator variable equal to one if the previous employer of the firm’s
CEO was publicly traded
Founder Indicator variable equal to one if the firm’s CEO is the firm’s founder
WHR The width to height ratio of the firm’s CEO face. This measure is
calculated as the distance between the upper lip and the highest point of
the firm’s eyelids divided by the distance between the left and right
cheekbones. Refer to Jia et al., (2014) for additional information.
Live Indicator variable equal to one if the retail roadshow appears to be
recorded from an actual presentation made to institutional investors
Sitting Indicator variable equal to one if the CEO is sitting during the roadshow
presentation
Background Indicator variable equal to one if an investment bank’s logo is visible in
the background during the CEO’s presentation
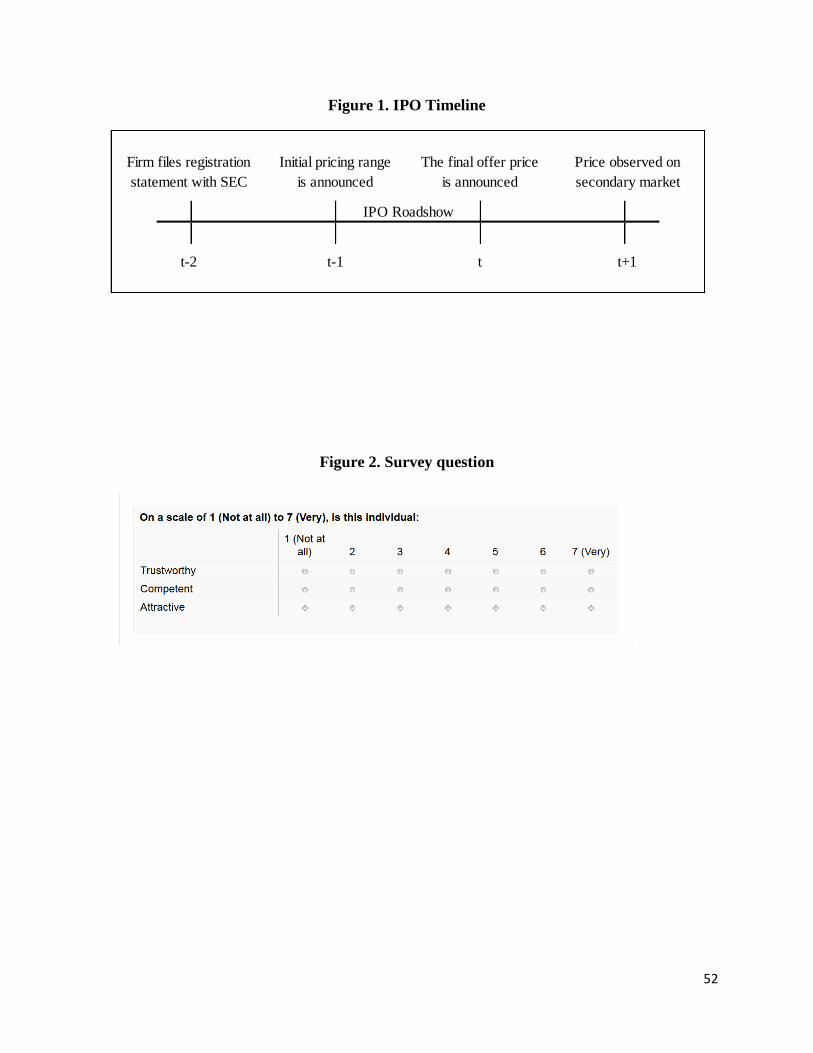
52
Figure 1. IPO Timeline
Figure 2. Survey question
t-2 t-1 t t+1
Firm files registration
statement with SEC
Initial pricing range
is announced
The final offer price
is announced
Price observed on
secondary market
IPO Roadshow
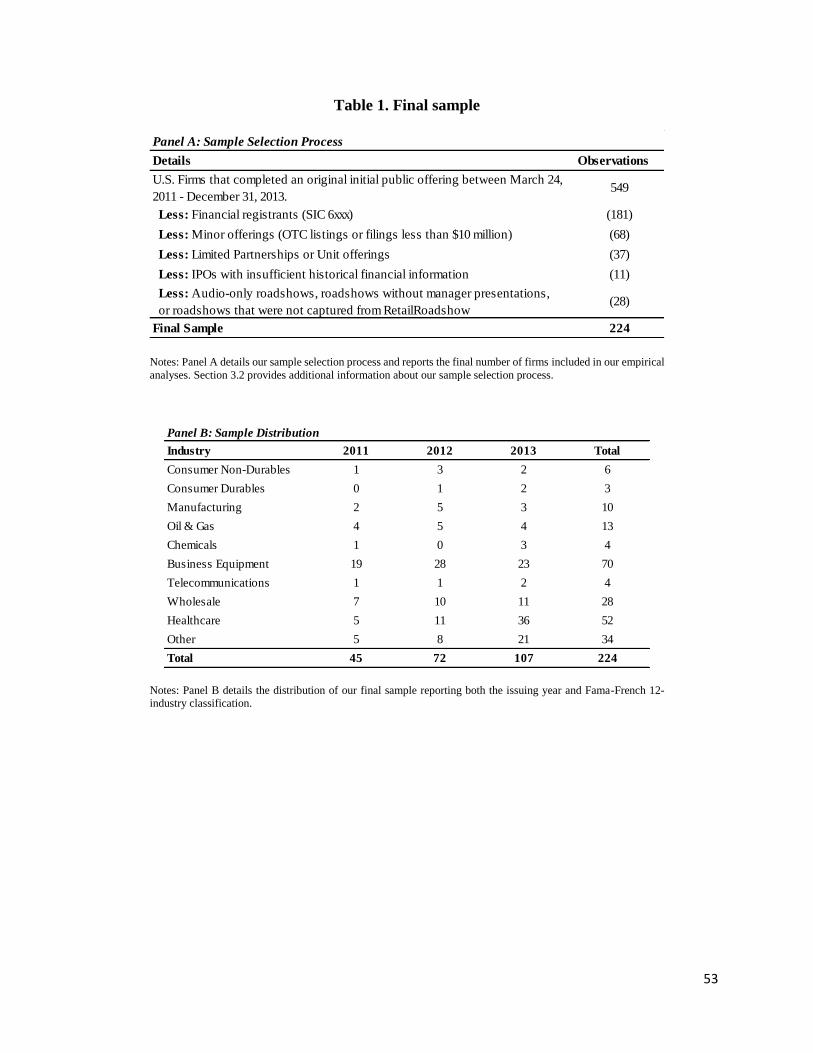
53
Table 1. Final sample
Notes: Panel A details our sample selection process and reports the final number of firms included in our empirical
analyses. Section 3.2 provides additional information about our sample selection process.
Notes: Panel B details the distribution of our final sample reporting both the issuing year and Fama-French 12-
industry classification.
Panel A: Sample Selection Process
Observations
549
(181)
(68)
(37)
(11)
(28)
224Final Sample
Details
U.S. Firms that completed an original initial public offering between March 24,
2011 - December 31, 2013.
Less: Minor offerings (OTC listings or filings less than $10 million)
Less: Limited Partnerships or Unit offerings
Less: IPOs with insufficient historical financial information
Less: Audio-only roadshows, roadshows without manager presentations,
or roadshows that were not captured from RetailRoadshow
Less: Financial registrants (SIC 6xxx)
Panel B: Sample Distribution
Industry 2011 2012 2013 Total
Consumer Non-Durables 1 3 2 6
Consumer Durables 0 1 2 3
Manufacturing 2 5 3 10
Oil & Gas 4 5 4 13
Chemicals 1 0 3 4
Business Equipment 19 28 23 70
Telecommunications 1 1 2 4
Wholesale 7 10 11 28
Healthcare 5 11 36 52
Other 5 8 21 34
Total 45 72 107 224

54
Table 2. Mechanical Turk workers
Notes: Panel A provides the demographic and background characteristics of the MTurk workers
that analyzed the CEO presentations in our study. Appendix A provides additional information
about our use of Amazon’s Mechanical Turk system.
Panel A: Characteristics of Mechanical Turk Workers
Frequency Percent
Gender
Male 473 52.6%
Female 427 47.4%
Total 900 100%
Age
18-29 406 45.1%
30-49 378 42.0%
50+ 116 12.9%
Total 900 100%
Education
Some high school or less 9 1.0%
High school graduate or equivalent 112 12.4%
Trade, technical, or vocational training 49 5.4%
Some college credit, no degree 274 30.5%
College graduate 350 38.9%
Some postgraduate work 25 2.8%
Post graduate degree 81 9.0%
Total 900 100%
Ethnicity
Caucasian 662 73.6%
African American 76 8.4%
Asian 66 7.3%
Hispanic 60 6.7%
Other 36 4.0%
Total 900 100%
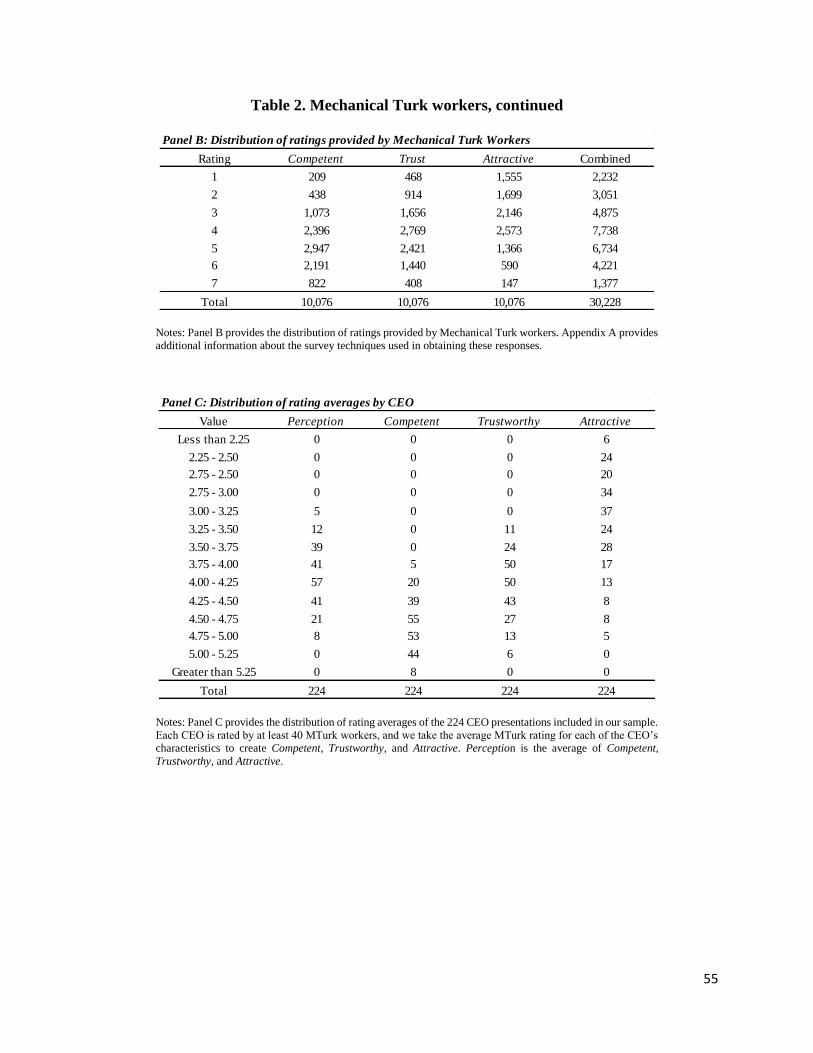
55
Table 2. Mechanical Turk workers, continued
Notes: Panel B provides the distribution of ratings provided by Mechanical Turk workers. Appendix A provides
additional information about the survey techniques used in obtaining these responses.
Notes: Panel C provides the distribution of rating averages of the 224 CEO presentations included in our sample.
Each CEO is rated by at least 40 MTurk workers, and we take the average MTurk rating for each of the CEO’s
characteristics to create Competent, Trustworthy, and Attractive. Perception is the average of Competent,
Trustworthy, and Attractive.
Panel B: Distribution of ratings provided by Mechanical Turk Workers
Rating Competent Trust Attractive Combined
1 209 468 1,555 2,232
2 438 914 1,699 3,051
3 1,073 1,656 2,146 4,875
4 2,396 2,769 2,573 7,738
5 2,947 2,421 1,366 6,734
6 2,191 1,440 590 4,221
7 822 408 147 1,377
Total 10,076 10,076 10,076 30,228
Panel C: Distribution of rating averages by CEO
Value Perception Competent Trustworthy Attractive
Less than 2.25 0 0 0 6
2.25 - 2.50 0 0 0 24
2.75 - 2.50 0 0 0 20
2.75 - 3.00 0 0 0 34
3.00 - 3.25 5 0 0 37
3.25 - 3.50 12 0 11 24
3.50 - 3.75 39 0 24 28
3.75 - 4.00 41 5 50 17
4.00 - 4.25 57 20 50 13
4.25 - 4.50 41 39 43 8
4.50 - 4.75 21 55 27 8
4.75 - 5.00 8 53 13 5
5.00 - 5.25 0 44 6 0
Greater than 5.25 0 8 0 0
Total 224 224 224 224

56
Table 3. Descriptive statistics
Notes: Table 3 provides descriptive statistics for our sample of firms. The data used in this study
is collected from a variety of sources including Compustat, CRSP, SDC Platinum, the SEC
EDGAR database, and Jay Ritter’s IPO database. The motivations and descriptions for all variables
appear in both Section 4 and Appendix B of this paper.
Variable Obs Mean Std. Dev Q1 Median Q3
Perception 224 4.05 0.39 3.76 4.09 4.32
Competent 224 4.72 0.36 4.47 4.73 4.98
Trustworthy 224 4.16 0.42 3.86 4.13 4.47
Attractive 224 3.28 0.66 2.80 3.18 3.73
L(MVE_Proposed) 224 6.54 0.98 5.81 6.31 7.15
L(MVE_Offer) 224 6.51 1.07 5.82 6.34 7.16
L(MVE_Final) 224 6.68 1.12 5.94 6.58 7.34
Underwriter 224 8.25 0.86 8.00 8.50 8.75
Revision 224 0.24 0.54 -0.16 0.12 0.51
Price_Update 224 -0.01 0.23 -0.17 0.00 0.13
Initial_Returns 224 0.21 0.29 0.01 0.14 0.32
L(Book_Value) 224 4.61 2.48 4.33 4.87 5.71
L(Revenues) 224 4.83 2.17 3.99 4.94 6.09
L(Net_Income) 224 -0.38 3.33 -3.24 -1.54 2.89
L(R&D_Intensity) 224 2.00 1.60 0.00 2.46 3.16
L(Sales_Growth) 224 1.50 3.23 0.00 2.21 3.81
Assets 224 5.26 1.71 4.03 4.90 6.40
Firm_Age 224 2.62 0.89 2.08 2.48 3.16
Uncertainty 224 3.77 0.41 3.50 3.74 4.06
Tone_Roadshow 224 1.33 0.82 0.76 1.33 1.86
VC 224 0.48 0.50 0.00 0.00 1.00
Filing_Size 224 5.02 0.81 4.40 4.78 5.42
Big4 224 0.88 0.32 1.00 1.00 1.00
Secondary_Shares 224 0.15 0.26 0.00 0.00 0.20
Insider_Retention 224 0.41 0.25 0.17 0.45 0.59
Mkt_Cond_Level 224 3.12 0.42 2.75 3.00 3.48
Mkt_Cond_Change 224 0.08 0.09 0.04 0.08 0.14
Female 224 0.04 0.19 0.00 0.00 0.00
Foreign 224 0.14 0.35 0.00 0.00 0.00
CEO_Age 224 3.93 0.15 3.84 3.95 4.04
Grad_School 224 0.59 0.49 0.00 1.00 1.00
Experience 224 0.48 0.50 0.00 0.00 1.00
Founder 224 0.36 0.48 0.00 0.00 1.00
WHR 224 2.08 0.16 1.95 2.06 2.18
Live 224 0.65 0.48 0.00 1.00 1.00
Sitting 224 0.08 0.27 0.00 0.00 0.00
Background 224 0.15 0.36 0.00 0.00 0.00
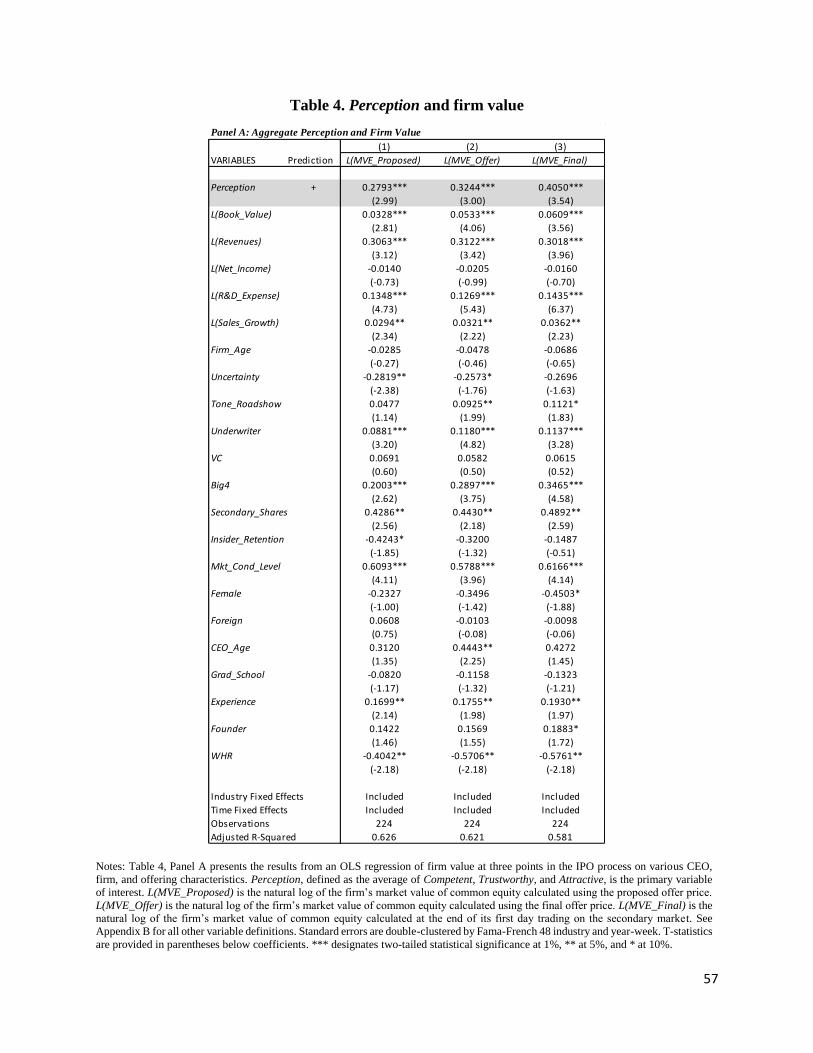
57
Table 4. Perception and firm value
Notes: Table 4, Panel A presents the results from an OLS regression of firm value at three points in the IPO process on various CEO,
firm, and offering characteristics. Perception, defined as the average of Competent, Trustworthy, and Attractive, is the primary variable
of interest. L(MVE_Proposed) is the natural log of the firm’s market value of common equity calculated using the proposed offer price.
L(MVE_Offer) is the natural log of the firm’s market value of common equity calculated using the final offer price. L(MVE_Final) is the
natural log of the firm’s market value of common equity calculated at the end of its first day trading on the secondary market. See
Appendix B for all other variable definitions. Standard errors are double-clustered by Fama-French 48 industry and year-week. T-statistics
are provided in parentheses below coefficients. *** designates two-tailed statistical significance at 1%, ** at 5%, and * at 10%.
Panel A: Aggregate Perception and Firm Value
(1) (2) (3)
VARIABLES Prediction L(MVE_Proposed) L(MVE_Offer) L(MVE_Final)
Perception + 0.2793*** 0.3244*** 0.4050***
(2.99) (3.00) (3.54)
L(Book_Value) 0.0328*** 0.0533*** 0.0609***
(2.81) (4.06) (3.56)
L(Revenues) 0.3063*** 0.3122*** 0.3018***
(3.12) (3.42) (3.96)
L(Net_Income) -0.0140 -0.0205 -0.0160
(-0.73) (-0.99) (-0.70)
L(R&D_Expense) 0.1348*** 0.1269*** 0.1435***
(4.73) (5.43) (6.37)
L(Sales_Growth) 0.0294** 0.0321** 0.0362**
(2.34) (2.22) (2.23)
Firm_Age -0.0285 -0.0478 -0.0686
(-0.27) (-0.46) (-0.65)
Uncertainty -0.2819** -0.2573* -0.2696
(-2.38) (-1.76) (-1.63)
Tone_Roadshow 0.0477 0.0925** 0.1121*
(1.14) (1.99) (1.83)
Underwriter 0.0881*** 0.1180*** 0.1137***
(3.20) (4.82) (3.28)
VC 0.0691 0.0582 0.0615
(0.60) (0.50) (0.52)
Big4 0.2003*** 0.2897*** 0.3465***
(2.62) (3.75) (4.58)
Secondary_Shares 0.4286** 0.4430** 0.4892**
(2.56) (2.18) (2.59)
Insider_Retention -0.4243* -0.3200 -0.1487
(-1.85) (-1.32) (-0.51)
Mkt_Cond_Level 0.6093*** 0.5788*** 0.6166***
(4.11) (3.96) (4.14)
Female -0.2327 -0.3496 -0.4503*
(-1.00) (-1.42) (-1.88)
Foreign 0.0608 -0.0103 -0.0098
(0.75) (-0.08) (-0.06)
CEO_Age 0.3120 0.4443** 0.4272
(1.35) (2.25) (1.45)
Grad_School -0.0820 -0.1158 -0.1323
(-1.17) (-1.32) (-1.21)
Experience 0.1699** 0.1755** 0.1930**
(2.14) (1.98) (1.97)
Founder 0.1422 0.1569 0.1883*
(1.46) (1.55) (1.72)
WHR -0.4042** -0.5706** -0.5761**
(-2.18) (-2.18) (-2.18)
Industry Fixed Effects Included Included Included
Time Fixed Effects Included Included Included
Observations 224 224 224
Adjusted R-Squared 0.626 0.621 0.581
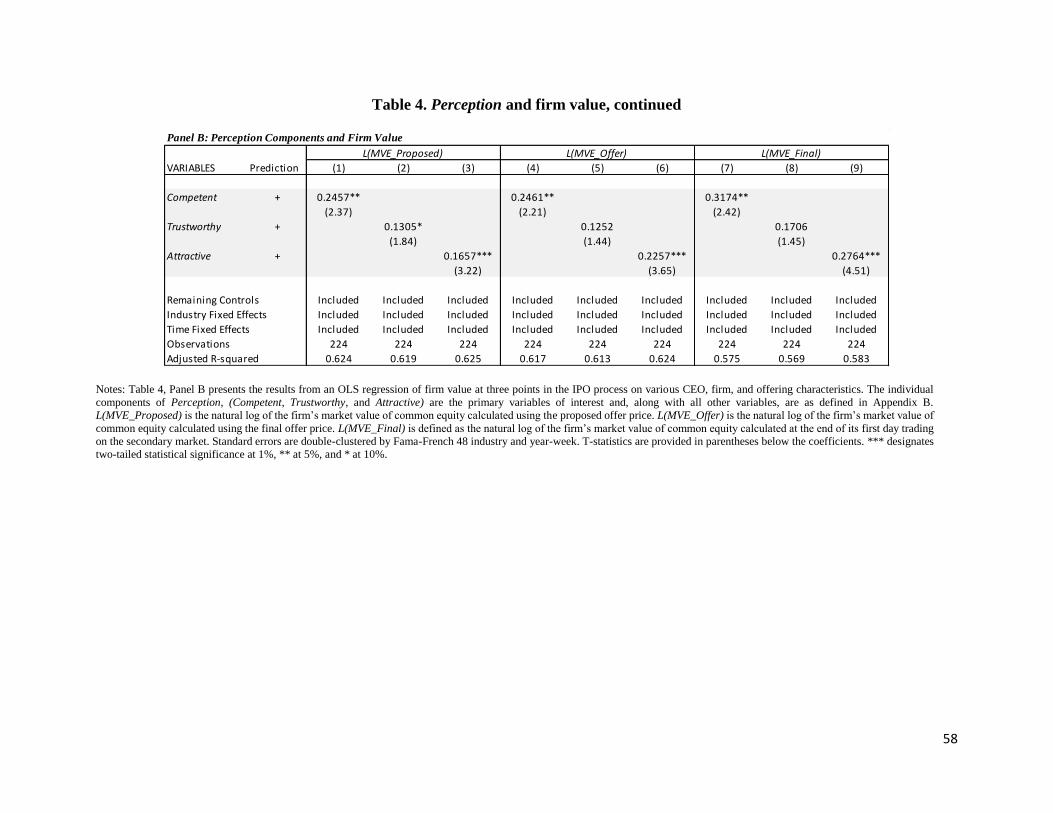
58
Table 4. Perception and firm value, continued
Notes: Table 4, Panel B presents the results from an OLS regression of firm value at three points in the IPO process on various CEO, firm, and offering characteristics. The individual
components of Perception, (Competent, Trustworthy, and Attractive) are the primary variables of interest and, along with all other variables, are as defined in Appendix B.
L(MVE_Proposed) is the natural log of the firm’s market value of common equity calculated using the proposed offer price. L(MVE_Offer) is the natural log of the firm’s market value of
common equity calculated using the final offer price. L(MVE_Final) is defined as the natural log of the firm’s market value of common equity calculated at the end of its first day trading
on the secondary market. Standard errors are double-clustered by Fama-French 48 industry and year-week. T-statistics are provided in parentheses below the coefficients. *** designates
two-tailed statistical significance at 1%, ** at 5%, and * at 10%.
Panel B: Perception Components and Firm Value
VARIABLES Prediction (1) (2) (3) (4) (5) (6) (7) (8) (9)
Competent + 0.2457** 0.2461** 0.3174**
(2.37) (2.21) (2.42)
Trustworthy + 0.1305* 0.1252 0.1706
(1.84) (1.44) (1.45)
Attractive + 0.1657*** 0.2257*** 0.2764***
(3.22) (3.65) (4.51)
Remaining Controls Included Included Included Included Included Included Included Included Included
Industry Fixed Effects Included Included Included Included Included Included Included Included Included
Time Fixed Effects Included Included Included Included Included Included Included Included Included
Observations 224 224 224 224 224 224 224 224 224
Adjusted R-squared 0.624 0.619 0.625 0.617 0.613 0.624 0.575 0.569 0.583
L(MVE_Proposed) L(MVE_Offer) L(MVE_Final)
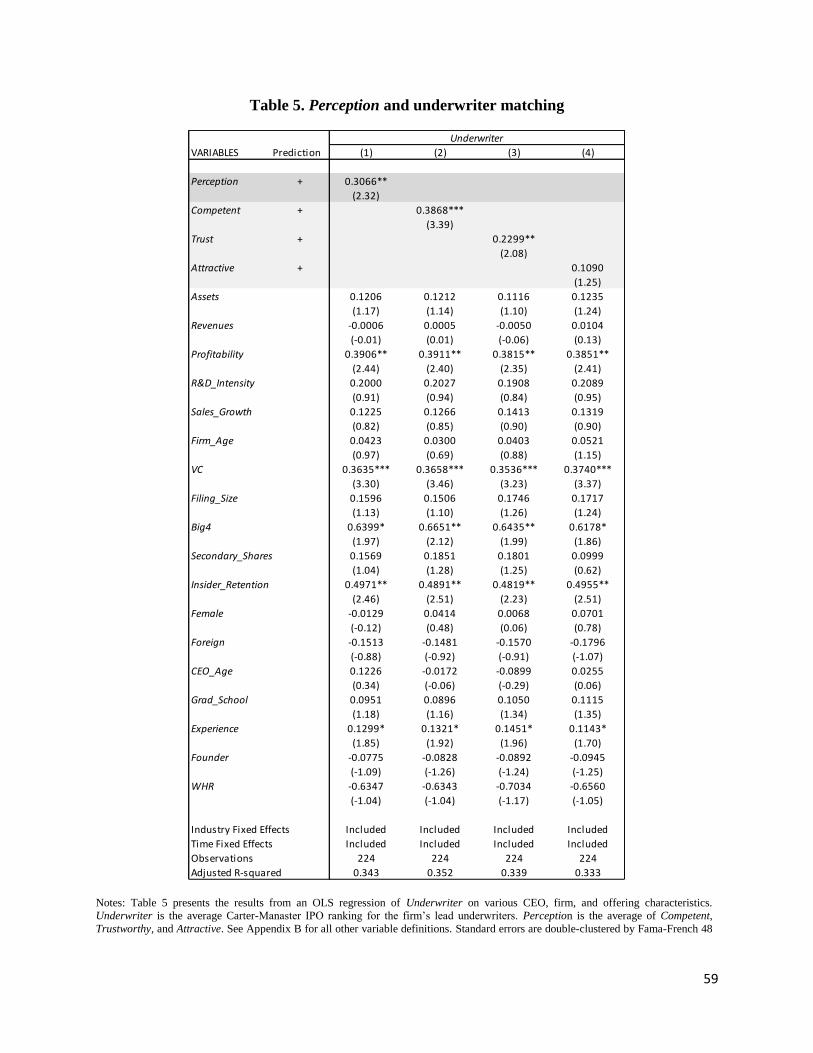
59
Table 5. Perception and underwriter matching
Notes: Table 5 presents the results from an OLS regression of Underwriter on various CEO, firm, and offering characteristics.
Underwriter is the average Carter-Manaster IPO ranking for the firm’s lead underwriters. Perception is the average of Competent,
Trustworthy, and Attractive. See Appendix B for all other variable definitions. Standard errors are double-clustered by Fama-French 48
VARIABLES Prediction (1) (2) (3) (4)
Perception + 0.3066**
(2.32)
Competent + 0.3868***
(3.39)
Trust + 0.2299**
(2.08)
Attractive + 0.1090
(1.25)
Assets 0.1206 0.1212 0.1116 0.1235
(1.17) (1.14) (1.10) (1.24)
Revenues -0.0006 0.0005 -0.0050 0.0104
(-0.01) (0.01) (-0.06) (0.13)
Profitability 0.3906** 0.3911** 0.3815** 0.3851**
(2.44) (2.40) (2.35) (2.41)
R&D_Intensity 0.2000 0.2027 0.1908 0.2089
(0.91) (0.94) (0.84) (0.95)
Sales_Growth 0.1225 0.1266 0.1413 0.1319
(0.82) (0.85) (0.90) (0.90)
Firm_Age 0.0423 0.0300 0.0403 0.0521
(0.97) (0.69) (0.88) (1.15)
VC 0.3635*** 0.3658*** 0.3536*** 0.3740***
(3.30) (3.46) (3.23) (3.37)
Filing_Size 0.1596 0.1506 0.1746 0.1717
(1.13) (1.10) (1.26) (1.24)
Big4 0.6399* 0.6651** 0.6435** 0.6178*
(1.97) (2.12) (1.99) (1.86)
Secondary_Shares 0.1569 0.1851 0.1801 0.0999
(1.04) (1.28) (1.25) (0.62)
Insider_Retention 0.4971** 0.4891** 0.4819** 0.4955**
(2.46) (2.51) (2.23) (2.51)
Female -0.0129 0.0414 0.0068 0.0701
(-0.12) (0.48) (0.06) (0.78)
Foreign -0.1513 -0.1481 -0.1570 -0.1796
(-0.88) (-0.92) (-0.91) (-1.07)
CEO_Age 0.1226 -0.0172 -0.0899 0.0255
(0.34) (-0.06) (-0.29) (0.06)
Grad_School 0.0951 0.0896 0.1050 0.1115
(1.18) (1.16) (1.34) (1.35)
Experience 0.1299* 0.1321* 0.1451* 0.1143*
(1.85) (1.92) (1.96) (1.70)
Founder -0.0775 -0.0828 -0.0892 -0.0945
(-1.09) (-1.26) (-1.24) (-1.25)
WHR -0.6347 -0.6343 -0.7034 -0.6560
(-1.04) (-1.04) (-1.17) (-1.05)
Industry Fixed Effects Included Included Included Included
Time Fixed Effects Included Included Included Included
Observations 224 224 224 224
Adjusted R-squared 0.343 0.352 0.339 0.333
Underwriter
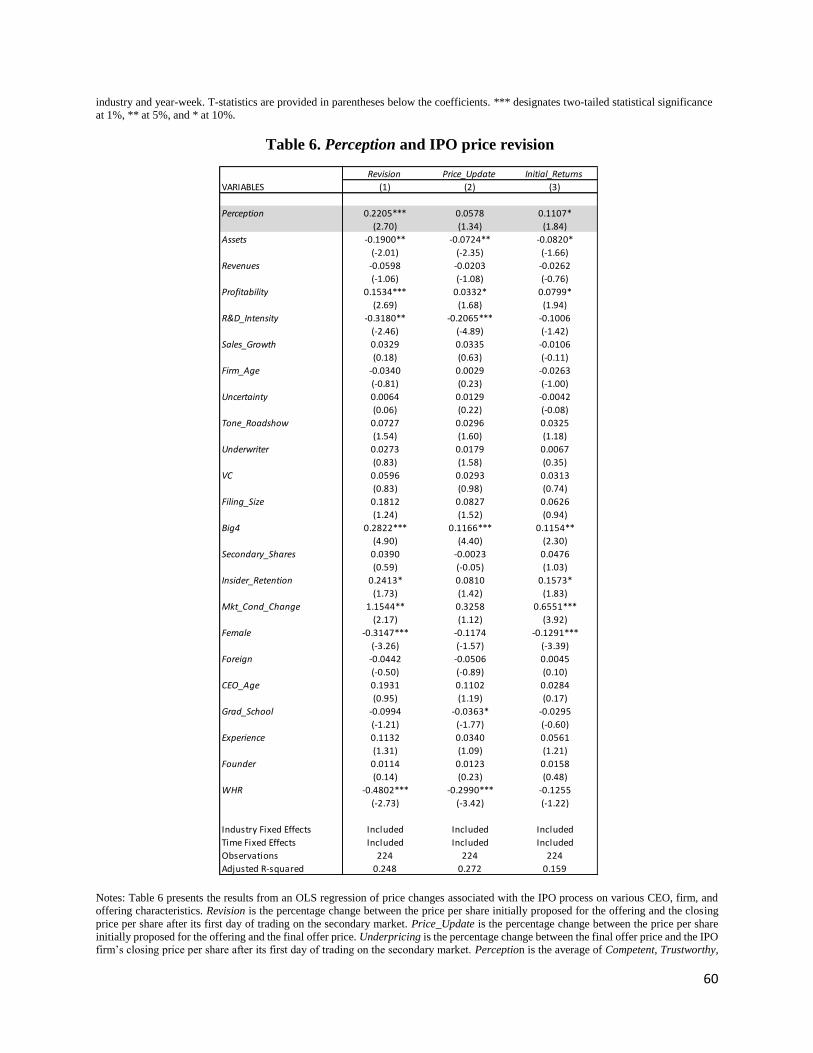
60
industry and year-week. T-statistics are provided in parentheses below the coefficients. *** designates two-tailed statistical significance
at 1%, ** at 5%, and * at 10%.
Table 6. Perception and IPO price revision
Notes: Table 6 presents the results from an OLS regression of price changes associated with the IPO process on various CEO, firm, and
offering characteristics. Revision is the percentage change between the price per share initially proposed for the offering and the closing
price per share after its first day of trading on the secondary market. Price_Update is the percentage change between the price per share
initially proposed for the offering and the final offer price. Underpricing is the percentage change between the final offer price and the IPO
firm’s closing price per share after its first day of trading on the secondary market. Perception is the average of Competent, Trustworthy,
Revision Price_Update Initial_Returns
VARIABLES (1) (2) (3)
Perception 0.2205*** 0.0578 0.1107*
(2.70) (1.34) (1.84)
Assets -0.1900** -0.0724** -0.0820*
(-2.01) (-2.35) (-1.66)
Revenues -0.0598 -0.0203 -0.0262
(-1.06) (-1.08) (-0.76)
Profitability 0.1534*** 0.0332* 0.0799*
(2.69) (1.68) (1.94)
R&D_Intensity -0.3180** -0.2065*** -0.1006
(-2.46) (-4.89) (-1.42)
Sales_Growth 0.0329 0.0335 -0.0106
(0.18) (0.63) (-0.11)
Firm_Age -0.0340 0.0029 -0.0263
(-0.81) (0.23) (-1.00)
Uncertainty 0.0064 0.0129 -0.0042
(0.06) (0.22) (-0.08)
Tone_Roadshow 0.0727 0.0296 0.0325
(1.54) (1.60) (1.18)
Underwriter 0.0273 0.0179 0.0067
(0.83) (1.58) (0.35)
VC 0.0596 0.0293 0.0313
(0.83) (0.98) (0.74)
Filing_Size 0.1812 0.0827 0.0626
(1.24) (1.52) (0.94)
Big4 0.2822*** 0.1166*** 0.1154**
(4.90) (4.40) (2.30)
Secondary_Shares 0.0390 -0.0023 0.0476
(0.59) (-0.05) (1.03)
Insider_Retention 0.2413* 0.0810 0.1573*
(1.73) (1.42) (1.83)
Mkt_Cond_Change 1.1544** 0.3258 0.6551***
(2.17) (1.12) (3.92)
Female -0.3147*** -0.1174 -0.1291***
(-3.26) (-1.57) (-3.39)
Foreign -0.0442 -0.0506 0.0045
(-0.50) (-0.89) (0.10)
CEO_Age 0.1931 0.1102 0.0284
(0.95) (1.19) (0.17)
Grad_School -0.0994 -0.0363* -0.0295
(-1.21) (-1.77) (-0.60)
Experience 0.1132 0.0340 0.0561
(1.31) (1.09) (1.21)
Founder 0.0114 0.0123 0.0158
(0.14) (0.23) (0.48)
WHR -0.4802*** -0.2990*** -0.1255
(-2.73) (-3.42) (-1.22)
Industry Fixed Effects Included Included Included
Time Fixed Effects Included Included Included
Observations 224 224 224
Adjusted R-squared 0.248 0.272 0.159

61
and Attractive. See Appendix B for all other variable definitions. Standard errors are double-clustered by Fama-French 48 industry and
year-week. T-statistics are provided in parentheses below the coefficients. *** designates two-tailed statistical significance at 1%, ** at
5%, and * at 10%.
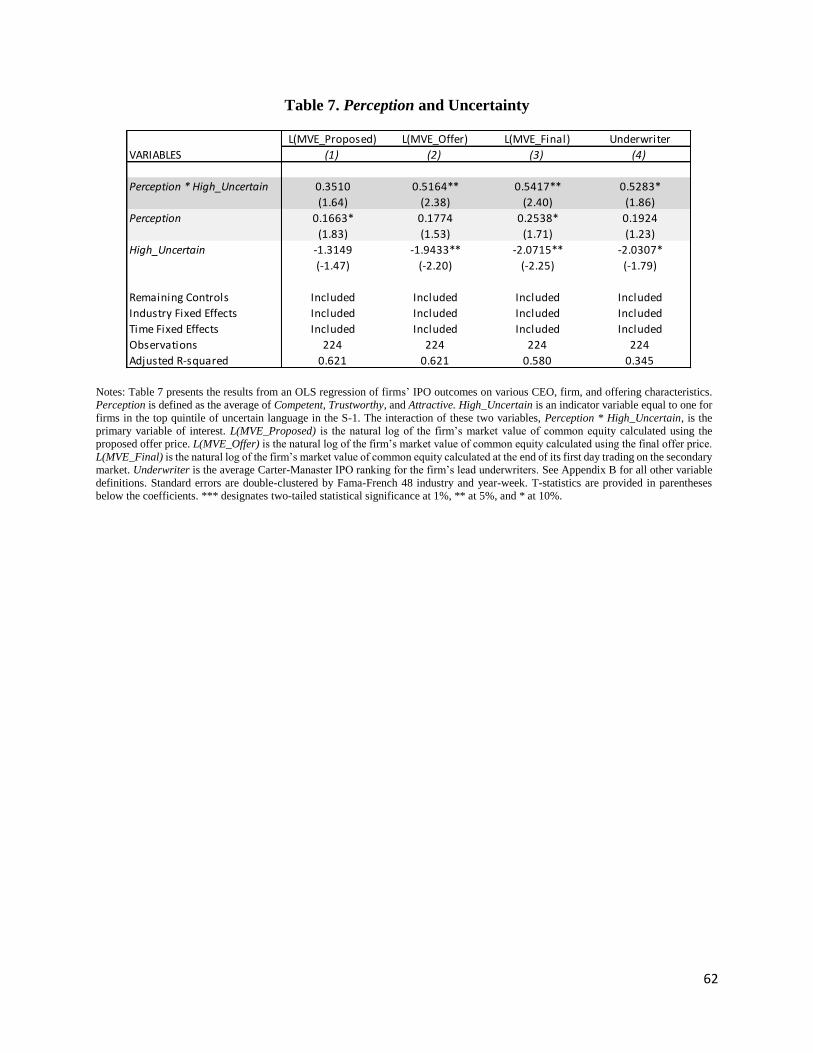
62
Table 7. Perception and Uncertainty
Notes: Table 7 presents the results from an OLS regression of firms’ IPO outcomes on various CEO, firm, and offering characteristics.
Perception is defined as the average of Competent, Trustworthy, and Attractive. High_Uncertain is an indicator variable equal to one for
firms in the top quintile of uncertain language in the S-1. The interaction of these two variables, Perception * High_Uncertain, is the
primary variable of interest. L(MVE_Proposed) is the natural log of the firm’s market value of common equity calculated using the
proposed offer price. L(MVE_Offer) is the natural log of the firm’s market value of common equity calculated using the final offer price.
L(MVE_Final) is the natural log of the firm’s market value of common equity calculated at the end of its first day trading on the secondary
market. Underwriter is the average Carter-Manaster IPO ranking for the firm’s lead underwriters. See Appendix B for all other variable
definitions. Standard errors are double-clustered by Fama-French 48 industry and year-week. T-statistics are provided in parentheses
below the coefficients. *** designates two-tailed statistical significance at 1%, ** at 5%, and * at 10%.
L(MVE_Proposed) L(MVE_Offer) L(MVE_Final) Underwriter
VARIABLES (1) (2) (3) (4)
Perception * High_Uncertain 0.3510 0.5164** 0.5417** 0.5283*
(1.64) (2.38) (2.40) (1.86)
Perception 0.1663* 0.1774 0.2538* 0.1924
(1.83) (1.53) (1.71) (1.23)
High_Uncertain -1.3149 -1.9433** -2.0715** -2.0307*
(-1.47) (-2.20) (-2.25) (-1.79)
Remaining Controls Included Included Included Included
Industry Fixed Effects Included Included Included Included
Time Fixed Effects Included Included Included Included
Observations 224 224 224 224
Adjusted R-squared 0.621 0.621 0.580 0.345
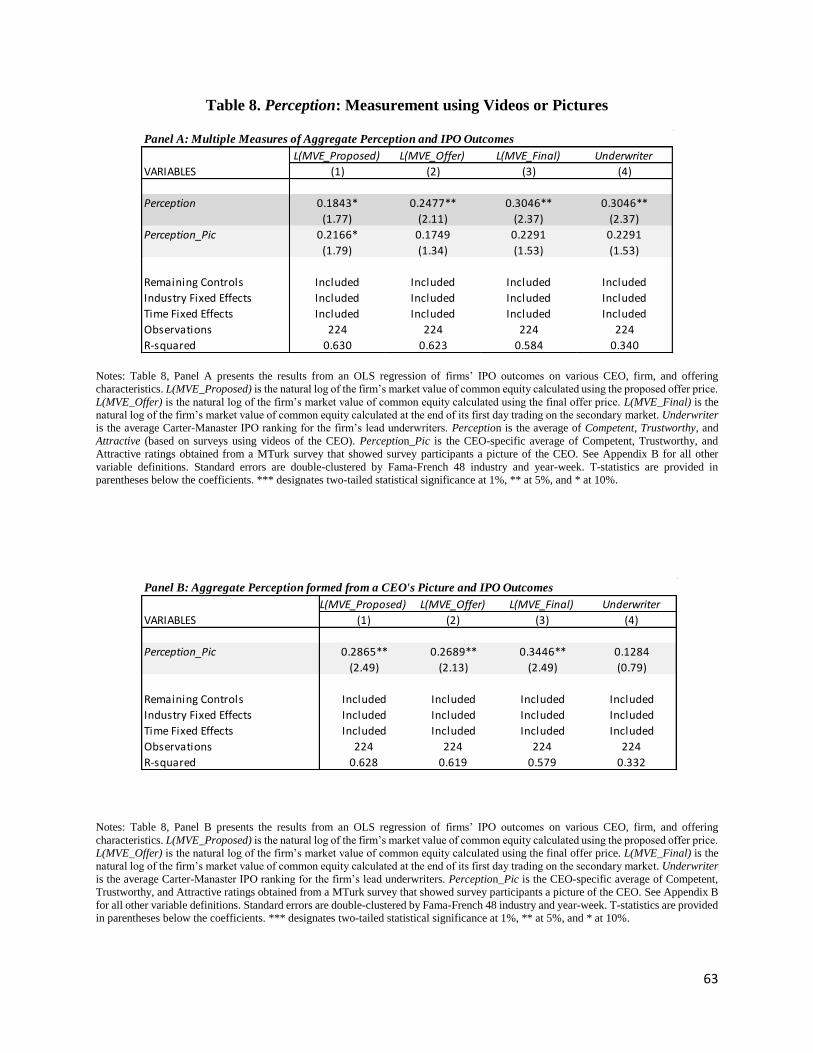
63
Table 8. Perception: Measurement using Videos or Pictures
Notes: Table 8, Panel A presents the results from an OLS regression of firms’ IPO outcomes on various CEO, firm, and offering
characteristics. L(MVE_Proposed) is the natural log of the firm’s market value of common equity calculated using the proposed offer price.
L(MVE_Offer) is the natural log of the firm’s market value of common equity calculated using the final offer price. L(MVE_Final) is the
natural log of the firm’s market value of common equity calculated at the end of its first day trading on the secondary market. Underwriter
is the average Carter-Manaster IPO ranking for the firm’s lead underwriters. Perception is the average of Competent, Trustworthy, and
Attractive (based on surveys using videos of the CEO). Perception_Pic is the CEO-specific average of Competent, Trustworthy, and
Attractive ratings obtained from a MTurk survey that showed survey participants a picture of the CEO. See Appendix B for all other
variable definitions. Standard errors are double-clustered by Fama-French 48 industry and year-week. T-statistics are provided in
parentheses below the coefficients. *** designates two-tailed statistical significance at 1%, ** at 5%, and * at 10%.
Notes: Table 8, Panel B presents the results from an OLS regression of firms’ IPO outcomes on various CEO, firm, and offering
characteristics. L(MVE_Proposed) is the natural log of the firm’s market value of common equity calculated using the proposed offer price.
L(MVE_Offer) is the natural log of the firm’s market value of common equity calculated using the final offer price. L(MVE_Final) is the
natural log of the firm’s market value of common equity calculated at the end of its first day trading on the secondary market. Underwriter
is the average Carter-Manaster IPO ranking for the firm’s lead underwriters. Perception_Pic is the CEO-specific average of Competent,
Trustworthy, and Attractive ratings obtained from a MTurk survey that showed survey participants a picture of the CEO. See Appendix B
for all other variable definitions. Standard errors are double-clustered by Fama-French 48 industry and year-week. T-statistics are provided
in parentheses below the coefficients. *** designates two-tailed statistical significance at 1%, ** at 5%, and * at 10%.
Panel A: Multiple Measures of Aggregate Perception and IPO Outcomes
L(MVE_Proposed) L(MVE_Offer) L(MVE_Final) Underwriter
VARIABLES (1) (2) (3) (4)
Perception 0.1843* 0.2477** 0.3046** 0.3046**
(1.77) (2.11) (2.37) (2.37)
Perception_Pic 0.2166* 0.1749 0.2291 0.2291
(1.79) (1.34) (1.53) (1.53)
Remaining Controls Included Included Included Included
Industry Fixed Effects Included Included Included Included
Time Fixed Effects Included Included Included Included
Observations 224 224 224 224
R-squared 0.630 0.623 0.584 0.340
Panel B: Aggregate Perception formed from a CEO's Picture and IPO Outcomes
L(MVE_Proposed) L(MVE_Offer) L(MVE_Final) Underwriter
VARIABLES (1) (2) (3) (4)
Perception_Pic 0.2865** 0.2689** 0.3446** 0.1284
(2.49) (2.13) (2.49) (0.79)
Remaining Controls Included Included Included Included
Industry Fixed Effects Included Included Included Included
Time Fixed Effects Included Included Included Included
Observations 224 224 224 224
R-squared 0.628 0.619 0.579 0.332
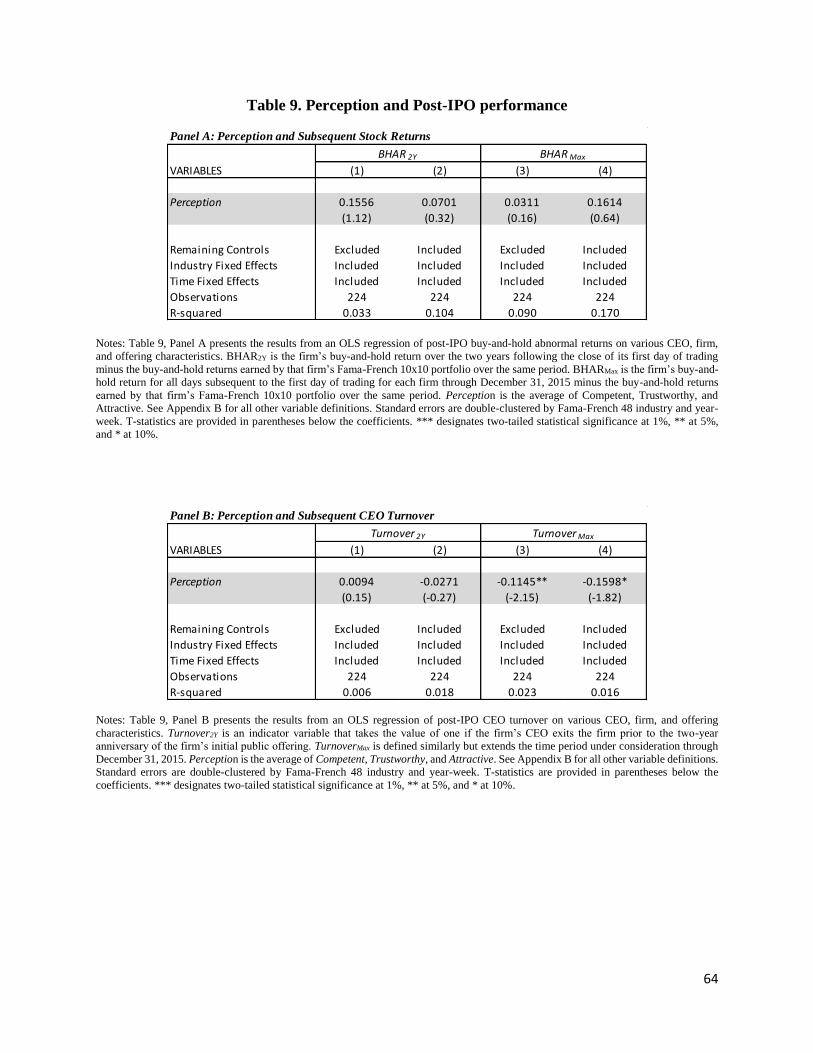
64
Table 9. Perception and Post-IPO performance
Notes: Table 9, Panel A presents the results from an OLS regression of post-IPO buy-and-hold abnormal returns on various CEO, firm,
and offering characteristics. BHAR2Y is the firm’s buy-and-hold return over the two years following the close of its first day of trading
minus the buy-and-hold returns earned by that firm’s Fama-French 10x10 portfolio over the same period. BHARMax is the firm’s buy-and-
hold return for all days subsequent to the first day of trading for each firm through December 31, 2015 minus the buy-and-hold returns
earned by that firm’s Fama-French 10x10 portfolio over the same period. Perception is the average of Competent, Trustworthy, and
Attractive. See Appendix B for all other variable definitions. Standard errors are double-clustered by Fama-French 48 industry and year-
week. T-statistics are provided in parentheses below the coefficients. *** designates two-tailed statistical significance at 1%, ** at 5%,
and * at 10%.
Notes: Table 9, Panel B presents the results from an OLS regression of post-IPO CEO turnover on various CEO, firm, and offering
characteristics. Turnover2Y is an indicator variable that takes the value of one if the firm’s CEO exits the firm prior to the two-year
anniversary of the firm’s initial public offering. TurnoverMax is defined similarly but extends the time period under consideration through
December 31, 2015. Perception is the average of Competent, Trustworthy, and Attractive. See Appendix B for all other variable definitions.
Standard errors are double-clustered by Fama-French 48 industry and year-week. T-statistics are provided in parentheses below the
coefficients. *** designates two-tailed statistical significance at 1%, ** at 5%, and * at 10%.
Panel A: Perception and Subsequent Stock Returns
VARIABLES (1) (2) (3) (4)
Perception 0.1556 0.0701 0.0311 0.1614
(1.12) (0.32) (0.16) (0.64)
Remaining Controls Excluded Included Excluded Included
Industry Fixed Effects Included Included Included Included
Time Fixed Effects Included Included Included Included
Observations 224 224 224 224
R-squared 0.033 0.104 0.090 0.170
BHAR 2Y BHAR Max
Panel B: Perception and Subsequent CEO Turnover
VARIABLES (1) (2) (3) (4)
Perception 0.0094 -0.0271 -0.1145** -0.1598*
(0.15) (-0.27) (-2.15) (-1.82)
Remaining Controls Excluded Included Excluded Included
Industry Fixed Effects Included Included Included Included
Time Fixed Effects Included Included Included Included
Observations 224 224 224 224
R-squared 0.006 0.018 0.023 0.016
Turnover 2Y Turnover Max
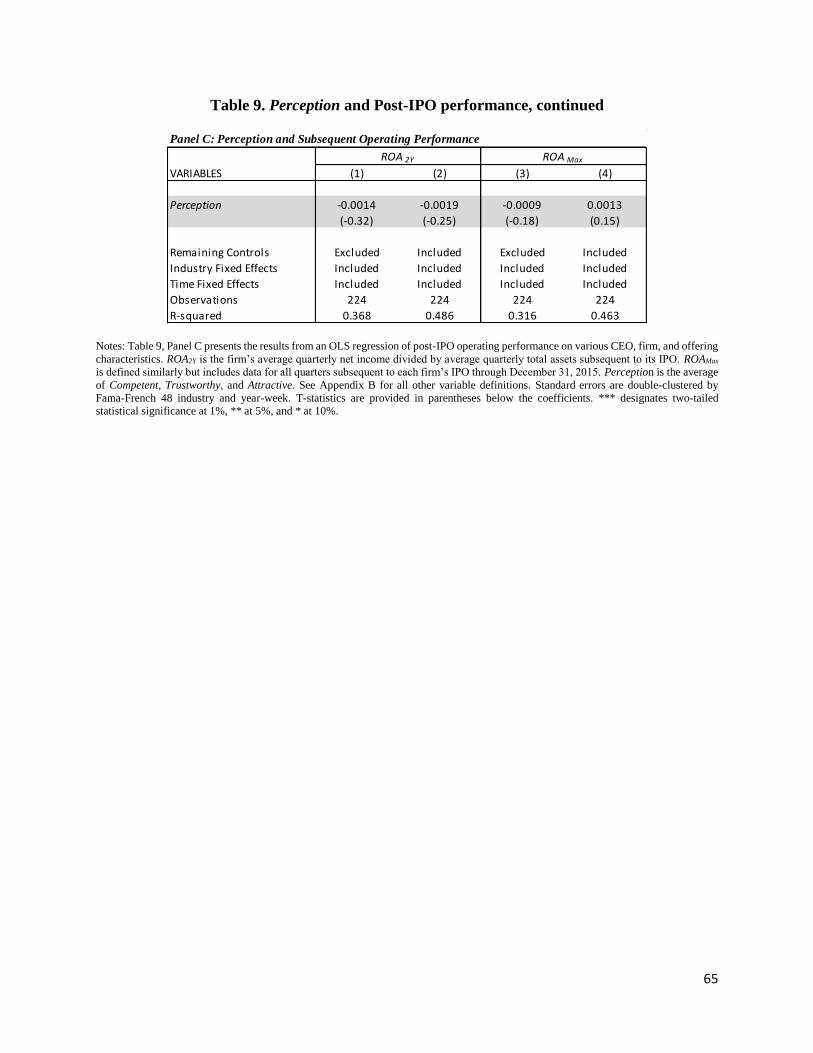
65
Table 9. Perception and Post-IPO performance, continued
Notes: Table 9, Panel C presents the results from an OLS regression of post-IPO operating performance on various CEO, firm, and offering
characteristics. ROA2Y is the firm’s average quarterly net income divided by average quarterly total assets subsequent to its IPO. ROAMax
is defined similarly but includes data for all quarters subsequent to each firm’s IPO through December 31, 2015. Perception is the average
of Competent, Trustworthy, and Attractive. See Appendix B for all other variable definitions. Standard errors are double-clustered by
Fama-French 48 industry and year-week. T-statistics are provided in parentheses below the coefficients. *** designates two-tailed
statistical significance at 1%, ** at 5%, and * at 10%.
Panel C: Perception and Subsequent Operating Performance
VARIABLES (1) (2) (3) (4)
Perception -0.0014 -0.0019 -0.0009 0.0013
(-0.32) (-0.25) (-0.18) (0.15)
Remaining Controls Excluded Included Excluded Included
Industry Fixed Effects Included Included Included Included
Time Fixed Effects Included Included Included Included
Observations 224 224 224 224
R-squared 0.368 0.486 0.316 0.463
ROA 2Y ROA Max
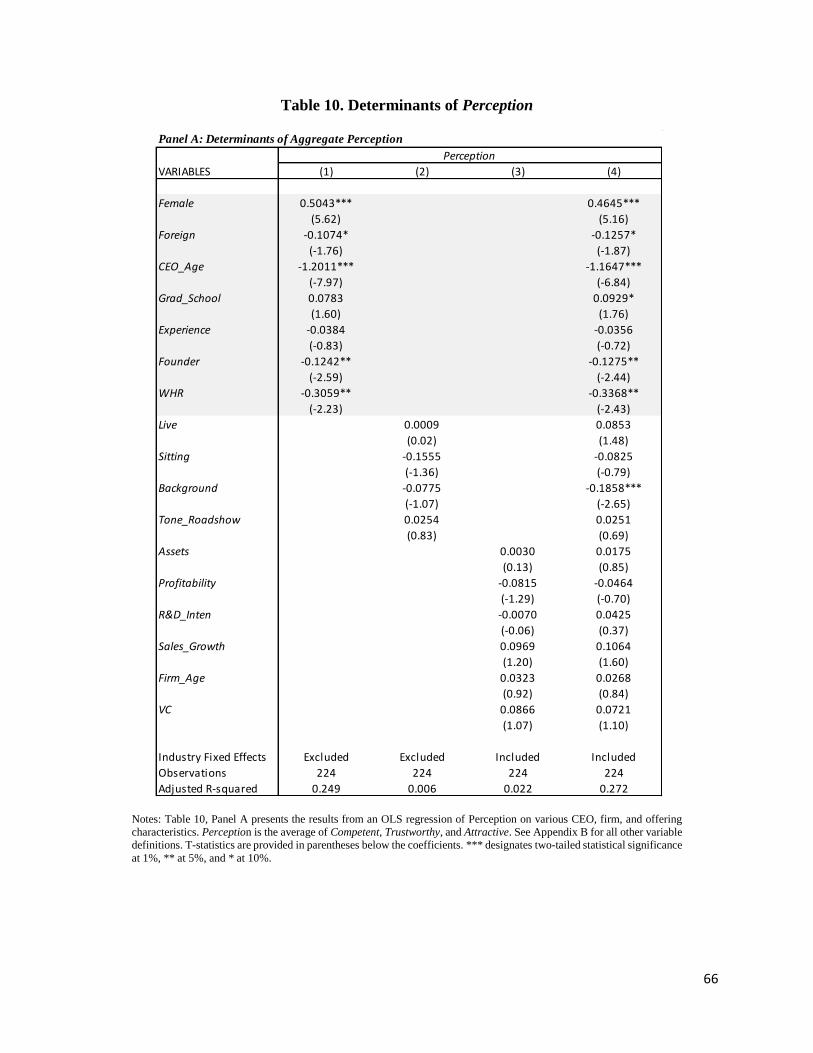
66
Table 10. Determinants of Perception
Notes: Table 10, Panel A presents the results from an OLS regression of Perception on various CEO, firm, and offering
characteristics. Perception is the average of Competent, Trustworthy, and Attractive. See Appendix B for all other variable
definitions. T-statistics are provided in parentheses below the coefficients. *** designates two-tailed statistical significance
at 1%, ** at 5%, and * at 10%.
Panel A: Determinants of Aggregate Perception
VARIABLES (1) (2) (3) (4)
Female 0.5043*** 0.4645***
(5.62) (5.16)
Foreign -0.1074* -0.1257*
(-1.76) (-1.87)
CEO_Age -1.2011*** -1.1647***
(-7.97) (-6.84)
Grad_School 0.0783 0.0929*
(1.60) (1.76)
Experience -0.0384 -0.0356
(-0.83) (-0.72)
Founder -0.1242** -0.1275**
(-2.59) (-2.44)
WHR -0.3059** -0.3368**
(-2.23) (-2.43)
Live 0.0009 0.0853
(0.02) (1.48)
Sitting -0.1555 -0.0825
(-1.36) (-0.79)
Background -0.0775 -0.1858***
(-1.07) (-2.65)
Tone_Roadshow 0.0254 0.0251
(0.83) (0.69)
Assets 0.0030 0.0175
(0.13) (0.85)
Profitability -0.0815 -0.0464
(-1.29) (-0.70)
R&D_Inten -0.0070 0.0425
(-0.06) (0.37)
Sales_Growth 0.0969 0.1064
(1.20) (1.60)
Firm_Age 0.0323 0.0268
(0.92) (0.84)
VC 0.0866 0.0721
(1.07) (1.10)
Industry Fixed Effects Excluded Excluded Included Included
Observations 224 224 224 224
Adjusted R-squared 0.249 0.006 0.022 0.272
Perception
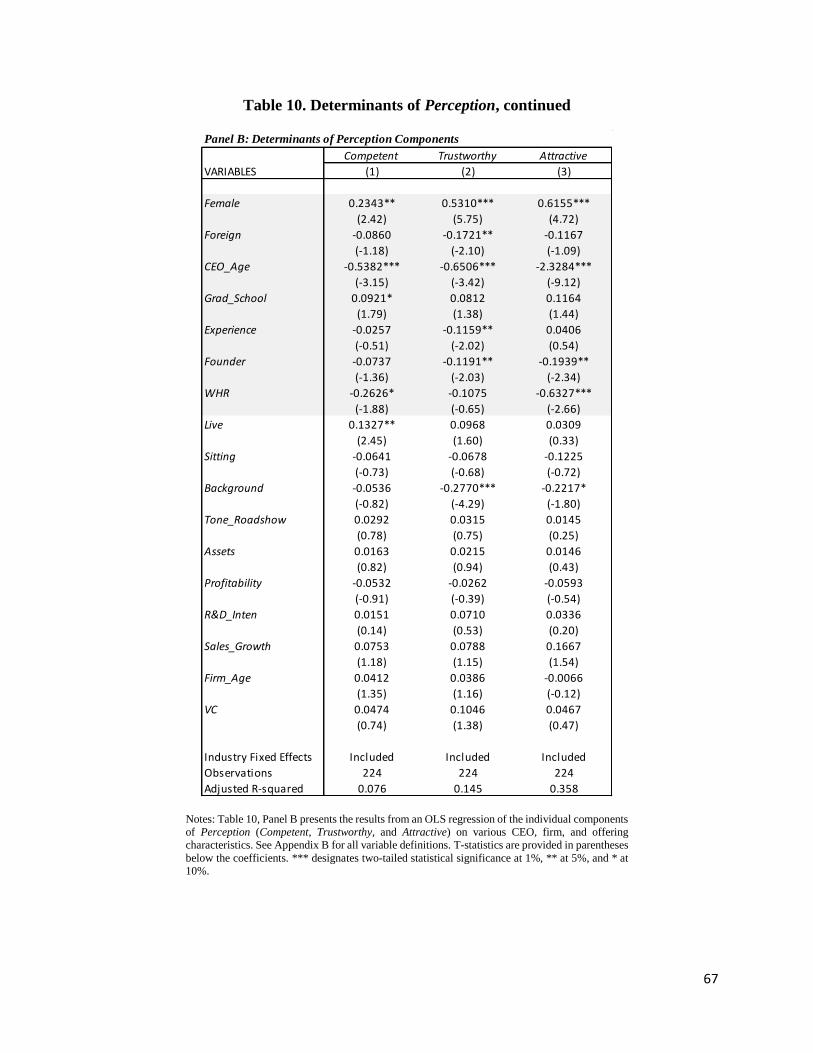
67
Table 10. Determinants of Perception, continued
Notes: Table 10, Panel B presents the results from an OLS regression of the individual components
of Perception (Competent, Trustworthy, and Attractive) on various CEO, firm, and offering
characteristics. See Appendix B for all variable definitions. T-statistics are provided in parentheses
below the coefficients. *** designates two-tailed statistical significance at 1%, ** at 5%, and * at
10%.
Panel B: Determinants of Perception Components
Competent Trustworthy Attractive
VARIABLES (1) (2) (3)
Female 0.2343** 0.5310*** 0.6155***
(2.42) (5.75) (4.72)
Foreign -0.0860 -0.1721** -0.1167
(-1.18) (-2.10) (-1.09)
CEO_Age -0.5382*** -0.6506*** -2.3284***
(-3.15) (-3.42) (-9.12)
Grad_School 0.0921* 0.0812 0.1164
(1.79) (1.38) (1.44)
Experience -0.0257 -0.1159** 0.0406
(-0.51) (-2.02) (0.54)
Founder -0.0737 -0.1191** -0.1939**
(-1.36) (-2.03) (-2.34)
WHR -0.2626* -0.1075 -0.6327***
(-1.88) (-0.65) (-2.66)
Live 0.1327** 0.0968 0.0309
(2.45) (1.60) (0.33)
Sitting -0.0641 -0.0678 -0.1225
(-0.73) (-0.68) (-0.72)
Background -0.0536 -0.2770*** -0.2217*
(-0.82) (-4.29) (-1.80)
Tone_Roadshow 0.0292 0.0315 0.0145
(0.78) (0.75) (0.25)
Assets 0.0163 0.0215 0.0146
(0.82) (0.94) (0.43)
Profitability -0.0532 -0.0262 -0.0593
(-0.91) (-0.39) (-0.54)
R&D_Inten 0.0151 0.0710 0.0336
(0.14) (0.53) (0.20)
Sales_Growth 0.0753 0.0788 0.1667
(1.18) (1.15) (1.54)
Firm_Age 0.0412 0.0386 -0.0066
(1.35) (1.16) (-0.12)
VC 0.0474 0.1046 0.0467
(0.74) (1.38) (0.47)
Industry Fixed Effects Included Included Included
Observations 224 224 224
Adjusted R-squared 0.076 0.145 0.358

68
Table 11. Additional tests
Notes: Table 11, Panel A presents the results from running Eq. (1) and (2) restricting the sample to exclude the
8 firms with female CEOs. Perception is the average of Competent, Trustworthy, and Attractive. Standard
errors are double-clustered by Fama-French 48 industry and year-week. T-statistics are provided in parentheses
below the coefficients. *** designates two-tailed statistical significance at 1%, ** at 5%, and * at 10%.
Notes: Table 11, Panel B presents the results from running Eq. (1) and (2) modified to include each of the
individual components of Perception (Competent, Trustworthy, and Attractive) in each of the regressions.
These three variables are as defined in Appendix B. Standard errors are double-clustered by Fama-French 48
industry and year-week. T-statistics are provided in parentheses below the coefficients. *** designates two-
tailed statistical significance at 1%, ** at 5%, and * at 10%.
Panel A: Primary Results Excluding Female CEOs
L(MVE_Proposed) L(MVE_Offer) L(MVE_Final) Underwriter
VARIABLES (1) (2) (3) (4)
Perception 0.2839*** 0.3368*** 0.4195*** 0.3006**
(2.95) (3.08) (3.62) (2.19)
Remaining Controls Included Included Included Included
Industry Fixed Effects Included Included Included Included
Time Fixed Effects Included Included Included Included
Observations 216 216 216 216
Adjusted R-squared 0.627 0.621 0.578 0.338
Panel B: Primary Results Including All Three Perception Components
L(MVE_Proposed) L(MVE_Offer) L(MVE_Final) Underwriter
VARIABLES (1) (2) (3) (4)
Competent 0.2729 0.2477 0.3077* 0.4779*
(1.32) (1.36) (1.74) (1.77)
Trust -0.1223 -0.1471 -0.1631 -0.1123
(-0.83) (-1.01) (-1.05) (-0.47)
Attractive 0.1263*** 0.1994*** 0.2385*** 0.0161
(2.83) (4.57) (5.05) (0.16)
Remaining Controls Included Included Included Included
Industry Fixed Effects Included Included Included Included
Time Fixed Effects Included Included Included Included
Observations 224 224 224 224
Adjusted R-squared 0.624 0.622 0.582 0.346
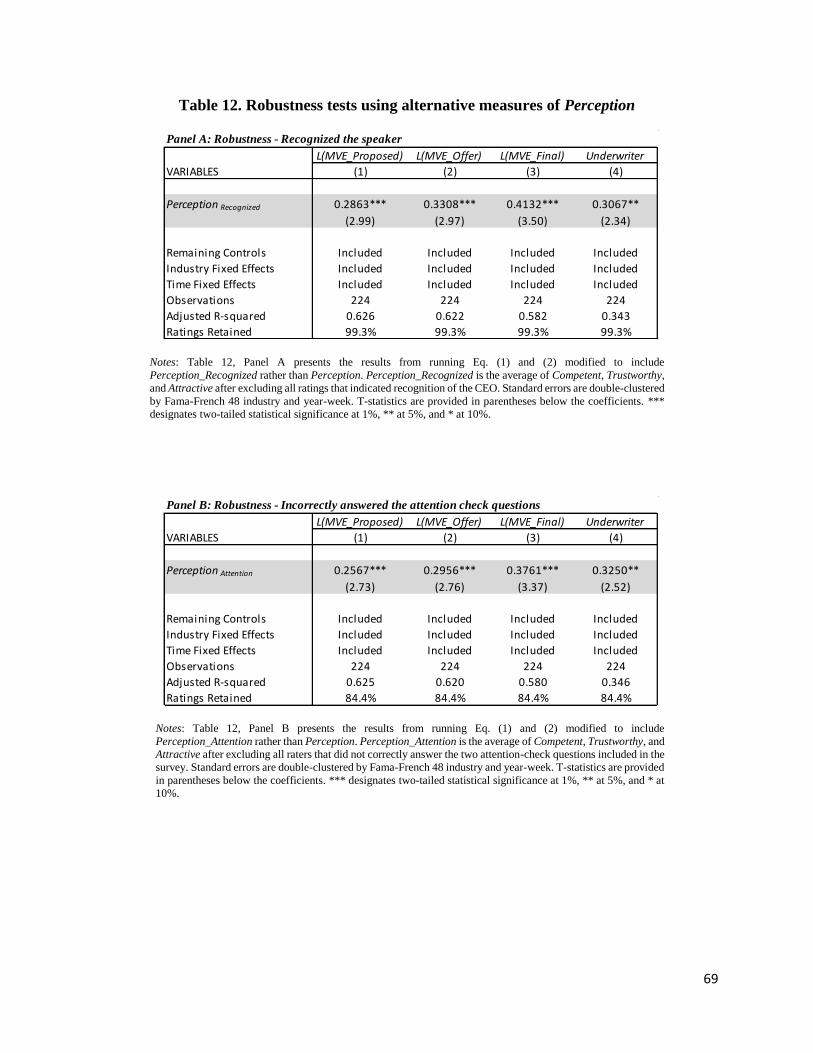
69
Table 12. Robustness tests using alternative measures of Perception
Notes: Table 12, Panel A presents the results from running Eq. (1) and (2) modified to include
Perception_Recognized rather than Perception. Perception_Recognized is the average of Competent, Trustworthy,
and Attractive after excluding all ratings that indicated recognition of the CEO. Standard errors are double-clustered
by Fama-French 48 industry and year-week. T-statistics are provided in parentheses below the coefficients. ***
designates two-tailed statistical significance at 1%, ** at 5%, and * at 10%.
Notes: Table 12, Panel B presents the results from running Eq. (1) and (2) modified to include
Perception_Attention rather than Perception. Perception_Attention is the average of Competent, Trustworthy, and
Attractive after excluding all raters that did not correctly answer the two attention-check questions included in the
survey. Standard errors are double-clustered by Fama-French 48 industry and year-week. T-statistics are provided
in parentheses below the coefficients. *** designates two-tailed statistical significance at 1%, ** at 5%, and * at
10%.
Panel A: Robustness - Recognized the speaker
L(MVE_Proposed) L(MVE_Offer) L(MVE_Final) Underwriter
VARIABLES (1) (2) (3) (4)
Perception Recognized 0.2863*** 0.3308*** 0.4132*** 0.3067**
(2.99) (2.97) (3.50) (2.34)
Remaining Controls Included Included Included Included
Industry Fixed Effects Included Included Included Included
Time Fixed Effects Included Included Included Included
Observations 224 224 224 224
Adjusted R-squared 0.626 0.622 0.582 0.343
Ratings Retained 99.3% 99.3% 99.3% 99.3%
Panel B: Robustness - Incorrectly answered the attention check questions
L(MVE_Proposed) L(MVE_Offer) L(MVE_Final) Underwriter
VARIABLES (1) (2) (3) (4)
Perception Attention 0.2567*** 0.2956*** 0.3761*** 0.3250**
(2.73) (2.76) (3.37) (2.52)
Remaining Controls Included Included Included Included
Industry Fixed Effects Included Included Included Included
Time Fixed Effects Included Included Included Included
Observations 224 224 224 224
Adjusted R-squared 0.625 0.620 0.580 0.346
Ratings Retained 84.4% 84.4% 84.4% 84.4%

70
Table 12. Robustness tests using alternative measures of Perception, continued
Notes: Table 12, Panel C presents the results from running Eq. (1) and (2) modified to include Perception_Constant
rather than Perception. Perception_Constant is the average of Competent, Trustworthy, and Attractive after
excluding all raters from MTurk workers that indicated the same value for a characteristic for each of the videos
that they rated. Standard errors are double-clustered by Fama-French 48 industry and year-week. T-statistics are
provided in parentheses below the coefficients. *** designates two-tailed statistical significance at 1%, ** at 5%,
and * at 10%.
Notes: Table 12, Panel D presents the results from running Eq. (1) and (2) modified to include
Perception_Uncorrelated rather than Perception. Perception_Uncorrelated is the average of Competent,
Trustworthy, and Attractive after excluding all raters whose responses were uncorrelated with the group average
(p-value < 0.10). Standard errors are double-clustered by Fama-French 48 industry and year-week. T-statistics
are provided in parentheses below the coefficients. *** designates two-tailed statistical significance at 1%, ** at
5%, and * at 10%.
Panel C: Robustness - Provided a constant rating
L(MVE_Proposed) L(MVE_Offer) L(MVE_Final) Underwriter
VARIABLES (1) (2) (3) (4)
Perception Constant 0.2713*** 0.3164*** 0.3927*** 0.3047**
(2.89) (2.85) (3.39) (2.35)
Remaining Controls Included Included Included Included
Industry Fixed Effects Included Included Included Included
Time Fixed Effects Included Included Included Included
Observations 224 224 224 224
Adjusted R-squared 0.626 0.621 0.581 0.344
Ratings Retained 94.2% 94.2% 94.2% 94.2%
Panel D: Robustness - Uncorrelated to the average rating
L(MVE_Proposed) L(MVE_Offer) L(MVE_Final) Underwriter
VARIABLES (1) (2) (3) (4)
Perception Uncorrelated 0.2728*** 0.3161*** 0.3914*** 0.2638**
(2.75) (2.92) (3.53) (2.19)
Remaining Controls Included Included Included Included
Industry Fixed Effects Included Included Included Included
Time Fixed Effects Included Included Included Included
Observations 224 224 224 224
Adjusted R-squared 0.626 0.622 0.582 0.341
Ratings Retained 93.3% 93.3% 93.3% 93.3%
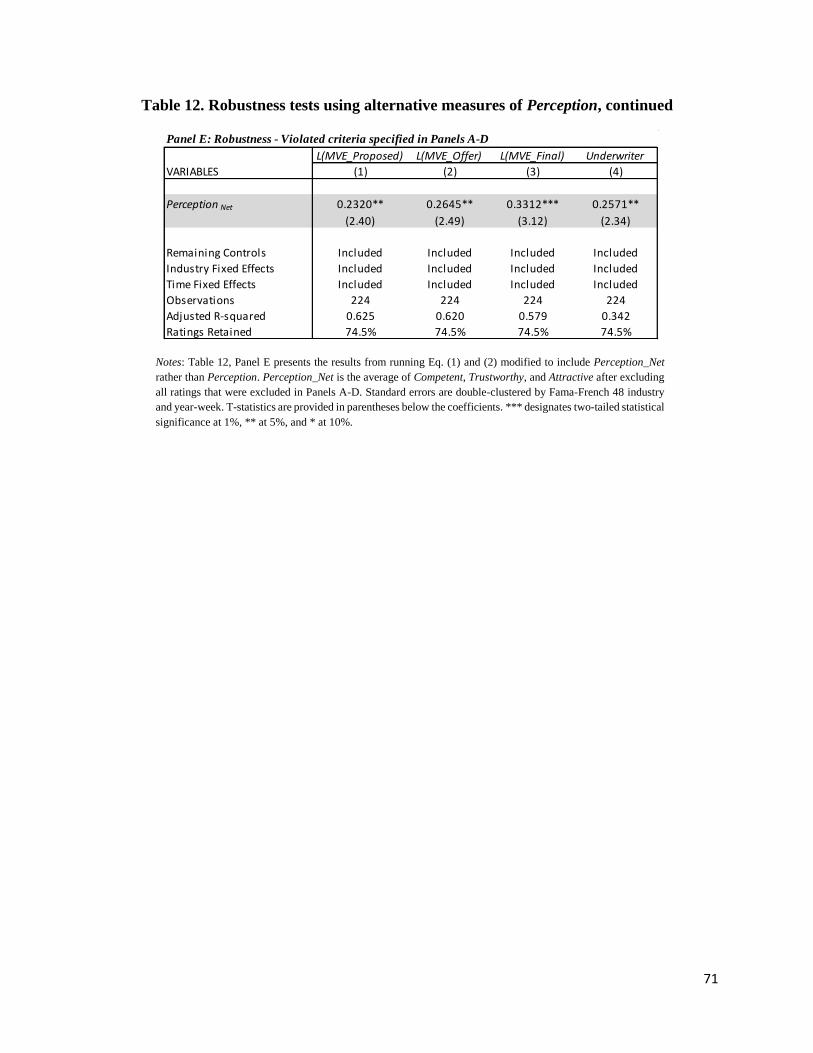
71
Table 12. Robustness tests using alternative measures of Perception, continued
Notes: Table 12, Panel E presents the results from running Eq. (1) and (2) modified to include Perception_Net
rather than Perception. Perception_Net is the average of Competent, Trustworthy, and Attractive after excluding
all ratings that were excluded in Panels A-D. Standard errors are double-clustered by Fama-French 48 industry
and year-week. T-statistics are provided in parentheses below the coefficients. *** designates two-tailed statistical
significance at 1%, ** at 5%, and * at 10%.
Panel E: Robustness - Violated criteria specified in Panels A-D
L(MVE_Proposed) L(MVE_Offer) L(MVE_Final) Underwriter
VARIABLES (1) (2) (3) (4)
Perception Net 0.2320** 0.2645** 0.3312*** 0.2571**
(2.40) (2.49) (3.12) (2.34)
Remaining Controls Included Included Included Included
Industry Fixed Effects Included Included Included Included
Time Fixed Effects Included Included Included Included
Observations 224 224 224 224
Adjusted R-squared 0.625 0.620 0.579 0.342
Ratings Retained 74.5% 74.5% 74.5% 74.5%