Embed Size (px)
Citation preview

Perception Aspects in
Underground Spaces using
Intelligent Knowledge Modeling
Proefschrift
ter verkrijging van de graad van doctor aan de Technische Universiteit Delft,
op gezag van de Rector Magnificus prof. dr. ir. J. T. Fokkema, voorzitter van het College voor Promoties,
in het openbaar te verdedigen op maandag 27 mei 2002 om 10.30 uur
door
Sanja Durmišević
bouwkundig ingenieur geboren te Sarajevo, Bosnië-Herzegovina

Dit proefschrift is goedgekeurd door de promotor: Prof. dr. ir. S. Sariyildiz Samenstelling promotiecommissie: Rector Magnificus voorzitter Prof. dr. ir. S. Sariyildiz Technische Universiteit Delft, promotor Prof. ir. E. Horvat Technische Universiteit Delft Prof. dr. M. Jenks Oxford Brookes Universiteit, UK Prof. dr. Chimay Anumba Loughborough Universiteit, UK Prof. dr. Ö. Ciftcioglu Technische Universiteit Istanbul, Turkey Prof. dr. T.J.M. Spit Universiteit Utrecht Prof. ir. H. C. Bekkering Technische Universiteit Delft Perception Aspects in Underground Spaces using Intelligent Knowledge Modeling Durmišević, Sanja Thesis Delft University of Technology - With ref. - With summary in Dutch ISBN: 90-407-2296-X Printed by Delft University Press (DUP), The Netherlands Copyright © 2002 by S. Durmišević All rights reserved. No part of this thesis may be reproduced or transmitted in any form or by any means, electronic, mechanical, photocopying, recording or otherwise, without a prior written permission of the author

to my parents
One ship drives east and the other drives west
with the selfsame winds that blow. It is the set of the sails
and not the gales which tells us the way to go…
by E. W. Wilocx, "Winds of Fait"

Contents Chapter 1 Introduction 1
1.1. Background and research problem . . . . . . . . . . . . . . . . . . . 1 1.2. Research objectives . . . . . . . . . . . . . . . . . . . . . . . . . . 3 1.3. Method . . . . . . . . . . . . . . . . . . . . . . . . . . . . . . . . 4 1.4. Outline of the thesis . . . . . . . . . . . . . . . . . . . . . . . . . . 6
Chapter 2 From spatial planing to perception of space 9
2.1. Introduction . . . . . . . . . . . . . . . . . . . . . . . . . . . . . . 9 2.2. Underground space and multiple space usage . . . . . . . . . . . . . 9 2.3. ICT development and influence on spatial planning . . . . . . . . . . 12 2.4. Architectural design data and the role of ICT in design . . . . . . . . 14 2.5. Architects and the end users . . . . . . . . . . . . . . . . . . . . . . 15 2.6. Existing models for public safety. . . . . . . . . . . . . . . . . . . . 18 2.7. Human being, built environment and social context . . . . . . . . . . 19 2.8. Environmental psychology and sociology . . . . . . . . . . . . . . 20
Chapter 3 Identification of the model parameters 25
3.1. Introduction . . . . . . . . . . . . . . . . . . . . . . . . . . . . . . 25 3.2. The variables for an assessment of spatial experience -
Research variables . . . . . . . . . . . . . . . . . . . . . . . . . . . 25 3.2.1. Dependent variables: determinants of comfort and safety . . . 26 3.2.2. Independent variables: spatial characteristics and context . . 36 3.2.3. Intervening variables: individual characteristics . . . . . . . 43
3.3. The variables for an assessment of spatial experience - Procedural variables . . . . . . . . . . . . . . . . . . . . . . . . . . 44 3.3.1. Presentation and response method . . . . . . . . . . . . . . 44 3.3.2. Reliability and validity . . . . . . . . . . . . . . . . . . . . 45
3.4. Conceptual framework . . . . . . . . . . . . . . . . . . . . . . . . 46 Chapter 4 Theoretical background on soft computing 47
4.1. Introduction . . . . . . . . . . . . . . . . . . . . . . . . . . . . . . 47 4.2. Traditional methods for data analysis . . . . . . . . . . . . . . . . . 47

4.3. Artificial Intelligence . . . . . . . . . . . . . . . . . . . . . . . . . 48 4.4. Soft computing techniques . . . . . . . . . . . . . . . . . . . . . . 49
4.4.1. Artificial neural networks . . . . . . . . . . . . . . . . . . . . 49 4.4.2. Fuzzy logic . . . . . . . . . . . . . . . . . . . . . . . . . . . 56 4.4.3. Neuro-fuzzy network: hybrid system . . . . . . . . . . . . . . 58 4.4.4. A Radial Basis Function Network (RBFN) . . . . . . . . . . . 59
4.5. Artificial intelligence and expert systems in perspective . . . . . . . 64 Chapter 5 Experimental research: Case studies and data acquisition 69
5.1. Introduction . . . . . . . . . . . . . . . . . . . . . . . . . . . . . . 69 5.2. Case Studies . . . . . . . . . . . . . . . . . . . . . . . . . . . . . . 69
5.2.1. Rijswijk station . . . . . . . . . . . . . . . . . . . . . . . . . 70 5.2.2. Wilhelminaplein . . . . . . . . . . . . . . . . . . . . . . . . 73 5.2.3. Beurs/Churchilllaan . . . . . . . . . . . . . . . . . . . . . . . 74 5.2.4. Blaak . . . . . . . . . . . . . . . . . . . . . . . . . . . . . . 76
5.3. The questionnaire . . . . . . . . . . . . . . . . . . . . . . . . . . . 78 5.3.1. Measurement scales . . . . . . . . . . . . . . . . . . . . . . 80 5.3.2. Questionnaire distribution . . . . . . . . . . . . . . . . . . . 80 5.3.3. Responses . . . . . . . . . . . . . . . . . . . . . . . . . . . 81
5.4. Respondent's characteristics . . . . . . . . . . . . . . . . . . . . . . 81 5.4.1. Age . . . . . . . . . . . . . . . . . . . . . . . . . . . . . . 81 5.4.2. Gender . . . . . . . . . . . . . . . . . . . . . . . . . . . . . 82 5.4.3. Education . . . . . . . . . . . . . . . . . . . . . . . . . . . 83 5.4.4. Frequency of visit . . . . . . . . . . . . . . . . . . . . . . . 84 5.4.5. Way of orienting . . . . . . . . . . . . . . . . . . . . . . . 85
5.5. Perception of public safety and comfort in four case studies . . . . . 86 Chapter 6 Experimental research by knowledge modeling 89
6.1. Introduction . . . . . . . . . . . . . . . . . . . . . . . . . . . . . . 89 6.2. Training, testing and optimization of network architecture . . . . . 89 6.3. Meta-knowledge . . . . . . . . . . . . . . . . . . . . . . . . . . . . 96
6.3.1. Sensitivity analysis for knowledge elicitation . . . . . . . . . . 97 6.3.2. The functional relationship between input/output variables . . 103
6.3.3. User preferences in respect to design parameters . . . . . . . 107 6.4. Obtained results and interpretations . . . . . . . . . . . . . . . . . . 112
Chapter 7 Conclusions and recommendations 119
7.1. Main findings and conclusions . . . . . . . . . . . . . . . . . . . . 119 7.2. Application of the method to different research problems . . . . . . . 122 7.3. Improvements of the existing model . . . . . . . . . . . . . . . . . 123 7.4. Extension of the model in a form of multiple experts . . . . . . . . . 123 7.5. Support for design of new facilities . . . . . . . . . . . . . . . . . . 123 7.6. Integration of artificial intelligence to a CAAD system . . . . . . . . 124

Appendix A - Questionnaire for Blaak station . . . . . . . . . . . . . . . . . . . . . . . . 127 Appendix B - Learning based data analysis - intelligent knowledge modeling . . . . . . . . 133 References 137 Summary 145 Samenvatting 149 Acknowledgments 153 About the author 155 Bibliography 157

- 1 -
CHAPTER 1
Introduction 1.1. Background and research problem Throughout the centuries, the Netherlands has been confronted with various interests that have competed for space, placing more and more pressure on scarce land. The economic growth, which characterized the last decade, caused an additional pressure not only on land due to new functional requirements but also on spatial quality. The new development strategies are very much aligned with these issues. In the Fifth Bill regarding Spatial Planning of the Netherlands (VROM, 2001), the main strategies for future developments are intensification, combination and transformation with a goal to utilize existing urban space more efficiently and effectively and at the same time provide better spatial quality. In that context, the concept of multiple space usage is accentuated, which would focus on an intensive 4-dimensional spatial exploration. In the document 'Spatial Exploration 2000' (Ruimtelijke Verkenning 2000) the underground space is recognized by policy makers as an important new 'frontier' that could provide significant contribution to future spatial requirements as an essential part of multiple space usage (VROM, 2000). In a relatively short period, underground space became an important research area. This space has the potential to improve urban environment by relieving pressure from the surface, improving mobility by expanding public transport network, reducing noise and improving air quality, leaving more green areas in the city center intact, and reducing distances by better concentration of functions and efficient use of space. This altogether should help improve quality of life in urban areas, but at the same time, these spaces should guarantee their own quality as well. In 1994, Dutch government initiated the establishment of the COB (Center for Building Underground - Centrum Ondergronds Bouwen) which would coordinate the research and knowledge accumulation related to underground space. Although among specialists there is an appreciation of what underground space could provide for densely populated urban areas, there are still reserved feelings from the public, which are related to the poor quality of these spaces. According to Horvat (Horvat, et. al., 1997), among various technical and juridical issues, one of the important potential hindering factors for underground space utilization are psychological
- 2 -
aspects, and generally negative perception of these spaces. Many realized underground projects, namely subways, resulted in poor satisfaction of these psychological aspects. In order to create better designs, diverse aspects, which are very often of a qualitative nature, should be considered in perspective with a final goal to improve quality and image of the underground space. The quality and quality assessment became one of the priorities of the Fifth Bill as well, yet the efficient methods and tools to deal with such qualitative, soft data are scarce especially in the architectural domain. Therefore, the methods and tools from other disciplines, which also deal with soft data, should be integrated in architectural design. This requires the systematization of the related aspects, and in addition, a certain tool for processing information in a meaningful way. In this respect, it is important to understand the nature of information and the ways to process it. Having all this in mind, a research proposal was submitted to the Chair "Building Underground" at the Faculty of Civil Engineering, TU Delft. A co-finance for the PhD work was provided by COB. User's perception of public safety and comfort in underground public-transport stations The COB was established in 1994 with its main goal being to stimulate the dialog between different partners involved in design and development of underground spaces in the Netherlands (COB, 2000). One of the COB tasks was to initiate the education and research program at Delft University of Technology. At the faculty of Civil Engineering in Delft, a chair 'Underground Building' was established together with the interfaculty workgroup 'Usage of Underground Space' (Gebruik Ondergrondse Ruimte - GOR). The COB/GOR provided research places, especially designated for PhD students. This research is a part of these co-financed projects, and was carried out in the Faculty of Architecture, at the Department of Technical Design and Informatics. Regarding this particular proposal, the COB/GOR was mainly interested into modeling user perception of underground spaces, especially public safety and comfort according to a given context. A context is here understood as an existing underground building, or more specifically an existing underground public-transport station. Perception of space, from a comfort and public safety viewpoint, are highly qualitative rather than exact. From COB point of view there was still a significant knowledge gap regarding user perception of underground spaces, which could form a hindrance in successful utilization of these spaces in the future. This required some reference to already designed, built and utilized underground spaces. This knowledge gap formed especially problem for designers, which did not have any systematic way in dealing with this topic and eventually made important design-decisions based on their own intuition (Hamel, 1990). This altogether determined the scope and boundaries of the research, meaning that two main questions appeared: 1. How to obtain and systematize necessary information regarding public safety and comfort in
relation to architectural data. 2. How to process that information, form and elicit knowledge from a knowledge model so that
the results could later become useful to architects. From these two questions, it becomes evident that information acquisition and knowledge modeling and elicitation of soft architectural data will play a central role in this work.

- 3 -
In the Netherlands, most publicly utilized underground spaces are in the form of underground stations used for public transport. Their present quality is far from being satisfactory and in the near future, underground public transport stations will undergo a considerable reconstruction. The relevant information on use and perception of these spaces is of great value for any future underground space development, or for the improvement of the quality of already built underground public transport spaces. For all these reasons, the underground stations are taken as case study in this research. They are analyzed from the user's point of view so that the user opinion serves as the input data, which can be later processed. 1.2. Research objectives Central role of the users for information acquisition As building underground slowly paves the way in Dutch city planning (VROM, 2000; VROM, 2001), other important issues are coming to the surface. Apart from the technical and construction aspects this ‘new and unclaimed’ territory should guarantee its own quality (COB, 1999). It should be well integrated into the total city context, and the actual quality of the underground spaces needs to be improved for the end user. The thesis deals with this second issue: the quality of underground spaces. In that respect, a user is a central figure and user’s perception of underground space represents a starting point for underground space design. To learn more about specific design issues, an inquiry of the users of these spaces is an important way to identify the problem areas in existing underground buildings. The users use and perceive that space. In order to be able to generalize and process the information, a sufficient amount of data is needed. The quality of underground space is closely related to the perception of space through the prism of various psychological aspects. It is of a sensitive nature due to negative associations that people have with such spaces (Carmody and Sterling, 1993). The information related to quality and perception is itself vague and difficult to assess. It is also important to acknowledge that there is still a significant knowledge gap in this area. This leaves users unsatisfied, yet there are no concrete solutions for architects to help bridge this gap. Therefore, the psychological aspects and their relation to the spatial characteristics of underground spaces will play an important role in this research, together with information processing and knowledge modeling of such soft data. There are also other important issues such as the constant changes within society, with different problems and questions arising. In addition, the 'architectural fashion' is changing which influences the changes in space perception over time as well. It is highly improbable that a space can be designed which would never undergo a change in the future with dynamic processes being present in a society. In that respect, a focus will be to develop a principal that can be applied to various problems and repeated over time, which requires some special kind of information processing. Information processing and knowledge modeling In the 20th century, the interest in information phenomena has drastically increased, resulting in rapid developments of information technology. Information was for the first time scientifically researched by Shannon (Shannon and Weaver, 1949). Next to these information theoretic considerations, information as such became a subject of study in various disciplines, including architecture. Architectural design involves a number of activities and considerations, due to broad knowledge that is necessary from different experts. The essence of building design is that it has

- 4 -
many linguistic qualities as well as engineering components (Lawson, 1990). As a professional, a designer has to deal with three main categories of sciences, sometimes referred to as alpha, beta and gamma sciences. Alpha sciences deal with the subjective world of beauty and morality, as expressed by the artistic, intuitive soul. Beta sciences bring in the objective world of facts and logic, represented by the rational mind. Gamma sciences consider the interest of society and culture. The integration of these sciences makes the task of the designer more complex and at the same time extraordinary and unique. This means that the designer must have the skills to integrate the various disciplines of knowledge (Sariyildiz, et. al., 2000). Presumably, the engineering considerations are easier to tackle, since the methods of exact sciences are well developed. To deal with the linguistic qualities in architectural design is not an easy task, due to the imprecision of expressions used, and since the qualities discussed, are conceptual rather than physical. Some examples of such conceptual qualities are large room, good overview, well lighted space etc. The question arises of how to model the knowledge for such conceptual qualities and how to automate that modeling process. Traditional models, such as Decision Support Systems and Expert Systems, have failed to provide adequate support to users for many reasons. One important drawback is that the development of these systems is a quite time consuming process. First, it is time consuming to gather the information and secondly, the programming part to form a consistent if-then rule base, is a time-consuming activity. Gathering information has always been and presumably will always be a time-consuming activity, but the second part, the information processing and knowledge modeling, can be significantly improved by automating this process. Secondly, the traditional systems are deductive rather then inductive. These systems are based on explicit data, information and knowledge that is stored in the system (Turban, 1998). The drawback was that these systems could not deal with cases that were not dealt with in earlier cases, and were unable to deal with the uncertainty. In the complex environment related to building process, we are confronted with uncertainty and new situations all the time. Yet, human beings are capable of existing and successfully functioning in uncertain environments. Human beings learn from previous situations, and are able to generalize, adapt and apply knowledge gained over time to resolve a new situation. Examples of traditional models are Decision Support Systems (DSS) and Expert Systems (ES) with symbolic logic. These systems are incapable of conducting the above mentioned operations that humans can perform, since they can be effective only in handling problems characterized by exact and complete representations (Kasabov, 1996). From the above, it can be stated that the main objectives are to provide answers for two earlier posed questions, that is, (a) to systematize aspects that are related to public safety and comfort, and (b) to process information and model knowledge. 1.3. Method This work is on the cutting edge between different disciplines: between architecture and Artificial Intelligence. From an architectural point of view, an interest is taken from the way that people perceive space. Here the focus is on the relationship between user and built environment. This was done by concentrating on underground stations as a built environment and perception of public safety and comfort. These two components are important in perceiving underground

- 5 -
spaces. There are also other aspects that play a role in perception, but in this work the decision was made to focus only on these two, and to show a way to deal with qualitative data in general. This work addresses the perception of public safety and comfort in underground stations, considering various determinants of these aspects. A conceptual model served as a main framework for this research. The research results of Steffen (1979, 1982), Passini (1984, 1992), Van Wegen and Van der Voordt (1991); Carmody and Sterling (1993), Korz (1998) were important input for the design of a conceptual model. In addition, the interviews were carried out with the architects who already had an experience in designing underground stations. These interviews were an important input for the conceptual model as well. Each of the architects interviewed 1 had their own approach and opinion regarding aspects related to user perception. Those interviews confirmed earlier statement given by Hamel (1990), that the architect relied mainly on their intuition when it came to solving the issues related to user associated aspects. The conceptual model served as a basis for the questionnaire design. This questionnaire was used as a method to obtain information from the users regarding different underground stations in the Netherlands. In such way, data was gathered on perception of different environments. This data formed a base for modeling. A general name for studying information acquisition, recording, organization, retrieval, display and dissemination is referred to as information processing. Knowledge is theoretical and involves practical understanding of a subject. Therefore, knowledge modeling can be defined as organizing information in some logical relationships (Slamecka, 1994). The data used for information processing is 'soft' data, representing different views of users regarding different underground space environments. Therefore, there is a need for a specific type of information processing and knowledge modeling that would enable the modeling of soft data. Traditional techniques, such as statistical methods, have been used until now for such type of research. However, there are various drawbacks to this method (Taylor, 2000). In addition, the classical computing theories and models are often found incapable of dealing with such uncertain and imprecise information. This implies that there is a need for special techniques not only to numerically represent such qualities but more importantly to treat the data in responsible and the most suitable way. These techniques are known as soft computing techniques (Zadeh, 1994a; 1994b; Rojas, 1996) which are part of Artificial Intelligence. The main characteristic of soft computing techniques is their ability to deal with imprecise and ill-defined data. The components of soft computing are considered to include fuzzy logic, artificial neural networks and genetic algorithms, evidence theory, probabilistic reasoning and many others that could 'tolerate' uncertain and imprecise information (Chen, Ying and Cai, 1999). For this particular research, in respect to information processing and knowledge modeling, two particular techniques are of interest. These are fuzzy logic and neural network theory. Fuzzy logic aims at dealing with uncertainty and imprecision of a particular kind - fuzziness in concepts, with which people usually think and reason in their decision-making and problem-solving process. With fuzzy logic, the imprecision of data can be dealt with in a similar way to how humans use such data. Artificial neural networks model to some extent the human brain, and simulates its 1 Interviews were carried out with ir. Moshé Zwarts (February 1999), ir. L.I. Vákár (April 1999), ir. Theo Fikkers (December 1998) and lately ir. Harry Volker (who was consulted on various occasions). The first three architects had an experience in designing underground spaces, which was of great value for this research. The architect, H. Volker, has been a practising architect for more than 30 years and his suggestions were an important contribution to this research, as the member of the chair TO&I.

- 6 -
functions in the form of parallel information processing. They are considered important component of Artificial Intelligence (AI). Indeed, their functionality has surprisingly strong analogies with the functionality of a human brain. With neural network it is possible to learn from the examples, or more precisely to learn from the input-output data samples (Arain, 1996). For this research, a Radial Basis Functions Network (RBFN) will be used. Therefore, considering the type of data found within this particular research, a neuro-fuzzy system that is a sort of hybrid system was used as a method in order to model the knowledge. This system combines the positive features of fuzzy logic and neural networks into one model. The problem of automated knowledge modeling can be efficiently solved using machine learning techniques. Here, the expertise of prof. dr. Özer Ciftcioglu in the field of soft computing was crucial for method integration and software development. By combining knowledge from two different disciplines, a unique tool could be developed to enable intelligent modeling of soft data needed for support during building design process. Once the knowledge is modeled, certain techniques should be employed to extrapolate knowledge from the knowledge model. Two different methods will be applied, that are complimentary to each other. Firstly, a sensitivity analysis will be conducted (Saltelli, Chan, et al. 2000) to find the relative dependency of the input variables to comfort and public safety, where the gradients of comfort and safety with respect to each variable in the input space, will be computed. Second analysis is referred to as establishing a functional relationship of one fuzzy concept to the other, which is accomplished by introducing new test cases to the knowledge model for validation. In such way, an exact function representing the relationship between fuzzy concepts can be obtained. The knowledge extracted from the model will provide a detailed picture regarding the relationships between various aspects being sought and still having in mind the presence and existence of other aspects in that model. A characteristic of the knowledge model is that it deals with fuzzy information and therefore provides support in a form of fuzzy outputs. The model provides the designer information regarding hierarchical order of aspects within the whole data structure. This is something that for a designer is difficult to determine on his own. 1.4. Outline of the thesis In Chapter 2, the importance of underground space utilization in future is shown in the light of the latest developments in Dutch spatial planning. The necessity for utilization of these spaces requires additional research in various fields, including architecture, to improve design quality. In order to identify the drawbacks of the existing designs it is necessary to reflect on the perception of these spaces from the user's point of view, and in such a way to involve the users in the design process. Chapter 3 provides a theoretical background regarding the aspects of public safety and comfort wherein the dependent and independent variables related to underground spaces are identified. In this chapter the relationship between spatial and psychological aspects is considered in order to develop a tentative relationship diagram and a conceptual framework.

- 7 -
The information to be processed is qualitative, rather than exact, which requires employment of special techniques and tools to be able to deal with such information. In Chapter 4, an overview of Neural Networks and Fuzzy Logic is given together with insight into the specific type of knowledge model used in this research, the Radial Basis Function Networks. The orthogonal least squares (OLS) training algorithm is introduced as a technique used for machine learning. The chapter covers also the specific issues related to knowledge modeling explaining the limitations of traditional Decision Support Systems and Expert Systems. Once the theoretical background on both user perception and techniques to be employed is provided it is possible to conduct the experimental part of the research, which is explained in Chapter 5. For that purpose the case studies are selected (Rijswijk, Blaak, Beurs and Wilhelminaplein stations) and explained, followed by questionnaire development, which was based on the earlier developed conceptual framework. The questionnaires served as a main source of data compilation. The data obtained from the questionnaires is actually a knowledge base, which needs to be further modeled. In Chapter 6, experiments are explained necessary for selecting the most suitable model. Once the model is established, certain techniques are needed to elicit the knowledge from the knowledge model. In that respect, the sensitivity analysis is explained as a method for knowledge elicitation as well as a special technique used to define a dependency function between various fuzzy concepts, as fuzzy variables. Interpretation of the results is given at the end of this chapter. Finally, Chapter 7 provides the conclusions and recommendations for future research, which are based on the obtained results.

- 8 -
- 9 -
CHAPTER 2
From spatial planing to perception of space 2.1. Introduction Throughout its planning history, the Netherlands is known as one of the countries that explored extreme frontiers in order to provide additional space. In that process, the development and utilization of new technologies have played an important role. Technological innovation and invention influenced the changes at social, economic, political and cultural levels of society. This influence was noticeable in daily living, working, recreating, shopping and entertainment, so that the customs and requirements were changing as well (Sariyildiz and Beheshti, 2001). Many decades ago land was taken from the sea and techniques for that have been improving ever since. There is a Dutch saying “God created the world, but the Dutch created the Netherlands” relating to the constant fight with water and the poor soil conditions found in the Netherlands. Latest developments in Dutch spatial planning proves that the search for alternative territories did not stop upon winning land from the sea but that the frontiers were pushed even further. These are the 'invisible' frontiers of underground space and Information and Communication Technology (ICT) (VROM, 2001). In a way, these two processes are complimentary to each other especially in the area of mobility. While underground space can take care of physical mobility and makes transportation more efficient by improving infra-structure, at the same time ICT contributes to virtual mobility through info-structure and by doing so can have an influence on physical mobility as well. It is highly improbable that the increase in virtual mobility will lead to a decrease of physical mobility, but it may influence the nature and duration of travel (VROM- raad, 2001). To explain the position of underground space within the context of Dutch planning it is of special interest to look at development during the last decade. In addition, the positioning of this work in relation to ICT will be further explained. Further to this, the relevant issues related to architectural data and user input in design will be explained in perspective. 2.2. Underground space and multiple space usage In late 80's and early 90's, in relation to spatial planning of the Netherlands, the idea of the Randstad was born. It became evident that it was impossible to solve spatial problems and need

- 10 -
for new territories only locally and with ad hoc solutions. It became clear that the problem should be considered from a wider point of view having in mind the future development of a larger area. Randstad is an area that includes four major cities, Amsterdam, Den Haag, Rotterdam and Utrecht. These cities were supposed to be a part of one larger area, in which each one would maintain their own identity. A renewal of these cities was inevitable and some alternative solutions were needed to solve problems with increasing population and new functions that needed to be accommodated as well. This renewal came also as a wish to maintain and improve the quality of life in urban areas. In the past, some of the canals were filled and replaced by streets in order to expand a city’s traffic. Such interventions totally changed the atmosphere of streets, by submitting space to cars. At that time, it seemed to solve some temporary problems but in the end, such actions deteriorated the quality of life in cities. In search for new territories, the idea of utilizing underground space slowly came to the surface. It was seen as one possibility to solve not only the traffic problems but also to accommodate other public functions vital for a serviceable, modern city. In such way, historical city centers can be preserved and the pressure from the surface relieved. At this point, the Ministry of Housing, Spatial Planning and Environment (Ministerie van Volkshuisvesting, Ruimtelijke Ordening en Milieubeheer - VROM) made a decision to stimulate research in the area of building underground. In first instance, there was a need to get a grip on techniques and construction methods, but also on design aspects and the quality of underground spaces. For that reason, a Center for Building Underground (Centrum Ondergronds Bouwen - COB) was established in 1994 as a central body that would direct and cluster the research in that area. Within COB, six clusters were established (COB, 2000): •= Spatial design •= Planning and governmental instruments •= Perception and safety •= Natural and environmental aspects •= Technology •= Economy and processes Various research projects are still being initiated within these clusters. Another COB task was to initiate education and research program at Delft University of Technology. At the faculty of Civil Engineering in Delft, a chair 'Underground Building' was established in 1995 together with the interfaculty workgroup 'Usage of Underground Space' (Gebruik Ondergrondse Ruimte - GOR). In a document "A New Map Deepen" (COB, 1997) three main advantages for building underground in urban areas were given: •= More efficient use of space - by placing some functions underground, additional space
becomes available above ground for other functions. The main principle here is the multiple usage of space where functions are 'piled' on top of each other.
•= Strengthening spatial functionality - very often a traffic infrastructure is a cause of unnatural segregation of urban areas and is seen as physical, visual and aesthetic barriers. Another important issue is preservation of historical heritage.
•= Improving quality of the surrounding - by placing some parts of the infrastructure underground, environmental quality in the surrounding area would be improved, by reducing noise, improving air quality and connecting two city parts. This was the case with the underground train station at Rijswijk (see Chapter 5, Section 5.2.1.).
- 11 -
In short, utilizing underground space would create a potential to improve our urban environment by relieving pressure from the surface, developing better public transport networks between cities, reducing noise and improving air quality, and leaving more green areas in city center intact. Following these developments, in 1999 the Expertise Network Multiple Space Usage (Expertisenetwerk Meervoudig Ruimtegebruik - EMR) was established. The main aspects understood under a term multiple space usage are (Lagendijk and Wisserhof, 1999): 1. Intensification of space usage (improving the efficiency of space usage) 2. Intertwining space usage (usage of the same space by several functions) 3. Third dimension of space usage (usage of underground as well as above ground space) 4. Fourth dimension of space usage (subsequent usage of the same space by several functions) In short, multiple space usage can be defined as "accomplishing more functions in a given space and given time" (Priemus, et. al., 2000). This strengthens the position of underground space within a far larger scope. From all of the above, it is evident that the last decade represents the flourishing years for underground space research and development in the Netherlands which continues to the present time. In the document 'Spatial Exploration 2001' (Ruimtelijke Verkenning 2000) the underground is recognized by policy makers as a promised land and a 'final frontier' (VROM, 2000). In the Fifth Bill regarding Spatial Planning (VROM, 2001; 5de Nota Ruimtelijke Ordening), the government set as a goal the development of six urban networks of similar size. These networks are urbanized areas that form a network comprised of larger and smaller compact cities, each retaining their own characteristics within that network. This decision requires a different sort of planning than was done up until now. One of these urban networks is the Randstad, which now has evolved to a type of Delta-metropolis and is characterized by the highest density. With its size and population, Delta-metropolis can be compared to other large urban areas in Europe and the rest of the world. The region between and around the cities of Amsterdam, Leiden, Den Haag, Rotterdam, Gouda, Utrecht, Amersfoort and Almere is referred to as the Delta-metropolis. The Delta-metropolis is the most densely populated part of the Netherlands. It covers an area of around 60 x 80 km (4800 km2) where altogether 5 million people live and work. It has a very high population density of more than 1000 inhabitants per km2. This is the main reason it is referred to as a metropolis. It is also a region that lies in the delta of Rijn, Maas and Schelde rivers. This explains the name delta. In the same Bill, the amount of functions expressed in m2 and required for future development were given as well (VROM, 2001). These requirements clearly show that the pressure on the urban areas increases and therefore the necessity to reconsider and restructure cities becomes greater. In this Bill, three main intervention strategies were proposed: - intensification - combination - transformation These strategies should lead to more efficient space usage so that new/extra functions can be incorporated. In that respect, the multiple space usage, including building underground as an important part of it, is indicated by the policy makers as important options in future planning. An example of these three strategies is the Master Plan Rotterdam CS, where an existing interchange station is being developed into a mobility hub with high concentration of recreational activities, business and apartments (Alsop Architects, 2001). The important station locations in Delta- metropolis but also in other areas are seen as generators of activities. It is an efficient way to

- 12 -
change from one means of transport to the other and by providing additional functions that are integrated in the transportation node, space can be used efficiently in numerous ways. The development of mobility hubs (knooppunt) is also a priority for city renewal (Bureau Regio Randstad, 2001). 2.3. ICT development and influence on spatial planning The present time can be described as the age of information or moreover, it is an era of communication and information/knowledge exchange. Today it is difficult to imagine life without tools that make this feasible, but a long journey to get to this point was required. Information footprints of different civilizations are everywhere to be found. The first sketches on cave walls tried to hand over information and knowledge from their time. Thanks to these drawings and archaeological findings, we can understand history and the ways our contemporary world is being shaped. That was perhaps, in the most abstract way, the very beginning of ICT. Later, written text was inscribed on stones and walls, followed by writings on papyrus and paper. With the development of printing technology, books and newspapers were published, followed by the invention of radio, television, telephones and fax machines. In short, information started to globalize. Development of computer technology happened and a real breakthrough in ICT was the development of World Wide Web (WWW) that revolutionized the computer and communication. These previous developments made it feasible to integrate various capabilities so that the WWW became a broadcasting medium, a mechanism for information dissemination, and a medium for collaboration and interaction between individuals and their computers, without regard to geographic location. Exchanging and obtaining information happens within a few seconds so that the actual physical place is of less importance. (Mitchel, 1995; Sariyildiz and Ciftcioglu, 1998; Leiner, et. al., 2000). Dependency upon information has become very high and the idea of being able to gain information from homes, or places other than offices, may influence the development of new concepts for urban development. This means that working and home environments will be influenced. Teleworking, video-conferencing, distance learning and “virtual offices, commerce and universities” are becoming more common. It is self-evident that ICT already has an influence on transportation and therefore on mobility as well. In the main ports, such technology is applied to improve the logic of the transport sector. This has in a way an impact on mobility and environment. It may be expected that in a near future, transport of goods will be automatically operated by computer systems, and preferably that will be done through underground tunnels. Realization of such concepts is only possible due to technological developments of both tunnel construction as well as control and automatically operated systems. According to VROM-raad (2001), some main areas where the changes can be expected due to the developments and implementation of the ICT, are living and working environment, spatial planning, environment and mobility. Other areas can be influenced as well, such as for example education, recreation & free-time entertainment, medical care, etc (Durmisevic and Sariyildiz, 1999). Bringing changes into above mentioned areas will influence our daily life in different ways and therefore it can be expected that the organization of our cities will undergo transformations as well.

- 13 -
Up until now it has been shown that underground space and ICT have common ground, especially when it comes to mobility issues and dealing with shortage of space. In summary, underground space improves physical mobility while ICT stimulates virtual mobility. This is illustrated for example with teleworking or distance learning. In order to position this work in relation to ICT, it is necessary to clearly define the terms data, information and knowledge which are sometimes loosely and interchangeably used. In basic terms, they can be defined as follows: •= Data. Basic elements of information which do not convey any specific meaning •= Information. Information is a set of data that has been organized so that it conveys meaning •= Knowledge. Knowledge consists of information items that are organized and processed to
convey accumulated learning and expertise as they apply to a current problem or activity (Turban and Aronson, 1998).
This term ICT is still evolving. According to VROM Raad (2001) it is a technology used to process and transfer information in a dematerialized form. The main difficulty with this term rises if one time there is more accent on information transfer, and other times on information processing. Also, very often there is confusion whether the ICT deals only with information in a digital form or whether it involves any type of information communication. According to Dolmans and Lourens (2001), ICT includes all techniques that make it possible to transfer information in electronic form made possible by developments in computer technology. Because of these difficulties, other terms are emerging as well, to indicate their focus and the scope within the ICT. One example is ICTT (Information Communication Transaction Technology) in which the term transaction involves the ordering, buying and paying for goods over the Internet. Another example is IC2T (Information Communication Computing Technology) which focuses on future developments of ICT mainly by means of computers and other inventions in computing, to give focus to the digital character of information. This is to be understood as any sort of dematerialized information that is being transferred by means of computers. Yet another example is ICKT (Information Communication Knowledge Technology) where the focus is not only on ICT but also on knowledge technology (Sariyildiz, 2001). To avoid misunderstandings, there is a need for clear distinction of the sub-fields within ICT. One would be Information Technology with a focus on information processing and knowledge modeling. That would include all techniques, which deal with electronic processing of information and knowledge. Here one may think of using conventional computing techniques or advanced soft computing techniques. Another sub-field of ICT is Communication Technology that focuses more on communication of information and knowledge, between different parties. This involves activities on the WWW for example e-commerce or distance learning, including developments in mobile and wireless technology. This implies that totally different techniques are needed for 'information processing and knowledge technology' than for 'information/knowledge communication technology'. Therefore, under ICT, two technologies can be understood, complimentary to each other but comprising different techniques.

- 14 -
Figure 1: Two different domains within Information and Communication Technology
In that respect, this work is primarily related to Information Technology and with development of additional tools may become a part of Communication Technology as well. However, this will not be the scope of this research. Having placed the research within a broader scope, the following step is to focus on the research problems themselves. In that context, it is necessary to state difficulties regarding architectural data, and to explore the possibility of employing Information Technology for dealing in particular with qualitative issues of underground spaces. 2.4. Architectural design data and a role of ICT in design An architectural design involves a number of activities and considerations due to broad scope of knowledge that is necessary from different experts. In that respect, the ICT tools can have an important role in architectural design process. The essence of architectural design is that it has many linguistic qualities, as well as the engineering components. Similar statements are given by Lawson (1990) who states that architecture involves elements that may seem both precise and nebulous, systematic and chaotic, mathematical and imaginative. Architecture is a mixture of art and technique (Sariyildiz, 1991). This implies that the architect deals with not only engineering aspects that can be easily quantified and processed, but also deals with aesthetic issues that are qualitative and therefore difficult to estimate and represent numerically. In architectural design process, one has to establish certain relations among the design information in advance, to make design with a sound rationale. The main difficulty at this point is that such relationships may not be determined because of various reasons. One example may be the vagueness of the architectural design data due to their linguistic qualities. In such cases, these 'qualitative quantities' are expressed in linguistic terms, which should somehow be expressed in numerical form, in order to treat such soft data by powerful and conclusive numerical analysis methods (Durmisevic, et. al., 2001a). Another example may be the vaguely defined design qualities, which should be gradually fixed during the actual implementation, in order to maintain the flexibility of the design for architectural, real-time decision-making. To deal with such flexible design information is not an easy task since the majority of the existing architectural design aids, so-called decision support systems, are based on the provision of concrete design input information, and well-defined goals. Here the problem is not only the initial fuzziness of
Information Technology
Communication Technology
Information and Communication
Technology
To process information and model/elicit the knowledge
To communicate information and knowledge between parties
- 15 -
the information but also the desired relevancy among all the pieces of information given. Presently, to determine the existence of such a relevancy is more or less a matter of architectural subjective judgement, rather than a systematic non-subjective decision-making based on existing design information. In this respect, the invocation of certain design tools dealing with such fuzzy information is essential for enhanced design decisions. According to Sariyildiz (2001), the ICT applications in the building sector can be categorized as a tool, medium and in the near future, a partner. In the design environment, computers were first put into a practice as a tool or an instrument used to produce drawings or represent ideas through animation and simulation of virtual environments. As a tool they were mainly used for 3D modeling, Computer Aided Drafting as a replacement of a drawing table, presentations, etc. During the last decade, computers have taken another role as a medium, mainly due to the widespread use of the Internet and the development of the Web (Schmitt 1996). This stimulated communication between different parties but the task assigned to computers has more or less remained the same. As a medium they are used for communication, interactive visualization (such as virtual reality and cyber-space), collaborative and concurrent engineering, cooperative engineering, CSCW (Computer Supported Collaborative Work), CAD-CAM (Computer Aided Design Manufacturing), CAE (Computer Aided Engineering), EEM (Enterprise Engineering Management), etc. In the very near future, yet another shift can be expected when it comes to the computer's role in the design and building process as a partner (Schmitt, 1999). With present advances of ICT, especially the latest developments of Artificial Intelligence and knowledge technology, increasingly computers will take the role of partner. As a partner they can be used for knowledge integration and advanced modeling (with employment of ANN-Artificial Neural Networks, fuzzy logic, intelligent agents, genetic algorithms, grammars, etc.), IDSS (Intelligent Decision Support Systems), intelligent management, etc. This research belongs to the category of applying ICT as a partner. In the near future, it can be expected that such developments will become more common in the building sector. 2.5. Architects and the end users Architectural design process is becoming more complex, not only in its dimensionality and scope with various partners involved but also in the related infrastructure and communication. In building processes, various partners are involved, such as governmental institutions, urban planners, architects, constructors, technical advisors and users where each one of them has certain requirements or knowledge expertise. Among all partners involved, the communication with the users is the least proficient. The distance between a designer and an end user became greater over time. This is not so difficult to understand, since there is a greater number of buildings designed for more end-users than ever before, for example, huge apartment complexes, hospitals, theaters, stations and mobility hubs. The complexity of building increases and the related building information exponentially grows. In that respect, it is difficult for an architect to consider the needs of end users since the contact with the end user is almost nil. Still, this fact should not be justification of the 'negligence' of user aspects during design process. In a sense the approach lacks a systematic nature and is highly subjective. It is possible to expand the knowledge on user

- 16 -
preferences and update this knowledge in the course of time. Users preferences should be a part of architectural design data. At this moment, it is interesting to look at the results of Hamel's research who developed a descriptive psychological model of the architectural design process, which shows how architects actually design (Hamel, 1990). He classified five main tasks embraced in architectural design being gathering information, decomposing problems, solving partial problems, integrating partial solutions and shaping the result into a design. Decomposition of problems is a consequence of immense data and diversity of design problems, as earlier mentioned. His research provided some valuable information regarding the architectural design and the architects' way of thinking as well as the type of information sources that architects consult in order to make a final decision. Some results of the research are given in the Table 1, where the topics that architects deal with are stated together with estimated percentage that they spend for each specific topic. It is remarkable that 66.5% of a design activity is related to the functional aspects (items 1, 10, 11 and 12). The aspects related to users and techniques score quite little in comparison to the functional aspects. Especially for underground spaces, we can say that the user’s experience is somewhat more sensitive due to specific conditions and limitations of these spaces. This is explained more in detail in (Carmody and Sterling, 1993). Therefore, more attention should be paid to user requirements. Table 1: Topics that architect deals with during design process (Hamel, 1990, p.143/4)
Topic % 1. situation: placement, urban-planning aspects, demographic data etc.
38.3
2. the measurements of the situation 4.0 3. traffic 3.5 4. pedestrian/traffic paths and connection with the situation
3.0
5. light/shadow analysis 0.5 6. regarding the users: age, behavior 4.9 7. available budget 1.4 8. number of users 2.1 9. management and exploitation 2.1 10. functions 11.7 11. criteria for functions, characteristics of the functions
8.2
12. dimensions for the functions 8.3 13. regarding the use of the building 5.6 14. regarding the exterior appearance 3.4 15. regarding the technique 0.7 16. norms and regulations 0.6 17. regarding the use of the building 1.2 18. regarding the technique 0.5
Data regarding the situation
Data regarding the assignment
Assignment requirements
General data and requirements

- 17 -
Another important conclusion is related to the sources of information that architects consider for those different topics. Hamel’s research showed that architects, when it comes to user oriented topics (6, 13, and 17), relied first, on their own knowledge, personal estimations and experience. The information about the use of a building and the users is almost never supplemented with other sources, such as the literature, communication with the client and communication with an expert. It is still not clear why that is so, and Hamel gives some possible interpretations. It can be that architects have confidence in their own knowledge. They can also think that this knowledge is not available on the scientific level. Alternatively, it is possible that the knowledge is available but not in a form that is accessible to them. These are all possible interpretations, but it does indicate that there is no systematic approach to the topic. Leaving this area open for ones own interpretation makes it highly vulnerable to the subjectivity of a designer. Even though design is a highly subjective process, and is based on experience, intelligence and creativity of a designer, still, certain input information should be systematically considered and included in that process (Lawson, 1990). If we consider a design in the broadest sense as a creation of objects that satisfy particular requirements following a given set of constraints (Kasabov, 1996), then the architectural design data can be defined as any type of data that designers need to consider, in order to finalize their design and fulfil requirements. In that respect the data can be related to users and their requirements, or it can refer to specific technical issues such as positioning of installations, or the amount and positioning of light sources, or related to energy efficiency and so on. The amount of data is immense. This indicates the diversity of design issues that confront a designer. Designers can learn from the successes and failures of previous designs if enough information is available from these designs. It should not be forgotten that design evolves according to the requirements of specific times and cultures, available technology, existing knowledge and the personal ability of a designer to combine all these features into a new, evolved design. This implies that the designer should be able to derive from each previous design some qualitative values, especially with respect to customer approval regarding the building's quality, so to assure a successful design. The specific knowledge that was modeled in this work is related to user perception of underground spaces with the focus on public safety and comfort. An underground space, or any type of building, can be viewed as a delivered product to a customer. The customer is the final arbiter of a product in the sense of building performance and in terms of its functionality and their comfort while in that building. In underground public-transport stations, a customer may be a short-time visitor or an employee. This research deals only with the perception of public safety and comfort of short-time visitors. To deliver the most suitable product, a designer should know much about customer's needs and preferences when it comes to specific design issues and spatial context in which they are designng. Knowing more about such issues would create a base that would lead first to systematic learning and second to innovation and teaching. In this way, the overall performance of a designer or an architectural office in general could be improved. Such information on buildings is up until now quite poorly recorded or if recorded is not in the form of general public domain knowledge. Therefore, each designer would not be able to acquire it at any time. If it were recorded in the past, covering various periods, than time is an important component and could be added to the information to be processed. This may be one of the important reasons that there is still a knowledge gap related to users and their perception of underground spaces.

- 18 -
The focus of this research is not on design process itself but on modeling the knowledge related to public safety and comfort, and indicating the possibility to learn from examples. This knowledge modeling can be done by ICT techniques, which is a part of this research. 2.6. Existing models for public safety It is important to note that there are already some models developed as a check-list regarding built environment and individual's perception of it. One example is a model developed by Van Wegen and Van der Voordt (1991) in which the authors clearly define aspects relevant for public safety, focusing on architectural and urban planning aspects. This model focuses mainly on above ground environments and provides a checklist for designers. Another example is the RISC model (Spatial, Institutional, Social and Crime - Ruimtelijk, Institutioneel, Sociaal, Criminogen). The RISC model distinguishes four types of factors that, individually and together, have an influence on public safety (Figure 2). The four types are (Hobbelen, et. al., 2000): •= Spatial factors: the problems related to built environment such as lighting, dark areas, spatial
degradation, etc. •= Institutional factors: the organizations/persons that stimulate feeling of safety such as
different types of surveillance, expected help etc. •= Social factors: the presence and behavior of other people determines the social environment •= Crime incentive factors: the factors that stimulate criminality by providing an opportunity to
commit a crime
Figure 2: The RISC model All these models are important for understanding public safety and in many aspects, they overlap considerably. However, the weak point in all of them is the actual modeling of relationships within each category when all aspects are considered at the same time. They are unable to provide information regarding aspects that are the most relevant in a particular environment. Another important issue is that none of these models makes a distinction between public safety and comfort. These two aspects overlap, making it almost impossible to talk about one without considering the other one. It is important to be able to define to which extent the aspects are related either to public safety or to comfort. In order to obtain a better understanding regarding public safety and comfort, all RISC-factors need to be considered to the same extent. It is a formidable task and therefore a decision was made to focus mainly on spatial aspects in order to
spatial factors institutional factors
social factors crime incentive factors
PUBLIC SAFETY
- 19 -
develop a generic method to model the interrelationships. In that respect, it is of interest to find relationships between main spatial characteristics of a built environment and the end user of that environment. In that process, overlap between categories is inevitable, since no sharp boundaries exist between categories. Architects and end users eventually communicate through space, since one designs it, and the other experiences it. End users react differently to different spaces and may prefer one space to the other within the same social context. The intention with this work is to try to capture that communication. It is important to understand the position of both actors in that communication process. The end user, according to certain stimuli, acts and reacts on the environment in respect to a specific time and social context. The architect tries to integrate in the design all requirements and 'targets' the design for end users. That is the most desirable situation but as explained earlier, there is a knowledge gap regarding users perception of spaces. Therefore, it becomes a difficult task for architects to include that in their design. In addition, constant changes within society bring changes of requirements over time. In order to model the relationships between a built environment and human beings, the knowledge from other disciplines should be considered, such as that from environmental psychology and sociology. 2.7. A human being, built environment and social context In order to avoid ad-hoc design solutions there is a need for a systematic approach to design of underground spaces. In such a way an “intuitive” approach to problem solving can be avoided (Bennett, 1977). It is important to note here that the study could be done from various view points. One direction may come with more focus on social or economic issues and its reflection on a built environment. Other points of view could be to consider how various groups, for example how different cultures or different societies perceive the built environment, as well as how they influence changes in an environment. It is possible to imagine various viewpoints. For this research, it was important to model the perception of people, living in South Holland, regarding underground spaces. In that respect, all users were considered as equal contributors to the knowledge model since they are a part of the same social context. The underground stations are relatively young structures. As a result, the information and knowledge relevant to underground spaces is rather few and scattered. Several authors stressed the wide spread of information in environmental psychology that can be found in various journals (Mehrabian, 1976) yet state that such information is often fragmented, enclosed in statistics or expressed in a type of language that is difficult to understand. It is also a fact that many findings are not published at all or are provided in a form of internal reports that are not accessible to the public (Cherulnik, 1993). Therefore, this private information is also not available for architects and designers. An explanation could be simply due to requirements from a client to protect the information related to the project. Such discretion and confidentiality inevitably leads to the stagnation or slow progress in deepening knowledge. As for underground spaces, some psychological aspects deserved more attention than others, for example orientation (Passini, 1984, 1992; Arthur, 1992; Galen, 1999), safety aspects (Korz, 1998; Boer 1997; Galen, 1999) etc. Such research does provide valuable knowledge. They miss the relationship to other aspects, due to the limited information regarding cause and effect. These were examined as isolated experiences, while experience of underground space depends on the

- 20 -
interplay of different aspects. Perhaps in such way they became inaccessible to the architects and become quite spread out and difficult to combine in a design. Carmody and Sterling (1993) consider different aspects of underground spaces that need to be integrated in a design. The information in this book remains abstract and therefore open for different interpretations. The authors provide significant amount of work including the classification of underground spaces, the psychological aspects etc. However, what the reader misses is the actual application of all these aspects into one design, together with the post-occupancy evaluation of such design. The weight or the importance of the aspects is also not clear. It is not obvious which aspects are the most important and whether they can be compensated by other aspects. Such knowledge would be of great use for architects, providing both systematic approaches to design, as well as freedom to explore variation within a predetermined range. According to Cherulnik (1993), there is a lack of detailed documentation on actual applications of the theories followed by research results and applied techniques. This is the case, found in different areas of architectural design, but perhaps more evident in underground spaces due to their infancy role in general architectural practice. Vischer (1989) states that one of the difficulties to set environmental standards for a group of users lies in the fact that “objectively quantifiable building standards do not take the psychological dimension of building performance into consideration” (p. 46). This is often a problem since the qualitative nature is difficult to describe, and is quite vague. This suggests the importance in adopting more systematic methods, for assessment of spatial quality. At the moment there is a big knowledge gap regarding perception of underground spaces. This research could be further developed in the domain of environmental psychology, since it looks at individual's behavior in relation to environmental characteristics of underground space. It could be also a part of sociology, since it looks into a group perception of the environment within a social context. This requires further explanation to identify the most suitable approach. 2.8. Environmental psychology and sociology There are different approaches to the stated problem. One approach is from the psychological viewpoint, including sub-fields such as environmental psychology, social psychology, experimental psychology etc. Common to all these studies is that psychologists are interested in individual and their behavior under different circumstances with the accent on understanding mental processes. There is also a sociological approach which takes a society and social context as a starting point and studies social interactions, group behavior etc. There is still an ongoing dilemma between psychology and sociology, since there are no sharp boundaries as to where the individuality stops and society begins. The main difference between these fields is in the starting point. The psychology takes an individual as a starting point while the sociology as a starting point takes a wider scope of social networks and social context of which an individual is a part. The human being is less to the sociologist a point of departure than the point of arrival. A human being is a product of a society but at the same time it is through society that we can understand a human being (Durkheim, 1909, reprinted 1993; Woolgar, 1989).
- 21 -
In order to define the working area of the fist part of the thesis, and to distinguish between these two different approaches, there is a need for more insight and definition of terms. In this respect, environmental psychology and the sociology will be considered as the most relevant approaches to this research. The term environmental psychology has two dimensions: a) its understanding in a context of environmental sciences b) its understanding in a context of group psychology/sociology a) The word “environment” is used in different contexts. Some examples of the frequently used term are environmental pollution, natural versus man-made environment, office or home environment and user-friendly environment. Each time there is a different accent and understanding of this word. It seems that the words used in combination with the word “environment” determine the boundary condition for understanding the whole phrase. Understanding environment as a built environment is especially of interest for this research. The sciences that deal with the consequences of man’s intervention and manipulations of his environment are called Environmental Sciences (Proshansky, 1970). According to Proshansky (1970), the environmental sciences have four identifying characteristics, shown in Table 2. Table 2: Four main characteristics of the environmental sciences (Proshansky, 1970, p. 5)
characteristics of the environmental sciences they deal with man-oriented and man-defined environment they grow out of pressing social problems they are multidisciplinary in nature they include the study of man as an integral part of every problem.
Proshansky defines environmental psychology as a “study of human behavior in relation to the man-oriented and defined environment” (Proshansky, 1970, p. 5). A phrase “in relation to” is later replaced with the word “interrelationship”, which accentuates the interdependency of man and his built environment. One such example is a definition given by Bell (1976, p. 6) saying that environmental psychology is “the study of the interrelationship between behavior and the built and natural environment”. Having in mind that man influences an environment as much as an environment influences man, then the use of words such as interrelationship, interdependency and interaction better expresses such processes. b) The term psychology can be more easily defined since it is well-established science. A psychologist researches effects of different factors on an individual's behavior. At the same time, they study the mental processes that initiate certain behaviors. Therefore, what is the place of environmental psychology in the field of psychology, and what is a main difference between psychology and environmental psychology? Some authors to deal with this differentiation have been Wagenberg (1990) and Steffen (1982). Wagenberg explains its historical background saying that at the beginning of psychological research in the 19th century, environment was not considered. At that time, psychological research was mainly carried out in laboratories. It was only during the first half of the 20th century, when behavioral research, such as behaviorism, showed that human behavior can be strongly influenced by the events in the environment. This gradually created the need to carry out
- 22 -
research outside laboratories. This was the dawn of environmental psychology, in which the main accent was on interactions of human beings with their surroundings. Steffen (1982) distinguishes the difference between psychology and environmental psychology. He defines psychology as a science that systematically studies observable behavior and invisible mental processes of an individual. Therefore a psychologist focuses on the behavior determinants, or in other words, on all possible factors that determines the perception of the environment. Environmental psychology, or as he also calls it, the psychology of architecture and urban planning, deals with behavior and mental processes of human beings that are related to their spatial environment. The accent is on the built environment, which is seen as a determining factor of the behavior. He defines the whole field of environmental psychology as a study of interrelations between psychological and spatial variables, explaining different study areas as well (Steffen, 1982, p. 9): 1. Interior Psychology where the accent is on finishing and design. For example, the effect of
color, light, temperature and material on comfort and pleasantness. 2. Architectural Psychology where the accent is on use of buildings, their perception, design,
layout and functionality. 3. Urban Psychology with the accent is on behavior on streets, in shopping centers or in
residential areas 4. Landscape Psychology, which deals with use and perception of greenery in public spaces. For
example, parks, forests or grass-fields between apartment buildings. Human beings behave and react to the environment in a certain way. Stimulation from the environment and mental processes that take place concurrently, mostly sub-consciously, determine our behavior. Study of these processes is the domain of Experimental Psychology. Experimental Psychology is a discipline that studies general human functions such as learning, observation, thinking and memory. Four main psychological functions are perception, cognition, emotion and motivation, which are the driving forces behind behavior. The definition of these functions is given in the table below (Table 3), as an orientation for the reader. Table 3: definitions of four main psychological functions (Steffen, 1982) four main areas of experimental psychology perception is an observation process that includes a receipt of the information through senses. In such way, certain characteristics of the surrounding are noticed, such as color or noise. cognition includes all learned functions such as to know, understand, think, judge, consider, fantasize, remember and forget emotion considers the feelings in relation to the observed objects or situations or in other words the inner state of affection motivation refers to a total of all factors that direct the behavior such as needs, aspirations, desires, inclinations and motives
Figure 3 explains the interrelationships of spatial environment, human being and behavior, showing at the same time the position of the psychological functions and their mutual dependency. On one hand, this figure indicates the complexity of a behavior in general and the difficulty for assessing the behavior, since the number of unknown variables is high.

- 23 -
Figure 3: Interaction human being/environment/psychological functions (Steffen, 1982, p. 35) Yet what is still missing in the Figure 3 is the society/social context and group perception of the spatial environment. In respect to the research problem, there is a drawback of such an approach since social context is not considered and the accent is on understanding mental processes rather than obtaining a global insight into users perception of underground spaces. For this research, the goal was to gain more knowledge on group perception of underground stations within a specified spatial environment as a part of a given social context. For those reasons, a decision was made not to study the individual perception of the built environment and related mental processes, but rather to consider a wider scope and study the perception of a group in relation to the built environment in a given social context. In that respect, this research belongs to sociological, rather than psychological study. An interesting view on human information processing is provided by Arndt (2001), who describes a human being in a most abstract way, as a control loop that adjusts the behavior in accordance to the stimuli from the environment (Figure 4).
Figure 4: Human being as a control loop, where his role is as a perceiver Extrapolating Figure 4 to this research and taking into account the components from Figure 3, with exclusion of mental processes, a following scheme can be made (Figure 5), explaining the position of this research. This figure shows clearly that an interest will be taken into group
sensoric perception human being 'perceiver'
action/reaction
environment
spatial environment human being
mental processes perception cognition
emotion motivation
behavior

- 24 -
perception of spatial environment within the given social context in which they participate. Taking perception of a group as a staring point in design can in the future influence a change of social context as well. By monitoring these changes over time, more can be learned about our society and human being as a base of that society. This may represent a bridge between social psychology and sociology, where the link between individual/group and social context could eventually be found (Eiser, 1986).
Figure 5: Human beings as a control loop, where they role is participation in social context In the following chapter the variables will be defined that are relevant to this research. In that respect, the conceptual model will be developed based on existing models, extensive literature study as well as personal interviews with users of public transport, interviews with the experts in the field of architecture, and people from metro/train companies.
social context human beings 'participants'
action/reaction
spatial environment
- 25 -
CHAPTER 3
Identification of the model parameters 3.1. Introduction In previous chapter, the position of this research within a wider scope was defined. The underground space plays an important role in future Dutch spatial planning, yet there are many areas that still need to be researched. One of these areas is users' perception of these spaces. In that respect, the main interest will be taken into studying the variables of public safety and comfort in relation to spatial aspects of underground spaces. In the literature, public safety and comfort were mostly considered separate from each other. By investigating the variables, it became evident that many aspects were overlapping. Therefore, a decision was made to include them both in the study and by adequate knowledge modeling provide the necessary overlaps. In this chapter, the research variables considered in this work will be explained in order to form a conceptual model that would later be used for the development of questionnaire for the end users. The existing models related to public safety serve as a starting point for conceptual model development into which the aspects of comfort are integrated, followed by detailed descriptions of related variables. 3.2. The variables for an assessment of spatial experience – research variables “Human behavior is a multidimensional consequence of psychological changes, physiological variables and situational factors. The possible combinations of these dimensions are infinite. An important objective of behavioral research is to establish a theoretical framework that will lead to a comprehensive understanding of the psychological, physiological and environmental components of behavior” (Weiss, 1987). The main goal of the research was to establish the relationship between spatial characteristics of underground spaces and the ways people perceive these spaces. Therefore, it was crucial to determine all aspects that were relevant for final assessment related to the perception of these spaces. Different authors dealt with these factors, in the literature also called variables (Steffen, 1979; Whyte 1977, Korz 1998). There are two main groups of variables (Steffen, 1979), which are shown in Figure 1:
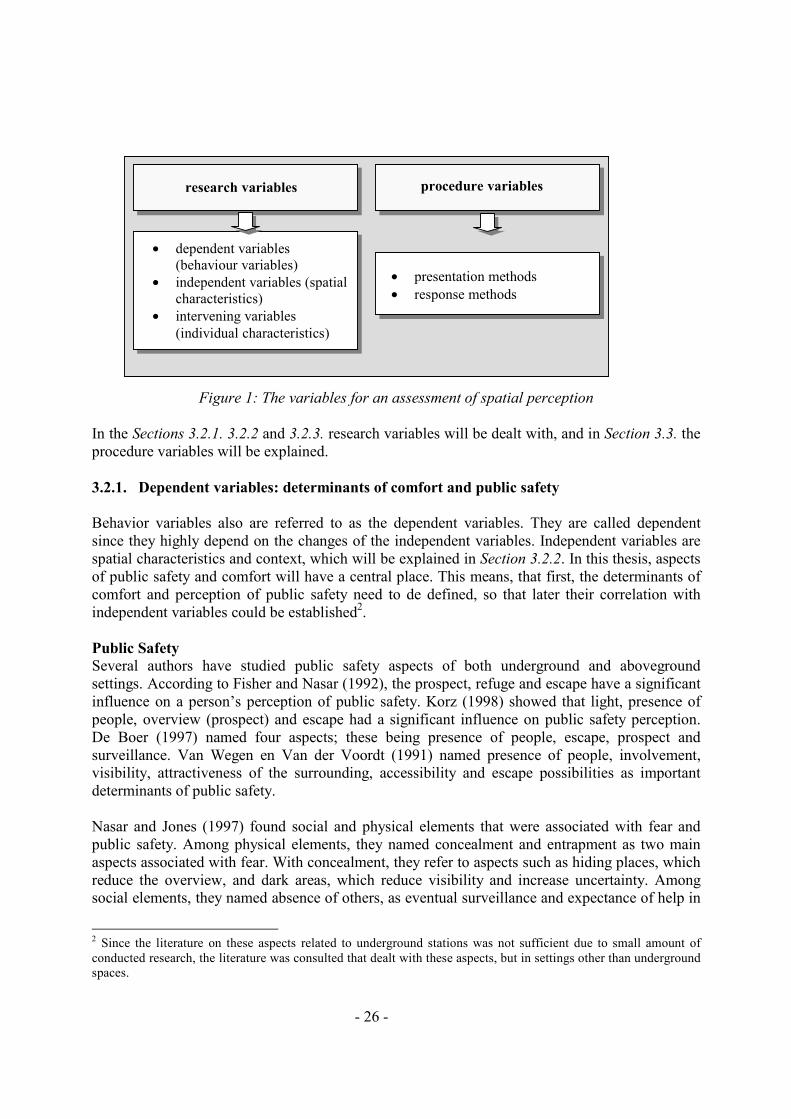
- 26 -
Figure 1: The variables for an assessment of spatial perception
In the Sections 3.2.1. 3.2.2 and 3.2.3. research variables will be dealt with, and in Section 3.3. the procedure variables will be explained. 3.2.1. Dependent variables: determinants of comfort and public safety Behavior variables also are referred to as the dependent variables. They are called dependent since they highly depend on the changes of the independent variables. Independent variables are spatial characteristics and context, which will be explained in Section 3.2.2. In this thesis, aspects of public safety and comfort will have a central place. This means, that first, the determinants of comfort and perception of public safety need to de defined, so that later their correlation with independent variables could be established2. Public Safety Several authors have studied public safety aspects of both underground and aboveground settings. According to Fisher and Nasar (1992), the prospect, refuge and escape have a significant influence on a person’s perception of public safety. Korz (1998) showed that light, presence of people, overview (prospect) and escape had a significant influence on public safety perception. De Boer (1997) named four aspects; these being presence of people, escape, prospect and surveillance. Van Wegen en Van der Voordt (1991) named presence of people, involvement, visibility, attractiveness of the surrounding, accessibility and escape possibilities as important determinants of public safety. Nasar and Jones (1997) found social and physical elements that were associated with fear and public safety. Among physical elements, they named concealment and entrapment as two main aspects associated with fear. With concealment, they refer to aspects such as hiding places, which reduce the overview, and dark areas, which reduce visibility and increase uncertainty. Among social elements, they named absence of others, as eventual surveillance and expectance of help in
2 Since the literature on these aspects related to underground stations was not sufficient due to small amount of conducted research, the literature was consulted that dealt with these aspects, but in settings other than underground spaces.
research variables procedure variables
•= dependent variables (behaviour variables)
•= independent variables (spatial characteristics)
•= intervening variables (individual characteristics)
• presentation methods •= response methods

- 27 -
case of emergency. Interestingly, they found fear being associated with the presence of strangers, which was seen as a possible entrapment. About 96% of the respondents experienced the presence of groups of people as being safe. This is important to mention, since in other research, only “presence of people” has been mentioned, but no specification was made regarding a number. In this case, presence of one person or very small group can be negatively experienced. On the contrary, presence of more people, but not necessarily in large groups, creates the best condition for a generally shared feeling of public safety. This aspect was also addressed in research of Opperwal and Timmermans (1999), where they conducted a study on aspects that had an influence on the pleasantness rating of shopping centers. According to the authors, people tended to dislike crowded and very un-crowded areas (deserted areas with few people). Moderately un-crowded shopping centers were perceived as most pleasant, while very crowded centers were disliked and negatively experienced. Van der Voordt and Van Wegen (1990) state that the presence of people is important, but that excessively crowded places may have a negative impact. Having public safety as a basic assumption for perception of underground station, Laarhoven (1997) considers following aspects: •= a public control of the route to the station •= a degree and a nature of activities in the station’s surrounding •= spatial organization/ layout of the station •= lighting •= presence of people and •= a degree of surveyability The author stresses out the importance of considering the surrounding and its quality as well. This is a natural choice since the station is a part of larger area and any problems that are evident in the surrounding may as well be reflected in the building as well. The aspect of daylight was found to have an influence on perception of public safety. Naser and Jones (1997) found that the routes respondents needed to take during their research were experienced as more safe, during the daytime than during the nighttime. Korz (1998) showed that in the late hours, an individual expects a smaller number of people being present at the stations (both above and underground) and therefore they expect more crime to happen in these hours. The aspects that were considered until now were primarily related to public safety, together with the way in which they can influence perception of comfort. Later in the text, the determinants of comfort will be explained. Comfort – Pleasantness An aspect that is often dealt with in the literature and related to comfort is the orientation or the wayfinding aspect (Passini 1984, 1992; Arthur 1992; Galen 1999). Passini (1992) defines spatial orientation” as the ability of a person to determine where he is within a physical setting”. Thereafter he adds that this definition needs “to be extended to include an alternative ability that consists in determining what to do in order to reach a place” (p. 43). He goes further explaining that a person may rely on spatial representation of the physical environment as well as on a plan of action or a strategy to go somewhere. According to Passini, the sensation of being disoriented would arise only if a person is deprived of both. In such case the feeling of discomfort and
- 28 -
frustration would appear. It is also not difficult to imagine that in emergencies, this may also cause panic and stress provoking the feeling of lack of safety. Opewall and Timmermans (1999) conducted research on aspects that in their opinion had an influence on the pleasantness rating of shopping centers. They used a conjoint approach in order to solve the limitations of a cross-sectional approach to data analysis. Even though shopping centers fall under a particular category of buildings, still the findings convey a message which can be later considered for any building by selecting the aspects that are appropriate for building’s function. Their findings were that pleasantness of public space mostly depends on: - the level of maintenance of streets, hallways and buildings - the proportions of storefronts with attractive window displays Thereafter pleasantness depends on the extent to which: - the public space is reserved for pedestrians - the shopping center is indoors - the number of street activities - the amount of greenery To a lesser extent, the following aspects play a role: - decorations and furnishing in the shopping area (signs and displays, stalls, benches and flags) - number of coffee shops, cafes and restaurants - crowding in shopping area - location convenience - compactness (walking routes, interruptions of store fronts, surveyability) - proportions of shopping area indoors There is also another group of aspects, which can have influence on comfort. These are the physiological aspects. In case of underground stations, the most relevant aspects are noise (due to the passing trains/metros) and temperature (experience of draft and air-flux caused by passing trains/metros). Weiss (1987) deals with a number of environmental conditions, which among others includes the effects of temperature and noise. These aspects could have an influence on perception of public safety as well. The author dealt with the relationship between temperature and aggressive behavior. Heat, to a certain point, facilitates aggression but afterwards the reduction of discomfort takes priority over aggressiveness (Weiss, 1987). Similar findings were found for cold temperatures as well. We can also conclude that temperature (heat, coldness, draft) and noise are important factors that can have an influence on the experience of space. Most of the time these conditions are placed in the background at the sub-consciousness level, but as they approach the borderline, their effects are experienced in the consciousness, influencing our behavior and reaction. In most cases, the adaptation to a situation and short term solutions are applied on shorter terms, while, in more severe cases, an individual may decide to avoid that specific environment on a longer run. Aspects such as temperature and noise are those influencing the physiological comfort, which in return may reflect on a perception of space. We have seen that comfort and public safety are two inseparable aspects, yet in the literature they are not often mentioned together. This research will show that both of these aspects are crucial for space perception. Only together, being experienced as positive can provide confirmatory

- 29 -
judgement and experience of space. Although they are inseparable, analytically they can be distinguished. In other words, the variables can be defined for both aspects, which makes their assessment easier to control. First, an operative distinction can be made in a following way. Fulfillment of public safety aspects is necessary and therefore those aspects are seen as standard requirement. Fulfillment of comfort aspects is an additional quality and should be satisfactory in so far as possible. Here again it is important to say that there can never be such a sharp separation and that the overlapping is eventually inevitable. If we summarize the above-mentioned aspects, we can extract eight determinants of comfort and perception of public safety. Those aspects are subdivided into two groups (An and Bn ), where group An represents the determinants of public safety and group Bn are the comfort determinants (Figure 2).
Figure 2: Determinants of public safety and comfort Safety in the surrounding was also stated to be very important (Laarhoeven, 1997) but such study is of a totally different scale than the aspects considered on a building level. It may be the study for itself and therefore this aspect is only included in a questionnaire to assess its importance, but no specific further questions were asked regarding the surrounding of the station. For that reason, this aspect was not mentioned in the Figure 2. In the following text, each of the determinants of public safety and comfort will be separately addressed showing through each aspect the possible relation with the spatial characteristics. The spatial characteristics are discussed separately in Section 3.2.2. Overview (A1) In the literature, overview is defined as a space that offers no possibility for an eventual offender to hide himself (Korz, 1998). Nasar and Jones (1997) state that there are two kinds of physical concealment cues: objects such as trees, vehicles, walls and patterns of darkness and shadow. In their research, they found that mainly females associated fear of attack with those places where someone could be hiding. They also reported fears in relation to dark spots and possible entrapment (Warr, 1990; Fisher, 1992; Nasar, 1997). The term overview is here defined as some arrangement of spatial elements that provides a good surveyability by an individual. In other words, a space that has no large objects or sharp shadows which would influence the ability to survey the space. Goffman (1971) by using a term “lurk
overview (A1)
DETERMINANTS OF PUBLIC SAFETY (An)
AND COMFORT (Bn)
wayfinding (B1)
physiological comfort (B3)
attractiveness/ maintenance (B2)
escape (A2)
surveillance/ presence of people (A4)
daylight (B4)
visibility/light (A3)
I NTERVENI NG
VARIABLES

- 30 -
lines” explains that hiding spots are present everywhere, for example, the sightless areas behind an open door or sharp turns in passageways (Fisher and Nasar, 1992). In such cases, a design solution could be placing the mirrors at the strategic points, which serve for the extension of the view. An example of such application can be found in Vancouver (Canada) which is given in Figure 3.
Figure 3: An example of extending the view line (Vancouver, Canada)
With such understanding, we can expect that following spatial characteristics can greatly determine the overview level: •= Construction/structure in a sense whether it is massive or transparent •= The dimensions of construction/structure and other objects that are present in the
underground space •= Furniture positioning and design. Here we understand all elements that are placed inside the
station fulfilling the functions other than being a construction/structure, which could obstruct the view. Those are stairs, elevators, escalators, different machines etc.
•= Light level is another precondition for good overview. Light is explained more in detail in Section “visibility/light (A3)”
•= Layout/spatial organization is finally the one that determines the overview. It includes the organization of the above-mentioned aspects and especially the positioning of strategic points in a design which can provide an overview of the designed plan (this may be provided for example in a form of gallery /balcony). An example is given in Figure 4.

- 31 -
Figure 4: View over the platform. Underground metro station in Washington DC, USA Escape (A2) If a person feels entrapped or intimidated by the presence of others, in order to avoid the situation they may want to leave the space, or in other words, to escape. If there are any obstructions in the surroundings, which may hinder their attempt to escape, the feeling of fear may arise (Korz, 1998; Fisher and Nasar, 1992). It is interesting to note that there is a relation between an overview and escape. Fisher and Nasar (1992, p. 61) showed that the “possibilities for escape tended to vary with prospect and when possibilities for the escape were low, fear of crime was higher”. This is further explained through the fact that a good overview would provide a possibility to an individual to notice the eventual offender and act on time in order to avoid the situation. Fisher and Nasar (1992, p. 40) define a degree to which a space affords opportunity for escape as “either an exit route from a potential threat, or a connection to others who could respond in case of an attack”. Having this definition in mind, the following spatial aspects can have a role in determining the degree for escape possibilities: •= Layout in sense of spatial organization but also related to the positioning of all elements that
could obstruct the escape •= Clarity/spatial continuity – space should be easily understood so that it provides an
information regarding exits •= Accessibility – whether the escape routes are on the same or different level and whether they
are easy to find, or in other words, the perception by people that there are enough escape routes is important
•= Adjacency – closeness of the exits from any given point in the station Visibility/light (A3) This aspect may seem to be similar to the overview, but there is a difference. Under this aspect we consider the lighting level upon which our ability to see is greatly dependent. Various researches have shown the relationship between the amount of light, the feeling of public safety and amount of crime (Van der Voordt and Van Wegen, 1987; Stollard, 1991; Korz, 1998; Galen, 1999). In relation to crime, some research “suggests that 40% of night-time street crime occurs
- 32 -
when lighting levels are at 5 lux or below. Only 3% of night-time street crime takes place when the lighting level is above 20 lux.” (Stollard, 1991, p. 49). The amount of light is not the only component that influences the visibility. It depends greatly on the material properties applied on the surfaces and the color. Bennett (1977) states that the luminance-illumination relationship is important to a designer since by using lighter surfaces on the walls, floors, ceilings and furniture the room will appear brighter since these surfaces would reflect more light. The same could be applicable for the materials used. If reflective materials are used such as tiles or stainless-steel these surfaces would reflect more light into the space, and therefore appear to be brighter. This brings us to the conclusion that it is not enough to provide the designer with information on the required number of lux on platforms. Instead, the total perception of the space will be dependent on other factors such as material properties and the color applied to surfaces. Following aspects can have a role in determining degree of visibility/light: •= Light •= Material/Color •= Furniture design – that it is positioned in such way so that it does not obstruct visibility Surveillance/presence of people (A4) In the literature, three types of surveillance are mentioned (Van der Voordt and Van Wegen, 1990): - formal surveillance, which includes presence of police or other persons whose main role is
formal guarding of the station - semi-formal, which includes presence of personnel that are working there, for example, at
ticket-offices or in shops - informal, which includes presence of passengers or passersby Van der Voordt and Van Wegen (1990) mention two main reasons why the presence of people is an important factor for the perception of public safety. First, people are witnesses in the case anything happens. In such way, they fulfill the role of public eyes and public control. Secondly, they can provide help in case anything happens. The semi-formal and informal surveillance are those that can be influenced, in a sense that multifunctional spaces are designed by combining various functions (Van der Voordt and Van Wegen, 1987). Nasar and Jones (1997) conducted a statistical analysis of fear and safe spots of the different routes that respondents needed to take. The results were the following: 69.2% of respondents associated the absence of other people with fear. At the same time 30.8% associated the presence of a stranger with the fear. In agreement with this finding, 96.9% of respondents cited the presence of people to be associated with the public safety. This aspect is connected with the overview. If the spatial organization is ordered in such way that no surveillance is possible by an individual, and therefore by other people as well, then it can be expected that in the aspect of surveillance, the overview may be obstructed. With such understanding it becomes clear which design aspects can play an important role in providing a good surveillance. Those that were relevant for the overview are important here as well but there are also additional ones:

- 33 -
•= Layout including both spatial and functional organization •= Adjacency of different functions in the building •= Construction/structure in a sense of positioning and whether it is massive or transparent •= Dimensions of construction/structure •= Furniture positioning and design (see overview for these last three aspects) The aspects discussed up until now (A1-4) are the determinants of public safety. Now the aspects of comfort will be explained in more detail (B1-4). Wayfinding and orientation (B1) “Environmental information is fundamental in the making of decisions and decision plans as well as their execution. The provision of adequate environmental information is furthermore a crucial design issue. Signs, maps, verbal descriptions, as well as architectural and urban spaces can be seen as information support systems to wayfinding” (Passini, 1992, p. 76). Orientation is one of the important aspects for an underground building especially due to a fact that there are not so many reference points and limited relation with the surface. This together makes it more difficult to understand one's position in space. “Disorientation is not only an inconvenience – it is potentially quite stressful… One key is designing an environment with ‘imageability’, a term that refers to ‘the ease with which a place can be mentally represented’. These mental images can be incorporated into an overall cognitive map to maintain orientation” (Carmody and Sterling, 1993, p. 193). Lynch classifies five elements that are relevant for the city image, being paths, edges, districts, nodes and landmarks (Lynch, 1960). Although the elements that Lynch considers are for the city, some parallels can be made and applied to the buildings (Carmody, 1993). Passini (1992) who studied the wayfinding in underground space draws these parallels as well. He defined them in the following way: •= Paths are the circulation system, which includes corridors, promenades that are part of
horizontal circulation and stairs, elevators and escalators that are part of vertical circulation. •= Walls inside the building could be viewed as the edges •= Districts are considered to be certain areas with specific functional characteristics •= Nodes are defined as important circulation intersections, halls and indoor squares •= Landmarks are a clearly remembered element such as particular shop, sculpture or decorative
elements. According to Passini, not only objects but also the space itself, can serve as a reference point, and could be considered a landmark.
These five elements all together can contribute to the imageability and therefore contribute to the formation of a cognitive map. Cognitive map represents “an organization of the physical environment in simplified form” (Passini, 1993, p. 40). Evans (1981) showed that the landmarks are used as initial anchor points in the environment and by connecting these landmarks into network a path structure is formed. In addition, the exact location of the landmarks improves with experience. This means that in time a cognitive map improves and becomes more accurate. Following aspects can have a role in determining wayfinding: •= Layout – the above mentioned elements are organized through layout •= Adjacency – closeness of different functional groups and distinction between them

- 34 -
•= Clarity/spatial organization – relationship between the five elements mentioned above •= Accessibility – accessibility of exits and placement of direction boards •= Signing system (information form) – frequency of information signs but also the presence of
distinctive spatial characteristics, which can enhance the orientation by providing a directional differentiation. This may be an asymmetry or variation of heights and widths, or (day)light intensity
Attractiveness and maintenance (B2) Poor maintenance can be one of the reasons why an underground station may be disliked, for example, presence of graffiti or other visible signs of vandalism towards objects. These are the signs of abandonment and in return provoke the sensation of discomfort and insecurity (Laarhoven3). For good maintenance, a choice of materials is of importance, since some are easier and some are more difficult to maintain. According to Carmody (1993), using natural materials in underground settings is one of the most powerful techniques in order to create a positive environment for people. This is something that is seldom seen in underground stations in the Netherlands. Colors as well as the spatial proportions and dimensions can also have an influence on spatial evaluation. Presence of color is seen more positive than the absence of it. Color by itself is difficult to judge but in a whole spatial context, it can be of great significance. It can on one hand create a feeling of spaciousness by using light colors. It can help offset the associations with coldness and dampness, by using warmer colors (Carmody, 1993) “In the past few years several “semantic differential” studies of subjective reactions to buildings and spaces have been conducted. The ratings are statistically correlated and factor-analyzed into a few factors or dimensions. For example, Seaton and Collins found a general evaluation dimension (e.g., pleasant-unpleasant), an organization dimension (e.g., orderly-disorderly), and a spaciousness dimension (e.g., uncluttered-cluttered)” (Bennett, 1977, p. 16). Such studies are interesting since they tell how people react in general to certain environments, but still more explicit statements are needed so that the data can be of use to a designer. The following spatial characteristics are closely related to the aspect of attractiveness and maintenance: •= Layout •= Material/color •= Construction/structure •= Furniture design •= Dimensions – spatial proportions It is actually the combination of all of the above mentioned aspects that create a certain atmosphere, which is in the end experienced as more/less pleasant. Physiological comfort (B3) “Just about anything people come into contact with can be uncomfortable – lighting (glare), sound (annoying noise), seats, other furniture, and thermal conditions. In general, however, 3 Personal interview with ir. A. J. M. van Laarhoven, the project manager NS Railinfrabeheer, was held in April 1999 in Utrecht.
- 35 -
comfort seems to fulfill a biological function. The function of discomfort is to protect the person from more extreme conditions” (Bennett, 1977, p. 14/15). In underground spaces, people are even more sensitive to physiological comfort, for which Carmody (1993) finds three reasons: •= Lack of visibility from the exterior •= Lack of windows •= Being underground Following aspects can have a role in determining physiological comfort: •= Acoustics – this includes taking additional measures to reduce the noise nuisance caused by
passing trains and metros and making sure that the announcements on the station are understandable, otherwise this may cause the annoyance
•= Light - ability to see •= Temperature – thermal quality and draft •= Air quality and stuffiness – ventilation but also the presence of any smells Daylight (B4) In this research, a difference is made between daylight and light. As it has been earlier discussed, light is mainly related to the visibility and the ability to see in general. The deficiency of light may lead to feeling of fear and is therefore related to the aspect of public safety. Daylight may also have that role, but only during the daytime. People in general feel more unsafe during the night hours than during the daytime, which again may depend on various aspects, such as (Korz, 1998): •= during the daytime more people are present on the stations, therefore people feel safer •= daylight openings contribute to the increase of light level, and therefore the spaces are
experienced during the daytime as more safe, even though this is less likely for underground stations
In this respect, one can say that the daylight influences the public safety aspects. However, largely it fulfils the other function as well, which is relevant independent of the period of the day, since daylight openings can: •= provide additional information about the aboveground conditions; for example, it may
provide information about weather conditions •= give information about the positioning of underground space in relation to the ground level •= help one's orientation in space and a better understanding of ones position in the underground The main reasons why the aspect of daylight is placed under comfort rather than public safety aspects are: •= Light – daylight can increase the light level only during the daytime •= Layout – strategic positioning of daylight openings can enhance the orientation and the
wayfinding in an underground space. These structures clearly mark the underground space and in most cases, they mark the exit/entrance to the underground space as well. Orientation is already classified under comfort aspects.
•= Clarity/spatial organization – the daylight openings can help to comprehend the organization of underground space since they can be an important markers and orientation points

- 36 -
3.2.2. Independent Variables: Spatial Characteristics and Context The spatial characteristics are in the literature also called the independent variables. The changes of independent variables significantly affect the change in dependent variables. Simply said, people perceive different spaces in different way since the conditions of independent variables changed. Examples of independent variables are materials, colors, proportions, accessibility and functionality. Another important independent variable is context. Context Korz (1998) explained the meaning of context saying that with a given context people have certain expectations and their judgment of the space depends on the provided context. The same author showed that there was a relationship between contexts and experiencing of public safety of the above and underground stations in relation to aspects such as light level or presence of people. Some examples of the contexts are: •= an underground station is in a small or large city •= the station is functionally isolated or is combined with other functions •= a station is above or underground Since this thesis deals only with underground spaces, the goal is to find out whether the aspects of public safety and comfort were differently perceived within dissimilar contexts. The assumption is that the spaces are experienced differently if a space is linear or complex, as well, if only a single function is present. The results could have a significant influence on designing and functional organization of future underground spaces. The contexts that are most commonly present in underground spaces and that are therefore taken into account are: a) Spatial organization: 1. Linear spaces (one transport system) 2. Complex spaces (in transfer areas) An assumption is that orientation is easier in a linear rather than in a complex space. A question that remains is how to improve the orientation in complex spaces as well. b) Functional organization: 1. Mono-functional (one function only – in this research the transport function) 2. Multifunctional (transport in close relation with other functions – shopping) An assumption is that surveillance is more possible in multifunctional rather than in mono-functional spaces since there are more activities at/around the station. c) Space in relation to function 1. Entrance level 2. Interchange level 3. Platform An assumption is that public safety and comfort are differently experienced on different underground levels and this is mainly related to the function that occupies the given space and presumably with the number of people, that occupies the space. According to the above-mentioned context, the representative cases were selected. This is explained further in Chapter 5, Section 5.2.

- 37 -
Spatial Characteristics Spatial characteristics are in the broadest sense the means by which an architect creates a space. “Architecture is a science, which is a mix of an exact science and the art. The combination of these two important items makes architecture a difficult task. An architect has to combine these two primary elements in the design, and at the same time express the feeling of art. An architect must also take care of many other factors that play an important role in the built and designed environment. The technical aspects on one hand, and social aspects on the other” (Sariyildiz, 1991, p. 4). Spatial characteristics are those elements that are in the hand of an architect, which means they can be manipulated by a designer. Based on interviews that were carried out with different architects two groups of aspects were defined and specified4. In other words, if we try to reduce a space to the basic components we can see it through two main aspects, given in Figure 5:
Figure 5: Standard and additional requirements embedded in a form and function aspects of a design
Formal aspects include the physical space as it is. Functional aspects are those that deal with spatial organization in order to fulfill the specific requirements of the station's design. The functional aspects include the standard requirements, while the formal aspects include the additional requirements. Combining Figure 2 and 5 and summarizing the Section 3.2.1. the following figure (Figure 6) is given which shows the dependency of psychological aspects (comfort and public safety) and spatial aspects (form and functions). It is this figure which forms the basis for questionnaire setup, showing directly the impact of spatial characteristics on psychological aspects and other way round.
4 Interviews were carried out with ir. Moshé Zwarts (February 1999), ir. L.I. Vákár (April 1999) ir. Theo Fikkers (December 1998) and ir. Harry Volker. First three architects had an experience in designing underground spaces. Their experience and suggestions were of great value for this research.
formal aspects functional aspects
•= material/color •= construction and separation
walls •= dimensions •= furniture positioning and
design (fixtures including stairs and elevators)
•= signing system (information form)
• layout/connectivity patterns •= adjacency •= accessibility •= clarity/spatial continuity •= acoustics/noise •= light •= temperature/draft •= air quality

- 38 -
Figure 6: The relationship between spatial and psychological aspects
OVERVIEW
•= Construction/structure •= Dimensions •= Furniture •= Light •= Layout
ESCAPE
• Layout •= Clarity/spatial continuity •= Accessibility •= Adjacency
VISIBILITY/LIGHT PRESENCE OF PEOPLE
•= Light •= Material/color •= Furniture design
• Layout •= Adjacency •= Construction/structure •= Dimensions •= Furniture positioning
WAYFINDING ATTRACTIVENESS
•= Layout •= Adjacency •= Clarity/spatial organization •= Accessibility •= Signing system
• Material/color •= Construction/structure •= Furniture design •= Dimensions
PHYSIOLOGICAL COMFORT DAYLIGHT
•= Acoustics •= Light •= Temperature •= Air quality
• Light •= Layout •= Clarity/spatial organization

- 39 -
Figure 7: Tentative relationship diagram The spatial characteristics are direct and easy to obtain from architects or their technical advisors, and even for the majority of aspects, some observations can be made by visits to the stations. Therefore, this is an additional information that can be gathered and can be related to the findings of this research, but will not be the scope of this thesis.
overview
escape
visibility/light
presence of people
wayfinding
attractiveness
physiological comfort
daylight
material/color
construction
dimensions
furniture
signing system
layout
adjacency
accessibility
spatial continuity
acoustic/noise
light
temperature/draft
air quality

- 40 -
Material and Color For all four selected cases, a general specification of materials and colors can be made. Materials can be classified in the following form for three surfaces being floors, walls and ceilings: •= reflecting or matt (dull) materials Color specification can be also done for floors, walls and ceilings in the following way: •= bright or dark colors •= variety of colors or quite colorless environment (with few colors used) It is necessary to define the space in a sense of color and materials used since in such way some user preferences can be obtained. As it has been already mentioned, these two aspects are important in the combination with the amount of light (Bennett, 1977). The preferences are changing over time and some other studies dealt with this issue but that will not be a subject of further investigation in this work. Construction and separation walls Under the term construction, load-bearing construction is understood, in which walls and columns clearly have a support function. Those are the fixed elements and once realized are difficult to change. Under separation walls, we consider the partition walls between two spaces, whose function is merely to separate rather than support. These partition walls are used to differentiate public, private and semi-private spaces. In this respect, attention will be paid to the type of construction and structure, mainly whether it is transparent or massive. In the first instance, this is of relevance for the separating walls between spaces (if there are any). That is not the only definition of transparency. Naturally, dimensions play a significant role as well. Transparent construction or structures are ones in which the dimensions do not provide the possibility for a person to remain unnoticed by standing behind them. Therefore, dimensions of construction and separation walls are closely related to human dimensions. Thus a definition of ‘transparency’, as the term may suggest, is not only related to material properties such as opaque or transparent. It has another meaning as well. It is related to the dimension of construction. Dimensions The following aspects of dimensions can be taken into consideration: •= spatial dimensions and proportions (of entrance, transfer area and platforms). This is
important for the aspect of ‘attractiveness’ but also the overview •= the dimensions of construction and structure present in an underground stations (this includes
the identification of possible furniture elements or construction which could potentially obstruct an overview or surveillance
•= dimensions of daylight openings (if present at the station)
Furniture positioning and design A station’s furniture is in this research defined as all objects that are present at the station and that fulfill one function or the other. What is of interest for this research is the positioning of the furniture, whether it could obstruct an escape, or be an obstruction for overview and surveillance.

- 41 -
Another aspect is the transparency of objects and those objects whose dimensions are larger than of a human being, and may provide a potential hiding place. There is a large variety of furniture, for example: •= stairs and elevators/escalators •= machines (for food or drinks) •= presence of any additional space/room at the platform, transfer or entrance level •= information or commercial boards •= telephone booths •= seating and trash-bins The furniture positioning is an important aspect but there is also another one and that is the design quality, which determines the attractiveness and therefore comfort as well. Signing system - information form With the term “signing system”, we understand the following: the term includes information boards that are present at the station that provide a necessary information on directions (exits, streets, center etc.). In addition, spatial cues are included here. The spatial cues are those elements that may provide an additional information regarding a direction or once position in space. These are: •= daylight openings (during a day-time can serve as an important orientation point) •= differentiation of spatial dimensions and proportions (this provides a better comprehension of
space, since the parts of the space are distinguished by different form or dimension, for example, the change of height or width can provide a sense of direction) (Lynch, 1960)
The aspects discussed until now were formal. In the following text, functional aspects will be discussed in more detail. Before explaining the aspects separately, a general remark should be made in advance. One should realize that the ‘layout – spatial organization’ is actually determining almost all ‘functional aspects’. Layout – Spatial Organization This aspect deals with the relationship between different functions in buildings, and how they relate to each other, both physically and visually. The spatial organization includes the connectivity between different spaces of the station as well as the spatial continuity. Connectivity can therefore provide visual continuity as well as the physical connectivity. Visual continuity is defined as a space that does not have many 90 degree angles (no sharp angles) and where the separation walls between two spaces are transparent. The visual continuity can therefore influence the overview and surveillance since it provides a visual contact from one space to the other. If we consider physical connectivity then we understand that two spaces are connected but they may not necessarily have a visual connection as well. In such a case, we talk about massive construction, or in other words, spaces are not visually connected. If mirrors are placed in such way to artificially provide a continuous space by extending the vision, than the space is considered continuous as well. In other words, if there is no visual obstruction or barrier then a space is considered continuous. Carmody (1993) recommends placement of mirrors at the strategic points in underground space in order to extend the view-lines. Some of the reasons, according to Carmody, for using mirrors in underground spaces are the following:

- 42 -
•= use of mirrors can create spaciousness by providing the illusion that there is a space extending beyond the actual surface of the mirror
•= placing mirrors at the angles to direct the view around a corner and therefore creating longer views
•= mirrors can actually lighten space since they are highly reflective Adjacency This aspect is related to the layout since it is actually the spatial organization that eventually determines the closeness of specific functions. Similar to the description of layout, adjacency may be defined in terms of physical or visual closeness. In other words, from a design layout it can be easily determined how close two adjacent spaces are (mainly fulfilling different functions) and whether there is a visual barrier between these spaces. Accessibility For underground station design, the accessibility of entrance/exits is of great significance. In first instance there are certain norms which need to be fulfilled (such as maximum distance from any given point in space until the exit). Under accessibility, not only the norm regarding distance, but also the ease of access, can be considered. In other words, is the entrance/exit provided physically and visually at the same level? This is related to eventual obstructions, for example, whether one needs to climb stairs or take an elevator to reach an exit. This of course is found in many underground stations. Other issues of accessibility include how obvious these exits are from any given point in space. Acoustics and noise The data on acoustics can be provided by the designers (or their advisors) giving an insight into objective measurement, or this can be obtained from field measurement by determining the exact number of decibels caused by passing trains/metros. These values can be later easily correlated with the respondents answers related to their perception of noise and checked against the pre-given norms.
Light The designers (or their advisors) can provide the data on light levels, which are specified by norms. The norms for lighting conditions differ in relation to the function of the space. These values can be later easily correlated with the respondents' answers related to the ‘light/visibility’ and ‘physiological’ aspects. Temperature and draft This aspect is highly dependent on the positioning of exits (both for the pedestrians but also the train/metro circulation exits). If not positioned correctly, a significant wind hinder and draft can be created, which may be experienced as negative and unpleasant. This aspect can be examined in a wind tunnel in advance, to check which areas may be problematic regarding draft. Thereafter, solutions can be generated. Air quality and ventilation This aspect deals with the ventilation and eventual space contingency by an odor. This maybe caused by some construction inconsistency or poor ventilation. According to Carmody (1993)
- 43 -
there are three key issues that are often the source of complaints in underground building and they altogether can contribute to the negative imagery of these spaces. Those are coldness, dampness and stuffiness. In underground stations this may be caused on one hand by poor temperature control and draft caused by the passing trains and metros. There may be a lack of sufficient ventilation system, which may result in poor air quality. 3.2.3. Intervening Variables: Individual Characteristics Individual characteristics are also called in the literature, intervening variables. There are many aspects of an individual that can be considered. Some of the examples of empirical measures for the variable of individual characteristics are given by Whyte (1977, p. 88): •= age and sex •= socio-economic level or class •= ethnic group •= occupation and skills •= education •= religion •= physical characteristics •= income, individual or household •= roles, e.g. in household, work group, community, larger society •= groups, e.g. professional, religious, interest, labor union •= wealth, e.g. in terms of land ownership, possessions, animals, cash •= power and authority, e.g. position in work, political, administrative, judicial or religious
spheres For this research three aspects are of particular interest: •= age, gender and education First, it is important to see which age group provided responses, and whether this aspect had an influence on the determinants of public safety and comfort. Thereafter, the gender of the respondent may also play a role in providing answers, as well as the education level. According to Galen (1999), women pay more attention to the board signs. In other words, they find their way (orienting in space) by “consulting” information on boards. Men orient themselves not so much by using signboards, as by comprehension of space, by finding clues in spatial characteristics. These three intervening variables will be taken into consideration, to be checked to what extent they influence responses. They are important for the ability to control, interpret and understand the collected data in an integral manner. One research shows age and gender in relation to the perception of public safety (Boer, 1997, p. 12, 13). Figure 8 (male) and Figure 9 (female) represent the perception of public safety at the stations during daytime. The ‘y’ axis represents the percentage (%) and the ‘x’ axis represents the age group of the respondents. The questioning was done on a 4 measure scale from very unsatisfied to very satisfied. When both figures are compared, it can be noticed that there is little difference in the perception of public safety by males or females.

- 44 -
Figure 8, 9: Comparison of male and female perception of public safety at the stations during the
daytime
Figure 10, 11: Comparison of male and female perception of public safety at the stations during
the nighttime Figure 10 (male) and Figure 11 (female) represent the perception of public safety at the stations during nighttime. When these two figures are compared, it is obvious that there is a difference in perception of public safety by males or females. In other words, women of each age group felt less safe during night hours than men. What is also worth mentioning is that both man and woman, with increase of age, felt in general less safe. The same results could be expected in this research as well. 3.3. The Variables for an Assessment of Spatial Experience - Procedure variables These variables play an important role in the process of collecting necessary information, influenced by how the research subject is presented and the ways responses are registered. In that sense, two type of methods can be distinguished: presentation methods and response methods. 3.3.1. Presentation and Response Method By selecting a specific presentation method, a choice is made regarding the way in which the environmental characteristics, in this case the underground station environment, will be presented to the observer, in this case the respondent. For this research, the user-responses were obtained through questionnaires: •= the questionnaire was given to the people who were already acquainted with the station, since
specific questions were asked which required some reference to the environment and the possibility to personally relate to the studied station
0
10
20
30
40
50
60
15-24 25-29 30-39 40-49 50-64 65+
very unsatisfiedunsatisfiedsatisfied very satisfied
female
0
10
20
30
40
50
60
15-24 25-29 30-39 40-49 50-64 65+
very unsatisfiedunsatisfiedsatisfiedvery satisfied
male
0
10
20
30
40
50
60
15-24 25-29 30-39 40-49 50-64 65+
very unsatisfiedunsatisfied satisfied very satisfied
female
0 10 20 30 40 50 60
15-24 25-29 30-39 40-49 50-64 65+
very unsatisfiedunsatisfiedsatisfiedvery satisfied
male

- 45 -
•= the questions were closed, which means that the respondent could provide an answer in a form yes or no, or grade the question on a certain scale
•= photos were used as well, especially where some detailed questions were asked. Also colored photos were used where required to provide a realistic situation as possible
Another important remark is the way in which the survey was carried out. For one station (Rijswijk train station), two types of surveys were conducted: •= in the first survey, 20 respondents were asked to fill in the questionnaire. Afterwards, the
respondents were asked to comment on the questionnaire •= the second survey was carried out using a revised form (written questionnaire with targeted
1000 respondents) There are two main reasons for repeating the questionnaire for the Rijswijk train station and they are the following: •= to check whether the questions were clear enough and to improve the ones with which the
respondents had difficulty in filling in the answer •= to check the reliability and validity of the questionnaire This questionnaire was used for another three locations, with some slight modifications, which were mainly related to a specific site. 3.3.2. Reliability and validity Reliability and validity are important components of any experimental research. A certain measurement is considered reliable if similar results are obtained when the measurement of the behavior is repeated. If the research were not reliable, then it would be almost impossible to determine what specific measurements mean. If a measurement error between two repeated measurements were high, it would mean that the reliability is low. If the measurement error is low than the reliability is high (Goodwin, 1998). Validity means that the researcher measures exactly what is supposed to be measured. In the literature, three types of validity are mentioned in Table 1 (Goodwin, 1998, p.108,109,494,496): Table 1: Three types of research validity (Goodwin, 1998) research validity face validity – Occurs when a measure appears to be a reasonable measure of some trait (e.g., as a measure of intelligence, problem solving has more face validity than hat size) criterion validity – Form of validity in a psychological measure that is able to predict some future behavior or is meaningfully related to some other measure construct validity – In measurement, it occurs when the measure being used accurately assesses some hypothetical construct; also refers to whether the construct itself is valid; in research, refers to whether the operational definitions used for independent and dependent variables are valid
Validity addresses the measurement issues regarding the nature, meaning or definition of a concept or variable (McGrew, 1993). The architectural design is saturated with complex variables for example, 'overview' or 'attractiveness of space'. To express a true meaning of these concepts
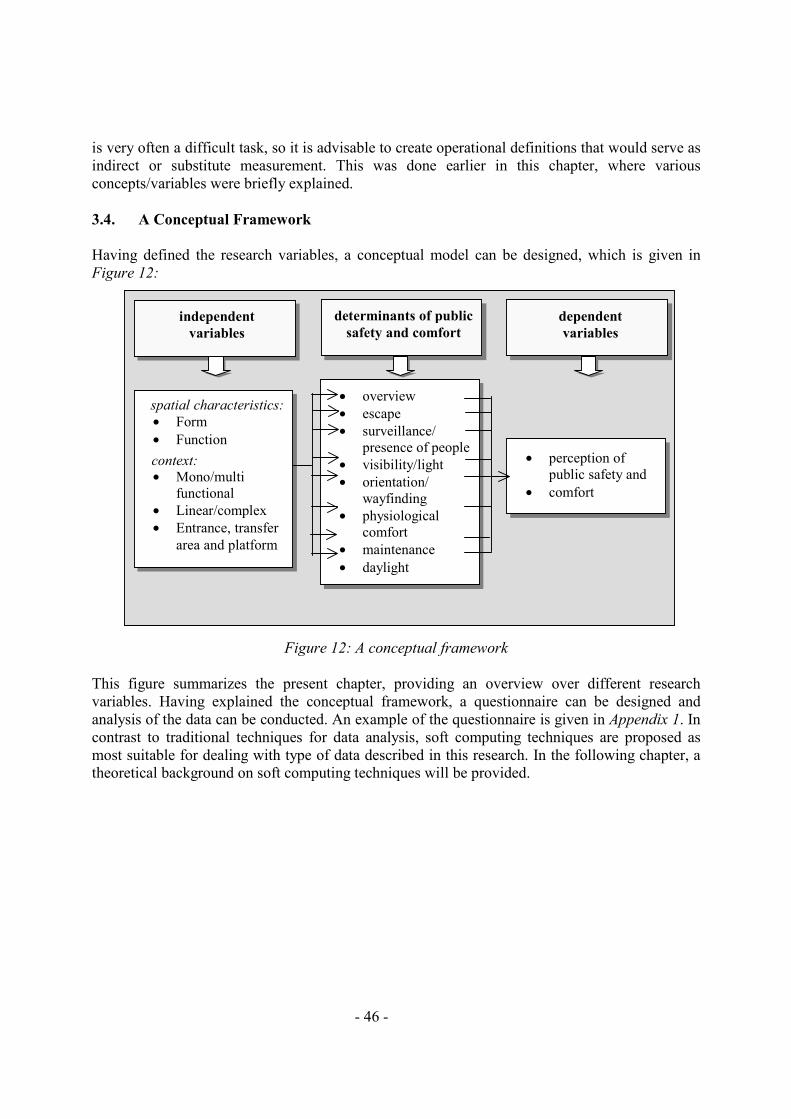
- 46 -
is very often a difficult task, so it is advisable to create operational definitions that would serve as indirect or substitute measurement. This was done earlier in this chapter, where various concepts/variables were briefly explained. 3.4. A Conceptual Framework Having defined the research variables, a conceptual model can be designed, which is given in Figure 12:
Figure 12: A conceptual framework
This figure summarizes the present chapter, providing an overview over different research variables. Having explained the conceptual framework, a questionnaire can be designed and analysis of the data can be conducted. An example of the questionnaire is given in Appendix 1. In contrast to traditional techniques for data analysis, soft computing techniques are proposed as most suitable for dealing with type of data described in this research. In the following chapter, a theoretical background on soft computing techniques will be provided.
independent variables
determinants of public safety and comfort
dependent variables
• perception of public safety and
•= comfort
•= Form •= Function
• overview •= escape •= surveillance/
presence of people •= visibility/light •= orientation/
wayfinding •= physiological
comfort •= maintenance •= daylight
spatial characteristics:
•= Mono/multi functional
•= Linear/complex •= Entrance, transfer
area and platform
context:
- 47 -
CHAPTER 4
Theoretical background on soft computing 4.1. Introduction In previous chapter, the focus was mainly on systematization of the variables that influence people’s perception of public safety and comfort in underground spaces. As a final product, a conceptual model was developed that can serve as a base for questionnaire design and data compilation. However, before developing a questionnaire it is first necessary to select the most suitable method to deal with such data. Having in mind the characteristic of the data at hand, which is qualitative, it becomes evident that the invocation of certain tools dealing with vague and imprecise information becomes essential for knowledge modeling. This implies that the model should be fault tolerant, in other words capable of robust computation. The techniques needed for such modeling can be found within ICT, or more specifically within a domain of Information Technology whose focus is on information processing and knowledge modeling. These techniques make it possible to apply ICT in the building sector as a partner. The reasons for choosing these techniques, as well as their theoretical background, will be briefly explained in this chapter. 4.2. Traditional methods for data analysis Traditional well-established methods, such as statistical analysis, have been mainly used for data analysis regarding similar type of present research. These methods mainly fall into the category of pattern recognition. Statistical regression methods are the most common approaches for this goal. However, there are several drawbacks of these methods (Arain, 1996). One essential drawback is the inability of dealing efficiently with non-linear data. With statistical analysis, the linear relationships are established by regression analysis, but dealing with non-linearity is mostly evaded. This is due to the complexity of intended task, in this case, and relatively much less availability of mathematical methods to deal with the complexity due to the non-linearity involved. In general, to avoid the non-linearity to some extent, linearization methods are developed as an alternative approach to the solution so that the problem is simplified. In statistical analysis, using the linear models, most commonly applicable conclusions are drawn in the context of trend analysis. Incidentally, in addition to the complexity of modeling induced by

- 48 -
non-linearity in a simple statistical regression problem, for the same task multivariable regression might be formidable. With 43 independent (input) variables and two dependent variables, (namely, comfort and safety), discussed in previous chapters, it is evident that the assumption of a linear relationship among the dependent and independent variables would be a gross approximation. Such a model would not reveal to what extent it is legitimate, since the results are obtained regardless. A starting point in this research is that there can be both linearity and non-linearity present in the data and therefore appropriate methods should be used in order to deal properly with the data. For this reason, a decision was made not to use statistical analysis but other commensurate methods, in order to deal with the data. In that respect, a decision was made to explore the possibilities of soft computing techniques, as these techniques match the quality of the existing data set subject to analysis. This data set is deemed 'soft'. The data involved in this work is vague/fuzzy in a sense that the samples represent categorical intervals of the sample space rather than exact descriptions of a state or status. To deal with such data by statistical methods provide results in the form of some statistical parameters or statistical model parameters with gross approximation. This is due to both unknown statistical properties of the data samples and underlying statistical models. Therefore, any assumed model cannot have justification beyond conjecture. Moreover, the most suitable statistical model for data analysis is multivariate linear model as this would be the most meaningful in this case. However, this approach would force the data to be linear in order to satisfy the minimum error criterion of the model error. Eventually such methods would be seriously flawed because of forced gross approximation and assumptions. In contrast with this, the soft computing method deals with the present data without any parametric assumptions of the model. In other words, the model is formed by means of the data, and afterwards, accurate model parameters. Therefore, such general model is referred to as 'non-parametric' in contrast with the linear statistical models, which are referred to as 'parametric'5. In Chapter 6, Section 6.3.2., a detailed comparison between parametric and non-parametric models is given. For reasons stated above and having in mind earlier statements regarding complexity of architectural design (Chapter 2), modern information processing technologies are quite appealing for supporting effective and efficient design decision-making. Conventionally, such a process takes a long time, due to lengthy deliberations necessary before the appropriate decision-making can be carried out. In that respect there is a need for Artificial Intelligence (AI) methods in order to deal with soft data and to increase the efficiency of the knowledge modeling process. 4.3. Artificial intelligence Although the concept of AI dates back more than four decades, its conventional articulation dates back some two decades, after introduction of microprocessors, following the mini-computer era in 70s. At that time, intelligence was loosely defined as "having memory" in an autonomous environment. In this respect, even a very simple household appliance, rightly or wrongly, was referred to as intelligent. However, with the advance of science and technology, today it is not enough to refer to a computer based system as "intelligent" if a computer-based application in
5 The unsuitability of traditional statistical modeling methods and suitability of soft computing methods for the soft data at hand was initially pointed out by prof. Ö. Ciftciouglu, which lead to a joint publication (Ciftciouglu, et. al., 1999)

- 49 -
some way or other has "memory". Additional qualities are required. Thinking and reasoning are properties closely related to intelligence (Bellman, 1978). Taylor (2000) defines intelligent systems as those that "have an ability to transform meaningful internal representations so in order to obtain new ones that satisfy pre-defined goals". However it is still not very clear what qualities have to be present to deem a system/device "intelligent" and this issue is still, in principle, open. Presumably, in the course of time this concept will be refined and cease to be controversial. For the purpose of definition, AI can be defined as the ability of a machine (computer, robot, etc.) to perform tasks that are usually associated with intelligent human abilities, such as reasoning, discovering meaning, learning from past experience and generalization. The AI methods use their own tools to deal with knowledge. The main paradigms are Artificial Neural Networks (ANN), Fuzzy Logic (FL) and the combination of these two as neuro-fuzzy systems. These are studied under the category of soft computing. The related technologies, such as expert systems, are correspondingly meant to be "intelligent technologies", although this is not necessarily the case. This is explained later in the text (Section 4.5). 4.4. Soft computing techniques One of the emerging information processing technologies, which became outstanding in recent years, is known as soft computing. Because of its new appearance, the definition of soft computing may vary, according to the context at hand. The term soft computing was coined by Zadeh who describes it as a collection of methodologies that aim to "exploit tolerance for imprecision, uncertainty and partial truth to achieve tractability, robustness, and low solution cost" (Zadeh, 1993; Zadeh, 1994a; 1994b). It is an emerging approach to computing, which parallels the remarkable ability of the human mind to reason and learn in an environment of uncertainty and imprecision. This makes it appealing for application in complex environments (Chen et. al., 1999). In plain terms, it is the processing of uncertain information with the methods, methodologies, and paradigms of artificial neural networks (ANNs), fuzzy logic (FL) and evolutionary algorithms. The main reason that these technologies are today more exploited is because of their advantage over classical computing theories and models, which were often found to be incapable of dealing with such information. The main characteristic of these different methodologies is that they are not competitive, but complementary to each other and therefore are very often used in a combined form, in so-called ‘hybrid systems’. For this work ANNs and FL, are combined in a special form. This combination is appealing due to its special properties, which will be explained in more detail in the following sections. 4.4.1. Artificial neural networks Artificial Neural Networks (ANNs) are biologically inspired computational models. They have analogy to the human brain, which is the best example of a successfully operating, fault tolerant parallel processing system. ANNs consist of processing elements, called artificial neurons, with connections between them, and weights bound to the connections. This together constitutes the neuronal structure. The ANNs have been successfully used in areas where observational data is accumulated and goal-oriented processed, as it is the case for the data accumulated in this research. Among others, the ANNs have been successfully used in the medical science, where, based on a patient’s symptoms, a diagnosis of a disease is obtained, and further treatment related to specific disease

- 50 -
can be provided (Figure 1). In a similar way, this can be applied to design as well. According to specific spatial characteristics (symptoms), the state of underground spaces can be obtained through a users' point of view (diagnosis), and eventual steps can be proposed to improve the quality of these spaces in a form of the guide lines (treatment).
Figure 1: Neural Network application in medical science The assumption was made that people, in general, are consistent in the answers they provide, making it possible to train the network to ensure satisfactory performance. The control questions posed in the questionnaire were used to check the consistency of the respondents as it will be explained in Chapter 4. If for some reason a neuron or its connections are damaged, recall of a stored pattern is damaged as well. However, due to the distributed nature of information the damage has to be significant before the overall performance of the network is seriously impaired (Haykin, 1999). Fault tolerance is a distinguishing characteristic of neural networks. Although one of the characteristics of the ANNs is the ability to perform robust computation, still an effort was done to remove certain cases where the respondents were not consistent in their answers. This was done mainly for confidence in the data used for processing, and knowledge modeling. A biological and artificial neuron In biological neural networks, a neuron (Figure 2) receives a signal and produces a response. The synapses are the places where the information is stored and they are the contact points between different neurons. Dendrites receive the signal from the synapses and conduct the information to nucleus. The nucleus, also called a cell body or soma, produces all necessary chemicals for the continuous working of the neuron. An output signal is transmitted by the axon (Khanna, 1990; Rojas, 1996; Kasabov 1996).
Figure 2: A biological neuron According to biological structure of neuron, an artificial neuron is created, as shown in Figure3.
Neural Network
OUTPUT Diagnosis
y INPUT Symptoms
1, 2, 3, ……… x
DENDRITES
NUCLEUS
AXON
SYNAPSES
SKETCH OF A NEURON SHOWING COMPONENTS
SYNAPSES

- 51 -
Figure 3: An artificial neuron An artificial neuron consists of the input channels, a processing element and an output channel. Synapses are simulated by contact points between the nucleus and input or output connections to which a certain weight is associated. This means that the incoming information xn is multiplied by the corresponding weight wn. Figure 3 shows the composition of abstract neuron with n number of inputs X. The transfer function transfers its input information to the output with a transformation, without any other formal definition what that might be. It is also called an activation function. The transmitted information is integrated in the following neuron for the same processing sequence. Considering each node in an artificial neural network as a transfer function that is capable of transforming its inputs to its outputs it could be stated that ANNs are networks of transfer functions. In that respect, "different models of artificial networks differ mainly in their assumptions about the primitive function used, the interconnection pattern, and the timing of the transmission of information" (Rojas, 1996, pp. 23). Neural networks are "model free estimators" (Kosko, 1992) in the sense that they are universal function approximators, meaning that it is not necessary to know the type of a function in order to approximate that function (Kasabov, 1996). Feed-forward neural network In order to explain the architecture of ANNs, a layered feed-forward network is considered. The name already indicates that the network has layers, which are different groups of processing elements. Each layer of processing elements makes an autonomous computation on data provided to that layer and passes the results to another layer. These processing elements can be seen as neurons in the human brain. Each processing element makes its computation based on a weighted sum of its inputs. In a simple neural network example, there are 3 layers present. The first layer is the input layer, that receives the input data and the last layer is the output layer that represents the output data. In-between these two layers is a so-called hidden layer where the transfer functions are placed. An example of 3-layered network architecture is shown in Figure 4. With the circular nodes, the neurons are presented, while the lines connecting different nodes indicate the connection from nodes in one layer to nodes in other layers.
WjoWj1
Wj2
Wjn
Wji
Xo
X1
X2
Xi
Xn
SUM IjTransfer
Function
OUTPUT PATH
Yj
PROCESSINGELEMENT
.
.
.
WEIGHTS
j-th ARTIFICIALNEURON
Artificial Neuron

- 52 -
Figure 4: An example of a feed-forward neural network The weights that are applied on the connections between layers play an important role in the operation of a neural network. These weights are adjusted. This process of re-adjusting weights is called training. During training, a learning process takes place, since the weights are altered until a desirable network performance is achieved. The connection weights are the ‘memory’ of the system. Learning may be supervised or unsupervised: •= Supervised learning means that both input vectors x and output vectors y are known so that
the inputs are applied together with the expected outcome. In that case training is performed until the neural network 'learns' to associate each input vector x with its corresponding and desired output y. In that way the network is modeled by input-output pairs.
•= In unsupervised learning, only the inputs are known and this type of learning is termed ‘self-organizing’. In this case, the neural network learns some internal features of the whole set of all input vectors presented to the network (Rao and Rao, 1995; Kasabov, 1996).
Concerning the data used in this work, a supervised learning is most convenient since both inputs and outputs are known. Structure, encoding and recall in neural networks There are various types of neural networks like the feed-forward network, self organizing network, recurrent networks etc. The difference between these various models lies in their structure, encoding and recall (Rao and Rao, 1995). •= Structure is related to the architecture of a neural network in relation of the number of layers
used and interconnections between neurons in the network. •= Encoding (training) refers to the method of changing weights on the connections between
neurons •= Recall is related to the method and capacity to retrieve information or in other words for a
given input, an expected output is obtained. In this respect, there are two types of recall: auto-associative and hetero-associative. In auto-associative type, the input vector is associated with itself as the output, whereas in hetero-associative type there is a recall of an output vector for a given input, as is the case with the data considered in this work. An example of auto-associative type is shown in Figure 5 and of hetero-associative type in Figure 6.
input
hidden layer(transfer function)
output
w (i,k)
weights
Σ Σ Σ
TF TF

- 53 -
Figure 5: Auto-associative types of Neural Network
Figure 6: Hetero-associative types of Neural Network (Kasabov, p. 262, 1996) The recall process is characterized by generalization, meaning that similar stimuli (inputs) recall similar patterns of activity (output). Generalization is the ability of a system to process new, unknown input data in order to obtain the best possible solution, or one close to it. The generalization ability of a network determines for each new input how well it can relate the input space to the output space. The opposite of generalization is memorization, which means that neural network memorizes all inputs with its corresponding outputs, which makes the network prone to error if a new case does not match one of the known input/output pairs. For that reason memorization is in general avoided, meaning that the over-training of the network is not desirable (Rao and Rao, 1995; Kasabov, 1996). An indication regarding relationship between training error and generalization error in respect to the amount of cases introduced to the network is well known (Bengio, 1996). Some more details are provided in Figure 7.
Figure 7: Generalization and training error in respect to number of training cases
Xthe input
space (domain)
inputs
outputs
Ythe output
space (domain)
X the input
space (domain)
Ythe output
space (domain) inputs
outputs
training errorEt
generalization error (Eg)
summation Et + Eg
Y error
X
range for selecting a number of nodes
Ro number of cases
- 54 -
Figure 7 illustrates that with an increased number of cases, a training error approaches zero, but that generalization error increases. If all cases were to be used in the hidden layer, it would mean that training error is virtually zero and that the network during the training phase memorized all input/output associations. This is not a desirable situation as has been explained earlier. How then can one determine an optimal number of nodes? For that purpose, the summation curve is generated. That curve represents the sum of the training and generalization error, and somewhere on that curve lies the minimum error. More precisely, that minimum is somewhere in the range Ro but it is not necessarily important to search for that minimum, since the error in that whole range is almost the same. This gives us a freedom for choosing a number of nodes in the hidden layer within a particular range rather than searching for the exact minimum. The performance of ANNs increases with the number of cases it learns. Therefore, it is essential to provide sufficient amount of data used for neural network training. This means that in a theoretical sense, all data available should be placed in the system. However, practically this is not always possible. In that respect, samples should be as large as one can afford. Sample size depends greatly on the characteristic of input/output data, related to eventual redundant information and the range. It is also dependent on networks architecture in relation to the number of input/output pairs. Some of the main characteristics of ANNs, discussed until now are: •= Nonlinearity •= Input-output mapping •= Learning and generalization •= Fault tolerance (robustness) •= Analogy with human brain This all together makes the ANNs highly suitable for dealing with complex problems, where vague and imprecise data is present and nonlinearity is expected. Choosing a neural network model Up until now, the main features of neural networks were provided. In order to choose a neural network model for specific data, certain steps should be followed, as explained by Kasabov (1996): 1. Problem identification in order to identify the type of the problem and the type of knowledge
available 2. Choosing an appropriate neural network model that can solve that problem 3. Preparing data for network training 4. Training of neural network based on prepared data 5. Testing the generalization capabilities of the trained network and validating the results 6. Optimizing the network architecture. This may require repetition of the above mentioned
phases until a required network performance is obtained During the first two phases, answers to some questions must be provided to identify the suitability of neural networks for specific problems. In that respect it should be established what the benefits of using neural networks are, and why they should be used, as is discussed earlier in

- 55 -
the text. This implies that general properties of different types of neural network models must be known in advance. At the same time, the type of knowledge available must be identified. If the knowledge is unavailable, certain methods for knowledge acquisition have to be defined. Therefore, it is necessary to clearly distinguish the independent variables (input variables for the network) and the dependent variables, which are the output variables. The knowledge representation was systematically explained in Chapter 3. Once these variables are known, the proper network architecture and learning method can be selected. Earlier in the text, some indications were already made to select a proper neural network model for the data considered in this work. For example, that it should be a hetero-associative type, with supervised learning and an optimal number of hidden nodes. During the third phase, the encoding of the information takes place, meaning that a choice should be made regarding the information and knowledge representation in the neural network. It may be that there is a missing variable in the training sets. In that case, the training sets with missing variable may be omitted if enough data is available. Another solution may be to substitute the missing variable by the mean value for that particular variable over the whole data set. Another important issue is related to the choice of an appropriate number of variables. If there are too few variables, they may not provide enough information to train the network. If there are too many variables, then the unimportant ones may affect the network performance by increasing the noise level, since there may be redundant information. According to Kasabov (1996) one way of dealing with this problem may be to conduct a sensitivity analysis to establish which variables are not important and to exclude them from the model. This would require a certain number of additional experiments in order to conclude that the knowledge model would significantly improve if the redundant information were excluded. More discussion related to sensitivity analysis is given in Chapter 6, but more in relation to knowledge elicitation. Training neural network and validating the results are the fourth and fifth phase. Here, the decision should be made regarding learning strategies, for example, to decide whether to divide the data into subgroups and train accordingly, or use the whole available data and train one network. In the process, technical issues related to training should be considered as well, such as the type of training algorithm that would best suit the data at hand, or how to calculate the training error and evaluate the generalization capability of the network. In order to validate results it is necessary to test the network performance to check whether the network provided satisfactory results for unknown cases. Under unknown cases, cases not used as training sets are considered. This can be done in different ways. In the case that there is a large amount of data, data sets can be divided into two groups. One far larger set would be the training set, and another much smaller set would be the testing set. Having trained the network on the training data set, the validation would be done by introducing the testing set (unknown cases) and checking the network performance. If there is not much data available, then another method can be used, known as leave-one-out method. In that case, network is trained on all data sets except one that is used for validation. This process is repeated N times, with N being a total amount of cases. Thereafter the average of all errors can be calculated to find out what the approximation error is or in other words how well the network is performing. The last phase is the optimization of network architecture. In this phase, some experiments can be done in order to minimize the approximation error. Some methods for that are growing neural

- 56 -
networks or pruning, as explained in (Kasabov, 1996), or regularization method explained in (Bouman, 1998; Ciftcioglu, et. al., 2001). The last three phases are dealt with later in Chapter 6. All of the above mentioned phases are covered throughout the thesis in order to obtain an optimal knowledge model for the data at hand. As building design is a knowledge intensive problem, most modern building design problems are either too complex or too ill defined to analyze with conventional methods. It also means, that the ANNs, as explained in the previous section, needs crisp/definite inputs in order to perform a required task. This requires additional tools that can represent the data in a desired form. Regarding the data considered in this work, it is obvious that this is not crisp data, but fuzzy and vague data. For that reason, the fuzzy logic is invoked. By defining qualitative aspects as a fuzzy set, one can perform inexact reasoning with optimal information routing and design decisions. 4.4.2. Fuzzy logic In general, fuzzy logic represents concepts and techniques that enable us to deal with imprecision and approximate reasoning. In that respect, there is an obvious difference between a classical and a fuzzy set. Under a classical set, a set with clearly defined boundaries is understood. If a set A = "very fast driving" and x = "speed (km/h)", then for example, a classical set A of real numbers that is greater than 75 can be expressed in the following manner: A = { x | x > 75} In such an expression, there is a clear boundary, meaning that if x is greater then 75, x does belongs to a given set A. Otherwise, if it is less than 75, it does not belong to that set. In other words, if a person is driving 75 km/h than we would define that as very fast driving. The problem with such classical set is that if a person drives 75.001 km/h would be classified as a very fast driver, while a person driving 74.999 km/h would not be classified as such. This is not a natural way to classify a very fast driver. This appears since there is a very sharp transition from whether to include or exclude value from a defined set. For that reason, a more smooth transition that provides more flexibility in modeling commonly used linguistic expressions is desirable. This is provided by fuzzy set, meaning that there are no such boundaries as in a classical set (Jang, et. al., 1997). Fuzzy set theory and fuzzy inference systems have been introduced by Zadeh (1965,1973). Fuzzy logic explicitly aims to model the imprecise form of human reasoning and decision making. These are essential to our ability to make rational decisions in situations of uncertainty. We encounter such imprecise cases often in real life situations. We encounter human reasoning that utilizes imprecise propositions, and infers imprecise consequences. Fuzzy propositions are the most distinguishing property of fuzzy logic. An example of such reasoning can be exemplified by a car driving using the form "if the speed is high then slow down". This heuristic rule does not specify at exactly which point the speed becomes high, nor does it specify the amount by which the speed is reduced. Yet, it is still possible to apply this rule to satisfactorily control the speed of the car. The fundamental concept of fuzzy logic is known as the linguistic variable. A linguistic variable is a variable that takes values from spoken language. Such variable needs to be transformed to

- 57 -
numerical values. A variable is called numeric if its values are numbers (5 meters, or 15˚C). A variable is called linguistic if its values are expressed as linguistic terms (high, wide, cold, fast etc.). The linguistic variable can be expressed through a set of values, beginning with primary term (high) and placing on the opposite end its antonym (low). All other values are constituted from these two basic terms. The meaning of every term (quite high, or very low) can be represented by Zadeh's fuzzy set and derived from the fuzzy sets related to base terms (Kerre and Cock, 1999; Zadeh, 2000). Continuing with the example of driving a car, such a variable can be assigned as slow, medium, fast and very fast. Although these values do not have precise meaning, a certain distribution between zero and one can be defined and associated with the values. Thus, a speed of 30 km/h can be defined as medium assigning the value 1 for this speed. Any speed around 30 km/h is medium, but the degree of being medium will vary, and will be less than that assigned to 30 km/h. The more the speed differs from 30 km/h, the lower the degree of association will be. Such a distribution is commonly referred to as the membership function of the linguistic variables. These linguistic variables are called fuzzy variables. A frequent approach to transform a measurement into a fuzzy categories are by use of triangular or trapezium-shaped membership functions (Rojas, 1996). The universe of discourse of a fuzzy variable is the finite input space for which the membership functions are defined. The shape of the membership functions is dependent on the attributes of the underlying concept, and can be represented by any normalized function. Each point in the input space has a degree of membership, which defines the degree to which that point belongs to a given fuzzy value. The membership value is conventionally shown by µ = [0., 1.]. Figure 8 represents the distributions of four linguistic values of speed using trapezoid-like functions as fuzzy sets. These are the fuzzy membership functions and the universe of discourse is [0, 90] for this particular example.
Figure 8: Example of fuzzy sets of speed The concept of approximate reasoning plays an essential role in fuzzy systems. Typically, fuzzy reasoning is specified by a generalized modus ponens (Turban and Aronson, 1998): if a = A then b = B; given a = A' ; what is b ?
0 10 20 30 40 50 60 70 80 900
0.5
1
X = speed (km/h)
membership
slow medium fast very fast
- 58 -
All the values in the expressions above are represented by fuzzy sets and associated fuzzy membership functions and the implication b is derived using the fuzzy rule termed as compositional rule of inference. Conceptually, fuzzy systems are implicitly or explicitly rule-based systems, which comprise rules of the form:
where all variables and values are fuzzy (Ciftcioglu, et. al. 2000a). Figure 8 showed how a numerical value is classified into four linguistic labels. These labels may be discrete or continuous and they are the membership functions that represent the numerical strength of linguistic labels for the domain of classification. Since the membership functions can overlap, this results in multi-value representation of the knowledge. An input value intersects with one or more membership functions of the input classification and therefore it is attached to several linguistic labels. 4.4.3. Neuro-fuzzy systems: hybrid systems Direct application of ANNs in architecture is difficult because it needs crisp inputs. Direct application of FL in architecture is difficult because it needs well defined membership functions to operate well-defined rules. The problem can be overcome by using both neural and fuzzy systems together. In such a way, the difficulty of ANNs is circumvented by FL and the difficulties by FL are overcome by machine learning. In other words, the positive characteristics of fuzzy logic are utilized, such as the possibility to deal with linguistic variables as well as the advanced fuzzy information processing method. The learning and generalization capabilities are provided by artificial neural networks. This is a so-called neuro-fuzzy system, or a hybrid system (Rao and Rao, 1995; Kasabov 1996; Turban and Aronson, 1998), that would utilize the positive features of both systems and integrates them into one. Hybrid systems can be referred to as those that utilize different paradigms in order to solve a problem efficiently. The neuro-fuzzy systems are able to incorporate human knowledge, and to adapt through optimization techniques on their knowledge base to be able to solve some real-world decision-making, modeling and control problems (Jang, et. al., 1997). The summary of advantages/disadvantages of artificial neural networks and fuzzy logic is presented in Figure 9.
............
.....
2222
211
1122
111
ALSOBbTHENANDAaANDAaIF
ALSOBbTHENANDAaANDAaIF
===
===

- 59 -
Figure 9: Main features of artificial neural networks and fuzzy logic From Figure 9 it can be concluded that especially neural system can cope with complex systems while it is relatively difficult for fuzzy systems. On the contrary, it is easier to deal with linguistic variables by fuzzy systems. Therefore, the hybrid combination of two techniques is desirable that would make use of positive features of both systems. There are various types and architectures of neural networks. It is not the scope of this work to deal with them, since they are well recorded in the literature including their properties and suitability for certain data (Khanna, 1990; Rao and Rao, 1995; Russel and Norvig, 1995; Jang, et. al., 1997; Kasabov, 1996; Turban and Aronson, 1998; Haykin, 1999). However, it is important to explain the choice of radial basis function network for the type of data dealt with in this thesis. Since fuzzy logic deals with local information, naturally the type of neural network used should be related to fuzzy logic and able to deal with local information, so that fuzzy-neural interpretations of the model (conclusions) can be easily done. For this reason, a Radial Basis Function Network (RBFN) is chosen as a type of neural network applied in this research. The architecture of RBFN resembles a feed-forward neural network, which was briefly explained in previous section. Some additional details regarding RBFN is provided in the following section. 4.4.4. A Radial Basis Function Network The RBFN form one of the essential categories of feed forward neural networks. The main architectures, learning abilities, and applications are described in the literature (Brommhead and Lowe 1988; Moody and Darken 1989; Park and Sandberg 1991; Leonard, et. al., 1992; Chen and Manry 1993; Eleneyar and Shin 1994) where the learning and generalization abilities of these networks are outstanding. In particular, some interesting equivalence between RBF networks and fuzzy rule-based systems have been established (Jang and Sun 1993; Hunt, Haas, et al. 1998). In this equivalence, the normalized gaussian functions play the role of membership functions. The RBF network has appealing properties for soft computing. Next to their equivalence to fuzzy inference systems under lenient conditions, they can be used for multivariable functional approximation using basis functions. In this case the learning is equivalent to finding a surface in
artificial neural networks versus fuzzy logic
•= advanced learning methods
•= knowledge representation by learning
•= easy to deal with complex systems
• advanced fuzzy information processing methods
•= easy to deal with linguistic variables
•= extracting knowledge from network is difficult task
• learning is difficult•= difficult to deal
with complex systems

- 60 -
a multidimensional space that provides the best fit to the training data (Haykin, 1999) and that can later be used on the test cases provided that it has sufficient generalization capabilities obtained during the training process (Appendix B). A basic radial basis function (RBF) network is shown in Figure 10. Without loss of generality, the number of outputs in the network can be extended to a multi-output case. The architecture consists of an input layer, a hidden layer and an output layer. The input layer consists of the source nodes, that can be seen as a stimuli to the network, and are connected to the network environment through a hidden layer.
Figure 10: A basic RBF network architecture The hidden layer performs a nonlinear transformation from the input space to the hidden layer. The hidden layer consists of a set of radial basis functions as nodes. These functions are used as activation functions. Some of the most typical functions that are used for RBF network are inverse quadratic, inverse multiquadratic and gaussian (Chen, et. al., 1990; Cichocki and Unbehauen, 1993; Ham and Kostanic, 2001).
22
1)(σ
φ+
=r
r inverse multiquadratic (1)
The inverse quadratic is similar to inverse multiquadratic, only σ = 1, so that
1
1)(2 +
=r
rφ inverse quadratic (2)
)/exp()( 22 σφ rr = Gaussian function (3)
In Figure 11, the graphical representation of inverse quadratic and of Gaussian function is given respectively.
inputs
Hidden layer
output
Weights w (i,k)
Σ
basis function
ΦM
Input layer
Output layer
Φ1 • • • • • •
• • • •

- 61 -
Figure 11: The inverse quadratic function (left figure) and the Gaussian function (right figure)
Because of some desirable properties the Gaussian function is used. Some of these desirable properties are that: - multiplication of two Gaussian functions becomes summation of exponents, which means it
still remains a Gaussian where only parameters are changing - it is rapidly diminishing while moving away from the center so that it possesses better local
properties, meaning that more detailed knowledge modeling is possible - it plays better role to represent membership functions in fuzzy logic Each node has a parameter vector c defining a cluster center whose dimension is equal to the input vector. The hidden layer node calculates the Euclidean distance
between the center (ci) and the network’s input vector (x). In general terms, by means of clustering methods, the groups can be found where data are grouped based on measuring the distance between the data items. The calculated distance is used to determine the radial base function output. Conventionally, all the radial basis functions in the hidden layer nodes are of the same type and usually gaussian (1), where the parameter σ controls the width of the RBF. The output layer provides the response of the network to the activation pattern applied at the input layer or in other words, the network output is computed as a weighted sum of the hidden layer outputs. The response of the output layer node(s) can be seen as a map f: Rn → R, of the form
f(x) = ΣΣΣΣ wi Φ(||x - ci||)2 (4) Here the summation is over the number of training data N. ci (i=1,2,….,M) is the i-th center which may be equal to the input vector xi or may be determined in some other way; M is the number of hidden layer nodes; wi is the weight vector of the i-th center. Once the basis function outputs are determined, the connection weights from the hidden layer to the output are determined from a linear set of equations. As a result, accurate functional approximation is obtained. Complexity increases as the size of the training data increases. It is desirable to use a limited number of hidden layer nodes in order to improve generalization capability of the network. The detailed description of RBF networks can be found in the literature (Haykin 1999; Ham and Kostanic, 2001).
||=|| i2 c -x r

- 62 -
Clustering and Orthogonal Least Squares algorithm In RBFN the network operates with fuzzy computational units, which are in essence cluster centers and they constitute the essential functional components in the structure. However, from information mining and knowledge management viewpoint, these cluster centers are called receptive fields to distinguish between information mining and data mining since selection of the receptive fields differs from conventional clustering techniques. The main difference between information mining and conventional data reduction is the complexity of the data and the method of elicitation of the information being searched for. Data mining is in essence the process of data reduction. It is one of the dominant techniques of exploratory data analysis and there are a number of ways for it. Clustering is one of the essential methodologies of concern (Han and Kamber 2001; Krzysztof, et. al., 1998). Referring to the form of the computational units in an RBF structure, especially their distribution in the input space is often critical for the performance of the network. In general, in the knowledge model by RBF networks, categorically two stages can be identified. In the first stage, encapsulation of some domain knowledge is carried out. In the second stage, a parametric learning process takes place. For the encapsulation of the domain knowledge there are two main sources of this knowledge: •= A preliminary analysis of training data where the data set is preliminarily analyzed and the
receptive fields are determined. For this, general data clustering methods are of particular interest (Bezdek 1981).
•= Designer-oriented data analysis where receptive fields are formed based upon intended design goals of designer. In this respect, the preceding category concerns self-organization and this category belongs to supervised organization. In this second stage, the domain knowledge can be more explicitly emphasized in the model. This allows focusing attention on the machine learning on some essential regions of the input space. Because of this a multiresolutional character in knowledge modeling together with efficient learning is exercised.
Concerning information mining and knowledge management by RBF networks information is embedded locally in the form of a database where elicitation of information from the data requires special methods and techniques. In particular, referring to the encapsulation of the knowledge, the receptive fields are formed by means of second categorical source of information described above, where special type of supervised clustering for determination of the receptive fields is performed, as a first step. A parametric learning follows this, as a second step. These two steps in knowledge modeling are imperatively performed by orthogonal least squares (OLS) algorithm, which is well explained in the literature (Chen, Cowan and Grant 1990, 1991; Chen, Billings and Luo 1989; Ham and Kostanic, 2001). In particular, by conventional clustering, cluster centers are located anywhere in the input space, matching the clustering process to some prescribed clustering criteria. This is purely a mathematical treatment and the centers identified might have no correspondence to a physical entity or reality, meaning that these centers may not represent at all any data set/patterns presented to the network. However, for knowledge management, the model for knowledge base should be constructed on actual data rather than some mathematical abstractions derived from data. In this respect, in the OLS, the centers are
- 63 -
part of the data as receptive fields rather than clusters. This means, each receptive field is a set of data in the form of a data vector in a multidimensional input space. More explicitly, they are a part of the data reflecting the exact information present in the data to the knowledge model without any mathematical abstraction. They refer to the appropriate central locations in the model according to data at hand. By doing so, the domain knowledge is effectively emphasized by means of two important gains accomplished. In the first place, the effective management of knowledge by the appropriate distribution of the receptive fields is carried out. In the second place, the enhanced generalization capability of the knowledge model is guaranteed by selecting appropriate number of receptive fields in the model. In general, the selection of number of clusters or receptive fields in such a model is critical and therefore its appropriate selection is essential concern. In the literature, this phenomenon is referred to as the bias-variance dilemma (Duda, et al., 2001) and is usually treated in the context of neural networks (Haykin, 1999). This phenomenon plays also important role on the model developed in this research. The dilemma manifests itself by the estimations through the model. If the number of receptive fields in the model are excessive, than the model’s errors with the training data are relatively small, while the same errors are relatively high for unknown data applied to the input of the model, and vice versa. Since overall effect on the quality of the knowledge model is the combination of these two conflicting errors, the model should have appropriate number of receptive fields as optimal (see Figure 7, Section 4.4.1.). The model error obtained from the knowledge model with unknown data at its input is used as a measure for performance of the model and it is referred to as generalization error. In this context, the performance of the model is expressed in terms of its generalization capability measured by the generalization error. The design information made available to RBF network at input is basically linguistic and qualitative. In mathematical terms, if we assume that the input vector x(t) represents a p-dimensional vector of real-valued fuzzy membership grades: x(t) ∈ [0,1]p, then, the output y(t) of the model represents a q-dimensional vector of corresponding real-valued membership grades, y(t) ∈[0,1]q. This structure actually performs a non-linear mapping from a p-dimensional hyper-cube Ip=[0,1]p to a q-dimensional hyper-cube Iq=[0,1]q : x(t) ∈ [0,1]p → y(t) ∈[0,1]q
In general terms, xi (i=1,2,…,p) in x(t) represents the degree to which a qualitative input fuzzy variable xi'(t) belongs to a fuzzy set, while yj(t) (j=1,2,…,q) in y(t) represents a degree to which a qualitative output fuzzy variable yj'(t) belongs to a fuzzy set. In particular, in the present application q=1 so that y is a scalar. It is interesting to note that, complex, unknown relationships between input and output variables are accurately identified and embedded in the network structure as a knowledge base in terms of fuzzy If-Then rules, where these rules are established by machine learning. Such a network with its inherent fuzzy logic based inference system, knowledge base and input-output, forms an intelligent expert system where the inference as a response to some unknown input set is not restricted to a repertoire of rules whereas this is the case for conventional expert systems. The network gives answers according to its own internal criteria formed during the machine learning and not restricted to a human expert's knowledge domain. Such a model serves as an intelligent expert network in its particular domain. This is

- 64 -
presumably the essential advantage of machine-learning based expert systems whereby any complexity of information can be coped with. This is explained in more detail in the following section. 4.5. Artificial intelligence and expert systems in perspective In knowledge based systems, the main components are the inference system next to the database. Inference is a basic component of human reasoning. In a complex environment where an immense amount of information is present, to deal with these two components is not easy. To gain the knowledge and represent it is a difficult task and to infer some logic conclusions from this knowledge is difficult as well. The systems conventionally dealing with these two components by logic programming are referred to as Expert Systems (ES) and they are mainly used in systems called Decision Support Systems (DSS). There are various definitions of DSS (Finaly, 1986; Bosman, 1983; Turban 1998) and ES (Kasabov, 1996; Heng-Koh, 1994; Turban, 1998). DSS are computer software systems that should support a user during a decision making process related to a specific task. Expert systems are an important part of DSS, since it has a knowledge-base that contains the expert knowledge. Expert systems are computer systems that apply reasoning methodologies and knowledge in a specific domain to provide an advice or recommendation to user in a similar way as a human expert does. Based on the expert knowledge stored in the knowledge base a sort of decision support system is developed, which should help a user during decision making process. There are three main phases of constructing an expert system (Heng-Koh, 1994): 1. Knowledge acquisition 2. Interpreting knowledge by using logical rules 3. Building up a system that has a knowledge-base by using an expert system shell software or
with a certain programming language Extending this list even more, according to Turban and Aronson (1998, p. 484, 485) there are six main steps in knowledge engineering process: •= Knowledge acquisition •= Knowledge validation •= Knowledge representation •= Inferencing •= Explanation and justification •= Maintenance During these phases different problems are appearing, for example, the elicitation of knowledge from an immense amount of previously collected data, or the problem of representing incomplete or contradictory data. Another problem is related to approximate reasoning. Therefore, such systems became either primitive due to their narrow scope or bulky and clumsy because of software overhead when the scope became wider. Today these systems still did not meet the anticipated performance and are no longer to be considered as 'intelligent' as it was a case earlier. Although, the major exploitation of AI is exercised through expert systems it still does not mean that these systems are to be defined as intelligent.
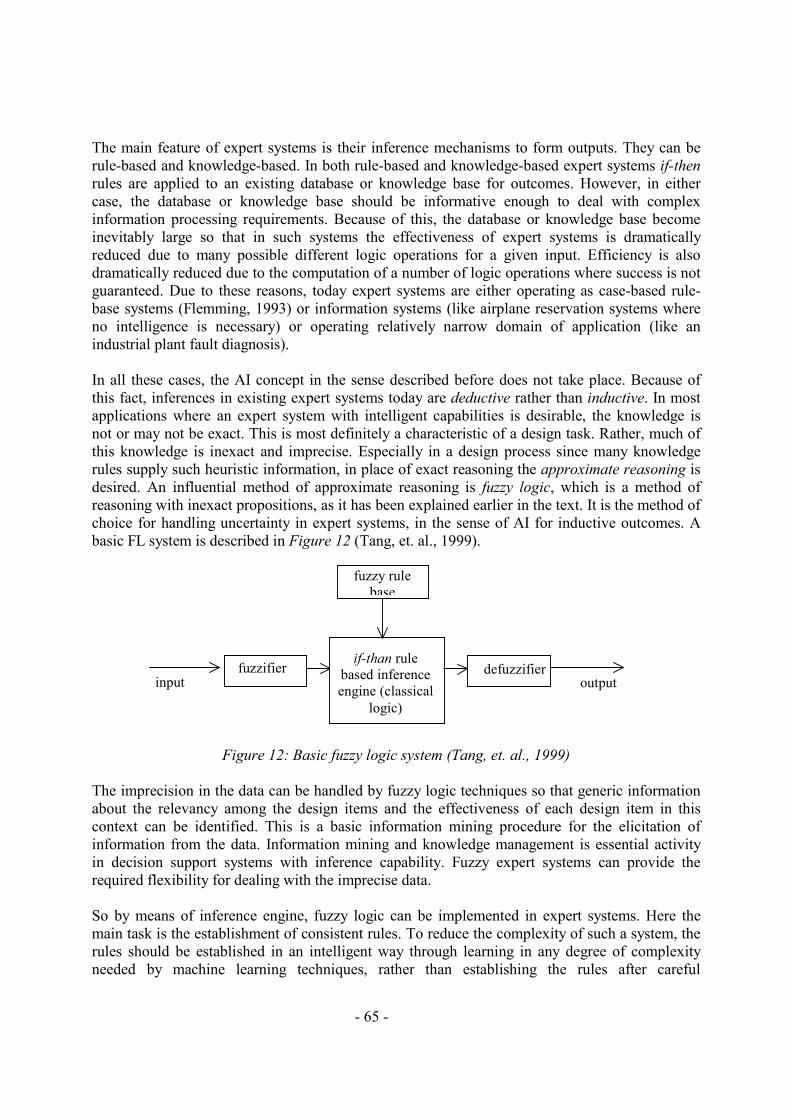
- 65 -
The main feature of expert systems is their inference mechanisms to form outputs. They can be rule-based and knowledge-based. In both rule-based and knowledge-based expert systems if-then rules are applied to an existing database or knowledge base for outcomes. However, in either case, the database or knowledge base should be informative enough to deal with complex information processing requirements. Because of this, the database or knowledge base become inevitably large so that in such systems the effectiveness of expert systems is dramatically reduced due to many possible different logic operations for a given input. Efficiency is also dramatically reduced due to the computation of a number of logic operations where success is not guaranteed. Due to these reasons, today expert systems are either operating as case-based rule-base systems (Flemming, 1993) or information systems (like airplane reservation systems where no intelligence is necessary) or operating relatively narrow domain of application (like an industrial plant fault diagnosis). In all these cases, the AI concept in the sense described before does not take place. Because of this fact, inferences in existing expert systems today are deductive rather than inductive. In most applications where an expert system with intelligent capabilities is desirable, the knowledge is not or may not be exact. This is most definitely a characteristic of a design task. Rather, much of this knowledge is inexact and imprecise. Especially in a design process since many knowledge rules supply such heuristic information, in place of exact reasoning the approximate reasoning is desired. An influential method of approximate reasoning is fuzzy logic, which is a method of reasoning with inexact propositions, as it has been explained earlier in the text. It is the method of choice for handling uncertainty in expert systems, in the sense of AI for inductive outcomes. A basic FL system is described in Figure 12 (Tang, et. al., 1999).
Figure 12: Basic fuzzy logic system (Tang, et. al., 1999)
The imprecision in the data can be handled by fuzzy logic techniques so that generic information about the relevancy among the design items and the effectiveness of each design item in this context can be identified. This is a basic information mining procedure for the elicitation of information from the data. Information mining and knowledge management is essential activity in decision support systems with inference capability. Fuzzy expert systems can provide the required flexibility for dealing with the imprecise data. So by means of inference engine, fuzzy logic can be implemented in expert systems. Here the main task is the establishment of consistent rules. To reduce the complexity of such a system, the rules should be established in an intelligent way through learning in any degree of complexity needed by machine learning techniques, rather than establishing the rules after careful
fuzzifier if-than rule
based inference engine (classical
logic)
output defuzzifier
fuzzy rule base
input
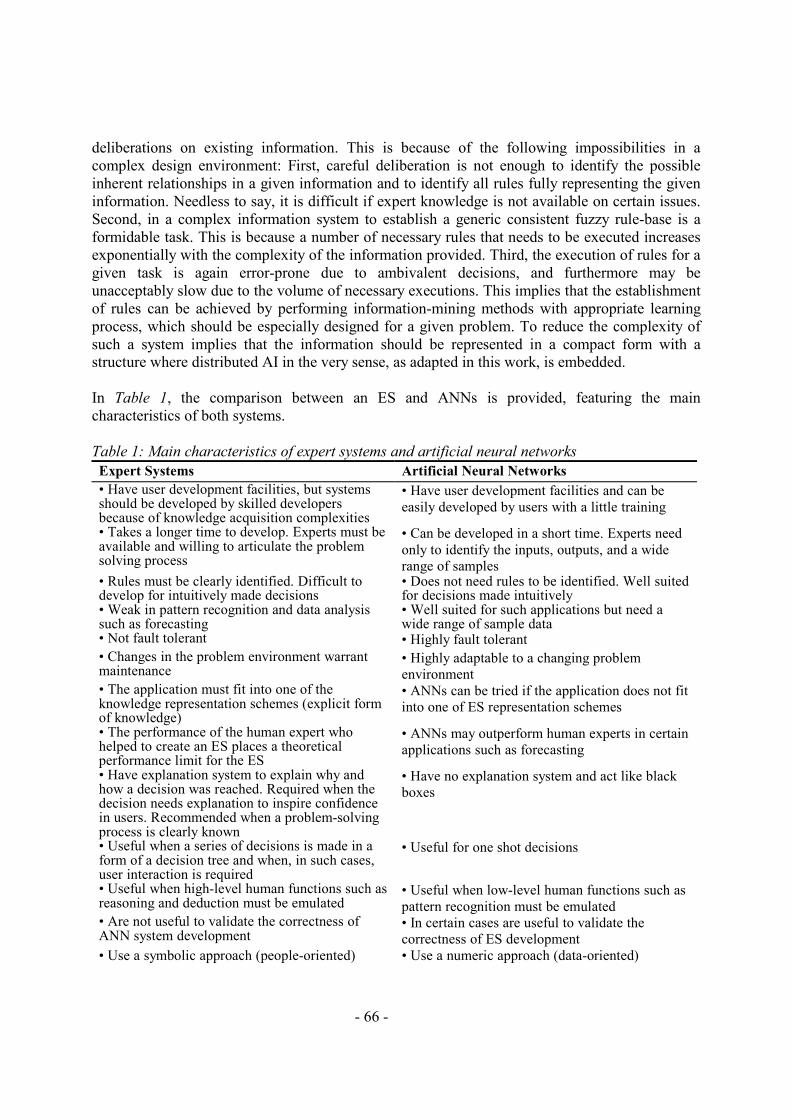
- 66 -
deliberations on existing information. This is because of the following impossibilities in a complex design environment: First, careful deliberation is not enough to identify the possible inherent relationships in a given information and to identify all rules fully representing the given information. Needless to say, it is difficult if expert knowledge is not available on certain issues. Second, in a complex information system to establish a generic consistent fuzzy rule-base is a formidable task. This is because a number of necessary rules that needs to be executed increases exponentially with the complexity of the information provided. Third, the execution of rules for a given task is again error-prone due to ambivalent decisions, and furthermore may be unacceptably slow due to the volume of necessary executions. This implies that the establishment of rules can be achieved by performing information-mining methods with appropriate learning process, which should be especially designed for a given problem. To reduce the complexity of such a system implies that the information should be represented in a compact form with a structure where distributed AI in the very sense, as adapted in this work, is embedded. In Table 1, the comparison between an ES and ANNs is provided, featuring the main characteristics of both systems. Table 1: Main characteristics of expert systems and artificial neural networks Expert Systems Artificial Neural Networks • Have user development facilities, but systems should be developed by skilled developers because of knowledge acquisition complexities
• Have user development facilities and can be easily developed by users with a little training
• Takes a longer time to develop. Experts must be available and willing to articulate the problem solving process
• Can be developed in a short time. Experts need only to identify the inputs, outputs, and a wide range of samples
• Rules must be clearly identified. Difficult to develop for intuitively made decisions
• Does not need rules to be identified. Well suited for decisions made intuitively
• Weak in pattern recognition and data analysis such as forecasting
• Well suited for such applications but need a wide range of sample data
• Not fault tolerant • Highly fault tolerant • Changes in the problem environment warrant maintenance
• Highly adaptable to a changing problem environment
• The application must fit into one of the knowledge representation schemes (explicit form of knowledge)
• ANNs can be tried if the application does not fit into one of ES representation schemes
• The performance of the human expert who helped to create an ES places a theoretical performance limit for the ES
• ANNs may outperform human experts in certain applications such as forecasting
• Have explanation system to explain why and how a decision was reached. Required when the decision needs explanation to inspire confidence in users. Recommended when a problem-solving process is clearly known
• Have no explanation system and act like black boxes
• Useful when a series of decisions is made in a form of a decision tree and when, in such cases, user interaction is required
• Useful for one shot decisions
• Useful when high-level human functions such as reasoning and deduction must be emulated
• Useful when low-level human functions such as pattern recognition must be emulated
• Are not useful to validate the correctness of ANN system development
• In certain cases are useful to validate the correctness of ES development
• Use a symbolic approach (people-oriented) • Use a numeric approach (data-oriented)

- 67 -
• Use logical (deductive) reasoning • Use associative (inductive) reasoning • Use sequential processing • Use parallel processing • Are closed • Are self-organizing • Are driven by knowledge • Are driven by data • Learning occurs outside the system • Learning occurs within the system • Are built through knowledge extraction • Are built through training, using examples
Source: Adapted from J. R. Slater et al., "On selecting appropriate technology for knowledge systems", Journal of Systems Management, Vol. 44, No. 10, October 1993, p. 15 The imprecision in the data can be handled by FL techniques so that generic information about the relevancy among the data items and the effectiveness of each data item in this context can be identified. This is a basic procedure of the elicitation of information from the data. Since the present expert systems use a knowledge database for inference, it is rule-based programming using static knowledge. Rules cannot be extrapolated or interpolated for the cases, which do not match the patterns present in the rule-based system. Therefore, the integration of soft computing to traditional expert systems is necessary to consider such systems intelligent. In this work, fundamental decision-making by FL is maintained. The executions are done and controlled by the knowledge system itself to ensure the right decision-makings totally consistent with it. Fuzzy logic is an important part of expert system and artificial intelligence, but still the knowledge modeling part needs to be accomplished. It is a time consuming process and almost impossible to identify all possible relationships and establish rules. Therefore, the knowledge modeling should be automated which would increase the efficiency and eliminate subjectivity of a system designer. In that respect, knowledge modeling can be accomplished by machine learning techniques, which would automate the modeling process. This technique is very often used in neural networks. In the following chapter, the case studies are briefly explained, including some preliminary results. These provide insight regarding the population statistics in the questionnaire, and check whether some findings are the same as those from previous studies.

- 68 -

- 69 -
CHAPTER 5
Experimental research: Case studies and data acquisition
5.1. Introduction Based on tentative relationship diagram, which was given in Chapter 3, Figure 7 and the conceptual framework provided in Figure 12 in the same chapter, a questionnaire could be developed. The information obtained from this questionnaire can later be used for knowledge modeling. For that purpose, it is first necessary to select case studies, in this case underground stations, for which the questionnaire would be prepared. In this chapter the selection of case studies as well as the brief description of them is provided. Afterwards, for each station a questionnaire was developed in co-operation with the clinical psychologist6. More precisely, one model of a questionnaire was developed and later applied and where necessary modified for each particular station. Questions were kept almost in all cases the same in order to be able to compare the results from different stations. In this chapter, an explanation regarding the case studies, questionnaire preparation, distribution, response and basic data analysis regarding population involved, is provided. 5.2. Case studies For this inquiry four underground stations have been selected as case studies. On these four stations the questionnaires were handed out to the travelers at random. For the choice of case studies, following aspects played a role: a. the stations should be quite new, to be able to check whether the design was satisfactory for
the users, knowing that they were built not so long ago, and should therefore reflect this time b. both train and metro stations should be studied to see whether there were some differences in
perception by the users c. the stations should be chosen to represent either linear or complex station d. stations used for comparison should be of similar scale
6 Mrs. Zlatica Licina is a clinical psychologist, at that moment employed by GGZE Circuit Acute Care in Eindhoven, who helped do design a questionnaire based on the conceptual framework
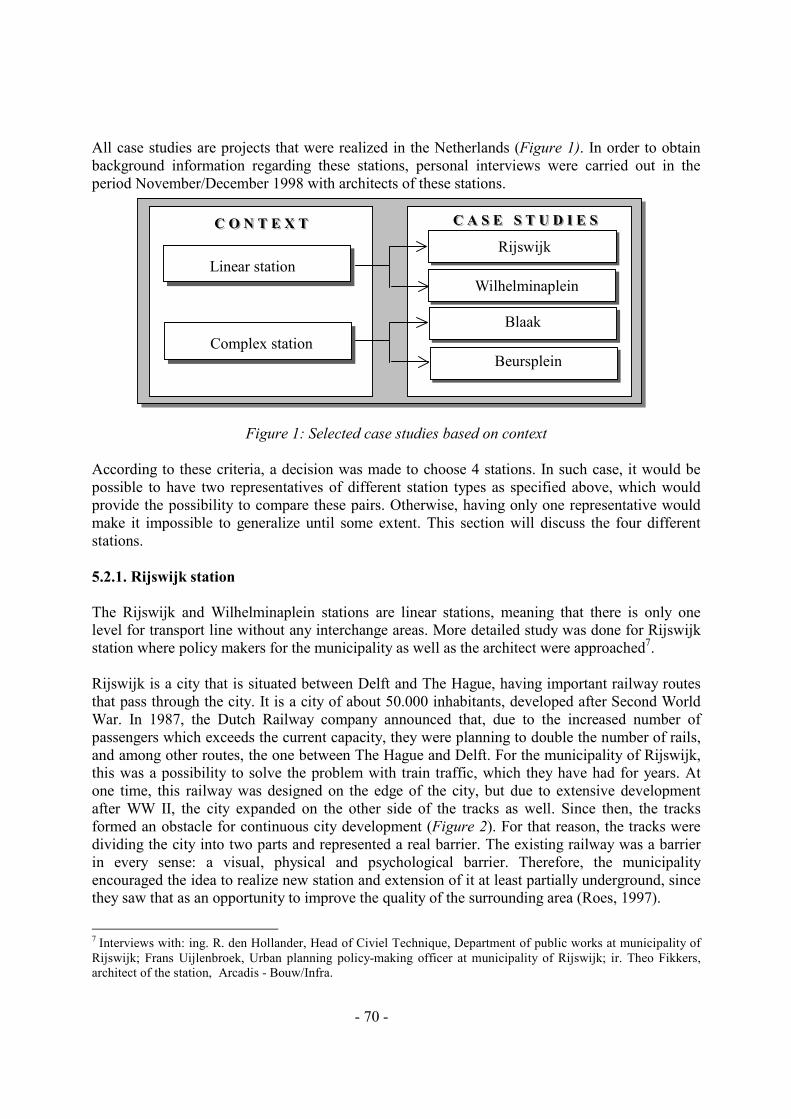
- 70 -
All case studies are projects that were realized in the Netherlands (Figure 1). In order to obtain background information regarding these stations, personal interviews were carried out in the period November/December 1998 with architects of these stations.
Figure 1: Selected case studies based on context According to these criteria, a decision was made to choose 4 stations. In such case, it would be possible to have two representatives of different station types as specified above, which would provide the possibility to compare these pairs. Otherwise, having only one representative would make it impossible to generalize until some extent. This section will discuss the four different stations. 5.2.1. Rijswijk station The Rijswijk and Wilhelminaplein stations are linear stations, meaning that there is only one level for transport line without any interchange areas. More detailed study was done for Rijswijk station where policy makers for the municipality as well as the architect were approached7. Rijswijk is a city that is situated between Delft and The Hague, having important railway routes that pass through the city. It is a city of about 50.000 inhabitants, developed after Second World War. In 1987, the Dutch Railway company announced that, due to the increased number of passengers which exceeds the current capacity, they were planning to double the number of rails, and among other routes, the one between The Hague and Delft. For the municipality of Rijswijk, this was a possibility to solve the problem with train traffic, which they have had for years. At one time, this railway was designed on the edge of the city, but due to extensive development after WW II, the city expanded on the other side of the tracks as well. Since then, the tracks formed an obstacle for continuous city development (Figure 2). For that reason, the tracks were dividing the city into two parts and represented a real barrier. The existing railway was a barrier in every sense: a visual, physical and psychological barrier. Therefore, the municipality encouraged the idea to realize new station and extension of it at least partially underground, since they saw that as an opportunity to improve the quality of the surrounding area (Roes, 1997).
7 Interviews with: ing. R. den Hollander, Head of Civiel Technique, Department of public works at municipality of Rijswijk; Frans Uijlenbroek, Urban planning policy-making officer at municipality of Rijswijk; ir. Theo Fikkers, architect of the station, Arcadis - Bouw/Infra.
CCC OOO NNN TTT EEE XXX TTT CCC AAA SSS EEE SSS TTT UUU DDD III EEE SSS
Complex station
Rijswijk
Wilhelminaplein
Blaak
Beursplein
Linear station

- 71 -
Figure 2: The old and new situation showing the same area
Placing railway traffic underground, continuous urban tissue development could be realized on the ground level (Figure 3). This reunited two city parts that were once separated by the rails.
Figure 3: By placing railway underground, a pedestrian and motor traffic route was established
which connected two city parts This intervention had several impacts on the surrounding area. It improved significantly the quality of life in the surrounding area; two city parts once separated were now reunited; a possibility was created for new developments and intensification of the land use above the underground tunnel. By placing railway underground a free space emerged, which planners saw as a chance to create extra green areas in combination with apartment and office buildings. A part of that area is used now as a park and children’s playground, with a possibility to realize buildings above the underground tunnel in the later stage. This was made possible with the realization, since having in mind that in the future there may be a need to build above the tunnel some columns were reinforced to be able to take over the extra load. Now already two buildings are released above the tunnel: one is an apartment and the other is an office building (Figure 4

- 72 -
and 5). It also shows the possibility of having very frequent traffic flow and an important, not only local, but regional infrastructure through the city, which still does not obstruct the daily activities in that area.
Figure 4, 5: An example of an apartment building (4) and an office building (5) that were
realized above the tunnel The length and the depth of the station where determined through costs and available budget. In first instance the station was planned somewhat shorter, but later, due to possible future developments around the station, the length was extended. The main entrance is located on a large square and the only visible aspect that suggests that there is a train station is the glass pyramid (Figure 6). The other entrance at Churchilllaan (Figure 7) is also made out of glass to provide enough daylight at the entrances. In the surroundings of the station mainly housing is situated, especially on the side of Piramideplein, while on the side of Churchilllaan along with the housing, a large business area is located, which is still in the development.
Figure 6, 7: Main entrance at Piramideplein (6) and entrance at Churchilllaan (7)
The train platforms are very long and the two entrances mentioned earlier are placed at the ends of the platforms.
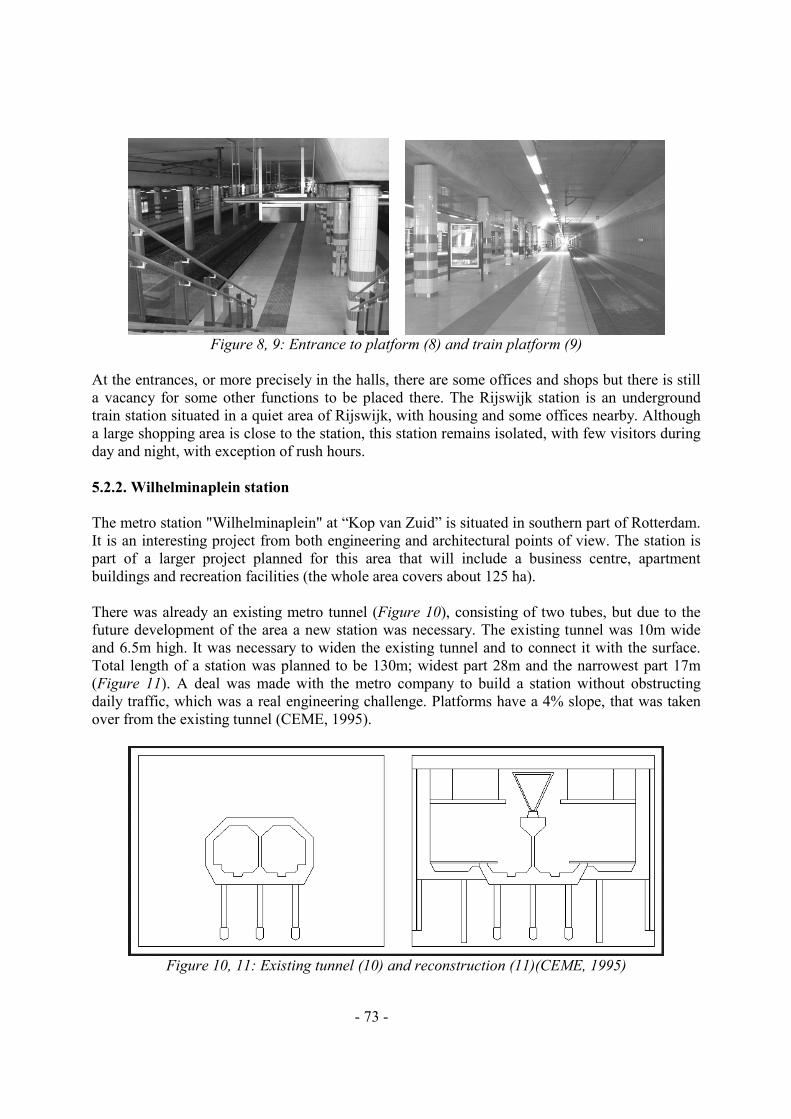
- 73 -
Figure 8, 9: Entrance to platform (8) and train platform (9)
At the entrances, or more precisely in the halls, there are some offices and shops but there is still a vacancy for some other functions to be placed there. The Rijswijk station is an underground train station situated in a quiet area of Rijswijk, with housing and some offices nearby. Although a large shopping area is close to the station, this station remains isolated, with few visitors during day and night, with exception of rush hours. 5.2.2. Wilhelminaplein station The metro station "Wilhelminaplein" at “Kop van Zuid” is situated in southern part of Rotterdam. It is an interesting project from both engineering and architectural points of view. The station is part of a larger project planned for this area that will include a business centre, apartment buildings and recreation facilities (the whole area covers about 125 ha). There was already an existing metro tunnel (Figure 10), consisting of two tubes, but due to the future development of the area a new station was necessary. The existing tunnel was 10m wide and 6.5m high. It was necessary to widen the existing tunnel and to connect it with the surface. Total length of a station was planned to be 130m; widest part 28m and the narrowest part 17m (Figure 11). A deal was made with the metro company to build a station without obstructing daily traffic, which was a real engineering challenge. Platforms have a 4% slope, that was taken over from the existing tunnel (CEME, 1995).
Figure 10, 11: Existing tunnel (10) and reconstruction (11)(CEME, 1995)

- 74 -
The entrances are quite spacious (Figure 12), and in the main hall an office for surveillance is placed, giving an impression that there is a good control over the station. There is also some artwork placed in the main hall, which gives an extra dimension to this space (Figure 13).
Figure 12, 13: One of the entrances (12) and public art at entrance hall (13)
The wall that once separated two tunnels was partially broken with circle openings (Figure 14, 15) in order to provide visual contact between platforms and to increase social control.
Figure 14, 15: View of the platform (14) and view from the upper gallery (15)
Reflective materials were applied on different surfaces forming a feeling that each of these surfaces is a source of light. There are two levels below ground where one of them represents a "split" level. That level stretches out in such way to provide an overview of the level below. Platforms are very spacious due to the width and double height provided by a short length of a split level. Using bright colors, reflective materials and by designing a spacious platforms alleviates the feeling of being enclosed, underground space. Now there are very few passengers with exception of the rush hours. 5.2.3. Beurs station Beurs and Blaak stations are the interchange stations and are referred to as complex stations due to two levels of underground public transport lines. Both of these stations are situated in Rotterdam and are busy due to their central location and having a function as an interchange stations.
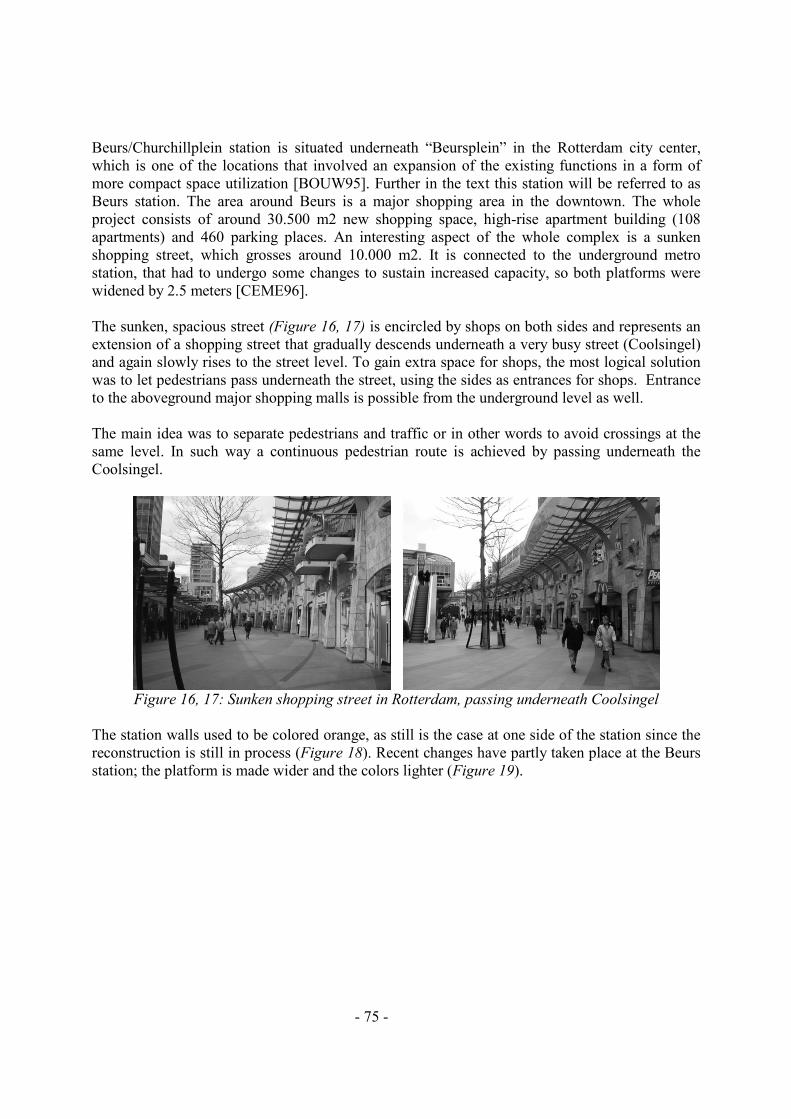
- 75 -
Beurs/Churchillplein station is situated underneath “Beursplein” in the Rotterdam city center, which is one of the locations that involved an expansion of the existing functions in a form of more compact space utilization [BOUW95]. Further in the text this station will be referred to as Beurs station. The area around Beurs is a major shopping area in the downtown. The whole project consists of around 30.500 m2 new shopping space, high-rise apartment building (108 apartments) and 460 parking places. An interesting aspect of the whole complex is a sunken shopping street, which grosses around 10.000 m2. It is connected to the underground metro station, that had to undergo some changes to sustain increased capacity, so both platforms were widened by 2.5 meters [CEME96]. The sunken, spacious street (Figure 16, 17) is encircled by shops on both sides and represents an extension of a shopping street that gradually descends underneath a very busy street (Coolsingel) and again slowly rises to the street level. To gain extra space for shops, the most logical solution was to let pedestrians pass underneath the street, using the sides as entrances for shops. Entrance to the aboveground major shopping malls is possible from the underground level as well. The main idea was to separate pedestrians and traffic or in other words to avoid crossings at the same level. In such way a continuous pedestrian route is achieved by passing underneath the Coolsingel.
Figure 16, 17: Sunken shopping street in Rotterdam, passing underneath Coolsingel
The station walls used to be colored orange, as still is the case at one side of the station since the reconstruction is still in process (Figure 18). Recent changes have partly taken place at the Beurs station; the platform is made wider and the colors lighter (Figure 19).

- 76 -
Figure 18, 19: Old situation (18) and new situation (19)
This station is located at a hub of the two metro lines: the Erasmuslijn and the Callandlijn. It is accessible from the underground-shopping street (Figure 20), as well as from many other side entrances along the Coolsingel (Figure 21).
Figure 20, 21: Entrance from underground shopping street (20) and exchange area with shops
(21) In the station, at interchange area, there are few shops located where mainly groceries can be bought. 5.2.4. Blaak station Since the number of train passenger increases each year the Dutch Railways decided to double the number of rails on most frequent lines and therefore at the moment there are many projects going on around different stations in the Netherlands. This was already mentioned in the description of Rijswijk station. Before Blaak station was designed, the train traffic went over the river Maas (over the Koningshaven Bridge). The bridge had to open for the ships passing underneath therefore this was not the best solution for train and ship traffic. For these reasons, the decision was made to design a tunnel, which would go under the Maas and at the same time double the number of rails. The main entrance to the station is accentuated by a glass construction having a diameter of 35 meters and hanging on a steel arc which has a span of 62 meters (Figure 22, 23). There is another side entrance, which is not well maintained and is quite deserted (Figure 24, 25).

- 77 -
Figure 22, 23: The main entrance to Blaak station (22) and interior of the main entrance (23)
Figure 24, 25: Secondary exit (24) and exchange area leading to the secondary exit (25)
Blaak station became an important exchange station, which is situated in the center of Rotterdam. It is at the same time a tram, metro and a train station. This all together represents a very convenient way to change from one transport system to the other since the walking distances from one transport mode to the other are short. Tram station is situated at ground level. Metro platforms are one level below ground at approximately 7m below ground (Figure 26) and train platforms are two levels below ground at approximately -14 meters (Figure 27). The finishing on the walls at the train station were realized using combination of reflective (tiles and mirrors) and absorbing materials in order to reduce the noise level caused by passing trains. The train station is a relatively new station where quite warm colors were used. The metro station is somewhat older, where the orange color prevails. Similar to Wilhelminaplein station, circular openings are present in the wall between two platforms in order to provide visual contact between platforms and to increase social control.

- 78 -
Figure 26, 27: Blaak metro station (26) Blaak train station (27)
In the stations surrounding mainly business, housing and schools are situated. Blaak station used to be only metro station, and in 1996, it was decided to place a train station underneath the metro station so that it became an exchange station. There are no shops located inside the station, as is the case at Beurs station. 5.3.The questionnaire All variables determining the perception of public safety and comfort in underground space, as explained in Chapter 3, were used to formulate questions to determine the relationship between different variables. Some personal questions were also asked to the respondents, so that it is possible to distinguish different subgroups of the total representative population. A unique questionnaire was made for each station. For example, the photos that were used in the questionnaire for Beurs, were taken at Beurs and so on. In addition, some adjustments in the questions were necessary, as it is impossible to ask something about a metro platform when the station only has a railway platform, or the other way around. In Appendix A an example of the questionnaire for Blaak station is given. The questionnaire covered aspects that are related to public safety and comfort at the station. For Rijswijk and Wilhelminaplein, there were 36 aspects defined as independent variables in an input space where each has five possible options. For Beurs station there were 42 variables determining public safety and comfort and for Blaak station there were 43 variables. For illustration purpose, only Blaak station is presented together with relevant aspects. The aspects, which are identified to be related to public safety are given in Table 1 and those related to comfort are presented in Table 2 (Durmisevic, et. al., 2001). Table 1: Aspects related to safety (15 aspects) Overview Escape Lighting Presence of People Safety Surrounding Entrance Possibilities Entrance Public control Safety in surrounding Train platform Distances Train platform Few people daytime Metro platform
Metro platform
Few people night
Exchange area Exchange area Dark areas
- 79 -
Table 2: Aspects related to comfort (28 aspects) Attractiveness Wayfinding Daylight Physiological Color To the station Pleasantness Noise Material In station Orientation Temperature winter Spatial proportions Placement of signs Temperature summer Furniture Number of signs Draft entrance Maintenance Draft platforms Spaciousness entrance Draft exchange areas Spaciousness train platform Ventilation entrance Spaciousness metro platform Ventilation platforms Platform length Platform width Platform height Pleasantness entrance Pleasantness train platform Pleasantness metro platform
The questions were in principle the same for all four stations, having in mind that for linear stations there were fewer questions than for complex stations. The reasons for that are due to fact that these stations do not have an exchange area, and are only a metro (Wilhelminaplein) or a train station (Rijswijk). The questions related to the following topics were therefore excluded and those are given in Table 3: Table 3: The questions that were excluded for linear stations For Rijswijk station For Wilhelminaplein station overview metro platform overview train platform lighting metro platform lighting train platform spaciousness metro platform spaciousness train platform pleasantness metro platform overview exchange area overview exchange area lighting of exchange area lighting of exchange area pleasantness train platform draft in exchange area draft in exchange area
A few considerations were made during the composition of the questionnaire to have a positive influence on the response (Swanborn, P. G., 1991): •= Introduction letter with explanation of research objective was handed out together with the
questionnaire; •= Recognizable logo of the universities was placed on the questionnaire (logo of University of
Delft and University of Utrecht8); •= A clear layout: legible type and clearly arranged division; •= A self-addressed envelope for returning the questionnaire was added;
8 Ilse van Eekelen, a graduate student, conducted a statistical analysis by using the same data from the questionnaire, which was a part of her graduation project at the University of Utrecht. These results are published as a graduate report in March 2001. The relevant results are included in this chapter as well (Eekelen, 2001).

- 80 -
•= Gift vouchers of about € 50 for ten respondents were promised as a reward for taking part in this research.
5.3.1. Measurement scales The way in which data is measured is called the level of measurement or the scale of measurement for variables (de Vocht, 1996). The organization of variables determines how data can be analyzed (McGrew & Monroe, 1993). There are four kinds of scales in which variables can be measured: the nominal, ordinal, interval scale and ratio scale (Dalen & Leede, 2000). The simplest scale of measurements for variables is assigning to each value or unit of data one of the categories. This is a so-called nominal scale. Each category is given some name or title, but no assumptions are made about any relationships between the categories, only that they differ (McGrew & Monroe, 1993). In this scale, there is no sequence of importance or order but simply the classification. In the questionnaire, these are the questions with at least two possibilities as an answer, for example, a question related to gender, meaning that respondents have only possibility to choose a male or a female category. The next higher level of measurement involves placement of the values themselves in some rank order to create an ordinal scale variable. They are called ordinal since they represent a sequence of order (Lawson, 1990). The relationship between observations takes on a form of ‘greater than’ and ‘less than’. The use of a three-point scale or a five-point scale in a questionnaire is the most common (Baarda & de Goede, 1997). For the questionnaire developed in this research a five-point scale was used in order to generate a more differentiated approach. Respondents have in this way the opportunity to ‘strongly agree’ or ‘strongly disagree’ with a question. With variables measured on either an interval or ratio scale, the difference between the values can be determined. That is, the interval between any two units of data can be measured on the scale. Interval and ratio measurement scales can be distinguished by the way in which the origin or zero starting point is determined. With interval scale measurement, the origin or zero starting point is assigned arbitrarily. In ratio scale measurement, by contrast, a natural or non-arbitrary zero is used, making it possible to determine the ratio between values (McGrew & Monroe, 1993). 5.3.2. Questionnaire distribution Regarding the number of questionnaire that was necessary to obtain, a goal was to obtain around 200 questionnaires per station. The Centraal Bureau voor de Statistiek (Central Bureau for Statistics) assumes a response rate of 20% for a written questionnaire (Galen, 1999). Having this in mind, the actual amount of questionnaires to be handed out at each station was set to 1000, so in total 4000 questionnaires were distributed. From 27 May until 30 May 2000, one thousand of questionnaires were handed out at each station to the passengers visiting the stations. They were handed out at random to passing travelers at the underground station. In such way it is assumed that the representative population using the station fills in the questionnaire, as it is impossible to question all the individual travelers (van Dalen & de Leede, 2000).

- 81 -
5.3.3. Response From 27 May until 30 May 2000, the questionnaires were handed out at the stations of Beurs, Blaak, Wilhelminaplein and Rijswijk by assistants from the TU Delft. After 6 weeks 951 questionnaires were returned, some of them partly completed others fully completed. Four variables from the questionnaire were used to run some check questions in order to filter out questionnaires that were not fully reliable. The first check question used the outcomes of the variables of ‘general clarity of station’ and ‘clarity of connections between different functions in the station’. The second check question used the outcomes of the variables of ‘general noise in station’ and ‘noise of passing trains and metros’. When those different variables per check question were subtracted from each other these outcomes were to be between 0 or 1. The questionnaires with outcomes that were well below 0 or above 1 were not reliable and were excluded. The cases where there were some missing variables were excluded as well. Eventually 910 questionnaires could have been used for the research. The distribution of the response per station was as follows: •= Beurs: 197 returned questionnaires •= Blaak: 215 returned questionnaires •= Rijswijk: 254 returned questionnaires •= Wilhelminaplein: 244 returned questionnaires The total response of the questionnaires is 23.7%, which is somewhat more than the minimal expected response of 20%. Such response is considered reasonable for a research on this large scale (Martens, 2000). 5.4. Respondent’s characteristics In order to generate an overall view of the respondents, this section will discuss the general characteristics of the respondents. Age, gender, level of education, frequency of visits and way of orienting are considered in more detail. 5.4.1. Age In Figures 28-31, the information regarding respondent’s age is presented. For Beurs and Blaak station the percentages for the age categories 15 – 25 and 26 – 45 are almost the same, around 40%. An explanation for this could be the location of the two stations. They are situated in the center of Rotterdam where schools and businesses are nearby. For Rijswijk and Wilhelminaplein the most respondents were in the category of 26 – 45, for Rijswijk 40% and Wilhelminaplein 56%. In the surroundings of both stations businesses are located, especially at Wilhelminaplein, as was explained in the previous chapter.
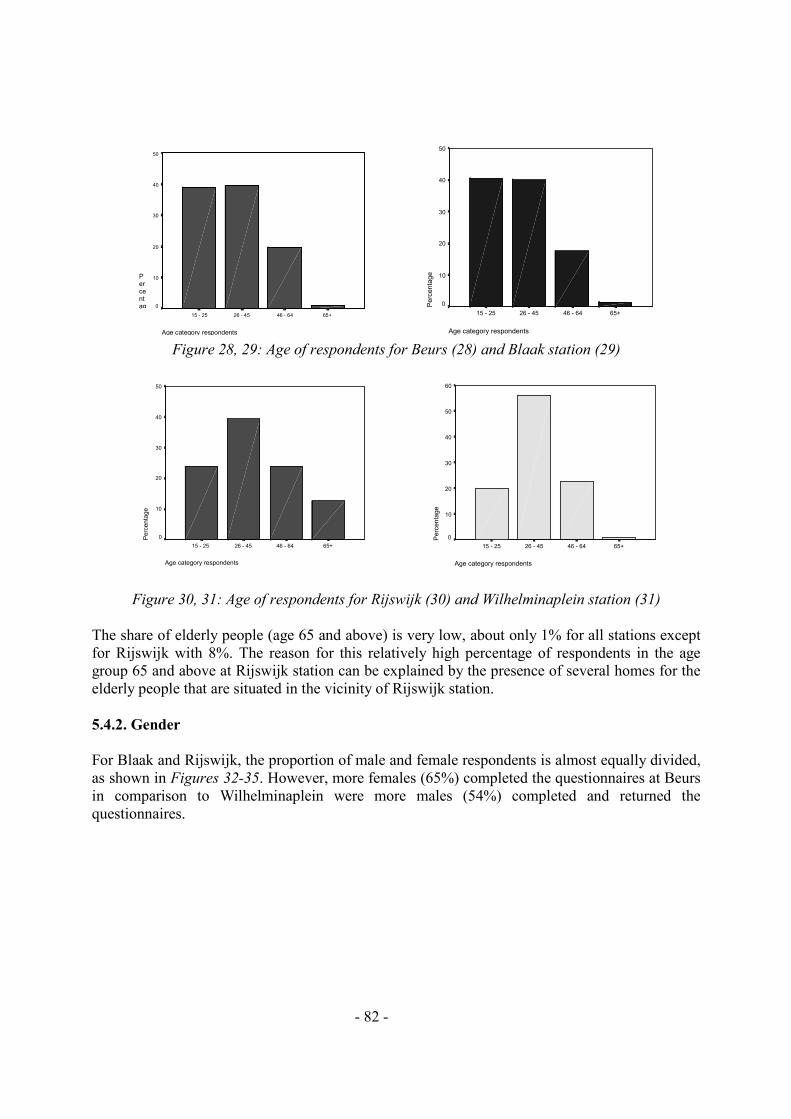
- 82 -
Age category respondents
65+46 - 6426 - 4515 - 25
Percentag
50
40
30
20
10
0
Age category respondents
65+46 - 6426 - 4515 - 25
Perc
enta
ge
50
40
30
20
10
0
Figure 28, 29: Age of respondents for Beurs (28) and Blaak station (29)
Age category respondents
65+46 - 6426 - 4515 - 25
Perc
enta
ge
60
50
40
30
20
10
0
Figure 30, 31: Age of respondents for Rijswijk (30) and Wilhelminaplein station (31) The share of elderly people (age 65 and above) is very low, about only 1% for all stations except for Rijswijk with 8%. The reason for this relatively high percentage of respondents in the age group 65 and above at Rijswijk station can be explained by the presence of several homes for the elderly people that are situated in the vicinity of Rijswijk station. 5.4.2. Gender For Blaak and Rijswijk, the proportion of male and female respondents is almost equally divided, as shown in Figures 32-35. However, more females (65%) completed the questionnaires at Beurs in comparison to Wilhelminaplein were more males (54%) completed and returned the questionnaires.
Age category respondents
65+46 - 6426 - 4515 - 25
Perc
enta
ge
50
40
30
20
10
0

- 83 -
Gender respondents
malefemale
Perc
enta
ge
70
60
50
40
30
20
10
0
Gender respondents
malefemale
Perc
enta
ge
60
50
40
30
20
10
0
Figure 32, 33: Gender of respondents for Beurs (32) and Blaak station (33)
Gender respondents
malefemale
Perc
enta
ge
60
50
40
30
20
10
0
Gender respondents
malefemale
Perc
enta
ge
60
50
40
30
20
10
0
Figure 34, 35: Gender of respondents for Rijswijk (34) and Wilhelminaplein station(35)
5.4.3. Education The information of the respondent’s education level is presented in Figures 36-39. On every station more than half, around 50% and for Blaak even 60% of the respondents have finished/studied at school for higher education or university (HBO, WO).
Education respondents
HBO, WOHAVO, VWO
MAVO, MULO, MBOlagere school, LBO
Perc
enta
ge
60
50
40
30
20
10
0
Education respondents
HBO, WO
HAVO, VWO
MAVO, MULO, MBO
lagere school, LBO
Perc
enta
ge
80
60
40
20
0
Figure 36, 37: Education level of respondents for Beurs (36) and Blaak station (37)

- 84 -
Education respondents
HBO, WOHAVO, VWO
MAVO, MULO, MBOlagere school, LBO
Perc
enta
ge60
50
40
30
20
10
0
Education respondents
HBO, WOHAVO, VWO
MAVO, MULO, MBOlagere school, LBO
Perc
enta
ge
60
50
40
30
20
10
0
Figure 38, 39: Education level of respondents for Rijswijk (38) and Wilhelminaplein station (39) 5.4.4. Frequency of visits Most of the respondents visit the station almost every day and can be regarded as commuters. Figures 40-43 show that around 60 % of the respondents at Beurs, Blaak and Wilhelminaplein make use of the station almost every day. This could be because of the proximity of schools and businesses, which are expected to be travelers destinations. For Rijswijk, around 58% of the respondents visit the station often but not daily, and one reason can be that Rijswijk is mainly a train station compared to the other three. The others are metro stations, except Blaak, that is both a metro and a train station. A very small number of people are first time visitors to the stations.
Frequency of visits
almost every dayoften, but not dailyfirst visit
Perc
enta
ge
80
60
40
20
0
Frequency of visits
almost every dayoften, but not dailyfirst visit
Perc
enta
ge
70
60
50
40
30
20
10
0
Figure 40, 41: Frequency of visit for Beurs (40) and Blaak station (41)
Frequency of visits
almost every dayoften, but not dailyfirst visit
Perc
enta
ge
70
60
50
40
30
20
10
0
Frequency of visits
almost every dayoften, but not dailyfirst visit
Perc
enta
ge
60
50
40
30
20
10
0
Figure 42, 43: Frequency of visit for Rijswijk (40) and Wilhelminaplein station (41)

- 85 -
5.4.5. Way of orienting In Figures 44-47, the way of orienting of the respondents is presented. For Beurs and Blaak most respondents use signs in order to orient themselves in the underground station, 39% at Beurs and 46% at Blaak.
Wayfinding
othersignssense of direction
Perc
enta
ge
40
38
36
34
32
30
28
26
24
Wayfinding
othersignssense of direction
Perc
enta
ge
50
40
30
20
10
Figure 44, 45: Way of orienting for Beurs (44) and Blaak station (45)
Wayfinding
othersignssense of direction
Perc
enta
ge
50
40
30
20
10
Wayfinding
othersignssense of direction
Perc
enta
ge
50
40
30
20
10
Figure 46 , 47: Way of orienting for Rijswijk (46) and Wilhelminaplein station (47)
At Rijswijk and Wilhelminaplein more people rely on their intuition, or comprehension of space for both stations around 60%. Those respondents who filled in the option ‘other’ actually wrote down that they used both signs and intuition. The layout of the station can be an explanation, as Wilhelminaplein and Rijswijk both belong to linear type of stations, meaning that they are easier to comprehend. Beurs and Blaak station belong to a complex type, meaning there are routes that are possible for one to follow. Therefore, wayfinding is mainly supported by signboards. According to (Evans, 1980; Linn and Petersen, 1986; Galen, 1999) women pay more attention to signs rather than rely on their comprehension of space. Men orient themselves in most cases by comprehension of space. Similar results were found in this research as well. The results are given in Table 4. Table 4: Way of orienting by gender for each station
Beurs Blaak Rijswijk Wilhelminaplein Men Women Men Women Men Women Men Women
Sense of direction 49,3% 25,6% 50,9% 19,4% 46,7% 44,9% 53,8% 37,2% Signs 30,4% 43,2% 36,8% 55,6% 30% 32,3% 30% 46,9% Other 20,3% 31,2% 12,3% 25% 23,3% 22,8% 16,2% 15,9%

- 86 -
For Beurs, Blaak en Wilhelminaplein women do actually make use of signs more than men in order to orient themselves. Except at Rijswijk, at this station both men and women use their comprehension of space more often then they use signs to orient themselves. A simple layout of the station, meaning that there are clearly defined exits at both ends of the platform could be explaining factor for this. 5.5. Perception of public safety for four case studies The perception and feeling of public safety in an underground station can be influenced by a buildings configuration and by personal characteristics. The respondents were asked to answer one question in the questionnaire about how safe they felt at the station. In Table 5, the general perception of public safety of all the respondents for all four stations is presented. Table 5: Perception of safety in the underground stations
Beurs Blaak Rijswijk Wilhelminaplein Very unsafe 5,1% 3,7% 7,6% 1,7%
Unsafe 16,8% 16,4% 14,9% 7,9% Neutral 30,6% 35,5% 35,7% 24,1%
Reasonably safe 34,0% 30,8% 32,5% 49% Very safe 13,2% 13,6% 9,2% 17,4%
Wilhelminaplein station is regarded as the safest station. Only 7,9% of the respondents experience this station as unsafe, whereas for Beurs this is 16,8%, Blaak 16,4% and Rijswijk 14,9%. If we sum up the results of reasonably safe and safe, Wilhelminaplein has the best results with 66% in comparison to Beurs 47.2%, Rijswijk 44.4% and Blaak 41.7%. Public safety and gender According to Galen (1999), women feel less safe then man. This implies that gender can also have an influence on the perception of public safety in an underground station and this case is shown in Table 6. On all stations women feel less safe than men. Table 6: Perception of safety in the underground stations by gender
Beurs Blaak Rijswijk Wilhelminaplein Men Women Men Women Men Women Men Women
Very unsafe 2,9% 6,3% 3,8% 3,7% 7,4% 7,9% 1,6% 1,8% Unsafe 10,1% 20,5% 7,5% 25% 13,9% 15,7% 3,9% 12,5% Neutral 31,9% 29,9% 32,1% 38,9% 35,2% 38,6% 17,1% 32,1%
Reasonably safe 34,8% 33,9% 35,8% 25,9% 35,2% 29,9% 51,9% 45,5% Very safe 20,3% 9,4% 20,3% 6,5% 10,7% 7,9% 25,6% 8%
Comfort The perception and feeling of one’s comfort in an underground station can be influenced by the built environment and the conditions in a building as well as by the personal characteristics. The respondents were also asked to answer one question in the questionnaire about how pleasant or unpleasant they felt at the station. In Table 7, the general perception of comfort for four stations is presented.

- 87 -
Table 7: Perception of comfort in the underground stations Beurs Blaak Rijswijk Wilhelminaplein
Very unpleasant 3,2% 1,4% 6,8% 1,7% Unpleasant 12,7% 15,9% 15,7% 5%
Neutral 41,8% 35,5% 37,8% 20,3% Reasonably pleasant 35,4% 36,4% 34,5% 46,9%
Very pleasant 6,9% 10,7% 5,2% 26,1% Again, Wilhelminaplein station is regarded to be the most pleasant station. Only 5% of the respondents experience this station as unpleasant, whereas for Beurs this is 12,7%, Blaak 15,9% and Rijswijk 15,7%. Comfort and gender As personal characteristics can have an influence on the perception of one’s safety in an underground station, it’s interesting to look at this aspect concerning the perception of comfort in an underground station (Table 8). The previous section showed that women feel less safe in underground stations. For the stations Beurs en Blaak women find these stations more unpleasant then men. Rijswijk and Wilhelminaplein stations have similar results when comparing by gender. Table 8: Perception of comfort in the underground stations by gender
Beurs Blaak Rijswijk Wilhelminaplein Men Women Men Women Men Women Men Women
Very Unpleasant n/ a 4,8% 1,9% 0,9% 6,6% 7,0% 2,3% 0,9% Unpleasant 9,4% 14,4% 10,5% 21,1% 16,5% 14,8% 5,4% 4,5%
Neutral 43,8% 40,8% 32,4% 38,5% 38,8% 36,7% 15,5% 25,9% Reasonably pleasant 37,5% 34,4% 40% 33,0% 31,4% 37,5% 51,2% 42%
Very pleasant 8,6% 5,6% 15,2% 6,4% 6,6% 3,9% 25,6% 26,8% These were some preliminary results, to show the relationship between intervening variables and the perception of public safety and comfort. In the coming chapter the focus will be mainly on determining the relationships between perception of public safety/comfort and all aspects related to them. It was already mentioned that for a questionnaire design a five-point scale measurement was used. The width parameter σ of RBFN is set to unity, as an optimal choice matching the linear scale of the input/output parameters between 0 and 1. Following Chapter 6 will deal with network training, testing and optimization followed by knowledge elicitation methods.

- 88 -

- 89 -
CHAPTER 6
Experimental research by knowledge modeling 6.1. Introduction In previous chapter the choice and the description of case studies were given. For four case studies, a questionnaire was developed and in the previous chapter, some basic results were provided. In this chapter the focus will be on information processing and knowledge modeling by applying soft computing techniques described in Chapter 4. In Section 4.4.1. six steps were given as a guideline for choosing the neural network model. The first three stages were dealt with in Chapter 4, and in this chapter the focus will be on last three steps being training of neural network, testing and optimization of network architecture. Thereafter, the meta-knowledge techniques will be explained. The software9 developed for the particular data considered in this thesis was developed within the ®Matlab environment (The Math Works Inc.). 6.2. Training, testing and optimization of network architecture After careful deliberation, it became evident that for the data at hand, there were some peculiarities, which could eventually affect a knowledge model. One such peculiarity was very few data for the 0.1 range in the output space, which was valid for both public safety and comfort, and this was the case for all four stations. This means that only very few people of the randomly selected population group considered the four stations as very unsafe or uncomfortable. An expectation was that if the network was trained for the whole range between 0 and 1, including the 0.1 range which is poorly represented, would affect the knowledge model, in a sense that the estimation error for the unknown cases would become greater since the generalization error would increase. In order to verify this, two separate groups of experiments were conducted. In first experiment, the whole data range between 0 and 1 is considered and in second experiment, the 0.1 value is excluded. These experiments are explained in more detail by 9 The architectural data has been investigated by software developed for this study by prof. Özer Ciftcioglu, who is an expert in the field of Artificial Intelligence, working at the chair Technical Design and Informatics, Faculty of Architecture, TU Delft

- 90 -
using only the data of one station for the simplicity reasons. The data obtained for the Blaak station is therefore considered in the coming examples, since for this station there were the most input variables. The same experiments were done for all four stations. Experiment 1a Variables explaining comfort and public safety were used as input data (Table 1 and Table 2). For Blaak station there are in total 43 input variables. The comfort and public safety were used as output data. Whole data was between 0 and 1. There were all together 215 cases available for network training. A decision was made to use 208 cases for the training and to set aside 7 arbitrary cases for testing the network performance after the training is finalized. Table 1: Aspects related to public safety (15 aspects). Overview Escape Lighting Presence of People Safety Surrounding Entrance Possibilities Entrance Public control Safety in surrounding Train platform Distances Train platform Few people daytime Metro platform
Metro platform Few people night
Exchange area Exchange area Dark areas
Table 2: Aspects related to comfort (28 aspects). Attractiveness Wayfinding Daylight Physiological Color To the station Pleasantness Noise Material In station Orientation Temperature winter Spatial proportions Placement of signs Temperature summer Furniture Number of signs Draft entrance Maintenance Draft platforms Spaciousness entrance Draft exchange areas Spaciousness train platform Ventilation entrance Spaciousness metro platform
Ventilation platforms
Platform length Platform width Platform height Pleasantness entrance Pleasantness train platform Pleasantness metro platform
As machine learning method for this application, a powerful supervised clustering method, known as, orthogonal least squares (OLS) algorithm is used. Additionally, the clusters (receptive fields) are selected among a series of 43-dimesional input sets so that the information used for modeling is preserved as intact as possible, without any mathematical manipulations suitable for the convenience of machine learning, for example, a back-propagation algorithm (Rojas 1996). By means of the OLS algorithm, the input-output associations are established by means of radial basis functions which are gaussians and the base function centers are determined by means of input space, that is, the information applied at the input. By means of the OLS algorithm, each set

- 91 -
of input information i.e., the cases each having 43 variables are graded in a sequence according to their relevance to the information applied to the network output. Since the network structure is in the form of multi-input and multi-output, the relevance used as a criterion is a global relevance concerning the total input and output pairs each time. The OLS training results are given in Figure 1a, where in total 208 training sets were used for network training. The same training results are represented once more but differently with respect to the hierarchical cluster sequence obtained from the OLS training (Figure 1b). When acquiring the most representative cases for the whole input/output relation space, these 0.1 cases at the output (which we consider as 'extreme' cases) were all placed in the first 85 priority cases (Figure 1b).
Figure 1: Training results for range 0.1- 0.9 with 80 hidden nodes (1a-upper); hierarchical cluster sequence obtained from the OLS training (1b-lower). Broken - knowledge model response
to the training data after training. Continuous lines - actual knowledge used for modeling
The network includes a 0.1 range and treats that data as important, since they are few cases to learn. The network tries to represent the whole range between 0 and 1 as well as possible, in order to reduce training error. In the case of Blaak station it turns out to be that 0.1 range is not the most representative of the public opinion at the output space at all. After network training, seven unknown cases were used for testing the network performance and these results are given in Figure 2.

- 92 -
Figure 2: Test results for seven unknown cases (solid line is an actual value and a line with the
circles is an estimated value) If any predictions were to be made using the trained neural network, the range below 0.3 would be prone to greater error and at the same time the rest of the model would be affected as well due to high generalization error, which can be seen in Figure 2. Since the estimation results were not satisfactory, second experiment was done in order to improve the network performance and reduce the generalization error. Experiment 1b For the comfort aspect, only 1.4% of the whole output data had a 0.1 value, meaning that only 1.4% of the selected population group did not feel comfortable at Blaak station. Similar case was with the public safety aspect, where only 3.7% of the whole output data set had 0.1 value. Being aware of a low-density information present bellow 0.3 range for both public safety and comfort, it was decided for this experiment to neglect that range and to move it up to 0.3. In such case, it is expected that the network performance would significantly improve, since the generalization error for the model would decrease and better estimations could be obtained, meaning that the knowledge model would be more reliable. For these reasons 0.1 range at the output space was excluded, together with its associated input values. The final number of cases that could be used for the neural network training was 203. A decision was made to use 196 cases for the training. Same seven cases used in previous experiment for testing the network performance were left aside for the test purpose, so that eventually the test results from the two experiments could be compared. In both experiments, number of hidden nodes was set to 80. The OLS training results are given in Figure 3a, where in total 196 training sets were used for network training. When acquiring the most representative cases for the whole input/output relation space, the 0.3 range was represented through whole model and not only within the first 85 representative cases as it was a case with 0.1 range in previous experiment (Figure 3b). Throughout the whole model, there was a more equal distribution of all values.

- 93 -
Figure 3: Training results for range 0.3- 0.9 with 80 hidden nodes (3a-upper); hierarchical cluster sequence obtained from the OLS training (3b-lower). Broken lines represent the
knowledge model response to the training data after training. Continuous lines represent the actual knowledge used for modeling
Having trained the network by excluding the 0.1 value at the output space, network performance was tested on seven cases and the results are given in Figure 4.
Figure 4: Test results for seven unknown cases (solid line is an actual value and a line with the
circles is an estimated value)

- 94 -
Comparing results obtained in Figure 2 and Figure 4, it becomes evident that network performance is significantly improved once the 0.1 range was excluded, meaning that the later model can be now used as a reliable knowledge model. From these two experiments, it can be concluded that the network tried to cover the whole range during the training, which means that we artificially try to extend the range to 0.1, even though the network has very few examples to learn on that range and in order to reduce its training error, it superficially forces the network to learn on these few examples. The major drawback of this situation is due to the degradation effect on the generalization capability of the model. Another type of experiment is needed to optimize the network architecture in order to select the most suitable knowledge model. In Chapter 3, it was argued that public safety and comfort should be considered together, and that it is superficial to separate them when considering perception of space. Therefore, some aspects that relate to public safety are also related to comfort, and vice verse. This argument should be verified and this is done by conducting another type of experiment. In that respect, there were two possible network architectures, which are schematically presented in Figure 5a and 5b. In Figure 5a, the network is trained with only one output and several inputs, meaning that if the output is comfort than there are 28 associated input variables and if the output is public safety than there are 15 associated input variables. In Section 4.2, some limitations of statistical analysis were mentioned. Next to these, a main drawback is the difficulty to have multiple outputs. Therefore, the first structure of the model (Figure 5a) corresponds in a most abstract way to a statistical model, meaning that there are several inputs and only one corresponding output. This means that comfort and public safety are in this case considered separate from each other. In Figure 5b, another type of network architecture is presented, where the network is trained for two outputs being comfort and public safety and 43 associated input variables. In this way, comfort and public safety are considered together, meaning that they are interwoven and therefore as a whole contribute to the perception of space. This structure of the network is more efficient since it means that there is only one network training and one knowledge model.
Figure 5: Network architecture with one output (5a-left) and with two outputs (5b-right) Those experiments are explained in a more detail further in the text.
inputs
two dimensional output space
Σ basis function
ΦM Φ1 • • • • • •
• • • •
Σ
inputs
Hidden layer
Weights w (i,k)
Σ basis function
ΦM
Input layer
Output layer
Φ1 • • • • • •
• • • •
one dimensional output space

- 95 -
Experiment 2a The first 28 parameters were taken, which are input parameters for comfort, and they were matched with the first output, which is an output for comfort. This means that the training matrixes for comfort were 196 x 28 = input matrix, and 196 x 1 = output matrix. The same was done for public safety aspects. In this case, 15 parameters were taken, which are the input parameters for public safety aspect, and were matched with the second output, which is the output for public safety. This means that the training matrixes for public safety were 196 x 15 = input matrix, and 196 x 1 = output matrix. The network performance was estimated by applying seven unknown test cases to two separately trained RBF networks. The results are given in Figure 6.
Figure 6: Fig 6a (upper) validation of the network performance for comfort; Fig 6b (lower) validation of the network performance for public safety (two trained networks)
The training was successful, but poor estimations are obtained especially for public safety aspect. This can be seen in the Figure 6, where a dashed line represents the network prediction for seven unknown test cases, and a full line shows what the actual outcome should be. Experiment 2b All parameters (1 to 43) were taken, which are the input parameters for both comfort and public safety, and they were matched with two outputs, which are the outputs of comfort and public safety. This means that the training matrixes was 196 x 43 = input matrix, and 196 x 2 = output matrix. In such way there is only one network training. Figure 7, provides the validation of the network training for both comfort and public safety aspects when they are considered at the same time.
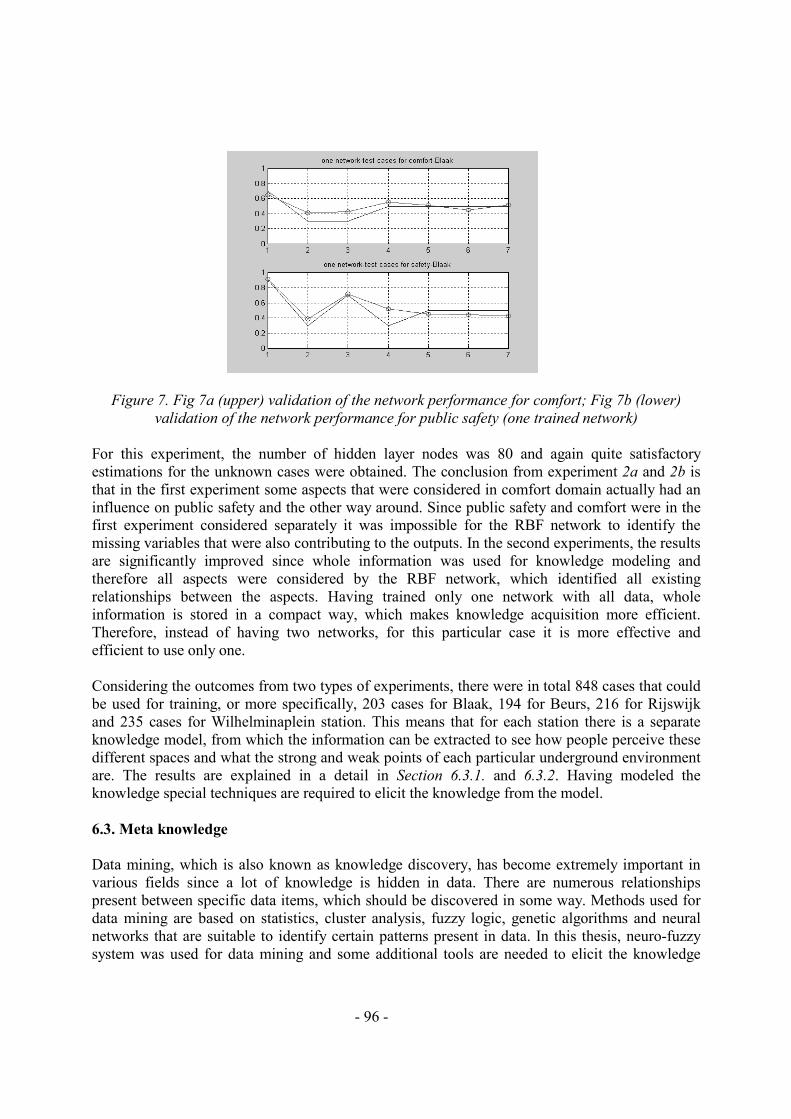
- 96 -
Figure 7. Fig 7a (upper) validation of the network performance for comfort; Fig 7b (lower)
validation of the network performance for public safety (one trained network) For this experiment, the number of hidden layer nodes was 80 and again quite satisfactory estimations for the unknown cases were obtained. The conclusion from experiment 2a and 2b is that in the first experiment some aspects that were considered in comfort domain actually had an influence on public safety and the other way around. Since public safety and comfort were in the first experiment considered separately it was impossible for the RBF network to identify the missing variables that were also contributing to the outputs. In the second experiments, the results are significantly improved since whole information was used for knowledge modeling and therefore all aspects were considered by the RBF network, which identified all existing relationships between the aspects. Having trained only one network with all data, whole information is stored in a compact way, which makes knowledge acquisition more efficient. Therefore, instead of having two networks, for this particular case it is more effective and efficient to use only one. Considering the outcomes from two types of experiments, there were in total 848 cases that could be used for training, or more specifically, 203 cases for Blaak, 194 for Beurs, 216 for Rijswijk and 235 cases for Wilhelminaplein station. This means that for each station there is a separate knowledge model, from which the information can be extracted to see how people perceive these different spaces and what the strong and weak points of each particular underground environment are. The results are explained in a detail in Section 6.3.1. and 6.3.2. Having modeled the knowledge special techniques are required to elicit the knowledge from the model. 6.3. Meta knowledge Data mining, which is also known as knowledge discovery, has become extremely important in various fields since a lot of knowledge is hidden in data. There are numerous relationships present between specific data items, which should be discovered in some way. Methods used for data mining are based on statistics, cluster analysis, fuzzy logic, genetic algorithms and neural networks that are suitable to identify certain patterns present in data. In this thesis, neuro-fuzzy system was used for data mining and some additional tools are needed to elicit the knowledge
- 97 -
formed by this knowledge model. In that respect we are talking about meta knowledge or "knowledge about knowledge" (Turban and Aronson, 1998). For machine learning, information should be transformed into a form convenient for this type of learning. There are several methods for this. For a particular machine learning task some suitable transform methods can be used (Haffey and Duffy 2000). The knowledge model in this research adapts the sequential information transformation steps as abstraction, association, classification, clustering, derivation and generalization. One of the important advantages having such analytical knowledge model is the possibility of deriving further important knowledge from the model itself. Such derived knowledge from the established knowledge is referred to as meta-knowledge. The model formed is a dynamic system making use of its knowledge-base and its meta-knowledge elicited from the knowledge base. That is, a two step knowledge extraction. The first step is a knowledge modeling and second step is meta-knowledge elicitation. There are different methods for knowledge elicitation/derivation from the knowledge model. For the data at hand, three different methods were used, which are complimentary to each other. Those are the sensitivity analysis, functional relationship between aspects (derivation of dependency of a design parameter as a function of user's perception) and simple numerical/percentage count of various preferences given by the randomly selected population group. These methods are explained in the following sections. 6.3.1. Sensitivity analysis for knowledge elicitation Based on the model where 0.1 range is excluded and one network with two outputs is trained, the relative dependency of the input variables on comfort and public safety is identified by means of sensitivity analysis (Bhatti, 2000). Here, based on the knowledge model, the gradients of comfort and public safety with respect to each variable in the input space are computed. The sensitivity analysis is a method used for determining the dependency of the output of a model on the information fed into the model. In other words, sensitivity analysis "studies the relationships between information flowing in and out of the model" (Saltelli, et. al., 2000; p.4).
There are different ways to measure sensitivity (Saltelli, Chan and Scott 2000). To identify the graded importance of the input design variables for each output we define the sensitivity S which needs to be calculated. Very briefly, in mathematical terms sensitivity can be calculated in following way:
sensitivity (S) = f (variables, weights) = ix
y∂∂
where independent variables represent the input values xio ; the dependent variable is represented by y ; weights are the values from the trained network (w0), and ∂ indicates that derivatives are partial. The formula can be also written in a more compact form
ii x
xyxS∂
∂= )()(
which indicates that the sensitivity is a function of the input pattern vector x, for each case. Therefore an averaging process over the pattern vectors can carry out the final sensitivity
w0 , xio
w0 , xio

- 98 -
computation:
where N is the number of pattern vectors and equal to 196, since that is the number of pattern vectors for Blaak station. Finally, the sensitivity vector as counterpart of the common pattern vector can be normalized to unity length. This vector is called priority vector since each vector component indicates the priority of the corresponding input variable in the design process. The magnitude of each vector component is shown in Figure 8 for both output variables (comfort and safety). The 43 aspects represented in Figure 8 correspond to aspects listed in Section 6.2. in Table 1 and Table 2. In Figure 8, the variables are listed on the 'x' axis, and the actual, numerical reading is presented on the 'y' axis. In Appendix B, some additional examples are provided in order to explain the knowledge modeling part and relation of sensitivity analysis to knowledge model. For more insight into Figure 8, a detailed description of the sensitivity analysis results in relation to comfort and safety for Blaak station are given in hierarchical order in Table 3 and Table 4.
Figure 8: The sensitivity of comfort to 43 input variables (8a-left); Sensitivity of public safety to 43 input variables (8b-right)
Table 3: Hierarchical order of sensitivity analysis results for comfort for Blaak station 1. spaciousness metro platform 16.few people during night 31.escape distances 2. spatial proportions 17.placement of signboards 32.maintenance 3. platform width 18.material 33.temperature winter 4. pleasantness metro platform 19.color 34.daylight for orientation 5. platform height 20.wayfinding in the station 35.furniture 6. spaciousness entrance 21.spaciousness train pl. 36.presence of dark areas 7. pleasantness train platform 22.few people during day 37.number of signboards 8. lighting of train platform 23.ventilation entrance 38.overview exchange area 9. platform length 24.safety in surrounding 39.lighting entrance 10.temperature summer 25.public control 40.lighting exchange area 11.wayfinding to the station 26.noise 41.escape possibilities 12.lighting metro platform 27.draft platforms 42.draft at exchange area 13.overview exchange area 28.draft entrance 43.ventilation of platforms 14.daylight presence 29.overview train platform 15.pleasantness entrance 30.overview entrance
=
=N
ii xS
NxS
1
)(1)(
0.00E+001.00E-012.00E-013.00E-014.00E-015.00E-016.00E-017.00E-018.00E-019.00E-011.00E+00
1 4 7 10 13 16 19 22 25 28 31 34 37 40 430.00E+001.00E-012.00E-013.00E-014.00E-015.00E-016.00E-017.00E-018.00E-019.00E-011.00E+00
1 4 7 10 13 16 19 22 25 28 31 34 37 40 43

- 99 -
Table 4: Hierarchical order of sensitivity analysis results for safety for Blaak station 1. safety in surrounding 16.draft at platforms 31.spaciousness metro pl. 2. few people during night 17.furniture 32.temperature winter 3. few people daytime 18.ventilation entrance 33.number of signs 4. pleasantness metro pl. 19.escape possibilities 34.spatial proportions 5. lighting train platform 20.lighting exchange area 35.pleasantness entrance 6. wayfinding in station 21.temperature summer 36.wayfinding to station 7. placement of signboards 22.overview train platform 37. spaciousness entrance 8. ventilation of platforms 23.presence of dark areas 38.public control 9. spaciousness train platform 24.escape distances 39.lighting entrance 10.pleasantness daylight 25.overview metro platform 40.overview entrance 11.draft exchange area 26.daylight for orientation 41.overview exchange area 12.pleasantness train platform 27.draft at entrance 42.color 13.platform height 28.platform length 43.material 14.maintenance 29.lighting metro platform 15.noise 30.platform width
The results of sensitivity analysis are provided for other three stations as well. Figure 9 is a graphical representation of the hierarchical order of aspects for Beurs station, while Table 5 and Table 6 shows the exact list of aspects in hierarchical sequence.
Figure 9: Hierarchical order of sensitivity to comfort for 42 aspects for Beurs station (9a-left);
Sensitivity to safety for 42 aspects for Beurs station (9b-right)
Table 5: hierarchical order of sensitivity analysis results for comfort for Beurs station 1. few people during daytime 15.platform length 29.lighting entrance 2. safety in surrounding 16.overv. exchange area 2 30.daylight for orientation 3. pleasantness metro platform 17.ventilation entrance 31.lighting of exch. area 1 4. temperature winter 18.furniture 32.spaciousness platform 2 5. pleasantness entrance 19.overv. exchange area 1 33.spatial proportions 6. wayfinding in station 20.dark areas 34.spaciousness entrance 7. ventilation platform 21.escape distances 35. public control 8. draft entrance 22.wayfinding to station 36.placement of signboards 9. color 23.draft platforms 37.noise 10.pleasantness of daylight 24.lighting metro platform 38.platform width 11.escape possibilities 25.lighting exchange area 2 39.draft in exchange area 12.few people during night 26.maintenance 40.number of signboards 13.overview metro platform 27.overview entrance 41.platform height 14.material 28.spaciousness platform 1 42.temperature summer
0 0.1 0.2 0.3 0.4 0.5 0.6 0.7 0.8 0.9 11
7
13
19
25
31
37
0 0.1 0.2 0.3 0.4 0.5 0.6 0.7 0.8 0.9 11
7
13
19
25
31
37

- 100 -
Table 6: Hierarchical order of sensitivity analysis results for safety for Beurs station 1. safety in surrounding 15.wayfinding to station 29.overview metro platform 2. few people daytime 16.temperature summer 30.plesantness daylight 3. few people during night 17.temperature winter 31.ligting exch. area 2 4. pleasantness metro platform 18.draft at exchange area 32.ventilation of platforms 5. material 19.draft at platforms 33.wayfinding in station 6. maintenance 20.lighting exch. area 1 34.overview exch. area 1 7. pleasantness metro platform 21.lighting metro platform 35. platform length 8. public control 22.plesantness entrance 36.color 9. escape possibilities 23.overview exchange area 2 37.draft entrance 10.daylight for orientation 24.escape distances 38.placement of signboards 11.lighting entrance 25.ventilation entrance 39.furniture 12.platform height 26.number of signboards 40.spaciousness platform 1 13.presence of dark areas 27.overview entrance 41.platform width 14.noise 28.espaciousness entrance 42.spaciousness platform 2
Figure 10 is a graphical representation of the hierarchical order of aspects for Rijswijk station, while Table 7 and Table 8 shows the exact list of aspects in hierarchical sequence. Figure 10: Sensitivity to comfort for 36 aspects for Rijswijk station (10a-left); Sensitivity to safety
for 36 aspects for Rijswijk station (10b-right) Table 7: Hierarchical order of sensitivity analysis results for comfort for Rijswijk station 1. pleasantness train platform 13.escape possibilities 25.platform width 2. spatial proportions 14.lighting of train platform 26.draft at platforms 3. safety in surrounding 15.public control 27.placement of signboards 4. overview of entrance area 16.columns and overview pl. 28.furniture 5. platform height 17.draft in entrance area 29.number of signboards 6. maintenance 18.material 30.wayfinding in station 7. pleasantness daylight 19.temperature summer 31.temperature winter 8. ventilation of entrance area 20.platform length 32.pleasantness entrance 9. daylight for orientation 21.presence of dark areas 33.spaciousness entrance 10.few people daytime 22.few people during night 34.wayfinding to station 11.overview of train platform 23.noise 35.lighting entrance 12.ventilation of platforms 24.escape possibilities 36.color
0 0.1 0.2 0.3 0.4 0.5 0.6 0.7 0.8 0.9 11
6
11
16
21
26
31
36
0 0.1 0.2 0.3 0.4 0.5 0.6 0.7 0.8 0.9 11
6
11
16
21
26
31
36

- 101 -
Table 8: Hierarchical order of sensitivity analysis results for safety for Rijswijk station 1.safety in surrounding 13.platform length 25.ventilation of platforms 2.few people during night 14.temperature winter 26.placement of signboards 3.few people daytime 15.noise 27.spatial proportions 4.ventilation of entrance 16.spaciousness entrance 28.draft at platforms 5. number of signboards 17.platform height 29.furniture 6. platform width 18.columns and overview pl. 30.color 7. public control 19.daylight for orientation 31.pleasantness train pl. 8. overview entrance 20.wayfinding in station 32.lighting entrance 9. lighting train platform 21.escape possibilities 33.material 10.draft entrance 22.overview of train platform 34.temperature summer 11.presence of dark areas 23.escape distances 35.pleasantness entrance 12.pleasantness daylight 24.maintenance 36.wayfinding to station
Figure 11 is a graphical representation of the hierarchical order of aspects for Wilhelminaplein station, while Table 9 and Table 10 shows the exact list of aspects in hierarchical sequence. Figure 11: Sensitivity to comfort for 36 aspects for Wilhelminaplein station (11a-left); Sensitivity
to safety for 36 aspects for Wilhelminaplein station (11b-right) Table 9: Hierarchical order of sensitivity analysis results for comfort for Wilhelminaplein station 1. color 13.lighting metro platform 25.overview entrance 2. spatial proportions 14.daylight for orientation 26.wall and overview pl. 3. pleasantness metro platform 15.escape possibilities 27.maintenance 4. overview at metro platform 16.placement of signboards 28.draft at platforms 5. few people daytime 17.draft at entrance area 29.wayfinding to station 6. temperature winter 18.platform length 30.platform height 7. safety in surrounding 19.pleasantness daylight 31. furniture 8. number of signs 20.wayfinding in station 32.pleasantness entrance 9. escape distances 21.few people during night 33.platform width 10.public control 22.spaciousness entrance 34.presence of dark areas 11.noise 23.ventilation entrance 35.ventilation platforms 12.material 24.lighting entrance 36.temperature summer
0 0.1 0.2 0.3 0.4 0.5 0.6 0.7 0.8 0.9 11
6
11
16
21
26
31
36
0 0.1 0.2 0.3 0.4 0.5 0.6 0.7 0.8 0.9 11
6
11
16
21
26
31
36

- 102 -
Table 10: hierarchical order of sensitivity analysis results for safety for Wilhelminaplein station 1. safety in surrounding 13.escape possibilities 25.noise 2. few people daytime 14.pleasantness daylight 26.wayfinding to station 3. few people during night 15.daylight for orientation 27.pleasantness metro pl. 4. ventilation of entrance area 16.temperature summer 28.placement of signboards 5. overview of metro platform 17.platform length 29.material 6. ventilation of platforms 18.pleasantness entrance 30.draft at platforms 7. platform width 19.overview entrance 31.spaciousness entrance 8. number of signboards 20.color 32.maintenance 9. escape distances 21.platform height 33.furniture 10.temperature winter 22.watt and overview pl. 34.wayfinding in station 11.few people during night 23.public control 35.lighting entrance 12.lighting metro platform 24.draft at entrance 36.spatial proportions
Finally as a summary, in Figure 12, the sensitivity analysis results for Blaak and Beurs is given and in Figure 13, the results for Rijswijk and Wilhelminaplein station are graphically represented.
Figure 12: Sensitivity analysis results for Blaak (12a - left); Beurs (12b - right)
Figure 13: Sensitivity analysis results for Rijswijk (13a-left); Wilhelminaplein station (13b-right) The outcomes from the knowledge model indicated outstanding potential of the model for gaining detailed insight into the information at hand, and leading to effective use of such design
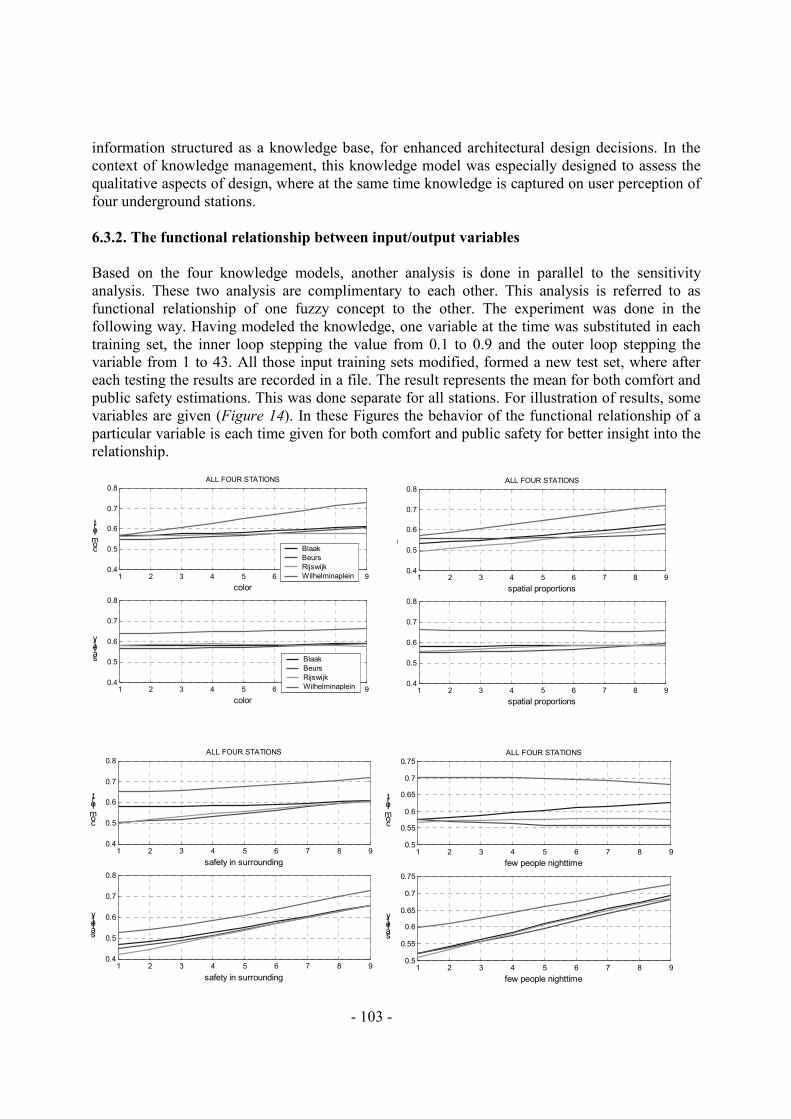
- 103 -
information structured as a knowledge base, for enhanced architectural design decisions. In the context of knowledge management, this knowledge model was especially designed to assess the qualitative aspects of design, where at the same time knowledge is captured on user perception of four underground stations. 6.3.2. The functional relationship between input/output variables Based on the four knowledge models, another analysis is done in parallel to the sensitivity analysis. These two analysis are complimentary to each other. This analysis is referred to as functional relationship of one fuzzy concept to the other. The experiment was done in the following way. Having modeled the knowledge, one variable at the time was substituted in each training set, the inner loop stepping the value from 0.1 to 0.9 and the outer loop stepping the variable from 1 to 43. All those input training sets modified, formed a new test set, where after each testing the results are recorded in a file. The result represents the mean for both comfort and public safety estimations. This was done separate for all stations. For illustration of results, some variables are given (Figure 14). In these Figures the behavior of the functional relationship of a particular variable is each time given for both comfort and public safety for better insight into the relationship.
1 2 3 4 5 6 7 8 90.4
0.5
0.6
0.7
0.8ALL FOUR STATIONS
spatial proportions
comfort
1 2 3 4 5 6 7 8 90.4
0.5
0.6
0.7
0.8
spatial proportions
safety
1 2 3 4 5 6 7 8 90.4
0.5
0.6
0.7
0.8ALL FOUR STATIONS
color
comfort
Blaak Beurs Rijswijk Wilhelminaplein
1 2 3 4 5 6 7 8 90.4
0.5
0.6
0.7
0.8
color
safety
Blaak Beurs Rijswijk Wilhelminaplein
1 2 3 4 5 6 7 8 90.4
0.5
0.6
0.7
0.8ALL FOUR STATIONS
safety in surrounding
comfort
1 2 3 4 5 6 7 8 90.4
0.5
0.6
0.7
0.8
safety in surrounding
safety
1 2 3 4 5 6 7 8 90.5
0.55
0.6
0.65
0.7
0.75ALL FOUR STATIONS
few people nighttime
comfort
1 2 3 4 5 6 7 8 90.5
0.55
0.6
0.65
0.7
0.75
few people nighttime
safety

- 104 -
Figure 14: Functional relationship of several variables
With such a method, the actual functional relationship of one fuzzy concept to the other is precisely given. This method confirmed the results obtained by sensitivity analysis in a sense that as a slope becomes steeper, indicating a significant comfort/public safety change with changed values. That is, comfort and public safety are more sensitive to that particular variable. In addition, the positive or negative effect of the change can be identified. These results are important for the following reasons. Firstly, if any of these stations were to be reconstructed (as it is the case for Blaak and Beurs station), out of this model, knowledge can be obtained regarding problematic aspects. An indication could be obtained immediately showing the effect of change. At the same time, this knowledge model provides an indication of amount of intervention and suitability of an aspect for an improvement. It is important to note that the results obtained in the earlier graphs are obtained by means of an averaging process, that is a smoothing over of all 196 cases. Therefore, it might be expected that there should be no significant change at the outcome. However, the graphs show that the dependency between the pair of variables is noticeable and that dependency is in most cases non-linear, indicating a non-linear relationship. These results are already a strong indication that the exact relationship without smoothing between the variables is non-linear. Here, by exact
1 2 3 4 5 6 7 8 90.4
0.5
0.6
0.7
0.8BLAAK/BEURS/WILHELMINAPLEIN STATIONS
pleasantness metro platform
comfort
1 2 3 4 5 6 7 8 90.4
0.5
0.6
0.7
0.8
pleasantness metro platform
safety
1 2 3 4 5 6 7 8 90.4
0.5
0.6
0.7
0.8ALL FOUR STATIONS
platform width
comfort
1 2 3 4 5 6 7 8 90.4
0.5
0.6
0.7
0.8
platform width
safety
1 2 3 4 5 6 7 8 90.5
0.55
0.6
0.65
0.7
0.75ALL FOUR STATIONS
few people nighttime
comfort
1 2 3 4 5 6 7 8 90.5
0.55
0.6
0.65
0.7
0.75
few people nighttime
safety
1 2 3 4 5 6 7 8 90.4
0.5
0.6
0.7
0.8BLAAK/RIJSWIJK STATIONS
lighting of train platform
comfort
1 2 3 4 5 6 7 8 90.4
0.5
0.6
0.7
0.8
lighting of train platform
safety

- 105 -
relationship it is understood to be the relationship obtained without averaging process. It was quite interesting to find out how much such non-linearity could effect the outputs of a model using linear approximation. Therefore a comparison will be made between the existing results and the results obtained with a linear model. For that purpose, an additional effort was done to conduct a multivariate linear regression to show to which extent the outcomes would differ. For comparison, only Blaak data is considered. Firstly, the multi-linear regression analysis is done in order to establish the model and the results are given in Figure 15.
Figure 15: Multivariate linear regression model for comfort (upper figure) and safety (lower
figure) at Blaak station Having established a linear model, the model was tested on the same test cases used earlier. The approximation error is given in Table 11 and the graphical representation of test results obtained by linear model is given in Figure 16. These results show that approximation by linear model gives a higher error than the approximation by non-linear model. Table 11: comparison of test results between non-linear and linear model
Errors for non-linear model Errors for linear model Ec = 6.0435286e-002 (comfort) Ec = 7.5564857e-002 (comfort) Es= 7.2122429e-002 (safety) Es = 1.2374471e-001 (safety) Ecs= 6.6278857e-002 (average model error)
Ecs= 9.9654786e-002 (average model error)
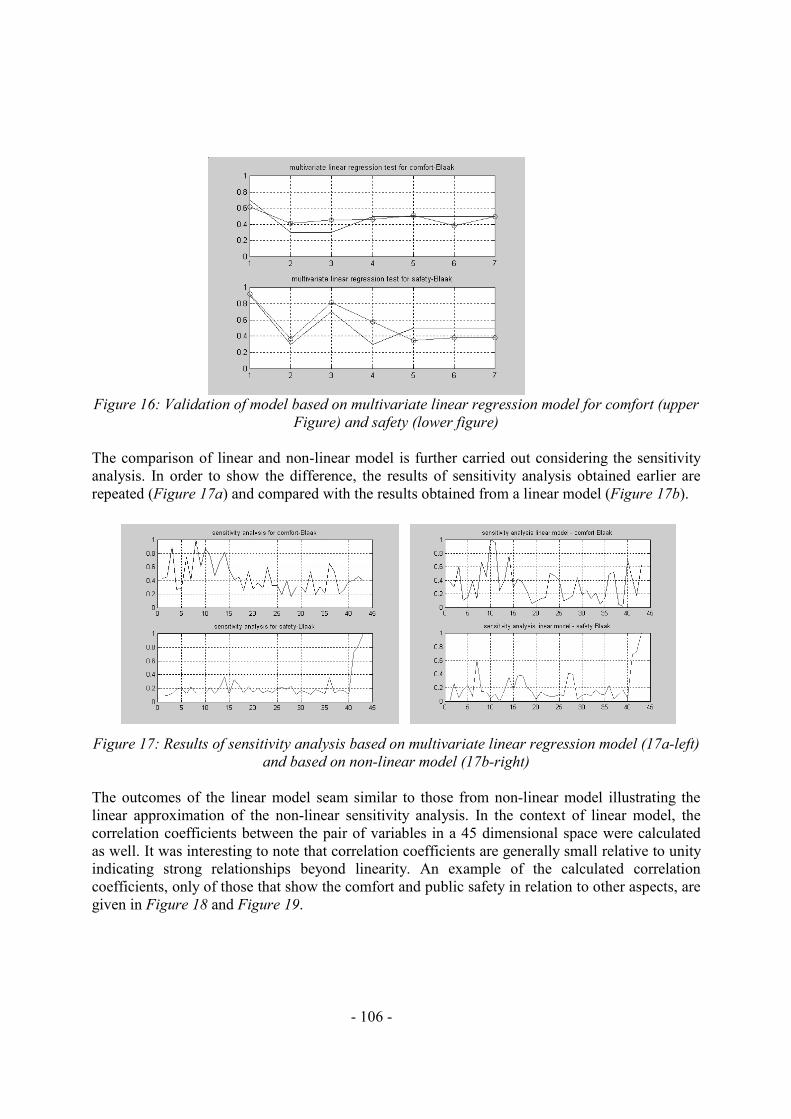
- 106 -
Figure 16: Validation of model based on multivariate linear regression model for comfort (upper Figure) and safety (lower figure)
The comparison of linear and non-linear model is further carried out considering the sensitivity analysis. In order to show the difference, the results of sensitivity analysis obtained earlier are repeated (Figure 17a) and compared with the results obtained from a linear model (Figure 17b). Figure 17: Results of sensitivity analysis based on multivariate linear regression model (17a-left)
and based on non-linear model (17b-right) The outcomes of the linear model seam similar to those from non-linear model illustrating the linear approximation of the non-linear sensitivity analysis. In the context of linear model, the correlation coefficients between the pair of variables in a 45 dimensional space were calculated as well. It was interesting to note that correlation coefficients are generally small relative to unity indicating strong relationships beyond linearity. An example of the calculated correlation coefficients, only of those that show the comfort and public safety in relation to other aspects, are given in Figure 18 and Figure 19.

- 107 -
Figure 18: Linear regression model - comfort in relation to other aspects
Figure 19: Linear regression model - safety in relation to other aspects
Referring to earlier discussion it is clear that for this research, any linear/non-linear statistical model, parametric/non-parametric would not be appropriate. On one hand, for the data at hand there is no base for any statistical parametric models. Alternatively, there is no information on the statistical properties of the data to form a non-parametric model. In contrast with the statistical model considerations, the modeling by soft computing methods provides a computational model, which is totally in accordance with the data provided. At the same time, the vagueness/fuzziness is inherently taken care of by fuzzy logic methods. These are all accomplished by the RBF approach, which has a number of outstanding properties in this respect. Having obtained the results from sensitivity analysis and having determined the exact function for various variable pairs it becomes important to find out how these results can be interpreted in a perspective of user preferences. 6.3.3. User preferences in respect to design parameters For comparison, some results of user preferences are given for all four stations, reducing the results to 3 scales as positive, neutral and negative (Figure 20). For example, color was found the most sensitive aspect to comfort for Wilhelminaplein station. Looking at the user preferences, about 74% of the selected population group found the colors applied at WP station quite
0
0.2
0.4
0.6
0.8
1
1 4 7 10 13 16 19 22 25 28 31 34 37 40 43
0
0.2
0.4
0.6
0.8
1
1 4 7 10 13 16 19 22 25 28 31 34 37 40 43

- 108 -
attractive and only 5.5% not, while for Beurs station only 21% found the colors attractive and 49% not.
48.5
11.2
11.4
5.5
30.9
24.7
33.5
20.7
20.6
64.2
55.1
73.9
beurs
blaak
rijswijk
wilhelmina
positiveneutralnegative
color 22
7.9
16.1
4.9
32.3
19.2
25
9.1
45.6
72.9
59.9
86
beurs
blaak
rijswijk
wilhelmina
positiveneutralnegative
spatial proportions
25.8
29.8
37.8
10.2
36.3
43.6
29.1
22.1
37.9
26.5
33.1
67.6
beurs
blaak
rijswijk
wilhelmina
positiveneutralnegative
pleasantness platform 33.3
13.1
8
5
25.6
17.8
21.2
17.5
41.1
69.1
70.8
77.6
beurs
blaak
rijswijk
wilhelmina
positiveneutralnegative
overview at entrance
16.9
14.9
16
9.1
24
24.2
22.4
21.1
59.2
60.9
61.6
69.8
beurs
blaak
rijswijk
wilhelmina
positiveneutralnegative
few people daytime 7.7
16.7
24.8
7.2
29.2
32.9
29.7
10.9
63.1
50.5
45.5
81.9
beurs
blaak
rijswijk
wilhelmina
positiveneutralnegative
lighting platform
4.6
2.3
4.9
3.9
17.3
19.6
20.1
9.9
78.1
78
75
86.8
beurs
blaak
rijswijk
wilhelmina
positiveneutralnegative
platform height 20.4
11.7
11.9
1.8
27
30.8
19.2
14
52.6
57.5
69
84.2
beurs
blaak
rijswijk
wilhelmina
positiveneutralnegative
platform width
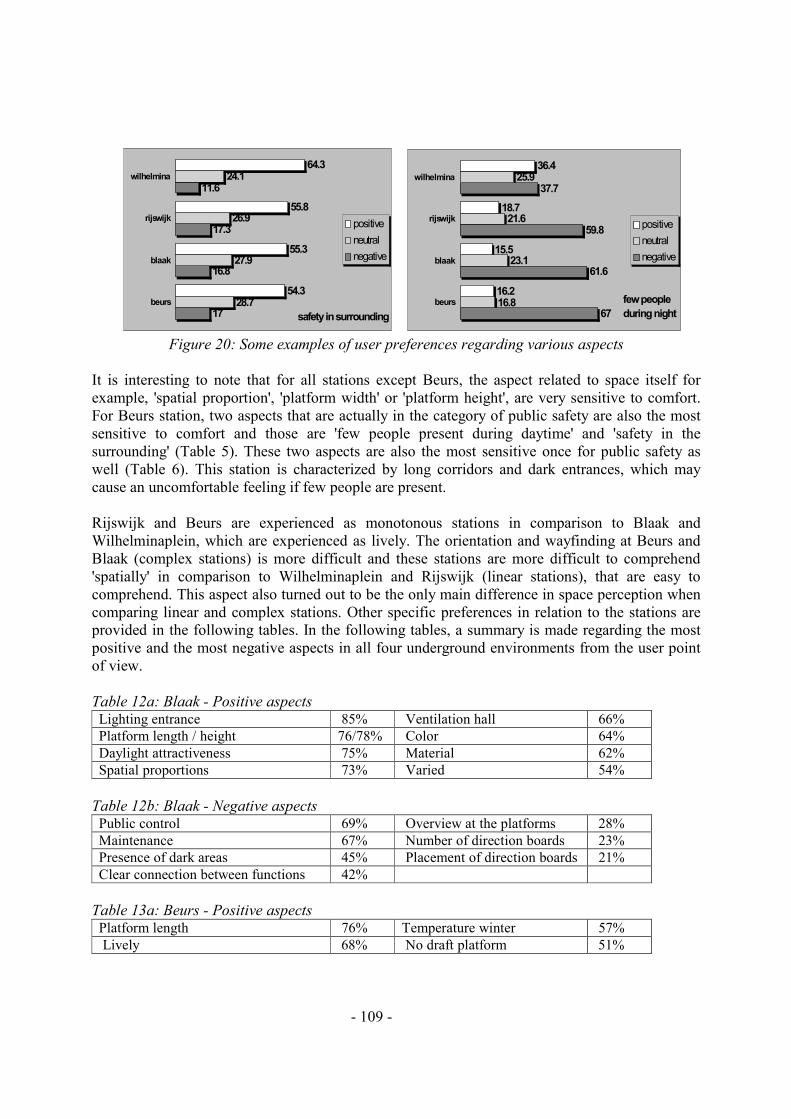
- 109 -
Figure 20: Some examples of user preferences regarding various aspects It is interesting to note that for all stations except Beurs, the aspect related to space itself for example, 'spatial proportion', 'platform width' or 'platform height', are very sensitive to comfort. For Beurs station, two aspects that are actually in the category of public safety are also the most sensitive to comfort and those are 'few people present during daytime' and 'safety in the surrounding' (Table 5). These two aspects are also the most sensitive once for public safety as well (Table 6). This station is characterized by long corridors and dark entrances, which may cause an uncomfortable feeling if few people are present. Rijswijk and Beurs are experienced as monotonous stations in comparison to Blaak and Wilhelminaplein, which are experienced as lively. The orientation and wayfinding at Beurs and Blaak (complex stations) is more difficult and these stations are more difficult to comprehend 'spatially' in comparison to Wilhelminaplein and Rijswijk (linear stations), that are easy to comprehend. This aspect also turned out to be the only main difference in space perception when comparing linear and complex stations. Other specific preferences in relation to the stations are provided in the following tables. In the following tables, a summary is made regarding the most positive and the most negative aspects in all four underground environments from the user point of view. Table 12a: Blaak - Positive aspects Lighting entrance 85% Ventilation hall 66% Platform length / height 76/78% Color 64% Daylight attractiveness 75% Material 62% Spatial proportions 73% Varied 54%
Table 12b: Blaak - Negative aspects Public control 69% Overview at the platforms 28% Maintenance 67% Number of direction boards 23% Presence of dark areas 45% Placement of direction boards 21% Clear connection between functions 42%
Table 13a: Beurs - Positive aspects Platform length 76% Temperature winter 57% Lively 68% No draft platform 51%
17
16.8
17.3
11.6
28.7
27.9
26.9
24.1
54.3
55.3
55.8
64.3
beurs
blaak
rijswijk
wilhelmina
positiveneutralnegative
safety in surrounding 67
61.6
59.8
37.7
16.8
23.1
21.6
25.9
16.2
15.5
18.7
36.4
beurs
blaak
rijswijk
wilhelmina
positiveneutralnegative
few people during night

- 110 -
Table 13b: Beurs - Negative aspects Maintenance 69% Overview entrance 33% Few people present during night 67% Lighting entrance 24% Spaciousness entrance 56% Ventilation platform 23% Escape possibilities 52% Material 22% Color 49% Spatial proportions 22% Pleasantness entrance 36% Overview in general 20% Furniture 35% Platform width 20%
Table 14a: Rijswijk - Positive aspects Wayfinding at the station 89% Overview at entrance 71% Wayfinding entrance 85% Platform width 69% Lighting entrance 85% Pleasantness entrance 66% Spaciousness entrance 82% Clear conn. between functions 54% Daylight attractiveness 73 % Daylight orientation 48%
Table 14b: Rijswijk - Negative aspects Public control 75% Distance between functions 48% Noise 68% Platform length 42% Draft platform 64% Monotonous 39% Maintenance 60% Pleasantness platform 38% Temperature winter 53% Lighting platform 25%
Table 15a: Wilhelminaplein- Positive aspects Spacious 96% Ventilation platform 77% Maintenance 87% Color 74% Spatial proportions 86 % Pleasantness entrance 74% Overview at platform 85% Temperature summer 74% Overview 85% Placement of direction boards 68% Platform length, width, height 84, 84, 86% Number of direction boards 68% Light 83% Pleasantness metro platform 67% Lighting platform 82% No noise 66% Material 81% Clear connections 64% Ventilation hall 80% No presence of dark areas 60% Overview entrance 77% Furniture 55%
Table 15b: Wilhelmina - Negative aspects Distance between functions 44% Deserted 33%
Looking at the general observation regarding comfort and public safety, Wilhelminaplein station scores the best for both of these variables, while Rijswijk and Beurs station have the worst results of assessments (Figure 21 and Figure 22).
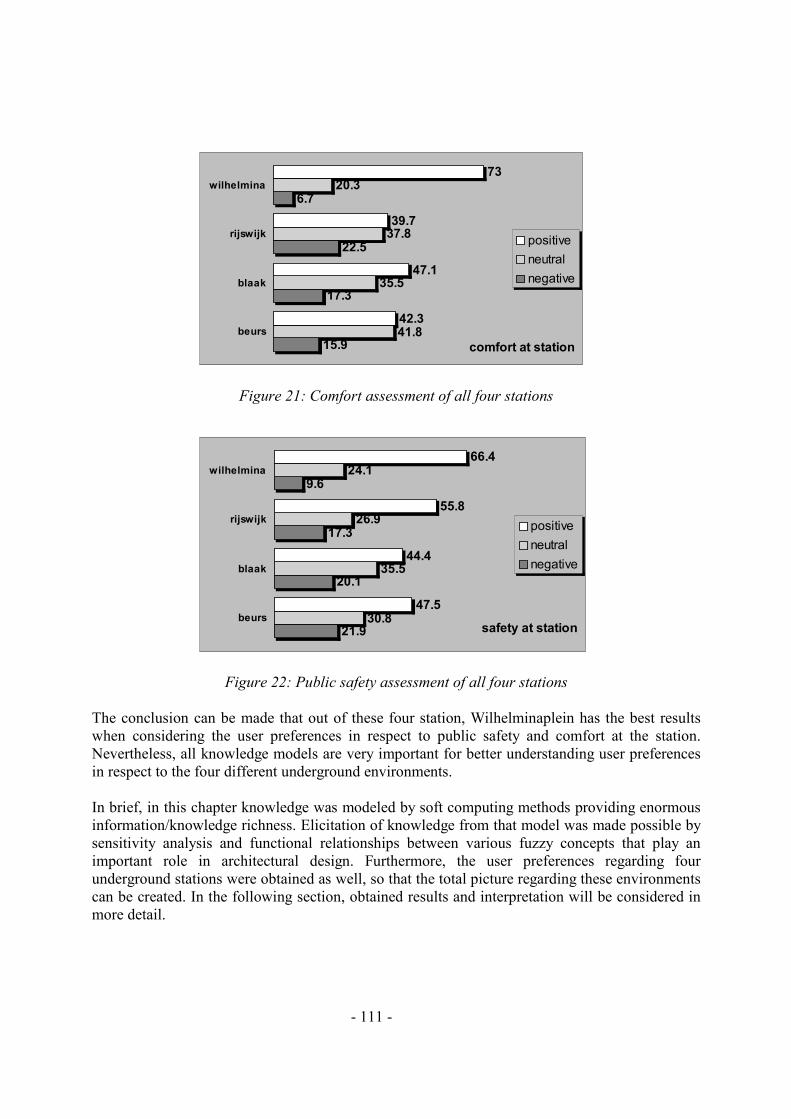
- 111 -
Figure 21: Comfort assessment of all four stations
Figure 22: Public safety assessment of all four stations
The conclusion can be made that out of these four station, Wilhelminaplein has the best results when considering the user preferences in respect to public safety and comfort at the station. Nevertheless, all knowledge models are very important for better understanding user preferences in respect to the four different underground environments. In brief, in this chapter knowledge was modeled by soft computing methods providing enormous information/knowledge richness. Elicitation of knowledge from that model was made possible by sensitivity analysis and functional relationships between various fuzzy concepts that play an important role in architectural design. Furthermore, the user preferences regarding four underground stations were obtained as well, so that the total picture regarding these environments can be created. In the following section, obtained results and interpretation will be considered in more detail.
21.9
20.1
17.3
9.6
30.8
35.5
26.9
24.1
47.5
44.4
55.8
66.4
beurs
blaak
rijswijk
wilhelmina
positiveneutralnegative
safety at station
15.9
17.3
22.5
6.7
41.8
35.5
37.8
20.3
42.3
47.1
39.7
73
beurs
blaak
rijswijk
wilhelmina
positiveneutralnegative
comfort at station

- 112 -
6.4. Obtained results and interpretations It was earlier mentioned (Chapter 2, Section 2.5.) that only spatial aspects were considered for this research, while there are other aspects also relevant for public safety and comfort, such as institutional, social and crime aspects (RISC model). In that respect the conclusions related to these four stations can be considered only within a studied domain. With the method used in this research, some common features for all four stations were identified. Naturally, with the increased number of case studies, more generalization would be possible which could enrich our common knowledge regarding perception and design of underground stations. In respect to public safety especially, three aspects play the most important role. Those are the safety in the surrounding of the station, presence of people during daytime and presence of people during night. This already gives a certain indication, meaning that following conclusions can be made. The location of the station is very important in respect to the surrounding of that station. If the surrounding is perceived to be unsafe, then the perception of public safety at station will be strongly affected, meaning that people would not feel safe at that station as well. This means that if the station were to be reconstructed with a goal to improve public safety at the station, then first the surrounding of the station should be considered. If the results are satisfactory, further investigation can be conducted in relation to the underground station. Otherwise, discussion should be initiated with the relevant partners, for example the municipality where the station is located, to form common goals regarding improvement of stations surrounding. This applies not only to underground stations but also to design/redesign of any building/area which requires a considerable consideration of the surrounding if the goal is to design 'publicly safe' environment. Another common feature for four stations was the presence of people during daytime and during night. During daytime people felt generally safer even if there were less people present than it was the case during night hours. At the moment, most metro and train stations are quite isolated from other city activities, while in other countries, for example Canada and Japan, stations are successfully combined with other functions as well. Those are mainly shopping centers, cinemas, sport facilities, food services, etc. In such way, there are people present in the night hours as well. This is an important suggestion for future development where these functions can be successfully combined, for example, in a form of Mobility Hubs. An example of such development is a new Master Plan for Rotterdam Central. In a somewhat smaller scale, such a principle could be also applied to other stations as well. An interesting result is that for Wilhelminaplein people in general felt much safer during night hours than was the case for other three stations. Looking at other aspects that were also relevant to public safety, it is remarkable that all of them have very high score. This is an indication that presence of people in the night hours can be compensated through other aspects, such as public safety in the surrounding of the station. This has to be high, providing a very good overview of the platform and entrance area etc. In the case of comfort, some common features are present for all four stations. The results show that spatial proportions and the dimensions are of most importance for the perception of comfort. Further, in the text conclusions that are more specific are provided to show in which form support to the designers can be provided, based on the established knowledge model. In that respect more insight into specific design solutions is needed.

- 113 -
This study considered both metro and train stations. The metro platforms are in general shorter, with length up to 90 meters. The train platforms are much longer, until about 300 meters. The difference in platform lengths is based on different length of metro and train composition. In that respect the positioning of entrance in relation to distance is crucial for train stations as it became evident in this study. Two train stations were Rijswijk and Blaak. In Figure 23 and Figure 24, the schematic presentation of the main entrance positions is given for these two stations.
Figure 23: Rijswijk station with two head entrances and a long platforms in-between
Figure 24: Blaak station with one central entrance and emergency side exits Both these stations are drive-through stations. In the case of Rijswijk station 42% experience the length of station as quite unsatisfactory since the train stops at the middle, just between two entrances. While at Blaak station, only 6.5% find the length unsatisfactory and the train stops just by the entrance. Even if for Rijswijk station the train would stop closer to one of the entrances, the problem would not be solved since many people would still need to use the other entrance. In that respect a conclusion can be drawn that for drive-through stations one central entrance is advised, since it is perceived more efficient and is generally more acceptable by the public in terms of perceived distance. Another interesting remark is regarding the platform widths for Blaak and Rijswijk stations. In the case of Rijswijk, the sensitivity analysis showed that this aspect was on sixth place in relation to safety. For Blaak station, this aspect was on thirtieth place in relation to safety. Such discrepancy was remarkable so more detailed study of this particular aspect was needed. The platforms at Blaak and Rijswijk station have the same width (~ 9 m). By investigating the objects present at the platforms, as explained in Chapter 3, under the section Furniture positioning and design, the following conclusion could be made. This could provide an answer why this aspect had such a high influence on safety at Rijswijk station and not so much at Blaak station.
~ 200 m
entrance entrance
platform
~ 200 m
entrance platform

- 114 -
From spatial analysis it became evident that width at Rijswijk station was by the stairs quite critical (~1.3 meter broad), without any fence or protection towards the rails (Figure 25). With trains passing by going more than 100km/h, this makes it very dangerous in terms of safety, even physical safety. Since the elevators are placed behind the stairs, platform width besides the stairs becomes critical, which was criticized by the majority of passengers in the open question.
Figure 25: Schematic representation of platform (left figure) and detail (right figure) In the Figure 26, two examples at Rijswijk station are illustrated where the positioning of elements at the platform is given in relation to platform width. Left figure is at the same time an illustration of Detail A, which was schematically drawn in Figure 25. Due to quite narrow passages by the stairs, the aspect of platform width had a high influence on perception of safety.
Figure 26: The problem area for platform width at Rijswijk station (~ 1.3m)(left figure) and at
the same station another example as it actually should be (~ 2.5m)(figure right) In discussion with the architect, it was stated that the width of the stairs was required by the Fire Department in relation to evacuation norms. In that respect the stairs could not have been narrower. However, even if the platform and the stairs were to remain the same width, another solution could have been proposed. In that case the elevators should be placed before the stairs rather than behind. In that respect the width by the stairs would not be critical since that path would not be used by the passengers at all. For Blaak station this was not the problem area since the minimum distance from the edge of the platform until objects placed on a platform was at least 2.2m.
platform ~1.3 m
train rails
elevator
Detail A
A

- 115 -
Some specific conclusions can be made regarding daylight and lighting aspect at platforms (Figure 27). Although each station provided the required lighting according to norms, still people perceive some stations better lighted than the others. In Figure 27, the user perception regarding this aspect is presented. The results show that Wilhelminaplein and Beurs station, were perceived as well lighted stations, while Blaak and Rijswijk station were not satisfactory. In order to understand this, more insight into lighting aspect is needed, which means that other sources of light should be considered as well, such as daylight. At Wilhelminaplein and Beurs station, there is an even distribution of light, which gives an impression that the platforms are well lighted. These stations in principle have indirect daylight, which is mainly provided from sides rather than from the above (opening in ceiling).
Figure 25: User perception of lighting at platform for four stations At Blaak, daylight is provided from the openings in the ceiling while at Rijswijk station it is provided from the openings in the ceiling, as well as from the end openings of the tunnel. These two station do not have equal light distribution and therefore give an impression that the lighting is not satisfactory. Daylight openings as much as one might think would have a positive effect, since they provide contact with the outside world, also have a negative effect since they create a "spot-light" or "blacklighting" effect. This makes sharp contrasts in light intensity with the surrounding environment. The effect gives an impression that the rest of the environment is not lit well enough since the objects appearing in the spotlight and just next to it are not lighted with the same intensity. Naturally, this effect disappears during night hours, since the artificial light is more or less equally distributed. The reason why Rijswijk station is experienced even darker than Blaak station is due to the double effect, of both "spot-light" and "blacklighting". Another reason may be also more daylight openings, which are placed in a certain rhythm, which strengthens the effect by creating areas well lighted and areas not lit well enough. The result of these effects can be seen in Figure 28.
7.7
16.7
24.8
7.2
29.2
32.9
29.7
10.9
63.1
50.5
45.5
81.9
beurs
blaak
rijswijk
wilhelmina
positiveneutralnegative
lighting platform

- 116 -
Figure 28: Spot-light and backlight effect caused by daylight openings at Rijswijk station
In this respect, suggestions could be made for readjustment of norm for underground spaces that not simply amount of lux on surface is required, but more importantly, equal distribution of light, if daylight openings are part of a design. Daylight intensity is much higher and varies in respect to weather conditions and time of day, therefore deciding to introduce daylight openings into underground station requires the special attention of designers to avoid negative effects. The form and positioning of light requires special attention as well. At Wilhelminaplein, spotlights were used in the entrance area and at platforms, lights are positioned perpendicular to sidewalls rather than parallel to walls (Chapter 5, Section 5.2.2, and Figures 12-14). In Figure 28 (right figure), an example of placing artificial light parallel to sidewalls is shown for Rijswijk station. This has two side-effects, the light is not evenly distributed and length of the platform is even more articulated. Another important aspect is the use of reflective materials and color, which can influence the perception of this particular aspect. In case of Beurs station, sensitivity analysis showed that lighting of entrance was on a eleventh place in relation to safety, while for other three stations it was placed 39 for Blaak, 32 for Rijswijk and 35 for Wilhelminaplein station. Parallel to these results, user perception regarding this aspect together with user perception of entrance spaciousness is given in Figure 29. Lighting of entrance at all stations, except Beurs, was perceived as very satisfactory. In that respect Beurs was the only station that had no distinguishing main entrance like the other stations. The entrances at Beurs station are quite narrow and poorly lighted which in such combination also had an influence on public safety.

- 117 -
Figure 29: User perception of lighting of entrance (left figure) and spaciousness entrance (right figure) for all stations
In Figure 30, an example of entrances at Beurs and Rijswijk station, is shown. In respect to spaciousness of entrance and lighting of entrance, Rijswijk station was very positive from a user point of view.
Figure 30: Lighting at entrance for Beurs (left figure) and Rijswijk (right figure)
For Wilhelminaplein, which was the most successful in terms of user satisfaction on almost all aspects, some general remarks can be made which distinguishes this station from the other three: •= it is a continuous space where sharp angles are generally avoided •= there is a difference in platform width which strengthens the sense of direction and indicates
the position of main entrance •= usage of reflective materials and light colors gives an impression that the space is better
lighted •= spaciousness, broad platforms and high ceiling •= good overview from entrance level over the whole platform
24.2
2.9
4.9
2.5
26.8
12.7
9.8
9.6
48.9
84.6
85.4
87.9
beurs
blaak
rijswijk
wilhelmina
positiveneutralnegative
lighting entrance 55.6
14.1
3.2
7.4
17
28.2
15.4
17.9
27.3
57.7
81.4
74.7
beurs
blaak
rijswijk
wilhelmina
positiveneutralnegative
spaciousness entrance

- 118 -
•= at platforms, artificial light is placed perpendicular to walls rather than parallel to walls and there is an additional artificial lighting directed towards the ceiling so that even distribution of light was achieved
The illustration of these characteristics can be seen in Figures 12, 13, 14 and 15 in Chapter 5, Section 5.2.2. It is impossible to write down all conclusions that can be drawn from the knowledge model and spatial analysis, so therefore only few examples were given to illustrate the potential of the method used in this research.

- 119 -
CHAPTER 7
Conclusions and recommendations 7.1. Main findings and conclusions This thesis proposes a method for modeling qualitative design aspects in relation to public safety and comfort in underground stations. This method makes it feasible to assess the quality of existing spaces with the presence of numerous aspects, which altogether determine that quality. In this respect, the users of underground stations were the starting point for this research and knowledge modeling. The quality of space was assessed through users perception of four underground stations with public safety and comfort as main dependant variables. The established knowledge model captured tacit knowledge with respect to group perception of four underground stations. This knowledge model contains also a knowledge about itself (meta-knowledge) which was later analyzed in order to obtain new knowledge. As a final product, tacit knowledge was converted to explicit knowledge by sensitivity analysis and functional relationships. In short, following steps were followed, which can also be applied to different research problem, since the method is quite generic: •= specification of location and context •= determination of dependent and independent variables •= information acquisition (through interviews, questionnaire, available data from different
sources etc.) •= automated knowledge modeling by soft computing and determination of relationships
between dependant and independent variables •= based on established knowledge model, knowledge elicitation by various techniques so that
tacit knowledge is translated into explicit knowledge The research can be conducted for existing buildings and built environments, and conclusions drawn from such studies become inputs for new projects. This supports the decision-making process regarding reconstruction, interpolation and transformation. This represents the social relevance of this research.

- 120 -
Architects deal not only with new designs but also with reconstruction and transformation of spaces in order to improve the quality of existing spaces. Having in mind that the three main policy strategies are intensification, transformation and combination, this will be required even more from the designers. In that respect, the method explained could be used to identify problems, and the most important aspects in a given environment. These results are time dependent in a sense that due to changes within the society, changes in perception of public safety, comfort or some other qualities can be expected as well. Therefore, constant monitoring of these changes with its reflection on public safety and comfort is necessary in order to guide transformations in a meaningful way. This ensures a better quality of any spatial intervention. This research indicates a need for changes in traditional architectural practice. Architectural offices should in the future have a strong research unit next to designing team, to be able to deal with contemporary society issues in an efficient and responsible way. This is feasible for large companies that can afford such development. In the end, changes are necessary in our education system in order to educate not only designers but also to teach students to design by research. More co-operation with different parties is becoming inevitable. This includes the user, who is the 'invisible partner' in the planning and design process, but the most prominent in the use of the building. During the past few years, there are some evident movements in the direction to improve the communication and flow of information, so that the designer is advised from the beginning on relevant issues. An example is the Integral Safety Policy (Integrale Veiligheids Beleid) which was initiated by the Dutch Ministry of Internal Affairs and in that respect the instrument Safety Effect Report (VeiligheidsEffectRapportage - VER) is being further developed (Van Dijk, et. al., 2000). The VER is an instrument that makes realization of large projects transparent and shows the effect that it has on an integral safety (physical and public safety). It is an instrument that has already been implemented for reconstruction and improvement of existing stations such as those at Utrecht, Rotterdam and Delft. It also indicates the necessary facilities in the management phase. The main goals of the VER are to (VERRC, 2002): •= achieve an interactive dialog regarding safety with all parties involved •= stimulate the link between physical and public safety by taking into consideration the mutual
interaction process •= have an insight in possible safety risks in both domains •= develop alternatives that would accommodate the requirements •= come to an agreement regarding the measures and the activities that are needed in order to
realize the chosen alternative and safety scenario •= control the realization of these agreements during the planning and building process •= propose solutions for an effective management regime during and after realization of the
plans in order to realize and guarantee the optimal safety Having in mind the main goals of VER, it can be stated that the method and techniques applied through this research are very relevant to VER and could be efficiently used in different stages of the VER process. An example of an application is using it to identify the problem areas and to model the dependencies and thereafter determine the most effective change. This method cuts through and integrates different disciplines that deal with decision-making in relation to the built environment, and in such way can steer the decisions based on thorough study and modeling of soft data.

- 121 -
Furthermore, this research is also relevant for Municipalities, the Dutch Railway Company, Metro companies, Police, Project Developers and Policy Makers. In order to improve the quality of the built environment this research is quite valuable. With application of this method, the potential of location for further development can be shown together with hierarchical order of all studied aspects. If a RISC model (as explained in Chapter 2, Section 2.5) would be applied over time, the changes and associated values could be learned by the system. In that respect, better understanding of social changes and its effects on users perception could be obtained. However, even more challenging for designers is to learn about how change in design can influence an individual/group behavior and therefore the society as well. This research provides a possibility in these directions, but a lot of additional research needs to be done in order to form knowledge on these issues. Since the method can be used for decision making it can be valuable for different parties. Below, some possible applications are named in which relevancy to various parties is highlighted: For project developers and policy makers: •= based on location potential and user requirements make a better decision in respect to future
development For a municipality, this method can provide the following: •= by conducting similar type of research the quality of the neighborhoods can be made
transparent and improved. The study on quality can be done on different levels, for example, on the level of an apartment, street, neighborhood, and at the city level. In such a way, different qualities on each level can be modeled and represented in one model. This model would show the most relevant aspects for the choice of certain location, the qualities that people have in their surrounding, and the ones that they miss.
•= Studies could be also made into the multi-cultural qualities of the built environment and the requirements of different cultural groups.
For Dutch Railway and Metro companies, this method can provide the following: •= the results obtained from this research are relevant for four particular stations and they can
serve as a guideline for possible improvements, especially for the Blaak, Rijswijk and Beurs stations, which did not have as satisfactory results from the user view point as did the Wilhelminaplein station
•= the method explained in this research can be used by these companies for other stations in the case of reconstruction and improvements of the stations
•= improved modeling of information for better quality management For Dutch police: •= new techniques for information modeling in respect to crime and crime control Through experiment, the advantage of using soft computing techniques over traditional statistical methods for model formation was shown. This research gave an insight into actual modeling of the relationships between various aspects and the nature of such relationship. More than that, it is a model based on learning, which identifies both linear and non-linear relationships, without any prior assumption regarding data at hand. This research can be applied to complex design decision-making problems and in that respect, it is a valuable contribution not only for the design community but to society as well. It is a contribution to knowledge in a sense that it provides new insight into dealing with soft data in architectural design in a better way, beyond traditional decision support systems and expert

- 122 -
systems. In respect to underground stations, this research clearly showed that comfort and public safety are inseparable and that together they can contribute to better spatial quality. This thesis is also a contribution to a new generation of Decision Support Systems (DSS) and Expert Systems (ES). Handling of imprecise data, which by traditional DSS and ES is an impossible task, was accomplished in this research using fuzzy logic techniques. Therefore, generic information about the relevancy among design items, and the effectiveness of each design item was identified. In this research, one of the tasks was to establish consistent rules. To reduce the complexity of such a system, the rules were established in an intelligent way through learning by machine learning techniques, rather than establishing the rules after careful deliberations on existing information as it was the case in traditional DSS and ES. This was necessary because of the following impossibilities in a complex design environment: First, careful deliberation is not enough to identify the possible inherent relationships in a given information and to identify all rules fully representing the given information. Second, in a complex information system, to establish a generic consistent fuzzy rule-base is a formidable task. This is because a number of necessary rules that needs to be executed increases exponentially with the complexity of the information provided. Third, the execution of rules for a given task is again error prone due to ambivalent decisions, and furthermore may be unacceptably slow due to the volume of necessary executions. This implies that the establishment of rules can be achieved by performing information-mining methods with appropriate learning process, which should be especially designed for a given problem. To reduce the complexity of such a system implies that the information should be represented in a compact form with a structure in which distributed Artificial Intelligence, as adapted in this work, is embedded. 7.2. Application of the method to different research problems The method applied in this thesis serves in a way as an eye-opener to the architectural research community. Whereas in other disciplines like electrical and civil engineering, economics, marketing, medicine etc. soft computing techniques have been widely utilized for many years. In the field of architecture, they are still at the dawn of their development and implementation. It has great potential to be successfully implemented in urban planning, or in architecture and building technology. The application possibilities are endless. This method has already been applied for two different research problems. One application was done in relation to Building Technology and in close co-operation with Elma Durmisevic. This research dealt with transformational possibilities of apartments. It provides the transformational capacity of an apartment, taking into consideration both technical and qualitative aspects, such as: characteristics of construction, positioning of installations, type of connection between components, orientation of apartments, connections between different functions etc. The main findings were published in (Ciftcioglu, et. al., 2000b) and the final publication will come in a form of a PhD thesis by E. Durmisevic. Another application of the method was for research in which the success of neighborhoods was measured through qualities present on the level of apartment, street and district. The results are to be published in a form of a graduate thesis. 7.3. Improvements of the existing model

- 123 -
Additional efforts to improve knowledge model can be done. First, from the results of the sensitivity analysis, the aspects that were found not very sensitive to public safety and comfort, could have been excluded. This would reduce the complexity of the final knowledge model. Second, it could be possible to apply wavelets to the knowledge modeling process, since the signal that was obtained from OLS training can be divided into different frequencies. In RBF networks, the width of the basis functions is an essential parameter, it imposes limitations in the accuracy of the classification, and this is an important issue on RBF network functionality. The required essential solution to this inconvenience can be obtained by orthogonal wavelet decomposition. For each orthogonal wavelet decomposition of every output space variable, a different RBF network would be trained with appropriate widths. Therefore, depending on the frequency of the signal, appropriate width parameter can be applied. The outcome can thereafter be obtained simply by algebraically summing up the outcomes from respective RBF networks corresponding to approximation and detail parts of the wavelet decomposition. In a meanwhile such study has been done and is published in (Ciftcioglu, Durmisevic and Sariyildiz, 2001). Additional effort can be done to find out the exact relationships between all variables introduced in the model. In such way, a better understanding of user perception can be obtained which can be of use to design professionals. The study presented in this work and in this form is suitable for assessment of qualitative design aspects of the already existing built environments. Nevertheless, it is appealing to develop a model for non-existing built environments to assess the quality of 'to be built' projects. 7.4. Extension of the model in a form of multiple experts The model explained in this thesis deals only with the psychological and spatial aspects. There are many other aspects that are also very interesting to architects, such as costs, social or economic aspects, construction, and other technical aspects, etc. The advantage of the model is that it is easy expandable. The knowledge model can be expanded by adding additional aspects that were not dealt with in this research. In such way, by applying the same or similar method as explained in this thesis, other aspects can be dealt with to the same level of detail. This can be explained through a concept of multiresolutional knowledge representation as well as the combination of experts. By combining the knowledge from various experts, multi-objective outcomes can be accomplished. Therefore, a multi-objective Knowledge System could be designed. This would require special kind of information structuring so that expert knowledge can be activated on different levels and with higher or lower information granulation. With such information, structuring it is possible to add additional aspects that were not considered in this study but which are related to underground space. 7.5. Support for design of new facilities In a changing environment with help of 3D visualization such as virtual reality, valuable knowledge can be modeled to see how perception of certain aspects changes in a dynamic spatial environment. In other words, it is highly feasible to discover the effects of space perception by changing the spatial proportions or colors and materials in an underground environment. Thanks to developments in virtual space technology, such research is today feasible. In combination with intelligent technologies explained in this work, significant improvements in knowledge

- 124 -
technology are possible as well. This would set a starting point for applying computational intelligence for design of new facilities, which would even more provide help to architects in early stages of design during the decision-making process. In order to be able to generalize to such an extent, it is necessary to have much more cases than found in this research. This requires additional studies, which would discover more detail about the perception, emotion, motivation and cognition in relation to a given environment. Such study would also help to identify in which way does the change in environment influence the individual or the group. The difficulty, which may appear in such cases, is the absence of social context of the virtual space and fashion change. This again should require another type of research to provide answers. 7.6. Integration of Artificial Intelligence to a CAAD system If the above mentioned study is done, then the question is how to interrelate all these aspects, and at the same time provide necessary computer support for the early stages of design. This can be done by integrating computational intelligence into a CAAD environment. In such way, an architect would design in a familiar 3D environment, while at the same time, design actions would be related to and checked against a knowledge base. Therefore, the designer would receive fast, interactive feedback on particular aspects of concern. These aspects could be activated or deactivated in a CAAD program, depending on designer’s preference and in relation to a design level (knowledge resolution). In such way, a designer would work in an intelligent CAAD environment that would especially support him/her in the conceptual phase of architectural design. That is exactly the phase where intelligent support is still missing. Many people deal with the optimization of conceptual design on various aspects and in a very narrow scope, such as installations, lighting (Groot, 1999) etc. Although the designer requires fragments of knowledge, the knowledge model in a future would consider numerous design aspects at the same time, providing an integral and adequate support for that fragment in which the designer is interested. By changing one design aspect (for example the amount of lighting or width of a platform), a designer cannot imagine all consequences it will have on other aspects of that model, for example, on user's perception of space. In other words, the architect considers one aspect without real insight into the consequences that it had on other aspects. A new model would generate all aspects related to space perception, establishing in such way functions and relationships between all aspects present in the model. Again, this can be extrapolated to any architectural design issue, whether exact or qualitative. With such a model, an architect could know exactly how to manipulate the design in order to improve the overall quality of a design. The number of aspects that could be put into this model are numerous and are possible to deal with thanks to advanced information processing technologies.

- 125 -
Figure 1: Concept of a Smart Support System The above given figure (Figure 1) is a brief representation of the idea which is pointed out by an arrow, that indicates the information processing taking place in the background and directly related to design changes. In other words, during the conceptual design the support is provided online. This aspect of the system makes it especially attractive for the designers. The knowledge model based on previous examples upon which it learned evaluates the design in progress, on numerous aspects. Presently, such system does not exist.
integrated computational intelligence - interactive feedback during conceptual design

- 126 -

- 127 -
Appendix A: Questionnaire for Blaak station
DEZE ENQUETE OVER STATION BLAAK BESTAAT UIT 10 ONDERDELEN
DEEL 1: ACHTERGROND INFORMATIEBij deze vragen dient u 1 antwoord aan te kruisen.
Vraag 1: Bent u een man of een vrouw?
manvrouw
Vraag 2: In welke leeftijdscategorie valt u?
15-2526-4546-6465+
Vraag 3: Wat is uw hoogst genoten opleiding?
lagere school, LBOMAVO, MULO, MBOHAVO, VWOHBO, WO
Vraag 4: Van wat voor type huishouden maakt u deel?
éénpersoonshuishoudentweepersoonshuishouden(twee-ouder) gezin met kinderenéénoudergezinoverig
Vraag 5: Woont u in de omgeving van station Blaak (in een straal van 2 kilometer)?
janee
Vraag 6: Hoe vaak komt u op dit station?
Ik ben er voor het eerstIk kom er vaker, maar niet dagelijks
Ik kom er bijna iedere dag
Vraag 7: Hoe vindt u in dit station de weg?
Ik gebruik mijn richtingsgevoel Ik gebruik borden
Anders, namelijk ……………………………………………………
Vraag 8: Denkt u dat een uitbreiding van functies (bijvoorbeeld meer winkels) in het station en de stationsomgeving, het stationsgebied aantrekkelijker zal maken?
janee
Ga verder op de volgende pagina >>>

- 128 -
DEEL 2: ASPECTEN VAN ATTRACTIVITEIT Voor de rest van de enquête geldt:
bij vragen met a-, b-, c- en d-onderdelen, dient u bij elk onderdeel 1 antwoord te omcirkelen.
Vraag 9: De volgende elementen hebben invloed op de aantrekkelijkheid van een station.Wat vindt u van het gebruik ervan in dit station? (zie onderstaande foto's)
lelijk mooi a) gebruikte kleuren 1 2 3 4 5 b) toegepaste materialen 1 2 3 4 5 c) ruimtelijke proporties 1 2 3 4 5 (afmetingen)
d) meubilair 1 2 3 4 5
pe
Vraag 10: In hoeverre vindt u dat dit station goed onderhouden is?
slecht 1 2 3 4 5 goed
Vraag 11: Vindt u dat de entree en perrons ruim genoeg zijn? (zie onderstaande foto's) nauw ruim
a) entree 1 2 3 4 5 b) perrons (trein) 1 2 3 4 5 c) perrons (metro) 1 2 3 4 5
a) entree b) perrons (trein) c) perrons (metro)
Vraag 12: Vindt u de afmetingen van de trein- en metro perrons goed? (zie bovenstaande foto's)
slecht goeda) lengte 1 2 3 4 5 b) breedte 1 2 3 4 5 c) hoogte 1 2 3 4 5
Vraag 13: In hoeverre vindt u de perrons en entree op dit station aangenaam ?
onaangenaam aangenaama) entree 1 2 3 4 5 b) perrons (trein) 1 2 3 4 5 c) perrons (metro) 1 2 3 4 5
Ga verder op de volgende pagina >>>

- 129 -
DEEL 3: HET VINDEN VAN DE WEG
Vraag 14: In hoeverre heeft u moeite om de entree(s) van dit station te vinden?
veel 1 2 3 4 5 weinig
Vraag 15: In hoeverre heeft u moeite om de weg in dit station te vinden?
veel 1 2 3 4 5 weinig
Vraag 16: Richtingborden helpen ter oriëntatie in een station. Wat vindt u van de plaatsing en het aantalrichtingborden op dit station, om u goed te kunnen oriënteren?
slecht goeda) plaatsing 1 2 3 4 5 b) aantal 1 2 3 4 5
onvoldoende voldoende
DEEL 4: DAGLICHT
Vraag 17: Aangezien dit een ondergronds station is, vindt u dan dat daglicht op de perrons deaantrekkelijkheid van deze ruimte beïnvloedt? (zie onderstaande foto's)
geen invloed 1 2 3 4 5 veel invloed
Vraag 18: Kunt u zich door de aanwezigheid van daglicht in dit station beter oriënteren ?
weinig 1 2 3 4 5 veel
DEEL 5: FYSIOLOGISCHE ASPECTEN
Vraag 19: Vindt u het geluid dat op dit station door de passerende treinen/ metro's veroorzaakt wordt:
hinderlijk 1 2 3 4 5 niet hinderlijk
Vraag 20: Wat vindt u van de temperatuur op dit station?
onaangenaam aangenaam
a) in winter periode 1 2 3 4 5 b) in zomer periode 1 2 3 4 5
VERVOLG DEEL 5 OP DE VOLGENDE PAGINA
Ga verder op de volgende pagina >>>

- 130 -
VERVOLG DEEL 5: FYSIOLOGISCHE ASPECTEN
Vraag 21: Heeft u op dit station last van tocht ?veel weinig
a) in de hal 1 2 3 4 5 b) op de perrons 1 2 3 4 5 c) in de overstapzone 1 2 3 4 5
Vraag 22: In hoeverre vindt u dat de lucht op dit station voldoende wordt geventileerd met frisse lucht?
onvoldoende voldoende a) in de hal 1 2 3 4 5
b) op de perrons 1 2 3 4 5
DEEL 6: OVERZICHTELIJKHEID
Vraag 23: Geef aan in hoeverre er sprake is van een goed overzicht bij elk van de volgende foto's: weinig veel
a) entree 1 2 3 4 5 b) perrons (trein) 1 2 3 4 5
c) perrons (metro) 1 2 3 4 5 d) overstap zone 1 2 3 4 5
a) entree b) perrons (trein)
c) perrons (metro) d) overstap zone
DEEL 7: VLUCHTWEGEN EN VLUCHTMOGELIJKHEDEN
Vraag 24: Heeft u het gevoel dat er op dit station voldoende vluchtwegen aanwezig zijn?
onvoldoende 1 2 3 4 5 voldoende
Vraag 25: Wat vindt u van de loopafstanden tussen de verschillende functies (o.a. entree, loket, perron)op dit station?
lang 1 2 3 4 5 kort Ga verder op de volgende pagina >>>

- 131 -
DEEL 8: VERLICHTING
Vraag 26: In hoeverre zijn de volgende stationsruimtes voldoende verlicht ? (zij foto's bij vraag 23)
onvoldoende voldoendea) entree 1 2 3 4 5 b) perrons (trein) 1 2 3 4 5 c) perrons (metro) 1 2 3 4 5 d) overstap zone 1 2 3 4 5
Vraag 27: Vindt u dat er op dit station slecht verlichte plekken ("donkere hoeken") aanwezig zijn?
zeker wel 1 2 3 4 5 helemaal niet
DEEL 9: SOCIALE VEILIGHEID
Vraag 28: In hoeverre vindt u dat er op dit station sprake is van voldoende toezicht ?
onvoldoende 1 2 3 4 5 voldoende
Vraag 29: Voelt u zich veilig op dit station als er weinig mensen aanwezig zijn?
onveilig veilig a) overdag 1 2 3 4 5
b) 's avonds 1 2 3 4 5
DEEL 10: ALGEMENE VRAGEN
Vraag 30: Ik vind dit station in het algemeen:
a) nauw 1 2 3 4 5 ruimb) onoverzichtelijk 1 2 3 4 5 overzichtelijkc) donker 1 2 3 4 5 lichtd) verlaten 1 2 3 4 5 levendige) eentonig 1 2 3 4 5 afwisselendf) kleurloos 1 2 3 4 5 kleurrijkg) lawaaierig 1 2 3 4 5 stilh) onduidelijk 1 2 3 4 5 duidelijk
Vraag 31: In hoeverre voelt u zich veilig wanneer u zich in de omgeving van dit station bevindt?
onveilig 1 2 3 4 5 veilig
Vraag 32: Voelt u zich veilig op dit station?
onveilig 1 2 3 4 5 veilig
Vraag 33: In hoeverre vindt u dit station aangenaam ?
onaangenaam 1 2 3 4 5 aangenaam
Vraag 34 : Vindt u dat de verbindingen tussen alle ruimtes op dit station duidelijk zijn? (denk hierbij o.a. aande verbindingen tussen entrée, loket, perron)
duidelijk 1 2 3 4 5 onduidelijk

- 132 -

- 133 -
Appendix B : Learning based data analysis - Intelligent knowledge modeling In order to explain the sensitivity analysis and its relation to the knowledge model some additional examples will be provided. These examples serve at the same time to explain exactly what the knowledge model is and further more to explain sensitivity analysis. For that purpose a simple example will be given where only two inputs as independent variables and one output as dependent variable will be considered. For the convenience, the number of cases will be 16. This allows a 3-dimensional data representation. The example of a data-set is given in Figure 1 and exact co-ordinates are provided later in the text for reference, where output y y = f (x1, x2)
Figure 1: Data set with 16 input-output pairs where input is two and output is one dimensional
respectively. Output is the location corresponding to the inputs As it can be seen in Figure 1, the relationship between the data points needs to be established. This is needed since at this moment if the inputs are different from those available in the data set, the estimation of the output is impossible. Before establishing these relationships, it is assumed that there is no abrupt change from one data point to another. In other words, in the present example, the opinion of people is changing from one point to another smoothly, that is, there is no obvious drastic situation causing a sudden big change in opinion. The learning process for the data set means that the information is captured and generalized so that in the situation where data points are not the same as those present in the system, the learned system responds in a consistent way with the data set used for learning. In this respect, the data model established is an intelligent model where the information in the data set is “learned” as a neural net model. This is in contrast with the statistical parameter estimation methods of conventional statistical analyses. If a new data set is given as an input to an established knowledge model, the model produces a logical output consistent with the data set used for learning. This is shown in Figure 2 where the response to a new input is represented with a square.

- 134 -
Figure 2. The response (shown with a square) of the model to a new input.
The input-output relationship is modeled and the visualization of these relationships is given in Figure 3, which represents a knowledge surface for this particular data set. The model represents “learning” given in Figure 2.
Figure 3. Knowledge modeled from the data
In Figure 3, the knowledge surface contains the information of the data set and it is seen that the point estimated by the model is consistent with the existing information.
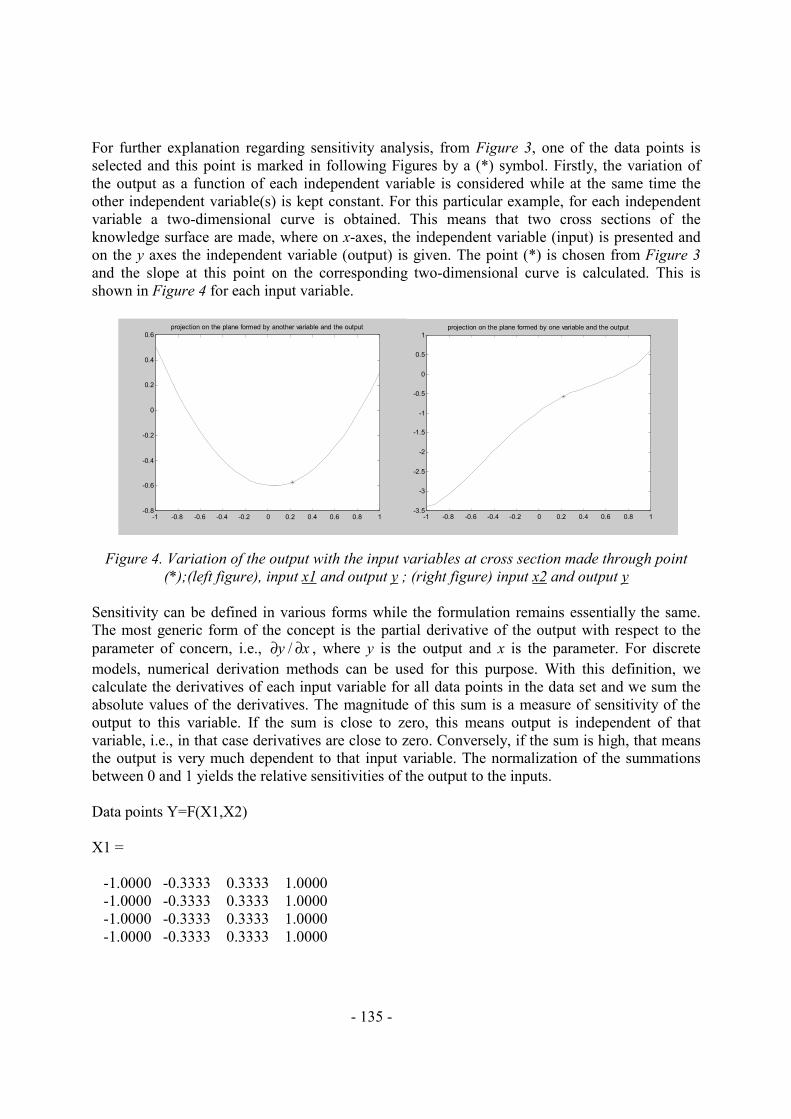
- 135 -
For further explanation regarding sensitivity analysis, from Figure 3, one of the data points is selected and this point is marked in following Figures by a (*) symbol. Firstly, the variation of the output as a function of each independent variable is considered while at the same time the other independent variable(s) is kept constant. For this particular example, for each independent variable a two-dimensional curve is obtained. This means that two cross sections of the knowledge surface are made, where on x-axes, the independent variable (input) is presented and on the y axes the independent variable (output) is given. The point (*) is chosen from Figure 3 and the slope at this point on the corresponding two-dimensional curve is calculated. This is shown in Figure 4 for each input variable.
Figure 4. Variation of the output with the input variables at cross section made through point (*);(left figure), input x1 and output y ; (right figure) input x2 and output y
Sensitivity can be defined in various forms while the formulation remains essentially the same. The most generic form of the concept is the partial derivative of the output with respect to the parameter of concern, i.e., xy ∂∂ / , where y is the output and x is the parameter. For discrete models, numerical derivation methods can be used for this purpose. With this definition, we calculate the derivatives of each input variable for all data points in the data set and we sum the absolute values of the derivatives. The magnitude of this sum is a measure of sensitivity of the output to this variable. If the sum is close to zero, this means output is independent of that variable, i.e., in that case derivatives are close to zero. Conversely, if the sum is high, that means the output is very much dependent to that input variable. The normalization of the summations between 0 and 1 yields the relative sensitivities of the output to the inputs. Data points Y=F(X1,X2) X1 = -1.0000 -0.3333 0.3333 1.0000 -1.0000 -0.3333 0.3333 1.0000 -1.0000 -0.3333 0.3333 1.0000 -1.0000 -0.3333 0.3333 1.0000
-1 -0.8 -0.6 -0.4 -0.2 0 0.2 0.4 0.6 0.8 1-0.8
-0.6
-0.4
-0.2
0
0.2
0.4
0.6projection on the plane formed by another variable and the output
-1 -0.8 -0.6 -0.4 -0.2 0 0.2 0.4 0.6 0.8 1-3.5
-3
-2.5
-2
-1.5
-1
-0.5
0
0.5
1projection on the plane formed by one variable and the output

- 136 -
X2 = -1.0000 -1.0000 -1.0000 -1.0000 -0.3333 -0.3333 -0.3333 -0.3333 0.3333 0.3333 0.3333 0.3333 1.0000 1.0000 1.0000 1.0000 Y = 0 -0.5432 0.7901 4.0000 -2.2222 -1.5802 -0.2469 1.7778 -3.5556 -1.7284 -0.3951 0.4444 -4.0000 -0.9877 0.3457 0 The point taken for estimation (marked by square in Figure 2 and Figure 3) has following input coordinates: X1=0 X2=0.25 For these two inputs the estimated output is Y=-0.56 The point where the gradient is considered for sensitivity (marked by (*) in Figure 3 and Figure 4) has the coordinates: X1=0.33 X2=0.33

- 137 -
References Alsop Architects (2001). Rotterdam Centraal Ontwerp Masterplan. Alsop Architects with
combined design team Rotterdam / London, April, 2001, Rotterdam Arain, M. A. (1996). Modelling and controller design of an EGR solenoid valve using neural
networks. Neural networks and their applications. ed. Taylor, J. G., John Wiley and Sons, West Sussex
Arndt, C. (2001). Information measures: Information and its description in science and engineering. Springer, Berlin
Arthur, P. and Passini, R. (1992). Wayfinding – People, Signs and Architecture. McGraw-Hill Ryerson Limited, Whitby, Ontario
Baarda, D. B. and Goede, de M. P. M (1997). Basisboek Methoden en Techniken, Educative Partners Nederland, BV, Houten
Bell, P.A., Fisher, J.D., Loomis, R.J. (1976). Environmental Psychology. W.B. Saunders Company, USA
Bellman, R. (1978). An introduction to Artificial Intelligence: Can computers think? Boyd and Fraser, San Francisco
Benedetto, J. J. and Frazier M. W., (eds.) (1994). Wavelets, mathematics and applications, CRC Press, London
Bennett, C. (1977). Spaces for People – Human Factors in Design. Prentice-Hall, Inc., Englewood Cliffs, NJ 07632, USA
Bengio, Y. (1996). Neural networks for speech and sequence recognition. International Thomson Computer Press, London
Bezdek C. (1981), Pattern Recognition with Fuzzy Objective Function Algorithms. Plenum, New York
Bhatti, M. A., (2000). Practical Optimization Method. Springer-Telos, ISBN 0-387-98631-6, Berlin
Boer, de E. (1997). Sociaal Veilige Stations Ondergronds? Intern report for NS Railinfrabeheer. Delft University of Technology, Faculty of Civil Engineering, Delft
Broomhead, D.S. and D. Lowe (1988). Multivariable Functional Interpolation and Adaptive Networks, Complex Systems, 2, pp. 321-355
Bosman, A. (1983). Decision support systems, problem processing and co-ordination., ed. Sol, G. G., Process and tools for decision support. North-Holland Publishing Co. IFIP

- 138 -
Bouman, J. (1998). Quality of regularization methods. Delft University Press Bouw Journal, (1995). BOUW, no.3 - 1995 (page 48-53), G. ten Cate, P. van Deelen, “Rotterdam
Is Nooit Af - Operatie Beursplein” Bureau Regio Randstad (2001). Naar een Blauwgroene Deltametropool. Randstad 2010-2030 -
referentiekader voor randstedelijke keuzes. Projektgroep Randsadinbreng Vijfde Nota, Bureau Regio Randstad, January 2001, Utrecht
Carmody, J. and Sterling, R. (1993). Underground Space Design. Van Nostrand Reinhold, USA. Cement Journal, (1995). CEMENT, no.11 - 1995 (page 14-19), Th. A. Feijen, “Metrostation
Wilhelminaplein Rotterdam” Cement Journal, (1996). CEMENT, no 10 - 1996 (page 74-79), A. J. Booij, P. M. Nijhout,
“Beurspleinproject Rotterdam” Chen, G., Ying, M. and Cai, K.Y. (1999). Fuzzy logic and soft computing. Kluwer Academic
Publishers, USA Chen S., Billings S.A. and Luo W. (1989). “Orthogonal least squares methods and their
application to non-linear system identification”, International journal of control, Vol.50, No.5, pp.1873-1896
Chen, S. A., Billings, C. F. N. Cowan and Grant, P. M. (1990). Practical identification of NARMAX models using radial basis functions. International journal of control, vol.52, 1990, pp. 1327-50
Chen S.A., Cowan C.F.N. and Grant, P.M. (1991). Orthogonal Least Squares Algorithm for Radial Basis Function Networks, IEEE Trans. on Neural Networks, Vol.2, No.2, March 1
Chen M.S. and Manry M.T., (1993). Conventional modeling of the multilayer perceptron using polynomial basis functions", IEEE Trans. Neural Networks, Vol.4, pp.164-166
Cherulnik, P.D. (1993). Application of Environment-Behavior Research. Cambridge University Press, Cambridge, printed in USA
Cichocki, A and Unbehauen, R. (1993). Neural networks for optimization and signal processing, New York: Wiley
Ciftcioglu Ö. and S. Sariyildiz (1998). Urban spatial planning by multidimensional information processing technology/wavelet technology. The Architecture Annual 1996-97, Delft University of Technology
Ciftcioglu Ö., Durmisevic S., Durmisevic E. and Sariyildiz S. (1999). Artificial intelligence in building design, Proceedings ISAMA 99, San Sabastian 7-11 June, Spain
Ciftcioglu, Ö., Durmisevic, S. and Sariyildiz, S.(2000a). Building Design Support by Hierarchical Expert Networks. Proceedings of the International Conference on Construction and Information Technology 2000. Icelandic Building Research Institute. June 28-30, 2000, Reykjavik, Iceland
Ciftcioglu Ö., Durmisevic S., Durmisevic E. and Sariyildiz S. (2000b). Building design support by soft computing, Proceedings of the Sixth International Conference on Artificial Intelligence in Design 2000, Worchester Polytechnic Institute, Worcester, Mass.
Ciftcioglu, Ö., Durmisevic, S. and Sariyildiz, S. (2001). Architectural Design Knowledge Modeling, Conference proceedings Mathematics and Design M&D 2001, 3-5 July, Melbourne, Australia
Ciftcioglu Ö., Durmisevic S. and Sariyildiz S., (2001a). Multiresolutional knowledge representation", Conference proceedings EuropIA8, 25-27 April, Delft, The Netherlands
Ciftcioglu Ö., Durmisevic S. and Sariyildiz S., (2001b). Soft Computing in Construction Information Technology, conference proceedings ITC 2001, 30 May-1 June, South Africa
COB (1997). De nieuwe kaart verdiept. Centrum Ondergronds Bouwen, Gouda

- 139 -
COB (2000). Jaarverslag 1999. Centrum Ondergronds Bouwen, Gouda Dalen, van J. and Leede, de E. (2000). Statistisch onderzoek met SPSS for Windows. Publisher
Lemma BV, Utrecht Daubechies I. (1992). Ten lectures on wavelets, CBMS-NSF regional conference series in applied
mathematics Vol.61, SIAM Daubechies, I., ed. (1993). Different perspectives on Wavelets, Proceedings of Symposia in
Applied Mathematics, Vol.47, American Mathematical Society, Rhode Island Dolmans, D. and Lourens, E. (2001). ICT in de bouw. Economisch Instituut voor
Bouwnijverheid, Amsterdam, juni 2001 Durkheim, E. (1909, reprinted 1993). The rules of sociological method and selected texts on
sociology and its method, ed. S. Lukes, translation W.D. Halls, The Macmillan Press Ltd. Durmisevic S. and Sariyildiz I.S. (1999). A Step towards Sustainability, IABSE Symposium
Structures for the Future - The Search for Quality, Rio de Janeiro. Durmisevic, S., Ciftcioglu, Ö. and Sariyildiz, S (2001a). Knowledge Modeling by Artificial
Intelligence for Underground Space Environment, conference proceedings EuropIA8, 25-27 April, Delft, The Netherlands
Durmisevic, S., Ciftcioglu, Ö. and Sariyildiz, S. (2001b). Quantifying the qualitative design aspects, Conference proceedings ECAADE, 28-31 August 2001, Helsinki, Finland
Duda R.O., Peter E.H. and David G. Stork, (2001). Pattern Classification, Wiley Interscience, New York
EFQM, (1999). Introducing Excellence, The European Foundation for Quality Management, (EFQM), Brussels
Eekelen, I. (2001). Vergeet de gebruiker niet! Indicatief onderzoek naar bereidheid tot participatie door stationsgebruikers in het kader van interactieve beleidsvorming. Graduation project, Faculteit Ruimtelijke Wetenschappen, Universiteit Utrecht
Eiser, J. R. (1990). Social psychology - Attitudes, cognition and social behaviour. Cambridge University Press
Elenayar S. and Shin Y.C., (1994). "Radial Basis Function Neural network for Approximation and Estimation of Nonlinear Stochastic Dynamic Systems", IEEE Trans. Neural Networks, Vol.5, pp.594-603
Evans, G. W. (1980). Environmental Cognition, Psychological Bulletin, 88 Evans, G. W., Marreo, D. G. and Butler, P. A. (1981). Environmental Learning and Cognitive
Maps. Environment and Behavior. Volume 13, Number 1, January. Sage Periodical Press, London
Finaly, P. (1986). Decision Support Systems. Data Processing 28:434 Fisher, B. S. and Nasar, J. L. (1992). Fear of Crime in Relation to Three Exterior Site Features:
Prospect, Refuge and Escape. Environment and Behavior. Volume 24, Number 1, January. Sage Periodical Press, London
Flemming, U. Woodbury, R. and Coyne, R. (1993). "SEED: A software environment to support the early phases in building design", Proceedings of ARECDAO 93. Barcelona, Spain, March-April, 1993
Galen, van B. M. (1999). De Mens in de Ondergrond? Doctoraalscriptie, Natuurwetenschappen en Bedrijf & Bestuur, Universiteit Utrecht, Utrecht
Goodwin, C. J. (1998). Research in Psychology – Methods and Design. John Wiley & Spon, Inc. USA
Goffman, E. (1971). Relations in public: Micro studies of the public order. New York: Harper & Row

- 140 -
Haffey M.K.D. and Duffy A.H.B. (2000). Issues in utilizing implicit design knowledge through data mining in Machine Learning in Design Workshop; Artificial Intelligence in Design, 25-29 June, Worchester, Massachusetts
Hamel, R. (1990). Over het Denken van de Architect. Krips Repro, Meppel, Amsterdam, The Netherlands
Han J. and Kamber M., (2001). Data Mining: concepts and techniques, Morgan Kaufmann, San Francisco
Ham, F. M. and Kostanic, I. (2000). Principles of neurocomputing for science and engineering. McGraw-Hill, New York
Haykin, S. (1999). Neural networks: a comprehensive foundation. Prentice-Hall, Upper Saddle River
Heng-Koh, I. S. Y. (1994). Human assessment and computer support - a decision support system for personnel selection. PhD thesis, Tilburg University Press
Hobbelen, M. L. C., Vink, W. A. and Wendrich, E. C. M. (2000). Voorbereiding op RandstadRail - overlast en veiligheid in Blijdorp gevolgd. BOOM - Bureau Onderzoek Op Maat, november 2000, Rotterdam
Horvat, E., van der Krogt, R.A.A., Haasnoot, J.K., Edelenbos, J., Monnikhof, R.A.H., van der Hoeven, F. (1997). Strategische Studie Ondergrondse Bouwen. COB/ TUDelft/ DHV, The Netherlands
Hunt K.J., Haas R. and Brown M. (1995). On the Functional Equivalence of Fuzzy Inference Systems and Spline-Based Networks, Int. J. Neural Syst., June
Hunt K.J., Haas R. and Murray-Smith R., (1998). "Extending the Functional Equivalence of Radial Basis Function Networks and Fuzzy Inference Systems", IEEE Trans. Neural Networks, Vol.7, No.3, May
Jang, R. J.-S and C. –T. Sun (1993), Functional Equivalence Between Radial base Function Networks and Fuzzy Inference Systems, IEEE Trans. on Neural Networks, Vol.4, No.1, January
Jang, R. J.-S., Sun, C.-T. and Mizutani, E. (1997). Neuro-fuzzy and soft computing. Prentice-Hall Inc., Upper Saddle River
Kasabov, N. K. (1996). Foundations of Neural Networks, Fuzzy Systems, and Knowledge Engineering. Massachusetts Institute of Technology, MIT Press, London
Khanna, T. (1990). Foundations of neural networks. Addison-Wesley Publishing Company, Inc. Reading, Massachusetts
Kerre, E. E. and Cock, de M. (1999). Linguistic modifiers: an overview. Fuzzy logic and soft computing. ed. Chen, G., Ying, M. and Cai, K.Y., Kluwer Academic Publishers, USA
Korz, S., Aarts, H., Luten, I., Lugtmeijer, E. (1998). Hoe Dieper hoe Gevoeliger. Collaboration of TU Eindhoven, TU Delft and Eysink Smeets & Etman, The Netherlands
Kosko, B. (1992), Neural Networks and Fuzzy Systems, Prentice Hall, Englewood Cliffs, New Jersey
Krzysztof J.C, Pedrycz W. and Swiniarski R.W., (1998). Data mining methods for knowledge discovery, Kluwer Academic, Boston
Laarhoven van, A. M. J. (1997). Sociaal Veilig op Papier. Intern report for the NS Railinfrabeheer, NS Railinfrabeheer, Utrecht
Lagendijk, A. and Wisserhof, J. (1999). Geef ruimte de kennis, geef kennis de ruimte! Deel 1: Verkenning van de kennisinfrastructuur voor meervoudig ruimte gebruik (RMNO, NRLO & NRO)

- 141 -
Leonard J.A., Kramer M.A., and Ungar L.H., (1992). "Using Radial Basis Functions to Approximate a Function and Its Bounds", IEEE Trans. Neural networks, Vol.3
Lawson, B. (1990). How designers think: the design process demystified. Second edition. London: Butterworth
Leiner, B. M., Cerf, V. G., Clark, D. D., Kahn, R. E., Kleinrock, L., Lynch, D. C., Postel, J., Roberts, L. G. and Wolff, S. (2000). Internet and WWW history - A brief history of the Internet. Version 3.31. http://www.isoc.org/internet-history/brief.html
Linn, M. C. and Petersen, A. C. (1986). Emergence and characterization of sex differences in spatial ability - A meta-analysis, Child development, 56
Lynch, K. (1960). The Image of the City. MIT Press, Cambridge, Massachusetts: Technology Press
Mallat S. (1999). Wavelet tour of signal processing, Academic Press, San Diego, London Martens, K. (2000). Debatteren over mobiliteit, over de rationaliteit van het ruimtelijk
mobiliteitsbeleid, Promotieonderzoek ,Utrecht Mehrabian, A. ( 1976). Public Places and Private Spaces. Basic Books, Inc, printed in USA Meyer, Y. (1993). Wavelets algorithms and applications, Siam, Philadelphia McGrew, C. J. and Monroe, C. B. (1993). An introduction to statistical problem solving in
geography. Wm. C. Brown Communications, Inc., Dubuque Mitchel, W. (1995). City Of Bits - Space, Place, And The Infobahn. Massachusetts Institute of
Technology Moody J. and Darken C., (1988). "Fast Learning with Localized Receptive Fields", in Proc.
Connectionist Models Summer School, D. Tourezky, G. Hinton, and T.Sejnowski (eds.), Carnegie Mellon University, Morgan Kaufmann Publishers
Opperwal, H. and Timmermans, H. (1999). Modeling Consumer Perception of Public Space in Shopping Centers. Environment and Behavior. Volume 31, Number 1, January. Sage Periodical Press, London
Park J. and Sandberg I.W., (1991). "Universal Approximation Using Radial Basis Function Network", Neural Computation, Vol.3, pp.246-257
Passini, R. (1984).Wayfinding in Architecture. Environmental Design Series 4. Van Nostrand Reinhold, New York
Passini, R. (1992). Wayfinding in Architecture. Environmental Design Series 4, second edition. Van Nostrand Reinhold, New York
Percival, D. B. and Walden, A. T. (2000). Wavelet methods for time series analysis. Cambridge University Press, New York
Puolarikas A.D. Ed. (2000). The Transforms and Applications Handbook, Boca Raton: CRC Press
Priemus, H, Nijkamp, P. and Dieleman, F. (2000). Meervoudig Ruimtegebruik - stimulansen en belemmeringen. Ongerzoeksinstituut OTB, Vrij Universiteit, Universiteit van Utrecht and RIVM. Delft University Press, Delft
Proshansky, H. M, Ittelson, W. H., Rivlin, L. G. (1970). Environmental Psychology: Man and his Physical Setting. New York, Holt, Rinehart and Winston
Rao, V. and Rao, H. (1995). C++ Neural Networks and Fuzzy Logic. Second edition, MIS Press, New York
Roes S. (1997). Rijswijk - Een Barriere Geslecht, Municipality Rijswijk Rojas, R. (1996). Neural networks - a systematic introduction, Berlin: Springer Russell, S. and Norvig, P. (1995). Artificial intelligence - a modern approach. Prentice-Hall
International Inc., Englewood Cliffs

- 142 -
Saltelli A., Chan K. and Scott E. M., (Eds.), (2000). Sensitivity Analysis, Chichester: Wiley Sariyildiz S. (1991). Conceptual Design by Means of Islamic-Geometric-Patterns within a
CAAD-Environment, PhD-thesis, TU Delft, Faculty of Architecture Sariyildiz, S. and Ciftcioglu, Ö. (1998). Login - leesmateriaal voor Blok COMPLEX. Technisch
Ontwerp en Informatica, TU Delft, Faculty of Architecture Sariyildiz, S., Ciftcioglu, Ö. and Durmisevic, S. (1999). Architectural pattern generation by
discrete wavelet transform and utilization in structural design, HERON Journal, vol. 43, no. 1, p. 29-45
Sariyildiz, S., Stouffs, R., Ciftcioglu, Ö. and Tunçer, B. (2000). Future developments of ICT in the building sector. Proceedings of the International Conference on Construction and Information Technology 2000. Icelandic Building Research Institute. June 28-30, 2000, Reykjavik, Iceland
Sariyildiz S. (2001). Visie op ICKT-inzet in het ontwerp en bouwproces, de Ontwerpmanager: Vaktijdschrift voor Ontwerpmanagement in de Bouw 4, November 2001, 36-40.
Sariyildiz, S. and Beheshti, R. (2001). Prerequisites for and influences of advanced technologies on designing the built environment, Advances in Design Sciences and Technology (ed. R. Beheshti), Europia Productions, Paris, 275-284.
Shannon, C. E. and Weaver, W. (1949). The mathematical theory of communication. University of Illinois Press
Slamecka, V. (1994). Information Processing and Information Systems, Encyclopaedia Britannica, 21:552-568, 15th edition
Steffen, C. and Van der Voordt, D. J. M. (1979). Belevingsonderzoek Stedelijk Milieu – Methoden & Techniken. Centrum voor Architectuuronderzoek, Delft
Steffen, C. (1982). Psychologie van Architectuur en Stedebouw. Centrum voor Architectuuronderzoek, Delft
Taylor, J. G. (2000). Bringing AI and soft computing together. Intelligent systems and soft computing - prospects, tools and applications. Lecture notes in Artificial Intelligence, ed. Azvane, B., Azarmi, N. and Nauck, D. D., Springer-Verlag, Berlin
Schmitt, G. (1996). Non-physical architecture-a new approach to material form (a lecture). Opening Conference of RSDC at TU Delft, October 1996 by Prof. Gerhard Schmitt, Faculty of Architecture, ETH Zürich
Schmitt, G. (1999). Information architecture: Basics of CAAD and its future, Birkhäuser, Basel Stollard, P. (1991). Crime Prevention Through Housing Design. E & FN Spon, London Swanborn, P. G., (1991). Basisboek sociaal onderzoek, Boom Meppel, Amsterdam Tang, Y., Zhang, N. and Li, Y. (1999). An approach of adaptive fuzzy control and its application
to power systems. Fuzzy logic and soft computing, ed. Chen, G., Ying, M. and Cai, K.Y., Kluwer Academic Publishers, Boston
Turban, E. and Aronson, J. E. (1998). Decision support systems and intelligent systems. Prentice-Hall International Inc., Upper Saddle River
Van Dijk, van Soomeren en Partners (2000). Veiligheidseffectrapportage - handleiding. Van Dijk, van Soomeren en Partners -Amsterdam, Version 2.0, september 2000, Utrecht
Van der Voordt, D. J. M. and Van Wegen, van H. B. R. (1987). Toetsing van de interim-checklist: Sociale Veiligheid en Gebouwde Omgeving; Doel en werkwijze van het veldonderzoek. Research Institute of Urban Planning and Architecture. DUP, Delft
Van der Voordt, D. J. M. and Van Wegen, van H. B. R. (1990). Sociaal Veilig Ontwerpen; Checklist ten Behoefte van het Ontwikkelen en Toetsen van (plannen voor) de Gebouwde Omgeving. Publikatieburo Bouwkunde, Delft

- 143 -
Van Wegen, H. B. R. and Van der Voordt D. J. M (1991). Sociale Veiligheid en Gebouwde Omgeving; Theorie, Empirie en Instrumentontwikkeling. Publikatieburo Bouwkunde, delft University of Technology, Delft
VERRC (2002). Bestuursdocument van de Projectgroep Veiligheidseffectrapportage Rotterdam Centraal, Projectgroep VER Rotterdam Centraal, Gemeente Rotterdam
Vischer, J.C. (1989). Environmental Quality in Offices. Van Nostrand Reinhold, USA Vocht, de A. (1996). Basishandboek SPSS 6.1. voor Windows. Bijleveld Press, Utrecht VROM (2000). Ruimtelijke verkenning 2000: Meebewegen met de ondergrond. Ministerie van
Volkshuisvesting, Ruimtelijke Ordening en Milieubeheer, Den Haag VROM (2001). Ruimte maken, ruimte delen: 5de Nota Ruimtelijke Ordening 2000-2020.
Ministerie van Volkshuisvesting, Ruimtelijke Ordening en Milieubeheer, Den Haag VROM-raad (2001). Tussen feit en fictie - Verkenning van ontwikkelingen in de ICT en de
gevolgen voor het beleid over wonen, ruimtelijke ordening, milieu en mobiliteit. Rapport VROM-raad, Den Haag, maart 2001
Wagenberg, van A. F. (1990). Omgevingspsychologie. Psychonomische Publikaties2: Omgevingspsychologie, ed. Mannaerts, A. A. J., Keuss, P. J. G and Hoopen, ten G. Swets & Zeitlinger B. V., Amsterdam
Warr, M. (1990). Fear of victimization: Why are women and the elderly more afraid? Social Science Quarterly 65
Weiss, L. and Baum, B (1987). Psychological Aspects of Environment-Behavior Relationships. Advances in Environment, Behavior and Design, Volume 1, ed. Zube, E. H. and Moore, G. T. Plenum Press, New York
Whyte, A.V.T. (1977). Guidelines for Field Studies in Environmental Perception. Unesco, Paris Woolgar, S (1989). Representation, Cognition and self: What hope for an integration of
psychology and sociology? The cognitive turn - Sociological and Psychological perspectives on science, ed. S. Fuller, M. de Mey, T. Shinn and S. Woolgar, Kluwer Academic Publishers
Zadeh, L.A., (1965). Fuzzy sets. Information and Control 8, pp.338-353 Zadeh, L.A., (1973). “Outline of a new approach to the analysis of complex systems and decision
processes”, IEEE Trans. Systems, Man, and Cybernetics, Vol. SMC-3, No.1, January Zadeh L. A. (1993). Fuzzy logic, neural networks and soft computing. One-page course
announcement of CS 294-4, Spring 1993, the University of California at Berkley, November 1993
Zadeh, L. A. (1994a). Fuzzy logic, neural networks and soft computing. Comm. ACM, Vol. 37 (3), pp. 77-84
Zadeh, L. A. (1994b). Soft computing and fuzzy logic. IEEE Software, Vol. 11 (6), pp. 48-56 Zadeh, L. A. (2000). From computing with numbers to computing with words - From
manipulation of measurements to manipulation of perceptions. Intelligent systems and soft computing - prospects, tools and applications. Lecture notes in Artificial Intelligence, ed. Azvane, B., Azarmi, N. and Nauck, D. D., Springer-Verlag, Berlin

- 144 -

- 145 -
Summary The intensification, combination and transformation are main strategies for future spatial development of the Netherlands, which are stated in the Fifth Bill regarding Spatial Planning. These strategies indicate that in the future, space should be utilized in a more compact and more efficient way requiring, at the same time, re-evaluation of the existing built environment and finding ways to improve it. In this context, the concept of multiple space usage is accentuated, which would focus on intensive 4-dimensional spatial exploration. The underground space is acknowledged as an important part of multiple space usage. In the document 'Spatial Exploration 2000', the underground space is recognized by policy makers as an important new 'frontier' that could provide significant contribution to future spatial requirements. In a relatively short period, the underground space became an important research area. Although among specialists there is appreciation of what underground space could provide for densely populated urban areas, there are still reserved feelings by the public, which mostly relate to the poor quality of these spaces. Many realized underground projects, namely subways, resulted in poor user satisfaction. Today, there is still a significant knowledge gap related to perception of underground space. There is also a lack of detailed documentation on actual applications of the theories, followed by research results and applied techniques. This is the case in different areas of architectural design, but for underground spaces perhaps most evident due to their infancy role in general architectural practice. In order to create better designs, diverse aspects, which are very often of qualitative nature, should be considered in perspective with the final goal to improve quality and image of underground space. In the architectural design process, one has to establish certain relations among design information in advance, to make design backed by sound rationale. The main difficulty at this point is that such relationships may not be determined due to various reasons. One example may be the vagueness of the architectural design data due to linguistic qualities in them. Another, may be vaguely defined design qualities. In this work, the problem was not only the initial fuzziness of the information but also the desired relevancy determination among all pieces of information given. Presently, to determine the existence of such relevancy is more or less a matter of architectural subjective judgement rather than systematic, non-subjective decision-making based

- 146 -
on an existing design. This implies that the invocation of certain tools dealing with fuzzy information is essential for enhanced design decisions. Efficient methods and tools to deal with qualitative, soft data are scarce, especially in the architectural domain. Traditionally well established methods, such as statistical analysis, have been used mainly for data analysis focused on similar types to the present research. These methods mainly fall into a category of pattern recognition. Statistical regression methods are the most common approaches towards this goal. One essential drawback of this method is the inability of dealing efficiently with non-linear data. With statistical analysis, the linear relationships are established by regression analysis where dealing with non-linearity is mostly evaded. Concerning the presence of multi-dimensional data sets, it is evident that the assumption of linear relationships among all pieces of information would be a gross approximation, which one has no basis to assume. A starting point in this research was that there maybe both linearity and non-linearity present in the data and therefore the appropriate methods should be used in order to deal with that non-linearity. Therefore, some other commensurate methods were adopted for knowledge modeling. In that respect, soft computing techniques proved to match the quality of the multi-dimensional data-set subject to analysis, which is deemed to be 'soft'. There is yet another reason why soft-computing techniques were applied, which is related to the automation of knowledge modeling. In this respect, traditional models such as Decision Support Systems and Expert Systems have drawbacks. One important drawback is that the development of these systems is a time-consuming process. The programming part, in which various deliberations are required to form a consistent if-then rule knowledge based system, is also a time-consuming activity. For these reasons, the methods and tools from other disciplines, which also deal with soft data, should be integrated into architectural design. With fuzzy logic, the imprecision of data can be dealt with in a similar way to how humans do it. Artificial neural networks are deemed to some extent to model the human brain, and simulate its functions in the form of parallel information processing. They are considered important components of Artificial Intelligence (AI). With neural networks, it is possible to learn from examples, or more precisely to learn from input-output data samples. The combination of the neural and fuzzy approach proved to be a powerful combination for dealing with qualitative data. The problem of automated knowledge modeling is efficiently solved by employment of machine learning techniques. Here, the expertise of prof. dr. Özer Ciftcioglu in the field of soft computing was crucial for tool development. By combining knowledge from two different disciplines a unique tool could be developed that would enable intelligent modeling of soft data needed for support of the building design process. In this respect, this research is a starting point in that direction. It is multidisciplinary and on the cutting edge between the field of Architecture and the field of Artificial Intelligence. From the architectural viewpoint, the perception of space is considered through relationship between a human being and a built environment. Techniques from the field of Artificial Intelligence are employed to model that relationship. Such an efficient combination of two disciplines makes it possible to extend our knowledge boundaries in the field of architecture and improve design quality. With additional techniques, meta knowledge, or in other words "knowledge about knowledge", can be created. Such techniques involve sensitivity analysis, which determines the amount of dependency of the output of a model (comfort and public safety) on the information fed into the model (input). Another technique is functional relationship modeling between

- 147 -
aspects, which is derivation of dependency of a design parameter as a function of user's perceptions. With this technique, it is possible to determine functional relationships between dependent and independent variables. This thesis is a contribution to better understanding of users’ perception of underground space, through the prism of public safety and comfort, which was achieved by means of intelligent knowledge modeling. In this respect, this thesis demonstrated an application of ICT (Information and Communication Technology) as a partner in the building design process by employing advanced modeling techniques. The method explained throughout this work is very generic and is possible to apply to not only different areas of architectural design, but also to other domains that involve qualitative data.
Sanja Durmisevic

- 148 -

- 149 -
Samenvatting Belevingsaspecten van Ondergrondse Ruimte met gebruik van Intelligente Kennis Modelleringstechnieken Het intensiveren, combineren, en transformeren zijn voorname strategieën voor de toekomstige ruimtelijke ontwikkeling van Nederland, welke genoemd worden in de Vijfde Nota met betrekking tot de Ruimtelijke Ordening. Deze strategieën geven aan dat, in de toekomst, ruimte op een meer compacte en meer efficiënte wijze zou moeten worden gebruikt. Dit vereist, tegelijkertijd, een re-evaluatie van de bestaande gebouwde omgeving en het vinden van manieren om deze te verbeteren. In deze context wordt het concept van meervoudig ruimtegebruik benadrukt, dat zich zou concentreren op een intensieve 4-dimensionale ruimtelijke exploratie. De ondergrondse ruimte wordt erkend als een belangrijk onderdeel van het meervoudig ruimtegebruik. In het document 'Ruimtelijke Verkenning 2000' wordt de ondergrondse ruimte door beleidsmakers erkend als een belangrijk nieuw 'gebied' dat een aanmerkelijke bijdrage zou kunnen leveren aan de toekomstige vereisten met betrekking tot de ruimte. In een relatief korte periode werd de ondergrondse ruimte een belangrijk onderzoeksgebied. Hoewel er onder specialisten waardering is voor wat de ondergrondse ruimte zou kunnen betekenen voor dichtbevolkte stedelijke gebieden, zijn er bij het publiek nog gevoelens van terughoudendheid. Deze hebben grotendeels betrekking op de slechte kwaliteit van deze ruimten. Veel gerealiseerde ondergrondse projecten, met name ondergrondse stations, resulteerden in een slechte tevredenheid van de gebruikers. Heden is er nog steeds een aanmerkelijk kennishiaat met betrekking tot de perceptie van de ondergrondse ruimte. Er is ook een gebrek aan gedetailleerde documentatie over de werkelijke toepassingen van de theorieën, die door onderzoeksresultaten en toegepaste technieken worden gevolgd. Dit is het geval voor verschillende gebieden van architectonisch ontwerpen, maar is voor ondergrondse ruimten misschien nog het meest duidelijk omwille van het feit dat het ontwerpen van ondergrondse ruimten binnen de algemene architectuurpraktijk nog in de kinderschoenen staat. Ten einde betere ontwerpen te creëren zouden verschillende aspecten, die zeer vaak van kwalitatieve aard zijn, moeten overwogen worden in verhouding tot de uiteindelijke doelstelling om de kwaliteit en het beeld van de ondergrondse ruimte te verbeteren.
- 150 -
In het architectonische ontwerpproces moet men bepaalde verbanden tussen de ontwerpinformatie op voorhand vastleggen om tot een ontwerp te komen dat stevig gegrond is. De belangrijkste moeilijkheid op dit punt is dat dergelijke verbanden mogelijk niet bepaald kunnen worden omwille van allerlei redenen. Een voorbeeld kan de vaagheid van de architectonische ontwerpgegevens zijn ten gevolge van taalkundige kwaliteiten in deze. Een ander voorbeeld kan vaag gedefinieerde ontwerpkwaliteiten zijn. In dit werk was het probleem niet alleen de aanvankelijke vaagheid van de informatie, maar ook de verlangde relevantiebepaling tussen alle gegeven informatiedeeltjes. Tegenwoordig is de bepaling van het bestaan van dergelijke relevantie min of meer een kwestie van een architectonisch subjectief oordeel eerder dan van een systematische, niet-subjectieve besluitvorming gebaseerd op een bestaand ontwerp. Dit impliceert dat het gebruik van bepaalde instrumenten die vage informatie kunnen behandelen essentieel is voor versterkte ontwerpbesluiten. Efficiënte methodes en instrumenten om kwalitatieve, zachte gegevens te behandelen zijn schaars, vooral in het architecturale domein. Traditioneel zijn hoofdzakelijk reeds lang gevestigde methodes, zoals statistische analyse, gebruikt geweest voor de analyse van gegevens geconcentreerd op gelijkaardige types aan het huidige onderzoek. Deze methodes vallen hoofdzakelijk in een categorie van patroonherkenning. Statistische regressiemethodes zijn de meest gebruikelijke benaderingen voor dit doel. Een essentieel nadeel van deze methode is het onvermogen om niet-lineaire gegevens efficiënt te behandelen. Met statistische analyse worden de lineaire verhoudingen vastgesteld door regressie analyse. Hierbij wordt het behandelen van niet-lineaire gegevens meestal vermeden. Betreffende de aanwezigheid van multidimensionele gegevensreeksen, is het duidelijk dat de veronderstelling van lineaire verhoudingen tussen alle informatiedeeltjes een grove benadering zou zijn, waarvoor geen grondslag voor aanname bestaat. Een uitgangspunt in dit onderzoek was dat er misschien zowel lineariteit als niet-lineariteit aanwezig is in de gegevens en, daarom, de aangewezen methodes zouden moeten worden gebruikt om de niet-lineariteit in de gegevens te behandelen. Om deze reden werd een andere vergelijkbare methode toegepast voor de kennismodellering. In dit opzicht bleken zachte technieken voor gegevensverwerking gepast voor de kwaliteit van de multidimensionele dataset die het onderwerp vormde van de analyse, welke 'zacht' wordt beschouwd te zijn. Er is nog een andere reden waarom zachte technieken voor gegevensverwerking werden toegepast. Deze houdt verband met de automatisering van kennismodellering. In dit opzicht hebben traditionele modellen, zoals besluitvormingsondersteunende systemen en expertsystemen, bepaalde nadelen. Een belangrijk nadeel is het feit dat de ontwikkeling van deze systemen een tijdrovend procédé is. Het programmeringsgedeelte, waarin diverse overwegingen worden vereist voor de vorming van een consequent if-then regelkennis gebaseerd systeem, is ook een tijdrovende activiteit. Om deze redenen zouden de methodes en instrumenten van andere disciplines, die ook zachte gegevens behandelen, in de ondersteuning van het architectonische ontwerp moeten worden geïntegreerd. Met vage logica kan de onnauwkeurigheid van gegevens worden behandeld op een manier die gelijkaardig is aan hoe mensen het doen. Kunstmatige neurale netwerken worden geacht om de menselijke hersenen in zekere mate te modelleren. Zij simuleren de hersenfuncties in de vorm van parallelle informatieverwerking. Zij worden beschouwd als belangrijke componenten van Kunstmatige Intelligentie (AI). Met neurale netwerken is het mogelijk om van voorbeelden te leren of, meer bepaald, van input-output gegevenssteekproeven te leren. De combinatie van een neurale en een vage benadering bleek een

- 151 -
krachtige combinatie te zijn voor het behandelen van kwalitatieve gegevens. Het probleem van geautomatiseerde kennismodellering wordt efficiënt opgelost door de inzet van machinale leertechnieken. Hier was de expertise van prof.dr. Özer Ciftcioglu op het gebied van zachte gegevensverwerking essentieel voor de ontwikkeling van instrumenten. Door de kennis van twee verschillende disciplines te combineren kon een uniek instrument worden ontwikkeld dat een intelligente modellering van zachte gegevens nodig voor de ondersteuning van het ontwerpproces van gebouwen zou toelaten. In dit opzicht is dit onderzoek een vertrekpunt in die richting. Het is multidisciplinair en op de scherpe kant tussen het gebied van Architectuur en het gebied van Kunstmatige Intelligentie. Vanuit het architectonische gezichtspunt, wordt de perceptie van ruimte overwogen als een verband tussen een menselijk wezen en een gebouwde omgeving. Technieken uit het gebied van Kunstmatige Intelligentie worden ingezet om dit verband te modelleren. Een dergelijke efficiënte combinatie van twee disciplines maakt het mogelijk om onze kennisgrenzen op het gebied van architectuur uit te breiden en de ontwerpkwaliteit te verbeteren. Met extra technieken kan de metakennis of, met andere woorden, "kennis over kennis" worden gecreeerd. Dergelijke technieken impliceren een gevoeligheidsanalyse, die de mate van afhankelijkheid van de output van een model (comfort en openbare veiligheid) op de informatie die in het model (input) wordt gevoed bepaalt. Een andere techniek is de modellering van de functionele verbanden tussen aspecten. Deze is een afleiding van de afhankelijkheid van een ontwerpparameter als functie van gebruikerswaarnemingen. Met deze techniek is het mogelijk om functionele verbanden tussen afhankelijke en onafhankelijke variabelen te bepalen. Deze thesis is een bijdrage tot een beter begrip van gebruikerswaarnemingen van ondergrondse ruimten. Dit wordt bereikt door het prisma van openbaar veiligheid en comfort, en door middel van intelligente kennismodellering. In dit opzicht toont deze thesis een toepassing van ICT (Informatie- en CommunicatieTechnologie) als een partner in het ontwerpproces van gebouwen, door deinzet van geavanceerde modelleringstechnieken. De methode die door dit werk wordt verklaard is zeer generisch en kan niet alleen op verschillende gebieden van architectonisch ontwerpen, maar ook op andere domeinen die kwalitatieve gegevens impliceren worden toegepast.
Sanja Durmisevic

- 152 -
- 153 -
Acknowledgments After formal discussions presented in previous chapters I would like to use this opportunity and express my gratitude to many individuals who supported me during the last four years to finalize this thesis and become a more complete person in many ways. I would like to express my deepest gratitude to prof. Sevil Sariyildiz, who has guided me not only as my supervisor but also as a friend. I thank her for her generosity at all times that provided me the best possibilities to develop myself as a scientist and as a person. She always encouraged the alpha scientist in me. My special thanks to prof. Özer Ciftcioglu for numerous inspiring, private discussions which helped me sharpen my thoughts as a beta scientist. Above all I thank him for wonderful co-operation over the past years. I am especially thankful to prof. Mike Jenks and prof. Tejo Spit who both at different stages of my research, supported my ideas and helped me to follow the path I decided to take. They invigorated the gamma scientist in me throughout this work. I would like to thank to prof. Horvat and COB who trusted in my qualities as a scientist and provided financial support through COB. I would like to thank to M. Zwarts, L.I. Vákár, T. Fikkers, lately H. Volker for interviews and for willingness to share their knowledge and genuine support for this research. I would like to express my gratitude to Mrs. Zlatica Licina who helped me with the questionnaire development. My thanks to Ilse van Eekelen for organizing all formalities regarding questionnaire and conducting a statistical data analysis. Also I would like to thank to all users of the stations who filled in the questionnaire and shared their vision regarding these stations and in that way made this research possible. I would also like to thank to prof. Ray Sterling for providing his valuable comments and giving me confidence into international relevance of my work. I thank him for inspiring e-mails, from different 'corners' of the globe and for never leaving my e-mails unanswered. This all would be impossible to accomplish without wonderful work atmosphere for which all members of Technical Design and Informatics at the Faculty of Architecture (TU Delft) are accounted for. Thank you for wonderful and inspiring discussions during lunch breaks. Keep the spirits high! Special thanks to my parents and my sister who were not only my family members but also professionals in the same field, always willing to listen and share thoughts with me regarding this work and who helped me to remain on this path by supporting me in immeasurable number of ways. I would like to thank to my

- 154 -
husband who knew when and how to rescue me from computers and books reminding me that each life experience is worth more than thousands of written or spoken words. My thanks to all friends and professionals, that I have learned to know over the past years since all of you have in various ways contributed to the realization of this book. Thank you all…

- 155 -
About the author Sanja Durmisevic was born 4 May 1970 in Sarajevo, Bosnia and Herzegovina. She completed her high school in 1988 at New Plymouth High School, Idaho, USA where she received an honourable award for the best student in math, art and history as well as an award for being selected in 5% of the best High School students in all of the USA. In 1988, she enrolled at the Faculty of Architecture at the University of Sarajevo. After three years of study, she completed one year of practical training at 'Architectural Bureau Evelein' in Amsterdam. The final year of her study she completed at the Faculty of Architecture at Delft University of Technology (TU Delft), where she obtained her degree. In 1998 she started her PhD in the group Technical Design and Informatics. Parallel to her activities at TU Delft, since 1998 she has been a guest lecturer at International Institute for Infrastructural, Hydraulic and Environmental Engineering at Delft (IHE). She is an active member of two COB commissions ('Spatial design' and 'Perception and Safety' in underground spaces). She is also an active member of the Project Team Rotterdam Central, where she works as an advisor for public safety for the new Rotterdam Master Plan. She has presented her work on numerous international conferences and has been invited as a speaker to various congresses dealing with perception and public safety in underground spaces.

- 156 -

- 157 -
Bibliography Journal publications Durmisevic S. and Sariyildiz I.S. (2001). A systematic quality assessment of underground spaces
- public transport stations, CITIES 18 (1), 13-23. Durmisevic S. (1999). The future of the underground space, Cities: The International Journal of
Urban Policy and Planning 16 (4), 233-245. Sariyildiz I.S., Ciftcioglu O. and Durmisevic S. (1998). Architectural pattern generation by
discrete wavelet transform and utilisation in structural design, HERON 43 (1), 29-45. Technical reports and various publications Ciftcioglu Ö., Durmisevic S. and Sariyildiz I.S. (2002). Architectural Design for Space Layout by
Genetic Algorithms, The Architectural Annual 2001 Durmisevic S. (1998). 'Bright' future for the 'gloomy' underground, The Architecture Annual
1996-1997 (eds. H.C. Bekkering, C.G. Dam, I.S. Sariyildiz, M.K. van Ouwerkerk, and A.K. Letteboer), 010 Publishers, Rotterdam, 138-140.
Durmisevic S. (1998). Decision support system for the underground design grammar, COB Nieuws 19, 4-5.
Sariyildiz I.S. and Durmisevic S. (1997). Underground building - a bearer of city transformation (Introduction), Ontwerp Contrast; Underground - Heaven in Earth, Faculteit der Bouwkunde, Delft, 4.
Papers in conference proceedings Durmisevic, S. and Ciftcioglu, Ö. (2002). Soft data modelling by soft computing in architectural
design, 2nd International Postgraduate ResearchConference 2002.11-12 April, 2002, University of Salford, England
Durmisevic S., Ciftcioglu Ö. and Sariyildiz I.S. (2001). Quantifying the qualitative design aspects, Architectural Information Management (ed. H. Penttilä), eCAADe and Helsinki University of Technology, Helsinki, Finland, 111-116.

- 158 -
Durmisevic S., Ciftcioglu Ö. and Sariyildiz I.S. (2001). Knowledge modelling of ’soft’ data in architectural design, Proceedings of the CIB-W78 International Conference: IT in Construction in Africa 2001, CSIR, Pretoria, South Africa, 14.1-14.13.
Durmisevic S., Ciftcioglu Ö. and Sariyildiz I.S. (2001). Knowledge modelling by artificial intelligence for underground space environment, Advances in Design Sciences and Technology (ed. R. Beheshti), Europia Productions, Paris, 57-67.
Ciftcioglu Ö. and Durmisevic S. (2001). Knowledge management by information mining, Computer Aided Architectural Design Futures 2001 (eds. B. de Vries, J. van Leeuwen, and H. Achten), Kluwer Academic, Dordrecht, The Netherlands, 533-545.
Ciftcioglu Ö., Durmisevic S. and Sariyildiz I.S. (2001). Soft computing in construction information technology, Proceedings of the CIB-W78 International Conference: IT in Construction in Africa 2001, CSIR, Pretoria, South Africa, 15.1-15.12.
Ciftcioglu Ö., Durmisevic S. and Sariyildiz I.S. (2001). Multi-resolutional knowledge representation, Advances in Design Sciences and Technology (ed. R. Beheshti), Europia Productions, Paris, 29-38.
Ciftcioglu Ö., Durmisevic S. and Sariyildiz I.S. (2001). Multi-resolutional information fusion for building technology, Advances in Design Sciences and Technology (ed. R. Beheshti), Europia Productions, Paris, 39-47.
Ciftcioglu Ö., Durmisevic S. and Sariyildiz I.S. (2001). Artificial intelligence and multi-resolutional knowledge modelling, Advances in Design Sciences and Technology (ed. R. Beheshti), Europia Productions, Paris, 49-56.
Ciftcioglu, Ö., Durmisevic, S. and Sariyildiz, I.S. (2001). On the Classification Enhancement of Radial Basis Function Network, AIDA 2001, Advances in intelligent data analysis, 19-22 June 2001, Bangor, Wales
Ciftcioglu, Ö., Durmisevic, S. and Sariyildiz, I.S. (2001). Architectural Design Knowledge Modeling", Conference proceedings Mathematics and Design M&D 2001, 3-5 July, Deakin University, Melbourne, Australia
Ciftcioglu, Ö., Durmisevic, S. and Sariyildiz, I.S. (2001). Multiresolutional Training of RBF Networks for Enhanced Approximation. Joint 9th IFSA World Congress and 20th NAFIPS International Conference. IFSA/NAFIPS 2001, July 25-28, Vancouver, Canada
Ciftcioglu Ö. and Durmisevic S. (2001). Fuzzy Logic in Architectural Design. EUSFLAT 2001 - Fuzzy Logic and Technology, 5-7 September 2001, De Montfort University, UK
Ciftcioglu, Ö., Durmisevic, S. and Sariyildiz, I.S. (2001). On the Regularisation-Enhanced Training of RBF Networks. IEEE International Conference on Fuzzy Systems FUZZ-IEEE 2001, 2-5 December 2001, Melbourne, Australia
Durmisevic S., Ciftcioglu Ö. and Sariyildiz I.S. (2000). An application of neural network in post-occupancy evaluation of underground stations, Construction Information Technology 2000 (ed. G. Gudnason), Icelandic Building Research Institute, Reykjavik, Iceland, vol. 1, 310-320.
Durmisevic S. and Sariyildiz I.S. (2000). A systematic measurement of the quality of underground spaces, Proceedings of the 2nd International Conference on Quality of Life in Cities, 21st Century QOL, School of Building and Real Estate, NUS, Singapore, vol. 2.
Ciftcioglu Ö., Durmisevic S., Durmisevic E. and Sariyildiz I.S. (2000). Building design support by soft computing, Proceedings of the 6th International Conference on Artificial Intelligence in Design 2000, Worchester Polytechnic Institute, Worcester, Mass.
Ciftcioglu Ö., Durmisevic S. and Sariyildiz I.S. (2000). Multi-objective design for space layout topology, Proceedings of the 5th International Conference on Design and Decision Support Systems in Architecture, Nijkerk, The Netherlands, 74-89.

- 159 -
Ciftcioglu Ö., Durmisevic S. and Sariyildiz I.S. (2000). Building design support by hierarchical expert networks, Construction Information Technology 2000 (ed. G. Gudnason), Icelandic Building Research Institute, Reykjavik, Iceland, vol. 1, 209-218.
Durmisevic S. and Sariyildiz I.S. (1999). A Step towards Sustainability, IABSE Symposium Structures for the Future - The Search for Quality, Rio de Janeiro.
Durmisevic S., Sariyildiz I.S., Durmisevic E. and Brouwer J. (1999). Sustainability by strengthening the relation between disciplines involved, Durability of Building Materials & Components 8, volume 3 (eds. M.A. Lacasse, and D.J. Vanier), NRC Research Press, Ottawa, Canada, 2012-2020.
Ciftcioglu O., Durmisevic S., Durmisevic E. and Sariyildiz I.S. (1999). Artificial Intelligence in Building Design, ISAMA 99 (eds. N.A. Friedman, and J. Barrallo), The University of the Basque Country, San Sebastian, Spain, 113-120.
Durmisevic S. (1998). Underground - the new frontier, ICQOLC '98, National University of Singapore, Singapore, 479-490.
Durmisevic S. and Ciftcioglu O. (1998). Fractals in architectural design, Mathematics & Design 98 (ed. J. Barrallo), University of the Basque Country, San Sebastian, Spain, 239-252.
Durmisevic S. and Durmisevic E. (1998). Integrating above and underground structures by means of pattern grammar, Underground Construction in Modern Infrastructure (ed. T Franzen), A.A. Balkema, Rotterdam, 151-156.
Durmisevic S. and Sariyildiz I.S. (1998). Spatial planning with underground building in information society, The twentieth century urban planning experience (ed. F Freestone), University of New South Wales, Sydney, 144-149.
Sariyildiz I.S., Durmisevic S. and Ciftcioglu O. (1998). Integrating pattern grammar and wavelets in architectural design, WSCG '98, University of West Bohemia, Plzen, 7-10.
Sariyildiz I.S. and Durmisevic S. (1997). New aspects of CAAD - use of pattern grammar for dynamic structures, CAAD - Towards New Design Conventions (eds. A. Asanowicz, and A. Jakimowicz), Technical University of Bialystok, Bialystok, Poland, 243-252.
Sariyildiz I.S., Durmisevic S. and Ploco J. (1997). Pattern grammar within the language of architecture, AVOCAAD - Added Value of Computer Aided Architectural Design (eds. K. Nys, T. Provoost, J. Verbeke, and J. Verleye), Hogeschool voor Wetenschap en Kunst, Brussels, 299-311.
H. Völker, I.S. Sariyildiz, M. Schwenck and S. Durmisevic, “The Next Generation of Architecture within Computer Science”, Proceedings of the 6th Conference of the European Full Scale Modelling Association, Vienna, Austria - September 1996


![Underground Operating Licence · underground spaces used or occupied at the date of this Licence in connection with the winning, working or getting of Coal from the Specified Seam[s]](https://img.dokumen.tips/doc/110x75/6032311eeaba514f1c72e6b2/underground-operating-licence-underground-spaces-used-or-occupied-at-the-date-of.jpg)