Embed Size (px)
Citation preview

See discussions, stats, and author profiles for this publication at: https://www.researchgate.net/publication/235072301
Perceived Barriers and Opportunities to Engineering Technical
Communication in Selected Air Force Organizations
Article · September 1989
CITATIONS
0READS
54
1 author:
Some of the authors of this publication are also working on these related projects:
Ohio River Transportation Model View project
Alan W. Johnson
Air Force Institute of Technology
53 PUBLICATIONS 698 CITATIONS
SEE PROFILE
All content following this page was uploaded by Alan W. Johnson on 22 May 2014.
The user has requested enhancement of the downloaded file.
~JA~\mill
00 ~OF
Lt)
JPERCEIVED BARRIERS AND OPPORTUNITIES TCENGINEERING TECHNICAL COMMUNICATIONIN SELECTED AIR. FORCE ORGANIZATIONS
THESIS
Alan W. JohnsonCaptain, USAF
AFIT/GSM/LSM/89S-20
DISTRI3UTIONd'2 ZIo A ICApproved for public release; ELECTE Bo
Distribution Unlimite I 2m 0 8
DEPARTMENT OF THE AIR FORCEE
8 AIR UNIVERSITY
AIR FORCE INSTITUTE OF TECHNOLOGY
Wright-Patterson Air Force Base, Ohio
89 12 20 054
The contents of the document are technically accurate, and nosensitive items, detrimental ideas, or deleterious intormation iscontained therein. Furthermore, the views expressed in thedocument are those of the author and do not necessarily reflectthe views of the School of Systems and Logistics, the AirUniversity, the United States Air Force, or the Department ofDefense.
F-p
AFIT/GSM/LSM/89S-20
PERCEIVED BARRIERS AND OPPORTUNITIES TO
ENGINEERING TECHNICAL COMMUNICATION
IN SELECTED AIR FORCE ORGANIZATIONS
THESIS
Presented to the Faculty of the School of Systems and Logistics
of the Air Force Institute of Technology
Air University
In Partial Fulfillment of the
Requirements For the Degree of
Master of Science in Systems Management
Alan W. Johnson, B.S.M.E.
Captain, USAF
September 1989
AiDroved for Public release; distribution unlimited
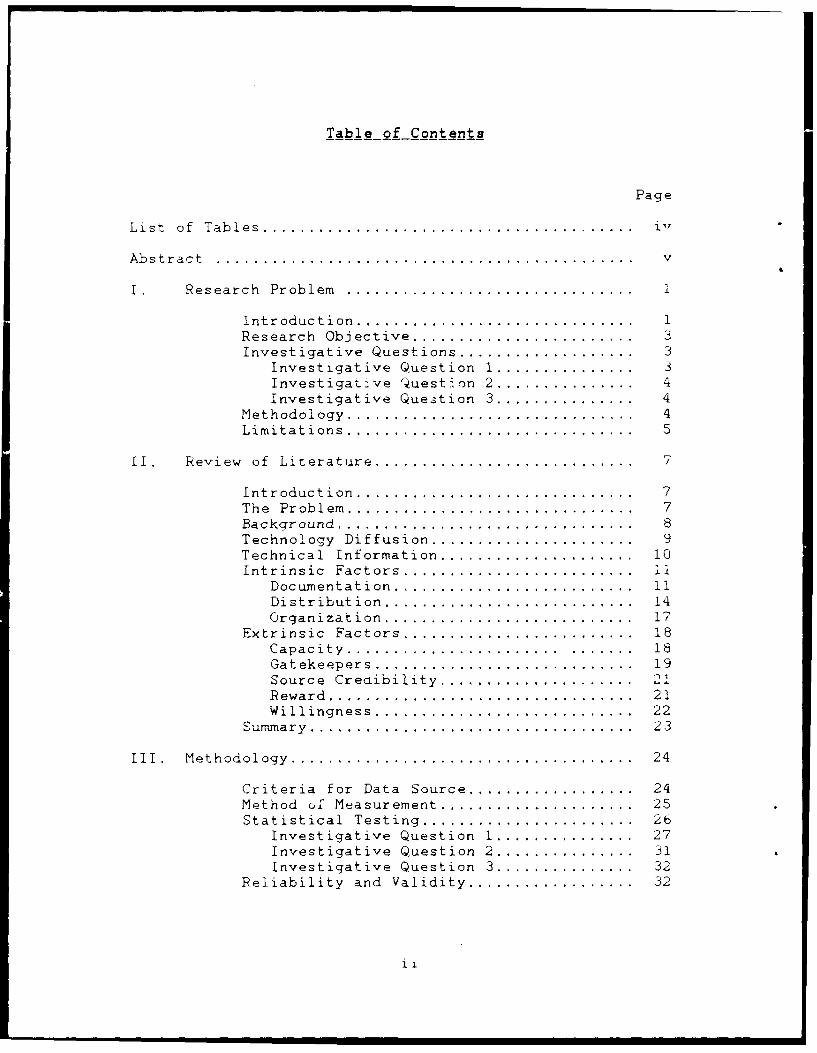
Table of Contents
Page
List of Tab les ........................................ i ',
Ab strac t . .. .. ... ...... .. ... . ....... ...... .. .. ... . ... . v
I. Research Problem ............................... i
Introduction .............................. 1Research Objective ........................ 3Investigative Questions ................... 3
Investigative Question 1 .................. 3Investigative Question 2 .................. 4Investigative Question 3 .................. 4
Methodology ............................... 4Limitations ............................... 5
II. Review of Literature ............................ 7
Introduction .............................. 7The Problem ............................... 7Backqround ................................ 8Technology Diffusion ...................... 9Technical Information ..................... 10Intrinsic Factors ......................... ii
Documentation .......................... 11Distribution ........................... 14Organization ........................... 17
Extrinsic Factors ......................... 18Capacity ............................... 18Gatekeepers ............................ 19Source Credibility ..................... 21R eward ................................. 21Willingness ............................ 22
Summary ................................... 23
III. Methodology ..................................... 24
Criteria for Data Source .................. 24Method of Measurement ......................... 25Statistical Testing ....................... 26
Investigative Question 1 .................. 27Investigative Question 2 .................. 31Investigative Question 3 .................. 32
Reliability and Validity .................. 32
iii

Page
IV. Results and Analysis................................ 35
Survey Response.............................. 35Demographic Information..................... 36
Supervisory Status....................... 36Military/Civilian Status................. 36Grade Level..........................:*',,',3bLength of Government Service............ 38Time in Present Organization............ 38Age Group.................................. 39Formal Education ............ *..........39Summrary of Demographic Data............. 40
Analysis of Investigative Questions........ 41Investigative Question 1................. 41Source Frequency of Use.................. 41Source Importance................ ..... 43Gatekeeper Activity Comparison.......... 45Database Use.............................. 45Investigativ,? 'uestintn 2................. 46Investigative Question 3................. 49
V. Findings and Recommendations....................... 51
Assumptions and Limitations................. 51Key Findings.................................. 51Comparison of Findings with Creighton-Jolly Model................................... 57
Documentation............................. 57Distribution.............................. 58Organization.............................. 59
Conclusion...................... ...........*59Suggestions for Further Research........... 61
Appendix A: Pre-Survey.................................... 63
Appendix B: Survey........................................ 67
Appendix C: Results for Investigative Question 1........73
Appendix D: Results for Investigative Question 2 ....... 85
Bibliography................................................ 101
Vita......................................................... 106
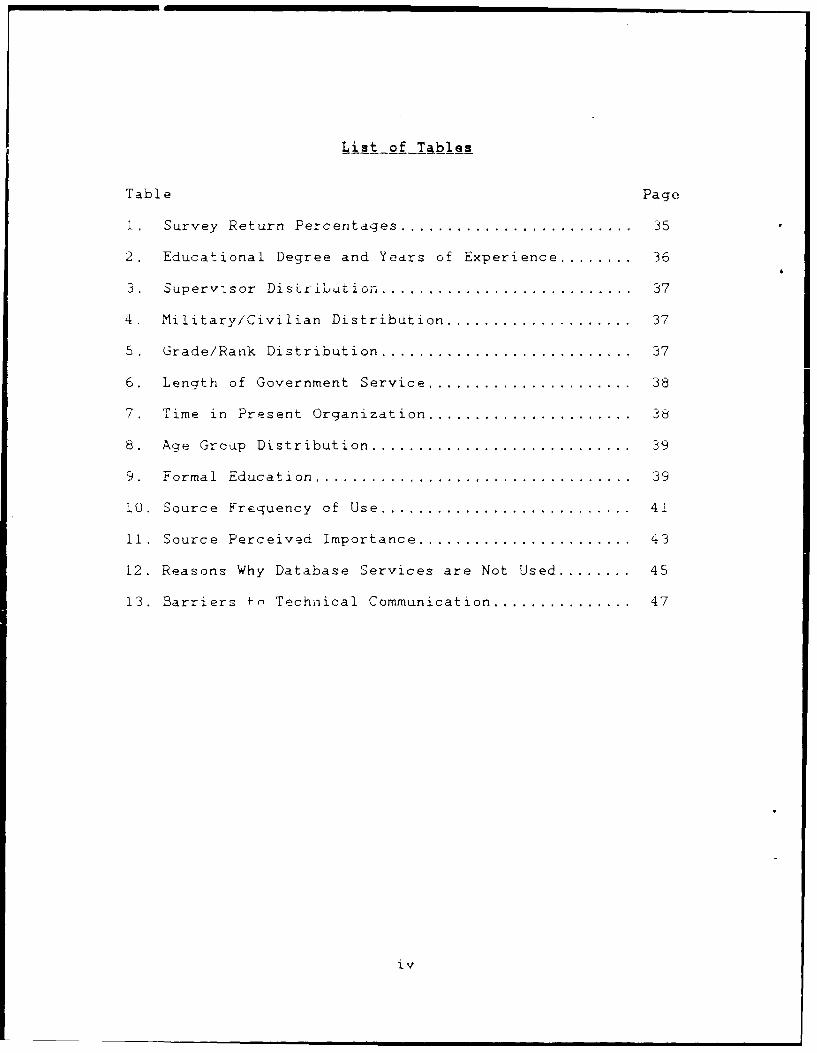
List of Tables
Table Page
1. Survey Return Percentages ......................... 35
2. Educational Degree and Years of Experience ........... 36
3. Supervisor Distribution ........................... 37
4. Military/Civilian Distribution .................... 37
5. Grade/Rank Distribution ........................... 37
6. Length of Government Service ...................... 38
7. Time in Present Organization ...................... 38
8. Age Group Distribution ............................ 39
9. Formal Education .................................. 39
10. Source Frequency of Use ........................... 41
11. Source Perceived Importance ....................... 43
12. Reasons Why Database Services are Not Used .......... 45
13. Barriers tn Technical Communication .................. 47
iv
AFIT/GSM/LSM/89S-20
Abstract
ionce successfully used, mature <empirically proven)
:echnoiogies are rarely diffused (remarketed and used) on
subsequent systems. One of the greatest barriers to the
diffusion of technology is a lack of widespread awareness
that a technology exists. The objective of this research
was to identify technical communication barriers and
opportunities, as perceived by selected Air Force Systems
Command (AFSC) and Logistics Command (AFLC) engineers, that
affect the diffusion of technologies into their
organizations. A survey of 86 selected AFSC and AFLC
engineers was conducted in support of the above objective.
Overall, the results of the study support the findings of
previous research. Recommendations are offered to help
improve the widespread awareness of (and hopefully the
subsequent use of) mature technologies by defense
*-ngineering organizations.
v
PERCEIVED BARRIERS AND OPPORTUNITIES TO
ENGINEERING TECHNICAL COMMUNICATION
IN SELECTED AIR FORCE ORGANIZATIONS
I. Research Problem
Introduction
The scarcity of acquisition funding, coupled with
stringent Air Force Reliability and Maintainability (R&M)
2000 goals, demands that successful (mature) technologies be
exploited as much as possible. However, once successfully
used, technologies are rarely diffused (re-marketed and
used) on subsequent systems (2; 39). A 1974 study by the
Federal Council for Science and Technology noted that 'the
practice of adapting technology to a secondary use is
outside the laboratories' mission responsibility and is
frequently lacking or not developed' (25). A possible
reason for the slow movement of technology might be
insuffiient technical communication and informnation-seeking
behavior with sources external to the organization. The Air
Force Coordinating Office for Logistics Research (AFCOLR)
sponsored this research into the problems of technology
diffusion in an effort to increase the use of mature
technologies.
1

A major study area of technology diffusion concerns the
movement of technology from the laboratory to an initial
application-- this is called technology transition. The
area of technology transition has received murh attention in
the last ten years (12; 17; 21; 36; 40; 51). This paper
does not purport to examine this avenue of technology
movement and associated communication factors per se;
instead it attempts to examine the methods of information
exchange that program engineers use to seek information on
mature (empirically proven) technologies for problem solvin
purposes.
A literature review and discussions with AFCOLR
personnel have resulted in the identification of many
potential barriers to technology diffusion (2: 22); however,
one of the greatest barriers is simply a lack of widespread
awaieness that a technology exists or knowledge of its risks
a-d benefits. Rogers and Brown believe that an important
relaticnship exists between the amount of wdespread
knowledge about an innovation and its rate of adoption (8:6;
4i:233). >cgers adds that the existence of effective
communication networks within a society results in faster
rates of diffusion and adoption' 41:236) than within
societies with limited communication networks. He quotes
'he res'ilts of five separate studies that support this
assertion (41:235). Liker and Hancock conclude from their
steadies that a lack of time and information are the two most
2

serious barriers to te enqineerinq effectiv Pess or a mano,-r
Ui7 a uto man,-f ac u-rer 131 : 86 ;.
Both Air Force Syst ems CoDmmand ,AWSC- and Alr Force
oqiC.-s ,mmrand AFLCQ have the ability to-- incorporate
D o y r n - s Yst e ms i n d ev eliopm n t-Dr ur d~n.
-w -crmmands ozo n,:? 7 arra-- ini~ i
'r e:d for the D-,eputy '-hi e cI :)l 'j
si * -is-s COmmanid, a r-iuei tat --rrnr
~irzr~e W cl' s*yst em :ieve-lop and a -ar Iar'
n a~ .n'w eaq e w i'i n ~ir Los- it ;7 A'I
r-r rrm~ r v r-rr.ev t hr A r r i
t -ack - nowled-j a i I 7 l -
-is, Y z ae - far -aro A L'r~ I ej
n o crc -,u -ir. e Inr. )v- r
Reqe ar ch Obective
.ne ( E) J iv o t ~i S r- s- 'l IS e~ i-n ity
7oM; I LA.-Iat io-r bar rier s -ani D~pp-orI-un i i s, a z- per'-e-
7, e: -ea Ar 'r,- ~ys e ms (- -,ommarn d -a ni Lo10 o, IS'ics mra 1,
r I' L fItea af f co7t '-h e I i f fu s ion .-t m atu1ir e I e,7h rl .
Fra m ext-rn-Al -oiesinto their orcqanizations.
InvestigativeQuesti ons
Three qiuest ions were adldresse -d as fojL n-ws
InyggtigativeQuestion 1. What is tne frequenicy t1-
Aril prceivei impoirtance Dt intoJrmat ion slources Ini diarne.-
3
u-sed by Air Force engineers whe n they seek technical
Ipyvgst igAt ive__Question_2, What communication barriers
aD Ai-r Force en,4ineers perceive that impede accesS t-D
r*', -e.- nil infrmratii txternal _r--
:rc,7a ]Z.3 na 1 unis;
:nvstiat ve uesi~zi 3 4hat cormui-nicati r.
un esi-Air Fo rce eno ineers perceive tna7- w.u.
:.nanc ffusion of mature tecn~nolcaies Ir, D any:
rieir :'rqanizatIona. units-,
Ie th ado 1 agy
-ar I~ - -n~er rrr 'i sour:eswees
r,: ; r -im it~e of AIr rorc e Sy s t m s Lo mma ncl a3
ar1P-3 r srl A ir r cre Ba se, a nd ( 2 en i ne e r: w h n j
A - 1r Pr-bn S A,.r Lq i:3,ic s (:enrer WR-ALk. S'y s 1.em F r oi --
t -4p P :;bins Air rt'rrce oeA twco-case st ucy a pr 1a.
~d ccmar ht, rspect v barr ie-rs percve n y
~~ rromn each raiain
A .i~rey *oiezstinnaire was ad.mnistered 'o A -census
13::"~ -~ni. 3~a'r and their perk- ivei_ -carrir
I :ii r Thm, suir v ey ls ,e d :r itera
i r a,-; a- ed f he r -7y,nnd ent s +j
11 - Y 4-1 a ma our bd I- r
respondents wpre also able to suggest other :ni osrnr
per c iv, d as L)a rr ier S Hypothesis tests were ueitz;
c )mp-are the sourcep trequency or use, Source rpran
r s pect iv e bar r-wrs p erreived by the WR-ALt'C or--manlz-At
t.- ~ o~r~ved y the Aflomalat&
r- es P n - ,n t w~ e_ ask ed e~c est w ays e en n-ir n
n 7 t :aI irnf Dr ma T: Dn i ntc: anr du ori 17e
;r,4an ;za t . ons
-his res-oarch 3-1,- noironide thne rcro
rcoM.rnunoar n n nv o vea wnen transit i:,ninj -a ne -7 T
>7nn- oy romarsero ahoratory to ar _
'forst us plQ tin rlly communic-ato rns o±
re piainof matuire technologies were ::-n-,12-
1- lure t econo es ar Pde Tf i nd a s 1-h, h ~cr.~z
-are ro w -is e I n f ei Ider s ystem- ns -or t e h nlo 1 -3 -hat
~r~5~~ecifrom -a laboratory to : an initial pL a'
torts tunder. by cateqory 6-).4Enneo-
-~n ntfundsz ASDI or ClIass; IV Mdfc~
anid Sustaining Engineeri ng HE/I 8 3 'W AL
t in , Du e to - thIne un i que blIend of m;,Ii try and -i ,
er r- with in the selected ASD and WR-ALC prq--r-3
r' "n esh emp ha si Lo:n matfur e t ec hno Icoqji~ e ' -
r!i A s t- i:t-aIy :In-t er th-ie r e Su11ts -n-%-,
r anza nors srv e ye. T he r -a d er hoeve r
logically infer the results of this research cautiously to
other defense organizations.
6
II. Review of Literature
Introduction
The review of literature begins with examples of the
technical communication problem, followed by the definition
of technology diffusion and its relationship to technical
communication. A brief discussion of the selected
communication model and associated factors, as well as the
perceived barriers that affect information flow, is
presented.
The Problem
Many reasons exist for studying the barriers to
communication and their effect on the movement or transfer
of technology. A major concern is that of ensuring combat
capability. Padula notes:
Why did it take the Air Force over 14 years to accept atechnology that provides leak-free hydraulic fittings?There were 350,000 of these fittings flying on Navy F-14aircraft, for 14 years-- with no leaks. Thisperformance is even more impressive when you considerthat these fittings were exposed to both the stresses ofa fighter environment and corrosion problems of the saltspray on a carrier. The implications of this Air Force'oversight" are tremendous in peacetime, but could becritical in wartime. . . . It was by chance that theAir Force even discovered this technology. . . . (39:1)
The hydraulic coupler technology was eventually
discovered by the Air Force during a 'Blue Two' visit (an
effort to bring system developers into contact with organic
system maintenance personnel) sponsored by AFCOLR. As a
7

result of their efforts, this technology is now used on the
Bl-B and C-SB aircraft. The primary reason for the slow
diffusion of this technology -,as apparently a simple ldck of
awareness -- a problem in technical communication.
One would think that good ideas would sell themselves.
Unfortunately, this does not often happen. Rogers
illustrates this point by discussing the efforts of the
British Navy to combat scurvy (41:7). Apparently, on long
voyages, scurvy was the biggest killer of ship personnel.
Rogers notes that although an Englishman conclusively
demonstrated in 1601 that citrus fruit cured and prevented
scurvy, the British Navy did not conduct their own tests
until almost 150 years later. Indeed, the Navy did not
adopt this innovation until 1795. Rogers lists several
possible reasons for the slow adoption of citrus, including
competing remedies for scurvy and a lack of prestige of the
researchers (41:8). He does not include an estimate of the
number of men who must have died of scurvy during the 194
years required to diffuse and adopt this knowledge.
Background
Any research on information transfer must recognize that
not all information is obtained in a deliberate manner.
Salasin and Cedar are careful to caveat their communication
research with the fact that information is often stumbled
upon in unexpected, inadvertent ways (43:4). They conclude
that the occurrence of an exchange of information is often
8

triggered by the simple availability of information (43:62).
A good example of this is the Air Force engineer's chance
discovery of the Navy's hydraulic coupler technology
previously mentioned.
Technology Diffusion
Technology diffusion (also called technology transfusion
by AFCOLR) is "the process by which an innovation is
communicated through certain channels over time among the
members of a social system" (41:10). Rogers notes that
"diffusion is a special type of communication, in which the
messages are concerned with a new idea" (41:6). The concept
of a new idea implies that risk is involved -- risk is
identified in many studies as a principal barrier to
technology transfer because of management cost and schedule
constraints (12:32; 40:10). However, Cormier and Salvucci
contend that a balancing conflict is necessary among cost.
schedule, and technical excellence (12:122; 32:21).
For military systems development purposes, Padula
defines technology transfusion (diffusion) as the
'beneficial horizontal movement of technology to one or more
systems after its initial application" (39:2). Therefore
the concept of risk is minimized because empirical data is
available from the "proven" first application of the
technology.
Stewart attempts to distinguish between the meanings of
technology ''transfer' and technology "diffusion" by stating
9
that commercial firms wish to encourage "diffusion' or
widespread use of a technology-related product, while at the
same time restricting the "transfer" of the understanding of
the technology itself (47:72) . Others (13; 32; 38; 41) do
not distinguish between the terms. Although Stewart's
distinction between use and understanding is valid (26:63),
the terms ''diffusion'' and ''transfer' are used
interchangeably in this author's research.
Technical Information
The explosion of technical information in our society
today is well-documented (4; 17; 50). Allen notes:
The tremendous increases in recent years in the amountof research and development performed in the world hasresulted in a concomitant increase in the amount ofinformation to be communicated, presenting the user withthe difficult problem of plowing through a morass ofavailable information to reach the information pertinentto his problem. . . . The technologist must obtain hisinformation either through the very difficult task ofdecoding and translating physically encoded informationor by relying upon direct personal contact andcommunication with other technologists. (4:5,7)
A logical point to initiate discussions of technical
communication is to posit a model that represents the flow
of information, This researcher selected a simple model
used by Berlo (23:59) and modified by Jolly and Creighton
(27:21). This model is selected due to the emphasis that it
places on the user end of technology transfer (34:16). User
emphasis is important because the thesis focus of mature
technologies infers that a direct sponsor-user link does not
10
normally exist, as it otherwise should in transitioning
technologies (12; 36).
The model has three parts: a source, which feeds
information through a channel to a receiver. Jolly and
Creighton present a list of intrinsic (formal) and extrinsic
(informal) factors that affect the flow of information from
source to receiver (34:20). McCorkendale states:
The ''intrinsic' factors are easier to conceptualize andare objectively measurable. They deal with mechanicsand procedures used Lo index, store, retrieve anddisseminate information. The "extrinsic' factors dealwith interpersonal communications, personal feelingsabout a knowledge source, and perceptions about one'sorganization, supervisors and peers. (34:17)
Intrinsic Factors
intrinsic factors include information documentation,
distribution, the receiver organization, and the nature of
the project (34:26-30). The project factor is concerned
with the transition of technology from research to an
initial application and therefore will not be discussed.
Documentation, Documentation refers to how information
is defined, organized, and presented. Two additional
variables -- language and format-- relate directly to the
ease of use of the information (34:21). Engineers often use
language that is no. universally understood by persons
outside their own organization (4). McCorkendale notes:
. ... often an area will be very well documented, yetnot be well documented for transfer. . . . informationcan be expressed in many ways, each understandable oruseable to a different group of people. If researchdocumentation is in a form understandable by the
11
perceived potential users, then the chance for eventualutilization of that information may be greatly enhanced.(34:22,24)
A major problem of documentation is that professional
literature can inhibit the transfer of technology. First of
all, symbolism can vary between organizations, as noted
above. Second, Allen argues that engineering professional
literature is often written in a scientific format that is
"utterly incomprehensible to the average engineer" (4:73).
He illustrates this by stating that the journal articles
"often rely upon mathematical presentations, which can be
understood by only a limited audience" (4:73). He adds that
"no efforts are made to interpret or translate Lne material
into a form that the average practicing engineer can
understand or use" (4:73).
Allen is not attempting to criticize the mental capacity
of the average engineer. He merely points out that many
engineers have been away from an academic environment for
ten years or more, and are not required to use the levels of
mathematics and physics in their daily activities that are
shown in many journal articles.
A second problem lies in the area of maintaining and
expanding written technical information. This derives from
what is commonly known as the fundamental nature of
technology (4:39; 5:695; 43:7). This concept posits the
idea that scientists (pure researchers) are more apt to use
and add to written information sources than engineers
12

(people who apply technology). Allen points to the fact
that publication often serves as the embodiment or
culmination of a scientist's work... whilp an actual
physical product is more often the result of an engineer's
efforts (4:40). Therefore engineers arc- less likely to
either document or read of the outcome of a technologioal
accomplishment than are scientists.
In an effort to document the availability of mature
technologies, AFCOLR/TT has initiated a newsletter program
of "TechTIPs' designed to enhance awareness of mature
technologies. Each TechTIP contains a brief description of
a technology, its benefits and drawbacks, and a point of
contact (3).
A third problem concerns ownership of technological
documentation. Some defense weapon systems are acquired by
the government without associated data rights. If a
commercial firm has developed the technology in question,
then firm rights-in-data restrictions may prevent the
government from disclosing the technology to other
government agencies unless th government has purchased the
rights-in-data. These rights often represent a firm's
'bread and butter,' and as such, can be prohibitively
expensive. A related problem is the issue of government
security restrictions--- unclassified technologies, when
associated with highly classified systems, can become
classified themselves (25).
13

Distribution, Distribution refers to the channel
through which information flows (34:24). Chakrabarti et al.
define a channel as 'the means by which an information
package is moved from one point to another' (9:84) . They
note that channels can include people, organizations, and
technological mediums. Some forms of information
distribution chatinels are telephones, mail, television,
radio, libraries, information specialists both within and
outside of the organization, and workshops or seminars.
Indeed, one WR-ALC organization hosts bi-weekly meetings
with local contractors in an effort to disseminate technical
information among contractors and the Government (6).
An additional distribution form is the movement of
people through job reassignment or temporary labor (34:25).
People who change jobs often diffuse new ideas and
technologies (8:27; 30:49). Recognizing this, some
organizations have initiated personnel rotation policies
within the various departments of their firms (33:17).
Source and channel accessibility are a key measure of
the capebility of a distribution system (49:68).
McCorkendale notes that distribution does not truly occur
unless the information has been received and understood
(34:24). The barrier of capacity limitations of the
receiver to receive and process the sheer volume of
available information is well-documented (4). One form of
distribution that is becoming increasingly popular as a
14
solu~ion to the information explosion is computer databases
(34:25). These include federal data bases such as the
National Technical Information Service (NTIS) and the
Defense Technical Information Center (DTIC), and commercial
data bases such as Lockheed's Dialog system. Database
systems have numerous benefits, including enhanced exchange
of technology through greater access to information from a
wide variety of sources, and the ability to filter relevant
information from the tremendous volume of information
qvailihle (24:106). DTIC's Current Awareness Bibliography
service provides biweekly bibliographies of new technical
report acquisitions related to user-specified areas of
interest, to any defense engineer who wishes to subscribe.
However, Hubbard reports that in a study of some 9000 Army
engineers and scientists, only 213 subscribe to the service
(24:111).
Computer databases have their snare if problems. For
example, although Department of Defense (DoD) Directive
3200.12 requires that DoD components submit technical
reports and summaries of ongoing efforts to DTIC (50),
database personnel report that they continually have
problems obtaining state-of-art information. A federal
study in 1975 of the Defense Documentation Center twhat is
now DTIC) concluded that 'the identification, o>-t1~r:, and
I-e a'-hnisms for attaining such information in ,rin'e,
form were the greatest obstacles to , smooth "low cjt dretense
15
technical information" (15:25). A 1985 study of DTIC use by
Army research and development engineers reached similar
conclusions (24:108) .
A second reason for the difficulty of using computer
databases involves the ways that information is added to and
organized within the databases. A potential user often must
use a system of keywords (descriptors) to identify the area
of required information within a given database. A
communication problem then occurs when the keywords have
different meanings for different users (4:7; 26:63). indeed,
anyone who has attempted to use a computerized information
retrieval system would probably attest to the amazing
variety of information obtained under what would appear to
be a ''univcrsally defined' keyword.
A third problem concerns the delays for receipt of paper
copies of documents ordered from database services. These
delays sometimes consume weeks or months between request and
receipt of documentation (24:109). The delays are
attributed to constrained database service budgets, user
reliance on paper reproduction done by the database service,
and lack of user on-line document printing capabilities
(24:110).
Cormier and Salvucci report that contractors are a
fundamental element in the movement of technologies
r12:102). They note that the contractor forms a third party
loop for assisting the transition of emerging technologies
16

from the laboratory to a product division (12:121). One
could presume that the contractor may also play an important
role in the movement of mature technologies.
Qrganization, The receiver's organization can impact
the flow of technical information. Triscari notes:
'Different organizational designs have developed with
distinct characteristics and different efficiencies for
processinq information' (49:67). He cites a study by Burns
and Stalker that shows information flow within mechanistic
'highly formalized) structures is more restricted than
information flow within organic (relatively informall
:rganizati on structures (4,9:66-67)
-he nature of an orqanization's reason tor existence an-c
associated resistance to change is often cited as a prirnar',,
organization barrier 4 2'; 3'2; 41). C:olonel Grapes'
mention of AFLC ALC emphasis on system production las
compared to AFSC emphasis on development) infers that tie
motivation for personnel to dedicate themselves to improve
system quality through technology is limited .
McCorkendale quotes a study by Schon that claims that
organizations are constantly in a state of change conflict.
Althc-uqh most organizations are continuously changin-, in
response to environmental stimuli, each advocate of chance
feels obligated to behave as though the changes he
introduces will be the last (34:26). The nature and extent
17
ot the organizat4.onai conflict involved can either encourage
innovation or reject change.
MlcCorkendale notes that the manager must carefully
monitor the degree to which information flow is facilitated
,r bloczked at various points in his organization, and
recggnize the reward systems which motivate or prevent the
rlw of inf.rmation 34:27.
*:,st and schedule constraints placed on the organizatimn
.17 ninder mte movement of technologies. Cormier and
ralvu'ci refer to a study by Spurrier that showed that h
snrtr-m erm orientations of key decision makers were barriers
ruucessiI transition of technology (12:104).
Extrinsi c Factors
Extrinsic factors include receiver capacity,
.a'e eepers, surc credibility, perceived rewards, and
L4: i i4n .s-s accept change.
C apaqc4ty, apacity refers to the ability oc an
r inl i- i n o accept and use new or innovative ideas
:1 .'crkendaie notes that research in this area has
. primarily on personality traits and behaviors of
niv4r o exhibit 'early adopter'' tendencies of new
1 1 4 : He mentions several personal attributes
r','. '. status, ytars of education, amount ot
,r J. rniun ica.~ )n, venturesomeness, professional staris,
r :rina e, nl ] ' '' t t are psitively
• • l n I I I I

related to innovativeness. Age appears negatively relIatec
t :) i rnova t i ven e ss 3'-4:32; 4 4 .
Organization attributes that are positively relatec! to
innovat ion include business size , income, and amou-,-nt c
ex tern a 1c imrniun ic-at1i on (,34 :32. However, theo a~ue r r-
anits witri stabie membership within an ocnzto~:e.
negativel-, lae to innovation (29,)
Gatekeepers_ G atekeepers are inao-vicdua-s who s
o+ ::Dmrunic-at-ion ac:.tivity with bcotn withn arcexer
tne o)rjanization, are capable ot promo ti:vLu, av:a,~.
i Io rm at i -n flo-,w k 14 4 ; 34: 4 3 rc kr ' Id n
trn e lm z).,ra ntI. ro of tri he ii '.e r- ra i, e --
erm -cr another- by eeycne- wro wo7 s'
rans ter- 34:- 34)
TaylIor -conduct ed a t ive-,,,ear 1cm.- aAI ,-3 V
gatek.eeper activit-,y at a ma i'Dr ale ten a
>evei,-o ment facility 4;-)). -,-i;s me a '- r emr" 7
i nclIu-4ed z eve v a r iables ro res s i .na~ ir a
s:ymposia at ,ended , paper-- present-,i aini ri ci i i
measures of external interpersc.nai -on' Aa-
,iublications , j3Durnais read. and Palents Se-----
internal contact' 4 ;:18. H S r sults ,- snz wei
cateoepes 'endied to be oldier , more :miw -
iiave Pm(.re --riaL e xpe-r ien7;e nave be.< : t,
ar. wok i p Iri oe-r j.rn- wePr e p r ,rna r Iy .- :: r.

Gatekeeper activity is particularly vital as a means if
external communication if one accepts the premise of the
'law of least effort' (20:277). Several studies have shown
that most people are more likely to choose an information
source based on ease of use than on the amount or quality of
expected information (20; 42; 43:100). In other words,
information seekers are said to choose the path of least
resistance. Salasin and Cedar cite a number of studies when
proposing that engineers attempt to maintain knowledge and
learn of new technologies mainly through oral communication
with other engineers within the organization. Indeed, their
own research tended to support this claim (43:99). It is
usually easier to ask someone for a problem solution than it
is to attempt to research literature. Following this line
of tnought, it is easier to ask someone in one's own
organization (regardless of that person's expertise) than it
is to attempt to locate a person with relevant knowledge in
an external organization (43:100).
David and Cochran discuss the concept of a communication
isolate. They state that isolates 'inhibit effective
communication in an organization by failing to process and
transmit information" (14:167). They argue that management
should understand and be aware of both gatekeepers and
isolates, and that effective management of these phenomena
could enhance information flow into and within the
organization (14:166). However, Fischer argues that the
20

'gatekeeper has evolved without manager intervention"
(19:83), and that managers should therefore engage carefully
in attempts to deliberately stimulate gatekeeper activity.
Source Credibility. Credibility refers to a receiver's
perception :, the reliability of a source of information
(34:36). Creighton adds that source credibility is vital--
a source without status is not likely to be perceived as a
source at all (13:75) . McC6rkendale argues that a person
must contend with many sources and channels of information,
and that how he and his organization react to the source
depends on his and his organization's perception of the
source credibility (34:38).
Reward. Reward refers to the perceived and actual
recognition of innovative behavior within the individual's
organization (34:38). Rewards can be distinguished by two
categories: formal rewards such as salary, cash bonuses,
recognition and promotion; and informal rewards such as
increased responsibilities and opportunities (34:39).
Rewards can be negative. If a person tries to innovate
and fails, that person may be censured or even lose his job.
In this case the reward is not to innovate, but to do
nothing (34:39). Jung notes that a lack of reward for
successful innovation can be a barrier to technology
diffusion, due to lack of management encouragement (28:24).
Cormier and Salvucci argue that perceived risk is a major
disiricertive for considering new or different technologies:
21
. . . .the primary pressures on system program officesare to meet acquisition schedule and cost goals. Thereis little pressure (reward) to increase the performanceof a systen. . . . the incentive/reward system is an
important factor in whether an individual will utilizenew technology. (12:102,104)
McCorkendale refers to a study by Deci that indicates
that informal rewards often are a more effective motivator
than formal rewards (34:39). Similar rewards are perceived
differently by different people. The outcome is that
managers must understand the reward system as it is
perceived by the individuals in their organization before
the rewards can truly serve to motivate behavior (34:39).
Willingness. This element refers to an "individual's
ability and desire to accept innovation or change in the
organization where he works' (34:40). This researcher
modified this factor to consider the individual's propensity
to seek information to provide new or different approaches
to his work. As noted earlier in this paper, people often
follow a "path of least effort" when seeking information.
This effort can relate to either physical or psychological
costs (20:277). Physical costs can be measured in terms of
channel accessibility and ease of use (20:272), while
psychological costs involve "a revealing of ignorance on the
part of the engineer among his peers" (19:72).
A manager's principal method for combating the "path of
least resistance" is through the organization's reward
system (12:104; 34:40).
22
One of the principal barriers to the diffusion of mature
technology is a simple lack of awareness-- a problem of
communication. Problems in communication can be traced to
barriers that exist within the various intrinsic and
extrinsic factors that constitute the source-channel-
receiver model of communication flow. Documentation
problems include nonstandard symbolism, the problems of
understanding some professional literature, and a reluctance
of engineers to read about or document their technical
accomplishments. Problems in distribution include
information overload and limited information accessibility
based on difficulties of using automated databases,
security, and rights-in-data restrictions. Other problems
include organization priorities that limit innovation,
capacity constraints, limited gatekeeper encouragement,
isolate behaviors, and a lack of source credibility.
Rewards are likely to be ineffective unless management
understands the organizations' perceived reward system. The
path of least resistance phenomenon seems to hinder an
individual's willingness to seek technical information.
23
III. Methodology
This section describes the methods used to collect and
analyze data obtained in support of this research.
Criteria for Data Source
The data source for this study was comprised of a census
of 86 08XX (civi?.Yin) and 28XX (military) engineers
affiliated with selected Aeronautical Systems Division (ASD)
and Warner Robins Air Logistics Center (WR-ALC) program
offices. Both organizations are responsible for the same
overall weapon system. WR-ALC is responsible for the
maintenance and upgrade of the operational components of the
system, while the ASD program office is responsible for
developinq a new version of the weapon system. The two
organizations were chosen because a) both organizations
share similar engineering opportunities and product focus,
b) both organizations have a fairly consistent mix of
engineering specialties [systems engineers, electrical
engineers, and aerospace engineers, for example], and c) the
sample sizes represented by the engineers within the two
organizations made statistical calculations manageable.
The two organizations were selected for convenience
purposes. The exploratory nature of this research did not
warrant the costs and time required to obtain random samples
of all Air Force Systems Command (AFSC) and Logistics
24
Command (AFLC) engineers. The results of this research
would determine whether further research was justified,
using a true random sample of all AFSC and AFLC weapon
systems engineers.
Method of Measurement
A survey, developed using portions 3f existing
instruments (7; 24), was administered to the census of
engineering personnel from the ASD and WR-ALC organizations.
A survey approach was chosen for this research primarily
because there was no data otherwise found to be available
for answering the investigative questions; data had to be
collected. Experimentation was clearly not an option as
control of individuals' education, experience, and
communication behavior would have been required. Objective
measurement of technical communication activity (via direct
observation by the researcher) was deemed to be impractical
due to researcher time and cost constraints, leaving survey
measurement of perceptions and opinions as the only
reasonable data collection technique. Because of the desire
to survey both ASD and WR-ALC engineers and the limited time
available for data collection, mail questionnaires were
chosen over personal interviews as the preferred survey
approach.
Required actions were as follows:
1. The list of proposed barriers (derived from the
chapter 2 literature review) was reviewed with eleven
25
selected engineers from ASD and WR-ALC as a content validity
check of the selected barriers. The military (Major and
above) and civilian (GS-12 and above) engineers were chosen
from a variety of engineering specialties representative of
the population to be surveyed. The eleven engineers were
asked to provide expert opinion on the proposed survey
information sources and technical communication criteria.
The pre-survey is shown in Appendix A.
2. A pretest of the survey instrument for readability
and format was done on seven selected ASD engineers.
3. The survey instrument (shown in Appendix B) was
submitted for review and approval by Headquarters, Military
Personnel Center.
4. The approved survey was delivered in person to
engineers within the ASD program office. A point of contact
at WR-ALC delivered the survey to WR-ALC engineers. This
approach helped to maximize the response rate within both
organizations. The results were designed to assure
anonymity to both the respondents and their respective
organizations.
Statistical Testing
The researcher initially considered a parametric
analysis of variance approach for statistical calculations.
The applicability of parametric statistics are contingent
upon the following three assumptions (18:358) 1) the
observations should be independent and randomly drawn, 21)
26
the observations should be from normally distributed
populations, and 3) the populations should have equal
variances. The first assumption was not met. The sample
data was obtained via non-probabilistic means as explained
in the 'Criteria for Data Source' section above. Secondly,
assessments for population normality [using the personal
cnip'it~r STATISTIX progrAm Wilk-Shapiro statistic (45.591-
611)], did not present satisfactory evidence that the
population characteristics were normally distributed.
Thirdly, the assumption of equal variance proved suspect
after a Hartley's test for variance homogeneity was
conducted on the perceived barriers (37:416). Based on the
above factors, a non-parametric statistical approach was
used for data analysis.
Invetigative Question 1. This question addressed the
frequency of use and perceived importance of sources and
channels that engineers use to seek technical information.
Potential information sources for the survey were derived
from those found in the literature review (7):
1. Internal formal sources -- to include organizationreports, department memorandums, and formal scheduledmeetings (survey question 9).
2. internal informal sources -- to include informalconversations with superiors, subordinates, and peers, andinformal meetings (survey question 11).
3. External formal sources -- to include professionaljournals, trade magazines, technical publications,g. ernment and contractor reports, schools, and professionalanc trade association meetings (survey question 10).
4. External informal sources -- to include informalconversation with contractors, peers from other
27
organizations, and professional society contacts (surveyquestion 12).
Each respondent ranked the perceived importance and
frequency of use of each item within the four sources on a
five-point scale, and was able to list additional items that
were not found within the four listed sources on the survey.
A composite score for each of the four sources was
determined by averaging the response to each item listed
under the four sources.
Wilcoxon Rank Sum tests were conducted to compare source
frequency of use within three principal demographic
characteristics, including a) organization -- WR-ALC versus
ASD, b) years of government service -- less than fifteen
years versus fifteen or more years, and c) education --
those with undergraduate degrees only versus those who had
completed graduate level coursework. This approach was then
repeated for source perceived importance comparisons. The
analysis results are shown in Appendix C.
The Wilcoxon Rank Sum test provides a means of comparing
two population distributions. A null hypothesis of no
difference between the two distributions is posited, and a
test statistic is calculated from the sample population
data. If the test statistic exceeds a critical value (based
on a selected alpha confidence level), then the null
hypothesis is rejected and an alternate hypothesis (that a
significant difference exists between the two populations)
is accepted.
28
The overall alpha (probability of committing a Type 1
error) was set at 0.1. Since the Wilcoxon Rank sum Lests
were to be repeated for each information source, the
application of a 0.1 alpha to every test would have resulted
in the overall probability of Type 1 error for each set of
four hypotheses being larger than the 0.1 value set for each
individual test. Therefore, the Bonferroni method of
dividing the overall alpha by the number of proposed tests
(35:147) was used to calculate individual alpha levels of
0.025 for each test. The fairly large (e.g., 0.1) overall
alpha was used because the Bonferroni technique controls
Type 1 error, but does not control Type II errors well
(meaning that some significant differences could be masked).
Because the Wilcoxon Rank Sum test does not indicate the
magnitude or -direction of differences between two
populations, when differences were detected, the averages
(means) of the populations were compared to assess how the
populations differed.
A Kruskal-Wallis nonparametric single factor analysis of
variance (ANOVA) at a 0.1 alpha was then used to determine
whether significant differences existed between the overall
frequency of use of each of the four sources. A second
ANOVA was used to compare the overall perceived importance
distributions of the four sources. If the Kruskai-Wallis
tests indicated that significant differences existed, then
further Kruskal-Wallis tests were conducted to determine
29

which of the four sources were different (1:183; 11:259).
The Kruskal-Wallis test is an extension of the . 'iz4c-or Ran'
Sum test, and is used to analyze two or more independent
distributions simultaneously (11:256).
The extent of gatekeeper activity and database use as
external channels of information were determined.
Gatekeeping activity for each individual was measured using
a four-item construct (16) based on the monthly frequencies
reported by respondents of:
1) The number of scientific and technical journalsread (survey question 10b.).
2) Instances of seeking technical information frompeople outside of the organization (survey question 12).
3) Instances of providing technical information -opeople within the organization (survey question 13).
4) Instances of providing technical information uponrequest to people outside of the organization (surveyquestion 14).
The qatekeeper questions were based on a five-point scale.
Overall gatekeeping activity within each of the two
organizations was obtained by averaging the individual
scores for each organization. A Wilcoxon Rank Sum Test at a
0.1 alpha was used to compare the gatekeeper activity within
the three demographic characteristics.
Database use information was collected using questions
derived from the Army survey of DTIC (24). Database use was
assessed based on the frequency of "yes' responses to the
survey question 15, for both WR-ALC and ASD. Survey
question 16 addressed reasons why some respondents did not
30

use database services. The results were reported based on
the frequency of response to each potentiel reason.
Investigative Question 2. This question addressed the
perceived barriers that impede access to sources of
technical information external to one's organizational unit.
Criteria that the literature review revealed as potential
barriers were listed in Part III of the survey. The wording
of each barrier was presented in a neutral fashion, and the
five-point scale endpoints allowed the choice of each
criterion as a facilitat~r or barrier. This was done to
minimize survey bias (the distortion of responses in one
direction). Each respondent ranked the perceived magnitude
of each criterion (as a communication facilitator or
barrier) on the five-point scale, and was able to list
additional criteria that were not on the survey.
Wilcoxon Rank Sum tests were conducted to make
comparisons of each barrier within the three demographic
characteristics (organization, years of government service.
and education) . Since the Wilcoxon Rank Sum tests were to
be repeated for each barrier, the Bonferroni approach was
used to adjust the overall 0.1 alpha by dividing the overall
alpha by the number of tests (fourteen), resulting in
individual 0.008 alpha coefficients for each test. When
differences were detected, the averages (means) of the
populations were compared to assess how thp populations
dif fered.
31

A Kruskal-Wallis nonparametric single factor ANOVA was
then used to indicate whether significant differences
existed between the overall mean response populations for
each barrier. If the Kruskal-Wallis test indicated that
significant differences existed, then further Kruskal-Wallis
tests were conducted to determine which of the populations
were different (1:183; 11:259).
A Spearman rank correlation was done to determine
whether associations existed between the perceived barriers
and the frequency of use/perceived importance of each of the
four information sources. This research was noL structured
as an experiment, and therefore one could not claim
causality, should significant asscciations occur.
Investicqative Question 3. This was an open-ended
question that asked the respondents to indicate
opportunities that would enhance communication with sources
external to their units. This data was reported in terms
of frequency of each response.
Reliability and Validity
The reliability of the Rurvey instrument was
Strengthened by using questions obtained from existing
instruments for a) sources of information (7), b) autonated
database use (24) , and c) gatekeeper activity (16).
Content validity of the sources of information and
proposed barriers (in an Air Force technical communication
wettin<i were a3sessed by obtaining expert opininn from
eleven selected engineers from AFSC ana AFLC. TIhse
engineers were asked to determine whether t tr -- seO
sources of information and barrier criteria liste,: in
pre-survey (Appendix A) provided adequate coverage or
information sources used and problems that they per .
external technical communication, and were asked t: sue-"
any additional criteria that they perceived as barrer
Each barrier criterion was listed in the pre-survey or
three-point scale representing its degree of reevae
technical communication. A criterion was rejece if.
on the pre-survey responses, its relevance was e~er-i:.ec
be less than moderate (mean value greater than 2
The four questions that comprise the gatekeoper
construct "were found by Creighton et al. to rbes
discriminate between gatekeepers and non-,oatekeeFer.z
survey of over 1200 members of the Navy Ciivil En4irner
orps- 16;. Dewhirst, using Creiqhton's-4ateKee.er
construct questions in a study of over 330 enqine-rs,
demonstrated a test-retest reliability of _1 .7 ever e
month period (16).
Existing literature was extensively reviewed tc
and list potential communication barriers for llsie
in additiDn, all respondents were able to pro',ie ail
items they perceive as barriers. However, the .u 7
this research indicates perceived barriers., an a7 ,. .-r i a
c_ perceived differently by different populati ns,
33

Therefore, the results of this research are presumed valid
primarily for the population in question. The validity of
these results should be considered carefully when applying
them to other populations.
Rogers has questioned the validity of the one-shot
survey as a valid measure of the behaviors related to The
communica, ion of technological information. He bases his
arguments on the element of time and the issue of causality
(41:112-114). He argues that the survey approach relies
heavily on the ability of the respondent to recall specific
actions-- but memory is often shown to be inaccurate. His
second point is that "...survey data are unable to answer
many of the 'why' questions about diffusion' (41:114). He
recommends that research in the movement of technology
involve field experiments or case studies over time to
assess the issue of causality.
This author recommends that a follow-up survey be
administered to the same population next year to address
this issue.
34
IV. Results and Analysis
This chapter presents the descriptive statistics and
analysis of data collected by the survey questionnaire. The
demographic data is discussed, followed by the analysis of
each investigative question in the order presented in
chapter three.
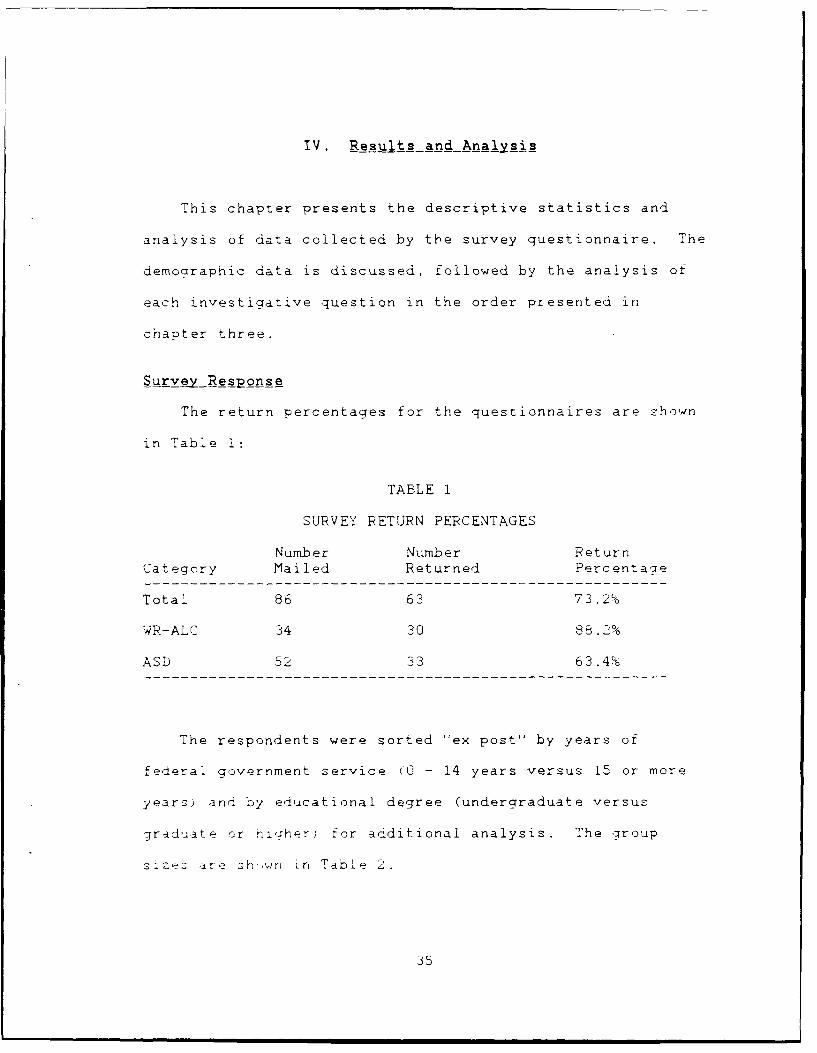
SurveMyResponse
The return percentages for the questionnaires are shown
in Table 1:
TABLE 1
SURVEY RETURN PERCENTAGES
Number Number ReturnCategory Mailed Returned Percentacie
Total 86 63 73.2%
WR-ALC 34 30 88.2%
ASD 52 33 63.4%
The respondents were sorted "ex post" by years of
federal government service (0 - 14 years versus 15 or more
years) and by educational degree (undergraduate versus
graduate cr higTher) for additional analysis. The qroup
s.zes are sh,wrn in Table 2.
35
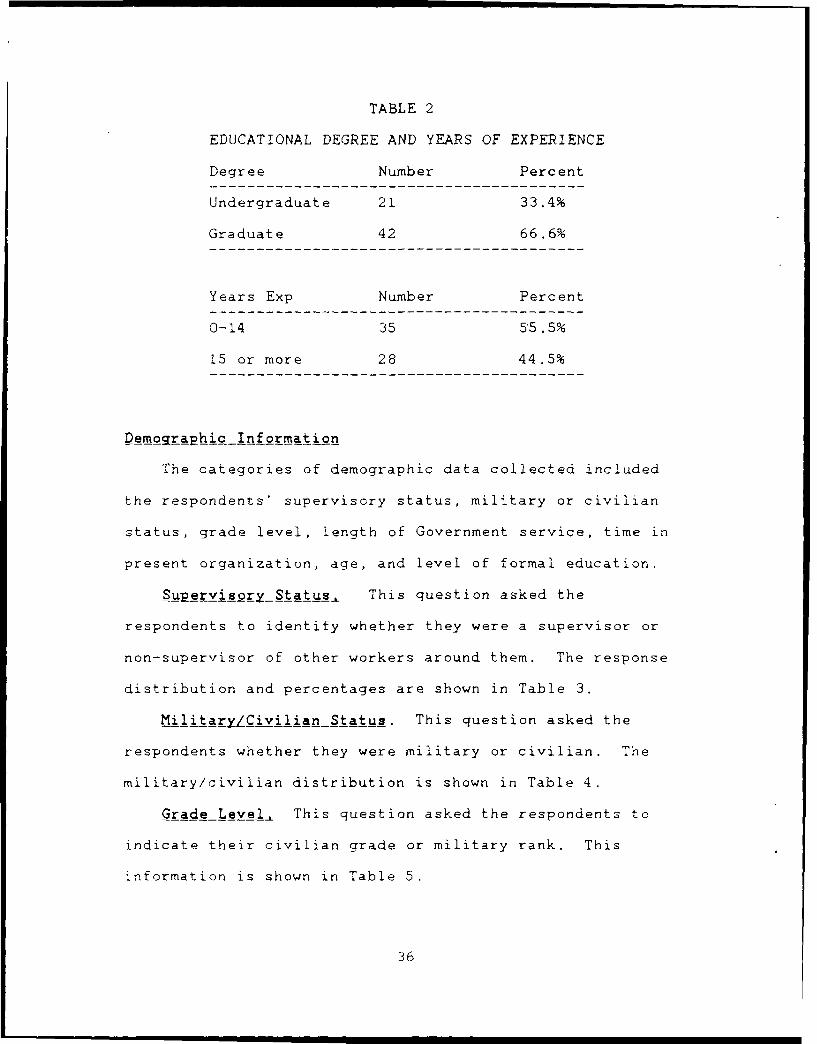
TABLE 2
EDUCATIONAL DEGREE AND YEARS OF EXPERIENCE
Degree Number Percent
Undergraduate 21 33.4%
Graduate 42 66.6%
Years Exp Number Percent
0-14 35 5'5.5%
15 or more 28 44.5%
DemograRhic Information
The categories of demographic data collected included
the respondents' supervisory status, military or civilian
status, grade level, length of Government service, time in
present organization, age, and level of formal education.
SupervisoryStatus, This question asked the
respondents to identify whether they were a supervisor or
non-supervisor of other workers around them. The response
distribution and percentages are shown in Table 3.
NilitarzyCivilian Status. This question asked the
respondents whether they were military or civilian. The
military/civilian distribution is shown in Table 4.
Grade Level, This question asked the respondents to
indicate their civilian grade or military rank. This
information is shown in Table 5.
36

TABLE 3
SUPERVISOR DISTRIBUTION
Category Supervisor % Non-Supervisor %
Total** 10 15. 8% 52 82.5%
WR-ALC** 3 10% 26 86.6%
ASD 7 21.2% 26 78.8%
** One respondent did not answer this question.
TABLE 4
MILITARY/CIVILIAN DISTRIBUTION
Category Military % Civilian %
Total** 9 14.2% 53 84.1%
WR-ALC** 3 10% 26 86.6%
ASD 6 18.1% 27 81.9%
4, One respondent did not answer this question.
TABLE 5
GRADE/RANK DISTRIBUTION
Grade/Rank Total % WR-ALC % ASD %
GS-9/2Lt 4 6.4% 3 10% 1 3%
GS-11/lLt 5 7.9% 3 10% 2 6%
GS-12/Capt 29 46% 17 56.6% 12 36.4%
GS-13/Major 20 31.8% 6 20% 14 42.5%
GS-14/Lt Col/Above 5 7.9% 1 3.4% 4 12.1%
37

Length of Government Service, The respondents were
asked to indicate how many years they had performed
Government service. The results are shown in Table 6.
TABLE 6
LENGTH OF GOVERNMENT SERVICE
Time Total % WR-ALC % ASD %
< 5 Years 17 26.9% 10 33.3% 7 21.2%
5 - 10 Yr 11 17.6% 5 16.7% 6 18.2%
11 - 15 Yr 7 11.1% 4 13.3% 3 9.1%
16 - 20 Yr 6 9.5% 5 16.7% 1 3%
> 20 Yr 22 34.9% 6 20% 16 48.5%
Time in Present Organization The respondents were
asked to indicate how many years they had worked in their
present organization (defined as either ASD or WR-ALC). The
results are shown in Table 7.
TABLE 7
TIME IN PRESENT ORGANIZATION
'rime Total % WR-ALC % ASD %
< 5 Years 45 71.5% 20 66.7% 25 75.8%
5 - 10 Yr 8 12.7% 6 20% 2 6%
11 - 15 Yr 4 6.3% 3 10% 1 3%
16 - 20 Yr 2 3.2% 0 0% 2 6%
> 20 Yr 4 6.3% 1 3.3% 3 9.2%
38

Ae _Group The distribution of ages among the
respondents in the two organizations are shown in Table 8.
TABLE 8
AGE GROUP DISTRIBUTION
Age Total 96 WR-ALC 5% ASD %0
21 - 25 Yrs 3 4.8% 1 3.3% 2 6.1%
26 - 35 Yrs 25 39.7% 13 43.3% 12 36.4%
36 - 45 Yrs 11 17.4% 7 23.4% 4 12.1%
46 - 55 Yrs 18 28.6% 7 23.4% 11 33.3%
> 55 Yrs 6 9.5% 2 6.6% 4 12.1%
Formal E~ducation Respondents were requested to
indicate their highest level of formal education. The
distribution of educational degrees among the survey
respondents is shown in Table 9.
TABLE 9
FORMAL EDUCATION
Degree Total % WR-ALC % ASD %
High School 0 0% 0 0% 0 0%
Bachelor 21 33.3% 15 50% 6 18.2%
Graduate/No Degree 21 33.3% 5 16.7% 16 48.5%
Masters 21 33.3% 10 33.3% 11 33.3%
Doctorate 0 0% 0 0% 0 0%
39
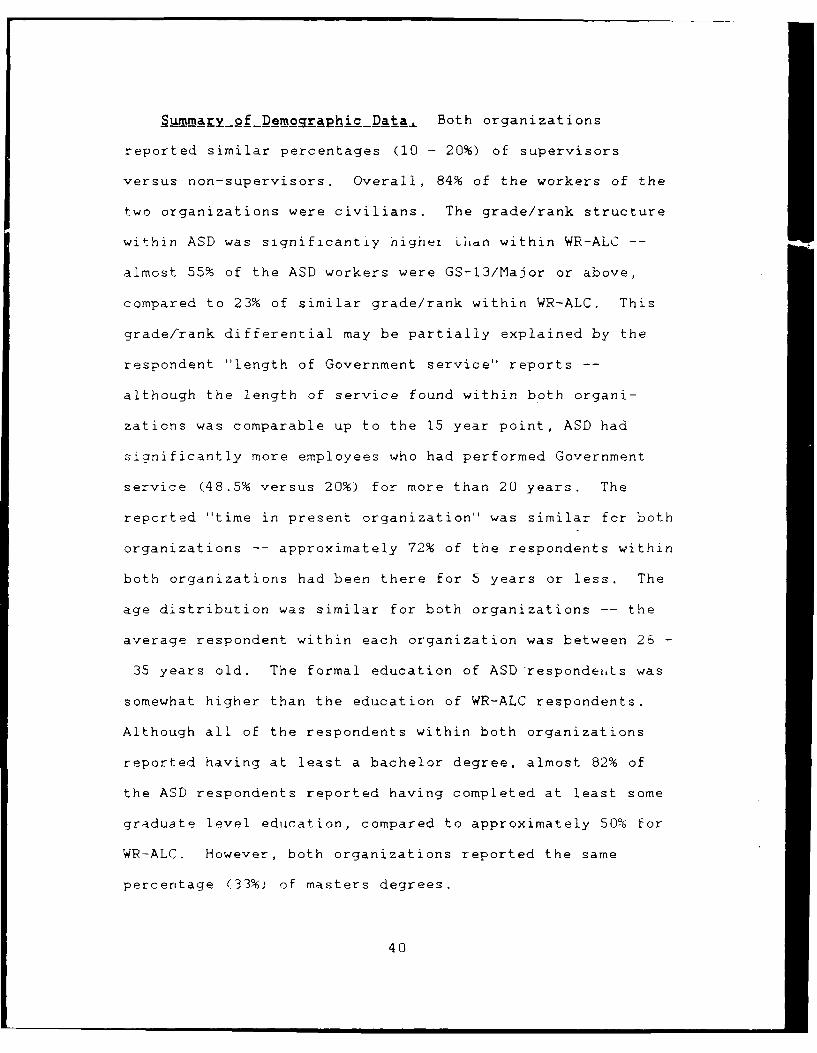
nMAryof DeroRKaphicData, Both organizations
reported similar percentages (10 - 20%) of supervisors
versus non-supervisors. Overall, 84% of the workers of the
two organizations were civilians. The grade/rank structure
within ASD was significant.y highei Liin within WR-ALC --
almost 55% of the ASD workers were GS-13/Major or above,
compared to 23% of similar grade/rank within WR-ALC. This
grade/'rank differential may be partially explained by the
respondent 'length of Government service' reports --
although the length of service found within both organi-
zations was comparable up to the 15 year point, ASD had
significantly more employees who had performed Government
service (48.5% versus 20%) for more than 20 years. The
reported 'time in present organization' was similar for both
organizations -- approximately 72% of the respondents within
both organizations had been there for 5 years or less. The
age distribution was similar for both organizations -- the
average respondent within each organization was between 26 -
35 years old. The formal education of ASD respondents was
somewhat higher than the education of WR-ALC respondents.
Although all of the respondents within both organizations
reported having at least a bachelor degree, almost 82% of
the ASD respondents reported having completed at least some
graduate level education, compared to approximately 50% for
WR-ALC. However, both organizations reported the same
percentage (33%) of masters degrees.
40
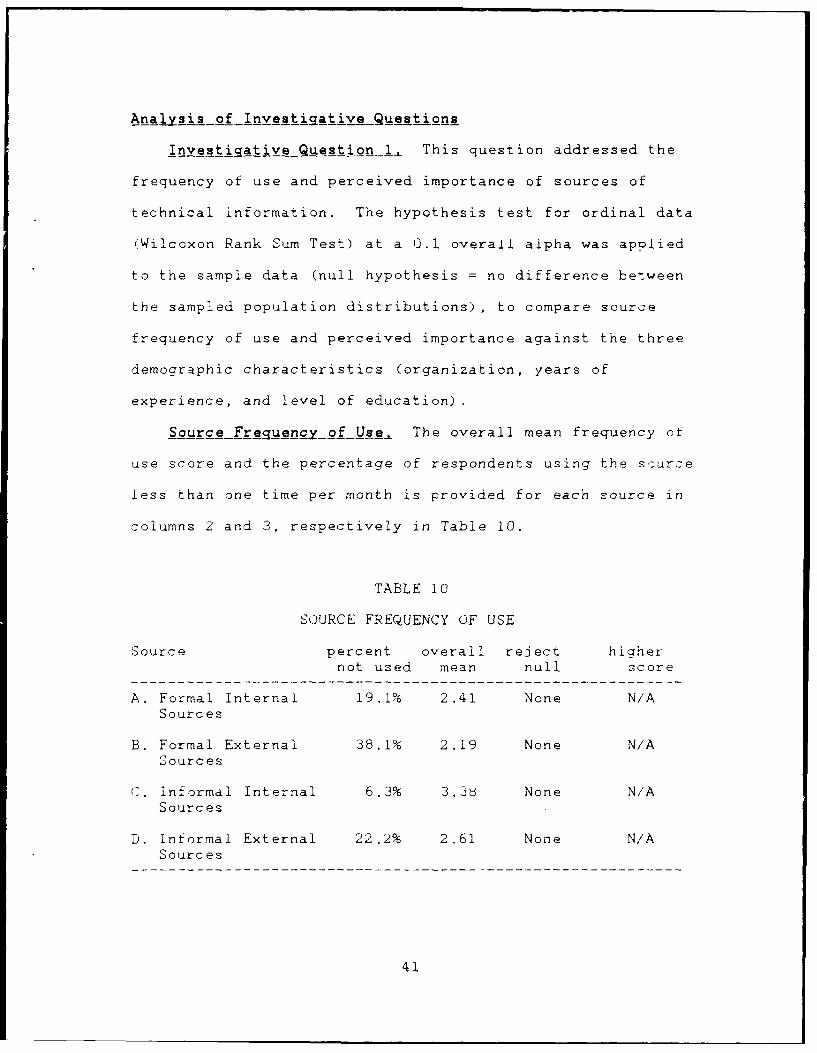
Analysis of Investigative Questions
Investigative Question l, This question addressed the
frequency of use and perceived importance of sources of
technical information. The hypothesis test for ordinal data
(Wilcoxon Rank Sum Test) at a 0.1 overall alpha was applied
to the sample data (null hypothesis = no difference between
the sampled population distributions), to compare source
frequency of use and perceived importance against the three
demographic characteristics (organization, years of
experience, and level of education).
Source Frequ enc_ of Use± The overall mean frequency of
use score and the percentage of respondents using the source
less than one time per month is provided for each source in
columns 2 and 3, respectively in Table 10.
TABLE 10
SOURCE FREQUENCY OF USE
Source percent overall reject highernot used mean null score
A. Formal Internal 19.1% 2.41 None N/ASources
B. Formal External 38.19/ 2.19 None N/ASources
C. Informal Internal 6.3% 3.3b None N/ASources
D. Informal External 22.2% 2.61 None N/ASources
41

If the hypothesis tests Indicated a significant difference
within the source frequency of use repcrted by the three
demographical profiles (ASD versus WR-ALC, 0-14 versis 15 or
more years of government experience, or undergraduate versus
qraduate level education), it is so indicated in column 4,
and the group with the higher mean score is shown in column
5 of Table 10. More detailed information including response
distributions is found in Appendix C.
The results showed that no relationships appeared Lo
exist between the three demographic groups and source
frequency of use; i.e., ASD was similar to WR-ALC, etc.
However, a wide variation seemed evident between the overall
mean frequency of use of each source. Therefore a
nonparametric analysis of variance (ANOVA) Kruskal-Wallis
test was conducted to test the null hypothesis of no
difference between the population distributions associated
with each information source. The resultant Chi-Square
statistic (51.97) and associated p-value (p < .001)
indicated that the populations were indeed statistically
different. Additional Kruskal-Wallis tests were conducted
to determine which sources were different (11:259; 1:183).
The results showed that informal internal sources are used
significantly more often than the other three sources.
Although there were no statistically significant differences
between the mean frequency of use of the other three
sources, the fact that the mean use of formal external
42
sources is lower than the others suggests that it appears to
be used the least often. These findings are consistent with
the conclusions reached by Salasin and Cedar, as noted in
chapter 2 of this paper.
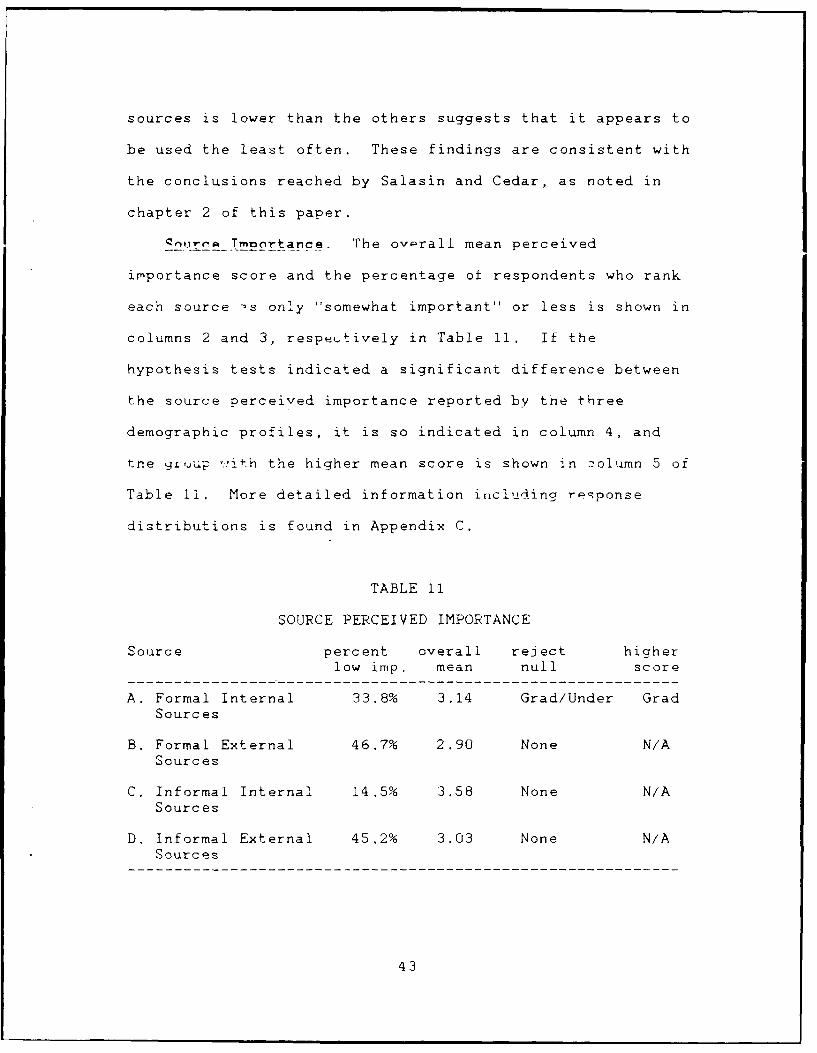
Q,,e Tmrotance. The ov-rall mean perceived
importance score and the percentage of respondents who rank
each source -s only 'somewhat important" or less is shown in
columns 2 and 3, respe'.tively in Table 11. If the
hypothesis tests indicated a significant difference between
the source perceived importance reported by the three
demographic profiles, it is so indicated in column 4, and
tne yLuup ..:ith the higher mean score is shown in column 5 of
Table 11. More detailed information including r-ponse
distributions is found in Appendix C.
TABLE 11
SOURCE PERCEIVED IMPORTANCE
Source percent overall reject higherlow imp. mean null score
A. Formal Internal 33.8% 3.14 Grad/Under GradSources
B. Formal External 46.7% 2.90 None N/ASources
C. Informal Internal 14.5% 3.58 None N/ASources
D. Informal External 45.2% 3.03 None N/ASources
43
The results indicate that significant differences exist
between the importance of formal internal sources perc(.ved
by those engineers who have completed graduate level
coursework or degrees, versus those who have undergraduate
degrees only. The higher mean score of the engineers who
have completed graduate work suggests they value formal
internal sources more than engineers who have undergraduate
degrees only. No other trends were evident within the
demographics and the perceived importance of each source.
A wide variation seemed evident between the overall mean
perceived importance of each source. Therefore a Kruskal-
Wallis test was conducted to test the null hypothesis of no
difference between the population distributions associated
with each i-formation source. The resultant Chi-Square
statistic (21.28) and associated p-value (p < 001)
indicated that the populations were indeed ;Latiztic_.l 1 y
different. Additional Kruskal-Wallis tests showed at
informal internal sources are perceived to be more important
than the other three sources. The most significant
conclusion, however, is that all external sources of
technical information appear to be of less importance than
internal sources. In addition, formal external sources --
including all types of published information, schools, and
professional associations -- are used less frequently and
are of less importance than all other sources of technical
information.
44

Gatekeeper ActivityCorn aison Wilcoxon Rank Sum Tests
(alpha = 0.05) were conducted to compare the gatekeeping
activity within the three demographic characteristics
(organization, years of service, and education). The null
hypothesis for each of the three tests was that no
difference existed between the two populations. None of the
tests resulted in rejection of the null hypothesis --
therefore the difference in gatekeeper activity between the
three demographic characteristics was not statistically
significant. More detailed information including response
distributions is found in Appendix C.
Database Use, Six WR-ALC etigineers reported usitig
automated database services. None of the ASD engineers
reported using them. Table 12 shows the frequency of
response for reasons why database services are not used.
TABLE 12
REASONS WHY DATABASE SERVICESARE NOT USED
Reason WR-ALC ASD
-- Not aware of database services 7 12
-- Not convenient 12 10
-- Does not contain informaLion 3 7relevant to my needs
-- Not applicable 7 3
45

Investigative-Question_2, This question addressed the
perceived criteria that affect access to sources of
technical information external to one's organization. Those
surveyed were asked to rate suggested information flow
criteria on a scale of "''I" (significant barrier) to ''5'
Ksiqnificant facilitator), with "3" (no effect) serving as a
neutral point. The hypothesis test for ordinal data
(Wilcoxon Rank Sum Test) at a 0.1 overall alpha was applied
to the zample data (null hypothesis = no differencc between
the sampled population distributions), to compare the
perceptions of each criterion within the three demcgraplic
characteristics (organization, years of e-Perience, and
level of education).
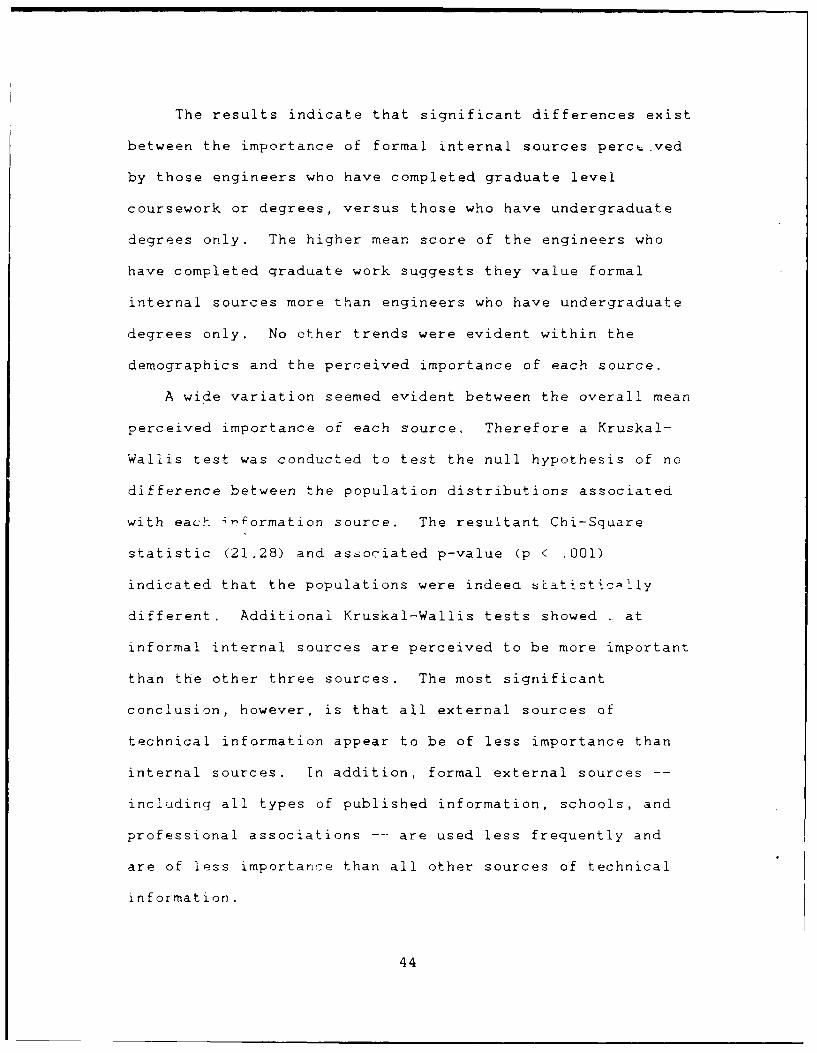
Table 13 shows the survey results. None of the criteria
were perceived as information flow facilitators -- all were
perceived as barriers. The mean perceived barrier score and
the percentage of respondents who rank each criterion as "no
effect" is shown in columns 2 and 3, respectively, in Table
13. If the hypothesis tests indicated a significant
difference within the perceptions of each criterion reported
by the three demographic profiles, it is so indicated in
column 4, and the group with the lower mean score (greater
perceived barrier) is shown in column 5. The barriers are
arranged in order of decreasing magnitude. More detailed
information including response distributions is found in
Appendix D.
46
TABLE 13
BARRIERS TO TECHNICAL COMMUNICATION
Criteria percent oveiall reject lx 'erno effect mean null zwcre
I. Time avail, to seek 25.4% 2.01 None NAinfo. outside of org.
L. Organization priorities 30.5% 2.01 None A Athat affect innovation
J. Resistance to change 32.2% 2.14 None , .4
E. Technology class. 38.7% 2.18 None N.Arestriciions (secrecy)
F. Information volume -- 38.7% 2.19 None N. Adata quant. req'd tosearch for relevant info.
D. Contractor proprietary 45.2% 3.24 None Ni Adata rights
(3. Database accessibility 40.1% 2.32 None N;A
N. Communication between 33.3% 2.36 None NIAAF and other Services
M. Communication between 38.1% 2.39 WR/ASD WRAFSC and AFLC
B. Complexity of 50.7% 2.49 None N/Ajournal literature
A. Technical jargon 42.8% 2.51 None N/Aused by other orgs
H. Incentives to innovate 49.1% 2.65 None N/A
C. Propensity to 45.0% 2.73 None N/Apublish one's results
K. Willingness to access 41.9% 2.77 None N/Aexternal sources of info
47

The only statistically significant demographic
comparison concerns the degree of technical communication
between Air Force Systems Command (AFSC) product divisions
and the Air Force Logistics Command (AFLC) Air Logistics
Centers (ALC's). The WR-ALC engineers perceived the degree
of technical communication between the two organizations to
be a greater barrier than did the engineers within ASD.
This finding is consistent with the conclusions reachea by
Colonel Grapes in his speech, as noted in chapter 1 of this
paper. No other trends were evident within the demographic
characteristics and the perceptions of each criterion.
A wide variation seemed evident between the overall mean
perception of each criterion. Therefore a Kruskal-Wallis
test was conducted to test the null hypothesis of no
difference between the population distributions associated
witn each criterion. The resultant Chi-Square statistic
(56.03) and associated p-value (p .0001) indicated that
the populations were indeed statistically different.
Additional Kruskal-Wallis tests were used to rank the
barriers in order of decreasing magnitude, as shown in Table
13 above. Although none of the criteria were considered to
be significant barriers (mean scores less than 2), the top
five criteria (i, L, J, E, and F) could be considered as
minor barriers (mean scores of 2.2 or less). Items D, G, N,
M, and B could be construed as very minor barriers (scores
from 2.2L to 2.50). The remaining four items (A, H, C, and
48
K) were clustered from 2.51 to 2.77, an indication that
these criteria were considered as insignificant barriers to
the flow of technical information from external sources into
one's organization.
Spearman Rank Correlation Tests were done to assess the
relationship between source frequency of use/importance and
the five most significant barriers (I. L, J, E, and F). A
negative, but weak (-.3811) correlation was noted between
resistance to change and the perceived importance of
informal external sources of information. No other
significant correlations were found.
InvestigativeQuestion 3, This question asked the
respondents to provide their own suggestions for
ccmmunication opportunities that would improve the flow of
technical knowledge into and within their organization. The
responses, along with the number of times each was
mentioned, are summarized below.
- improve on-line database access -- 'a terminal onevery desk' (6)
- provide office funds for purchasing technicalliterature (journals, etc.) (5)
- establish/improve tech libraries at WR-ALC (4)
- provide opportunities for schooling, seminars,training, contractor plant tours (3)
- standardize and automate the individual organizationfiling systems -- connect all organizations viacomputet for general access (3)
- hold regular office meetings to discuss applicableexisting and proposed technologies (2)
4'9
- each office have a focal point responsible formaintaining a technical database (2)
- change funding policy on AFLC engineering efforts fromO&M to project funds (1)
- educate new hires on organization's functionalcharter (1)
- contract for a government engineering publication(like Airman magazine, etc) -- why not one forengineers? (1)
- improve the ability to understand 'where to go" tocontact appropriate government office for information(organization charts, addresses) (1)
- improve management's technical competence ofengineering issues (1)
- provide training/awareness of database systems (1)
- establish and maintain formal "hands on" on-the-jobtraining (1)
- establish weekly base-wide technical briefings (TheForeign Technology Division at WP-AFB now conductsweekly intelligence briefings, including relevantinformation and points of contact for further help.)
50

V. Findings and Recommendations
Assumrtions and Limitations
Although the findings can not be statistically
generalized to groups of engineers other than those surveyed
in this research, the findings can be used logically to
predict similar technical communication behavior elsewhere.
An important limitation is to recognize that since this
was exploratory, ex post facto research and not an
experiment, this study does not purport to show causality.
In particular, it cannot be said that the use or non-use of
certain sources of technical information causes some
engineers to perceive technical communication barriers
differently than other engineers.
KeyFindingqs
The key findings resulting from this research were:
I. No differences were found within each of the three
demographic characteristics (organization, years of federal
experience, and educational degree) and the frequency of use
of each of the four sources. There were, however,
significant differences between the overall frequency of use
of the four sources. Engineers in this research were found
to use informal internal sources (oral discussion with
others within one's organization) to obtain technicdl
information significantly more often than any other source.
51

Informal internal sources were also found to be
perceived as more important than than any other source.
This could be due to the "law of least effort" expressed by
Gerstberger and Allen (20:277) , which states that people are
more likely to choose an information source based on ease of
use than on the amount or quality of expected information.
Indeed, it is generally easier to ask someone in one's own
organization for a problem solution than it is to ask people
from other organizations or attempt to research literature.
2. Engineers who had completed graduate coursework
perceived formal internal information sources to be more
important than did engineers who had undergraduate degrees
only. A possible reason may be due to the positive, weak
correlation (0.3429) found between the engineers' rank/grade
level and their highest level of formal education.
Engineers in the higher grades are probably more responsible
for developing and implementing items such as in-house
technical reports or statements of work, and may also have
greater access to formal program reviews/meetings, than do
engineers in the lower grades.
3. Formal external sources (documents or journals
published from sources outside one's organization, schools.
and professional associations) were found to be used less
frequently and of less importance than all other sources of
information. The low reported frequency of use appears to
be consistent with the "law of least effort'' phenomenon
52
noted in finding #1 above. However, the low perceived
importance of formal external sources is surprising. One
would expect that these sources would represent the most
credible, valid information available, due to the supporting
research and exhaustive professional peer review that must
support much published technical information. The concept
of regularly valuing the oral opinion of one's peers within
one's organization over all published technical information
sources seems risky indeed.
4. No significant differences were found between the
reported gatekeeping activities of the Warner Robins Air
Logistics Center (WR-ALC) engineers versus those of the
Aeronautical Systems Division (ASD) engineers. This finding
was unexpected. The researcher had thought the ASD
engineers, owing to their overall charter of new system
development, would demonstrate significantly higher
gatekeeping behavior than the WR-ALC engineers. In
addition, the researcher had believed the proximity, amount
and variety of local industry and universities to Wright-
Patterson AFB would serve to enhance ASD gatekeeping
activity. Perhaps the limited technical library
availability at WR-ALC may require engineers there to
actively engage in gatekeeping behavior.
5. Database use -- a formal, external source -- was
reported by 20% of the WR-ALC engineers. None of the ASD
engineers reported using database services. A reasonable
53
explanation for this disparity may involve the greater ASD
accessibility to technical libraries, including the Wright
Research and Development Center library and the Air Force
Institute of Technology library at Wright-Patterson AFB as
noted in finding #4 above.
The two most frequently reported reasons for not using
database services were 1) the fact that database services
were not perceived to be convenient (36%) , and 2) a lack of
awareness of database services (31%). These findings are
consistent with the results obtained by Hubbard and Zacardo
in their research of DTIC use by the Army (24:77). This
researcher's only complaint about DTIC convenience concerns
the amount of time required for receipt of paper and
microtiche copies of DTIC reports. Efforts by DTIC and
technical library personnel to train prospective users about
use of the DROLS (Defense RDT&E On-Line System) should help
to reduce the time delays for document receipt.
Since the DTIC database system is designated as 'the
central focus for the (DoD) scientific and technical
information program' (50:65), it should follow that more
should be done to improve widespread awareness of DTIC and
its available services, such as DTIC's DROLS and Current
Awareness Bibliography (CAB) programs.
6. The two most significant perceived barriers that
impede technical communication with sources outside one's
organization were a) a lack of time to seek information
54
outside the organization, and b) organi:ational priorities
that discourage innovation, such as a lack of support for
facilities or personnel dedicated to gathering and
disseminating technical information. Several WR-ALC
engineers reported that the limited technical libraries
available made it difficult for them to obtain technical
information. Another WR-ALC engineer noted that proposed
funding for improved systems does not compete well against
funding for normal replacement or repair.
Both ASD and WR-ALC engineers urged that formal,
designated technical positions be established within their
organizations to gather and disseminate technical
information.
Three other barriers, although less significant, were ::
resistance to change, d) secrecy, and e) the perception that
+-he sheer volume of information available is too great to
effectively search for relevant information.
Resistance to change is a barrier that often appears in
research directed at the problems of technology diffusion,
and is difficult to eliminate. The negative, but weak
correlation between resistance to change and the perceived
importance of informal, external sources of information
(dialogue with contractors, peers from other organizations.
and professional society contacts) suggests that as
resistance to change increases, the perceived importance of
informal external information sources decreases. The weak
55
correlation value indicates that it may or may not be
meaningful. Further research is necessary to verify whether
a correlation actually exists.
Secrecy is a deliberate barrier that is necessary in the
interests of national security, and probably should not be
eliminated. The 'too much information' barrier can be
relatively easily reduced by encouraging more widespread use
of database bibliography services such as those provided by
DTIC.
7. The WR-ALC engineers perceived that a lack ot
technical communication between AFLC and AFSC was a barrier.
The ASD engineers did not share this view. They perceived
that the existing level of communication is satisfactory.
However, Col Grapes (HQ AFLC) argues that the identification
of system maintenance requirements to AFSC engineers is
"insufficient and not timely' (2:27). He also urges that
AFLC engineers enhance their technical knowledge through
increased interaction with the personnel and expertise from
the Air Force Wright Research and Development Center.
Recent Congressional and DoD interest in system
maintainability and associated life cycle costs may
indirectly help to improve AFSC/AFLC technical
communication. In addition, Defense Secretary Cheney's
efforts to streamline weapon system acquisition and
management may result in a major restructure of Air Force
weapon system acquisition and logistical support (10:14).
C; r
The results of his efforts and the associated impacL is yet
to be
8. The five most frequently mentioned suggestions for
improving the flow of technical knowledge into one's
organization were directly related to improving access to
formal external information sources. These suggestions
included improving on-line database access, allocating funds
to procure technical literature, establishing/improving
technical libraries at air logistics centers, providing
opportunities for training and tours, and standardizing,
automating and connecting individual organization filing
systems for general access.
Comparison of Findings with Creighton-Jolly Model
The Creighton-Jolly model (discussed in chapter 2)
contained a list of intrinsic and extrinsic factors that can
affect information flow. None of the extrinsic factors
(capacity, gatekeepers, source credibility, rewards, and
willingness 'o accept change) were perceived by the
respondents to be barriers to technical communication. A
comparison of each intrinsic factor with the results of this
research is shown below.
Documentation. Documentation -- the ways that
information is defined, organized and presented -- appeared
not to signif. antly impede information flow. Secrecy was
the only one of five potential documentation survey criteria
that ranked as one of the top five barriers. Three other
57
documentation criteria, including the complexity of journal
literature, technical jargon used by other organizations,
and the propensity of engineers to publish their results,
scored in the bottom five, and thus were not considered as
barriers. [However, the perception of what is or is not a
barrier depends on one's perspective. DTIC research
indicates that a lack of publication activity is a
continuing problem (15; 24)].
Distribution. Distribution refers to the channels
through which information flows. Distribution-related
factors appeared to be perceived as barriers to technical
communication. Two distribution criteria -- a lack of time
available to seek sources outside of one's organization, and
the sheer volume of information that must be processed to
obtain relevant information -- ranked in the top five
barriers. The reported lack of use of database services was
surprising, considering the barriers mentioned above. An
increased use of automated databases, particularly database
bibliographies and abstracts, would help one to quickly
attain relevant information. However, to realize the
maximum potential of databases, engineers must be willing to
report their findings to, as well as extract information
from these services. DTIC's problems in obtaining technical
information are well documented, as noted abcve.
The high rate of personnel rotation reported by the
respondents should positively impact information distribu-
58
tion. However, the sample data did not indicate the extent
of the job transfers -- whether they were primarily within
one geographic location (and associated organizations), or
between a variety of locations.
Most of the suggestions for improving technical
communication centered on distribution factors such as
automated database access and opportunities for training.
Qrganization. Organization-related criteria were
perceived as two of the top five barriers to communication
flow. These included resistance to change and priorities
that affect innovation. These barriers seem to appear in
study after study (3; 24; 30; 39), and may indeed prove to
be the most difficult to eliminate.
Conclusion
Past research shows that one of the greatest barriers to
the diffusion of technology is a simple lack of awareness
that a technology exists, or knowledge of its risks and
benefits. If the Air Force is to improve the quality of its
fielded weapon systems within the constrained budgets
currently available, it must capitalize on mature, proven
technologies as much as possible. A principal method of
ensuring secondary use of mature technologies is to diffuse
awareness of the technologies by encouraging technical
communication with sources external to one's organization.
To achieve this end, this author recommends the following
steps be taken:
59
1. Recommend that efforts be conducted to increase the
awdreness and use of automated database services such as
DTIC. A general awareness and use of database services
would help eliminate the barriers of 'too much information '
and lack of time to seek information from external sources.
These efforts could be shared by technical library
personnel, DTIC, and engineering management. An improved
awareness may help to reduce the perceptions of a lack of
convenience of database access.
2. Recommend that engineers be encouraged to document
and publish their technical achievements. Potential
inducements could include peer recognition and encouragement
of the presentation of papers at technical society meetings
and DoD symposiums.
3. Recommend that engineers meet periodically with
their peers from other organizations to exchange technical
information. These meetings could provide a forum to
diffuse awareness of contractor and Government innovations
or methods that improve product performance and quality.
4. Recommend that communication with formal and
informal technical sources external to one's organization be
encouraged as much as possible. This encouragement could
occur in the form of budgets for training and technical
journals, and allowance of time for attendance at short
courses, seminars, and functions like the Blue-Two program
sponsored by AFCOLP.
60
This research, however, showed that a curious dichotomy
seems to exist between the respondents' emphasis on
suggestions for improving access to formal external sources,
in relation to their lack of use of and relatively low
importance they place on these same sources. A shortcoming
of this research is that it did not address why formal
external sources are not perceived to be important. Greater
access to formal external sources may or may nct cause them
to be used more frequently and perceived as more important.
Therefore this author recommends that efforts that enhance
access to formal external sources (such as the establishment
o; libraries or funding allocations for purchasing technical
literature) be conducted cautiously.
Suggestions for Further Research
1. Recommend that this study be repeated next year to
verify the reliability of the results of this research.
2. Recommend this research be expanded to cover a
larger sample size, to extend the generalization of this
research to all defense systems engineers. Tnis larger
sample should include engineers affiliated with nonprofit
defense engineering support corporations, such as MITRE
(Lexington MA) or the Aerospace Corporation (Los Angeles
CA).
3. Recommend that the research conducted by Allen et
al. (5) on the effect of technical inforit,,tion requirements
61

as a function of program timing be applied to a defense
system procurement setting.
4. Recommend that research be conducted to assess how
the amount and content of current MIL-STDs and other
specification standards are perceived to affect defense
engineers' capacity for innovativeness and propensity to
seek better ways to design and manufacture weapon systems.
5. Recommend that efforts be conducted to integrate
existing technical communication survey instruments into a
standard tool with proven reliability and validity.
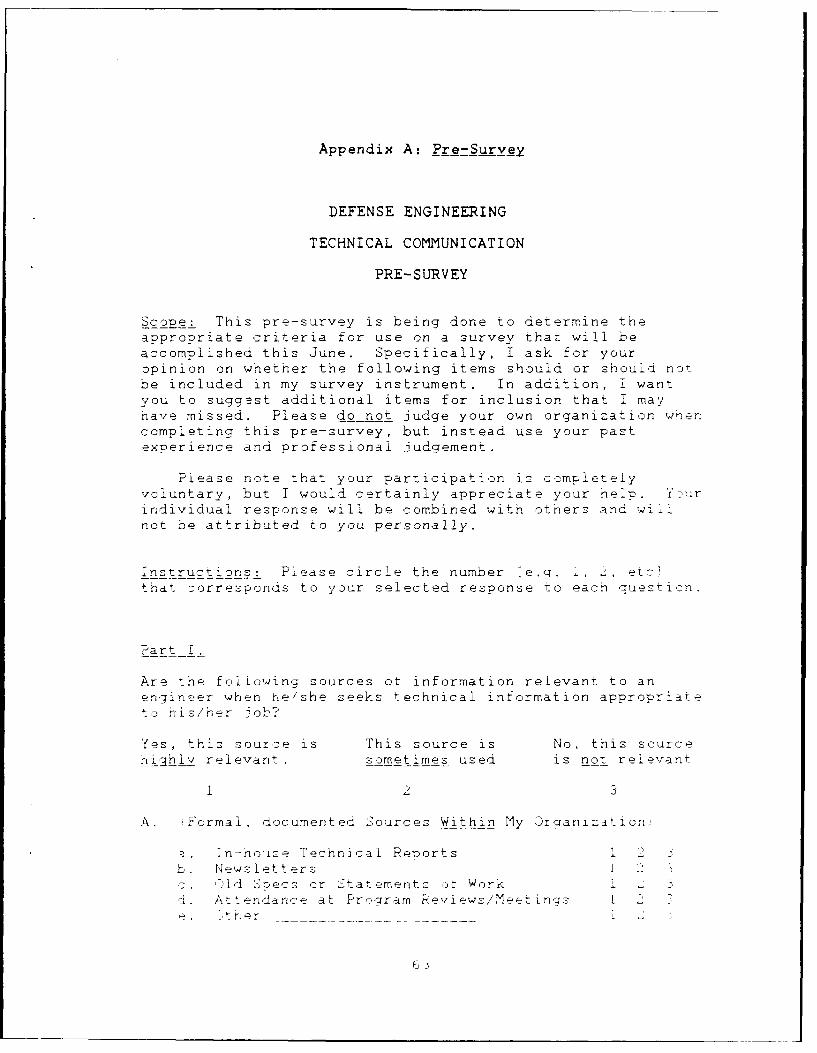
Appendix A: Pre-Survey
DEFENSE ENGINEERING
TECHNICAL COMMUNICATION
PRE-SURVEY
Scope: This pre-survey is being done to determine theappropriate criteria for use on a survey that will beaccomplished this June. Specifically, I ask for youropinion on whether the following items should or shouli notbe included in my survey instrument. In addition, i wantyou to suggest additional items for inclusion that I mayhave missed. Please do not judge your own organization wnencompleting this pre-survey, but instead use your pastexperience and professional judgement.
Please note that your participation is completelyvoluntary, but I would certainly appreciate your help. Y,?urindividual response will be combined with others and wiilnot be attributed to you personally.
instructions: Please circle the number [e.q. 1, -1, etc!that corresponds to your selected response to each question.
Part I.
Are the following sources of information relevant to anengineer when he/she seeks technical information appropriatetJ his/her job?
Yes, this source is This source is No, this sourcehligh>_ relevant, sometimes used is not relevant
A. (Formal, documented Sources Within My Organization,
a. In-house Technical Reports I ib. Newsletters I
-1d Specs or Statements of Work i J0. Attendance at Prcram Reviews/Meet inos i
e . ' th e r L :

Part I (Continued)
Yes, this source is This source is No, this sourcehighly relevant, sometimes used is not relevant
1 2 3
_. rrria±, documented Sources External to My Organization)
a. Government Technical Reports/Mil-Stds 1h. Technical Journals/Periodicals 1 -c. Attendance at Technical Seminars 1 3d. Text Books/Specialized Technical Books i 3e. Schools/Training 1 2f. Contractor Reports 1g. Other i
C. (informal, Personal Contacts Within My Organiza:icn.,
a. Informal Technical Meetings ib. Dialogue with Associates, Colleagruesc. Dialogue with Supervisord. tOther 1 3
D. (Informal. Personal Contacts External to MyOrgani zat ion)
a. Informal Technical Meetings 1 2b. Dialogue with Associates, Colleagues 2c. Professional Society Contacts 1 2 3d. Dialogue with Contractors i 2
e. Other 1 2
Do you have suggestions for any additional sources ofinformation that should be included in the survey'.
64

Part I Criteria that Affect Communication Flow
in this part 'm attempting to identify criteria that mayaffect the flow of technical information between '.1, neerincorganizations. in other words, do the following criteriareresenr items i should ask in my questionnaire: 7 youfeel that any criterion is confusing or should be re-worqeu.n any way, reel free to indicate chanqes[ Please use -stale shown below to indicate your estimate of the relevanrcyor each criterion to communication flow:
,riterion niniy Criterion moderately Criteri in no:relevant to tech- relevant to technica± relevant tonical information information flow information :mw,4f i ow
a. Ability to Understand TechnicalJargon used by other Or.canizations
Ability to ComprehendProfessional Journal Literature
*. ocumen:ation - Likelihood of Writinq iAbout Technical Accomplishments
tontractor Proprietaryata P iqhts
." ec:nn o ioay
assiticatio-n Restrict{ ons
information Volume --
Time Required to Search forReievan P iformation
aT uatacase ervicesEase of ise
n. ewars or Incentives
Aviiability of Time to Seeknformation Outside of urganization
ance to t-hanqe
K. Nit inrlz s toAces- ,
.xt Ar.i,M i: [n--Ine s jr

Part II IContinued)
Criterion hiqhly Criterion moderately Criterion niotrelevant to tech- relevant to technizal relevant tonical information information flow information flowflow
1 2 3
1. Organization priorities i .2 3that Affect innovation
m. Communication between AFSC IProduct Divisions and AFLC ALC's
n. Communication between AF Product i 2 3Divisions and other Services (Navy.Army, etc)
o. Other (Please Explain) ............. . 3
Do you have suqestions for any additional criteria tna-may have misse,.
Thank you for your help!

Appendix B: Survey
USAF SCN 89-32DEFENSE ENGINEERING
TECHNICAL COMMUNICATION
SURVEY
Backqround: The Air Force Coordinating Office for LogisticsResearch (AFCOLR) is sponsoring AFIT research into themethods of technical communication used by engineers whenseeking to maintain "state-of-the-Art' knowledge in theirdiscipline areas.
Purpose: To identify technical communication barriers andfacilitators, as perceived by selected Air Force SystemsCommand And Air Force Logistics Command engineers, thataffect the diffusion of mature (empirically proven)technologies from external sources into their organizations.The results of this research will be basic inputs to apublished Air Force Institute of Technology, School ofSystems and Logistics, student thesis.
Scope: This survey will ask how selected engineers obtainand disseminate technical information, and will request theengineers to rate their perceptions of proposed criteriathat affect technical communication. A census of engineersfrcm organizations selected from AFSC and AFLC will berequested to fill out the attached survey.
Instructions: The survey is composed of four parts. ForPart I, please circle the number [e.g. (1), (2), etc] thatcorresponds to the correct answer to each question. Pleasenote that your 'organization" is defined as either an AirLogistics Center (ALC) or a Product Division. For example,if you are an AFSC engineer, then you work for a specificProduct Division. Product Divisions at other bases andother organizations (laboratories, test wings, etc) wouldconstitute separate organizations. AFLC ALC's would followa similar concept. Please retain this definition whencompleting each part of the survey.
For Parts II, III, and IV, please follow theinstructions provided at the beginning of each section.
67
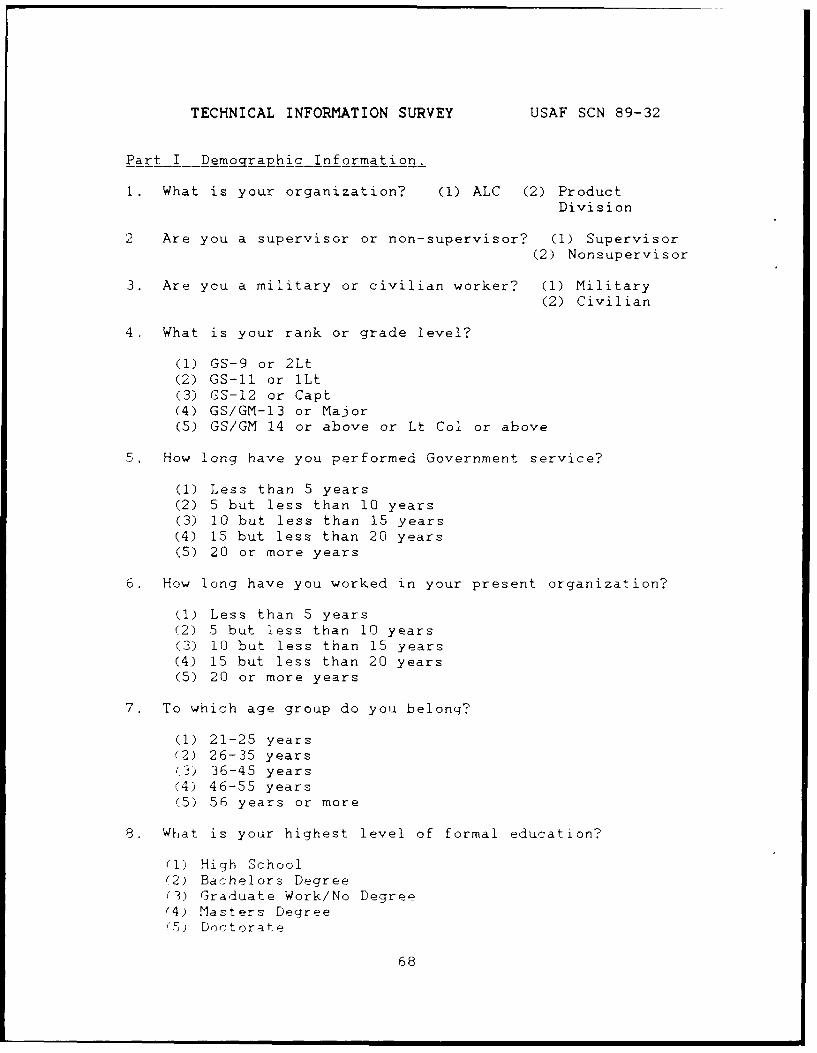
TECHNICAL INFORMATION SURVEY USAF SCN 89-32
Part I Demoqraphic Information.
1. What is your organization? (1) ALC (2) ProductDivision
2 Are you a supervisor or non-supervisor? (1) Supervisor(2) Nonsupervisor
3. Are you a military or civilian worker? (1) Military(2) Civilian
4. What is your rank or grade level?
(1) GS-9 or 2Lt(2) GS-11 or iLt(3) GS-12 or Capt(4) GS/GM-13 or Major(5) GS/GM 14 or above or Lt Col or above
5. How long have you performed Government service?
(1) Less than 5 years(2) 5 but less than 10 years(3) 10 but less than 15 years(4) 15 but less than 20 years(5) 20 or more years
6. How long have you worked in your present organization?
(1) Less than 5 years(2) 5 but less than 10 years(3) 10 but less than 15 years(4) 15 but less than 20 years(5) 20 or more years
7. To which age group do you belong?
(1) 21-25 years(2) 26-35 years(3) 36-45 years(4) 46-55 years(5) 56 years or more
8. What is your highest level of formal education?
(1) High School(2) Bachelors Degree(3) Graduate Work/No Degree(4) Masters Degree(5) Doctorate
68
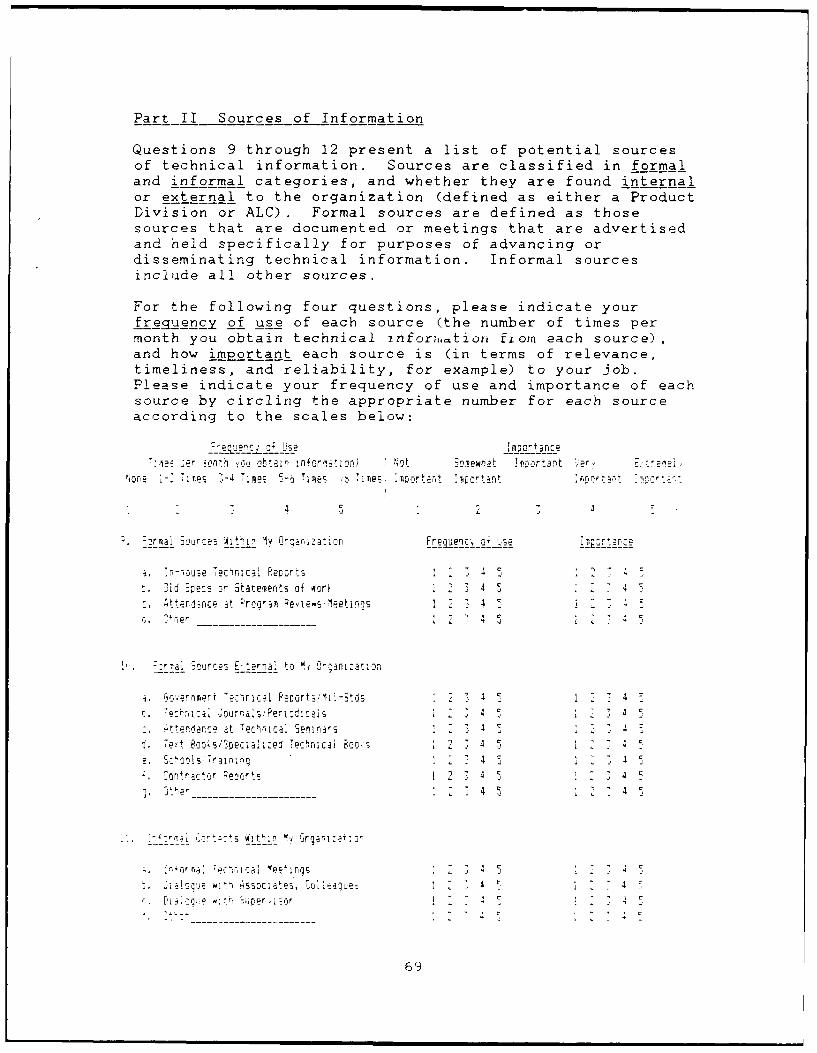
Part II Sources of Information
Questions 9 through 12 present a list of potential sourcesof technical information. Sources are classified in formaland informal categories, and whether they are found internalor external to the organization (defined as either a ProductDivision or ALC). Formal sources are defined as thosesources that are documented or meetings that are advertisedand held specifically for purposes of advancing ordisseminating technical information. Informal sourcesinclude all other sources.
For the following four questions, please indicate yourfrequency of use of each source (the number of times permonth you obtain technical infor,.tion from each source),and how important each source is (in terms of relevance,timeliness, and reliability, for example) to your job.Please indicate your frequency of use and importance of eachsource by circling the appropriate number for each sourceaccording to the scales below:
-:-e r e r lth f, tan nformtion} Not Somewnat !Tnortant .
4- Times 5-a Times Ce t '; r.
. or'ai Sn~rcea Within My Organization Fre2uencv 04 'Js ir2 rtant2
, .- houre iechncal Reports 4 5 Er -
31d SpeCs or Statements oi 4or 2 4 5 - 4
:3ttefnce at FroQram evipek .lpetinqs 1 4F,3tier 5
- - - - - - - - J, C
- t S £ A 4-(. :C:,ai Sources Eprnal to M. Or anizatlon
a. }oernment Te:hnicrai Peportsi~' l-Stds - 4 1 4 =r, . e ,rj, iournr.s.eriodicais - ac, ttendance at Technzcrai Se~aas - 4 C 2 " -
d. Text Eoo* s/3peciadiea Technicai Booi~ - C 5 C_
e. 5coos, Tr4ailinQ 4 5 1 4 5
z Contractor Peports A 4 C _, . 4 7 4 5
I "7p~mf Po :sSec l i ze Tp r~n ics Poo c r
~-. -- -- ~ ? . ," ' - --- - .- ------- C
, .<J ... • . -'
H' rSo r 2 -s' 4 C4
- - - - - - --- - - - - - 7
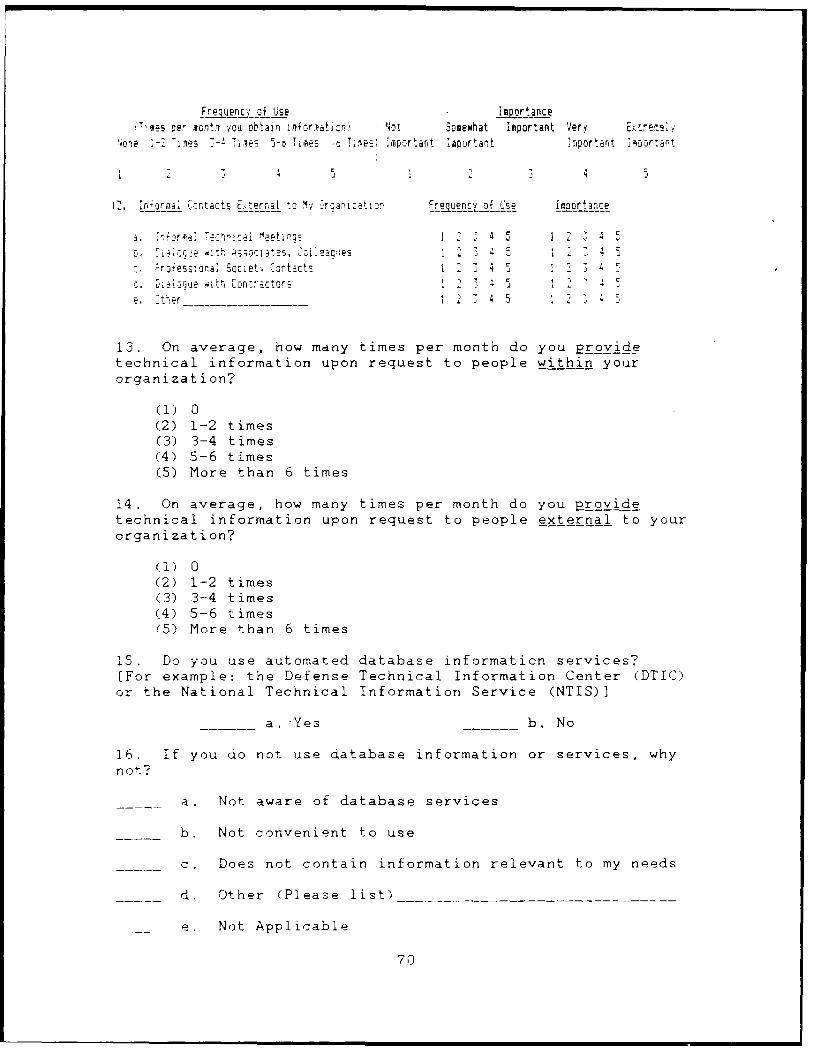
Frequency Oi Use Ifiar Ln eA -5 p~er 4ontn you ob'ain jncor..aflon) ~ 3o omewhat important Very Etei
I- Il : "-A 7 4E 1- Tme -,.qe IT @p5 r po Tp r n ~
4,4
-, -ro~ess51or,,A Societv r-.trtc a ~D 1a i ue W . on 7 1t 0r~ S
13. On average, how many times per month do You rovidetechnical information upon request to people with in yourorganization?
(1) 0(2) 1-2 times(3) 3-4 times(4) 5-6 times(5) More than 6 times
14. On average, how many times per month do you Rrovidetechnical information upon request to people external to yourorganization?
( 1) 0(2) 1-2 times(3) 3-4 times(4) 5-6 tlimes(5) Mlore than 6 times
15. Do you use automated database information services?[For example: the Defense Technical Information Center (DTIC)or the National Technical Information Service (NTIS)l
a.-Yes _b. No
16, If you do not use database information or services, why
not? a. Not aware of database services
b. Not convenient to use
___c. Does not contain information relevant to my needs
__d. Other (Please list)
e. Not Applicable
70
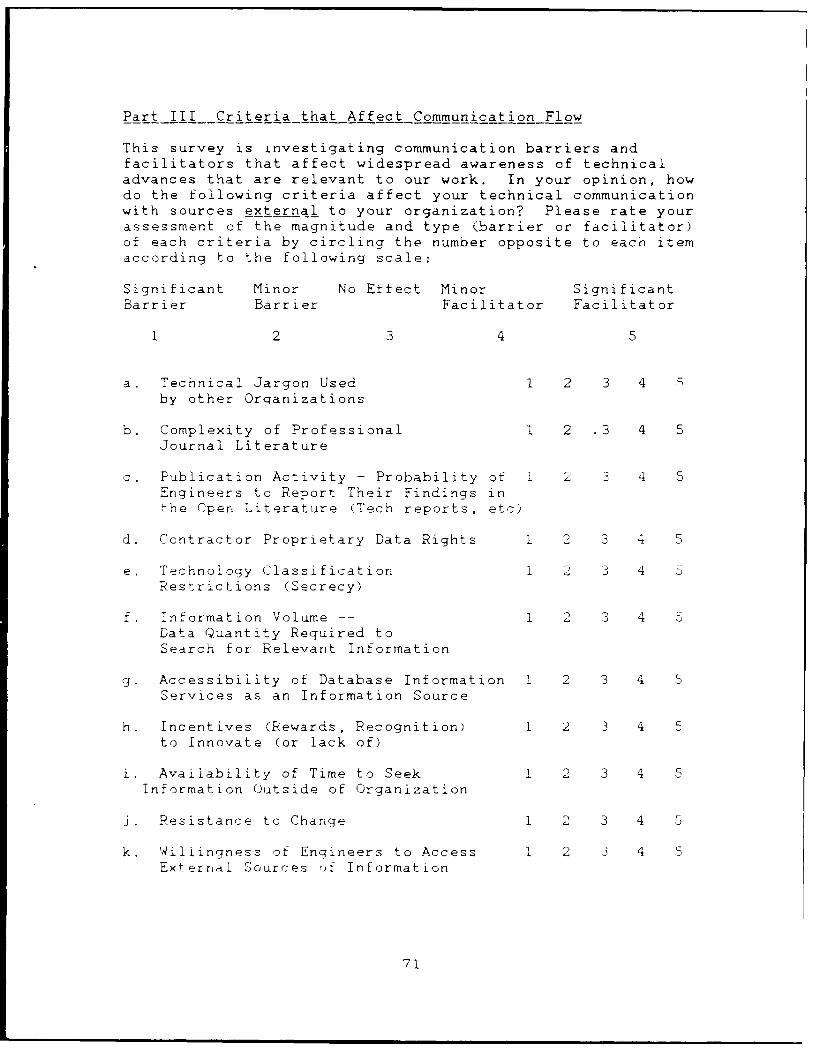
Part III Criteria that Affect Communication Flow
This survey is investigating communication barriers andfacilitators that affect widespread awareness of technicaladvances that are relevant to our work. In your opinion, howdo the following criteria affect your technical communicationwith sources external to your organization? Please rate yourassessment of the magnitude and type (barrier or facilitator)of each criteria by circling the number opposite to each itemaccording to the following scale:
Significant Minor No Effect Minor SignificantBarrier Barrier Facilitator Facilitator
12 3 4 5
a. Technical Jargon Used 1 2 3 4 C
by other Organizations
b. Complexity of Professional 1 2 .3 4 5Journal Literature
c. Publication Activity - Probability of 1 2 35Engineers to Report Their Findings inthe Cpen Literature (Tech reports, etc)
d. Contractor Proprietary Data Rights 1 2 3 4 5
e. Technology Classification 1 2 3 4 5Restrictions (Secrecy)
f. information Volume -- 1 2 3 5Data Quantity Required toSearch for Relevant Information
g. Accessibility of Database Information 1 2 3 4 5Services as an Information Source
h. Incentives (Rewards, Recognition) 1 2 3 4 Eto Innovate (or lack of)
i. Availability of Time to Seek 1 2 3 4 5Information Outside of Organization
j. Resistance to Change 1 2 3 4 5
k. Willingness of Engineers to Access 1 2 3 4 5External Sources of Information
71
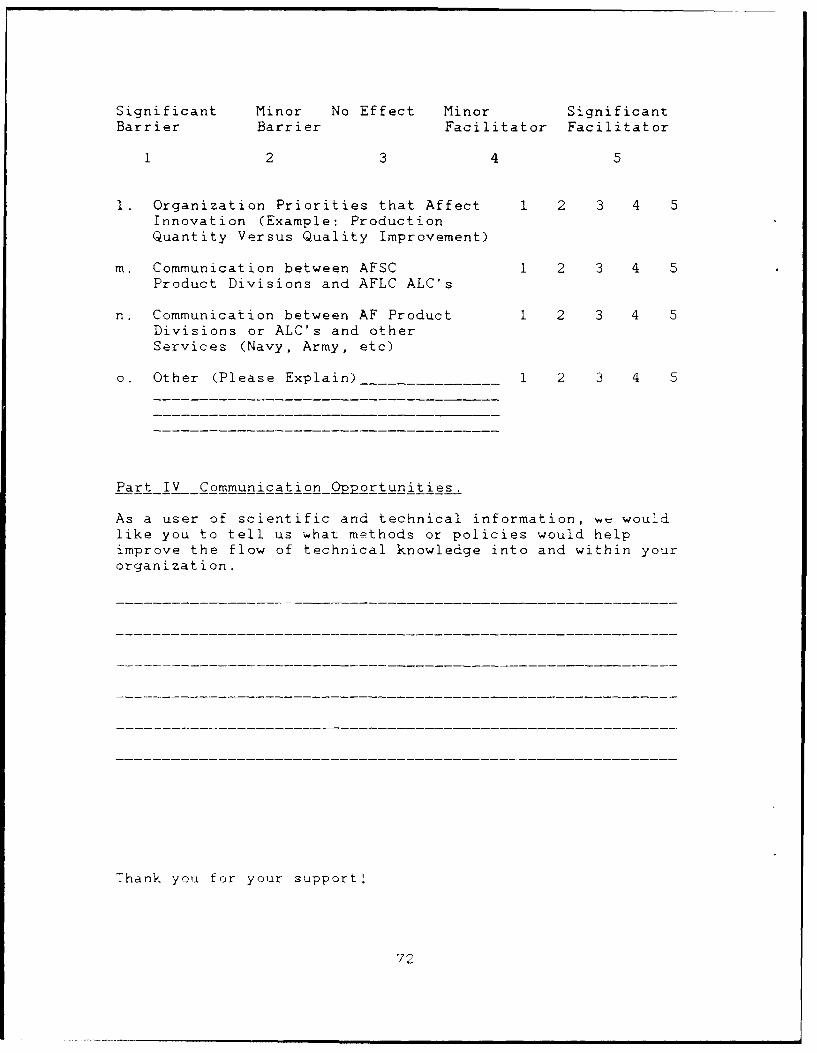
Significant Minor No Effect Minor SignificantBarrier Barrier Facilitator Facilitator
2 3 4 5
1. Organization Priorities that Affect 1 2 3 4 5Innovation (Example: ProductionQuantity Versus Quality Improvement)
m. Communication between AFSC 1 2 3 4 5Product Divisions and AFLC ALC's
n. Communication between AF Product 1 2 3 4 5Divisions or ALC's and otherServices (Navy, Army, etc)
0. Other (Please Explain) 1 2 3 4 5
Part IV Communication _Op ortunities.
As a user of scientific and technical information, wt wouldlike you to tell us what methods or policies would helpimprove the flow of technical knowledge into and within yourorganization.
Thank you for your support!
72
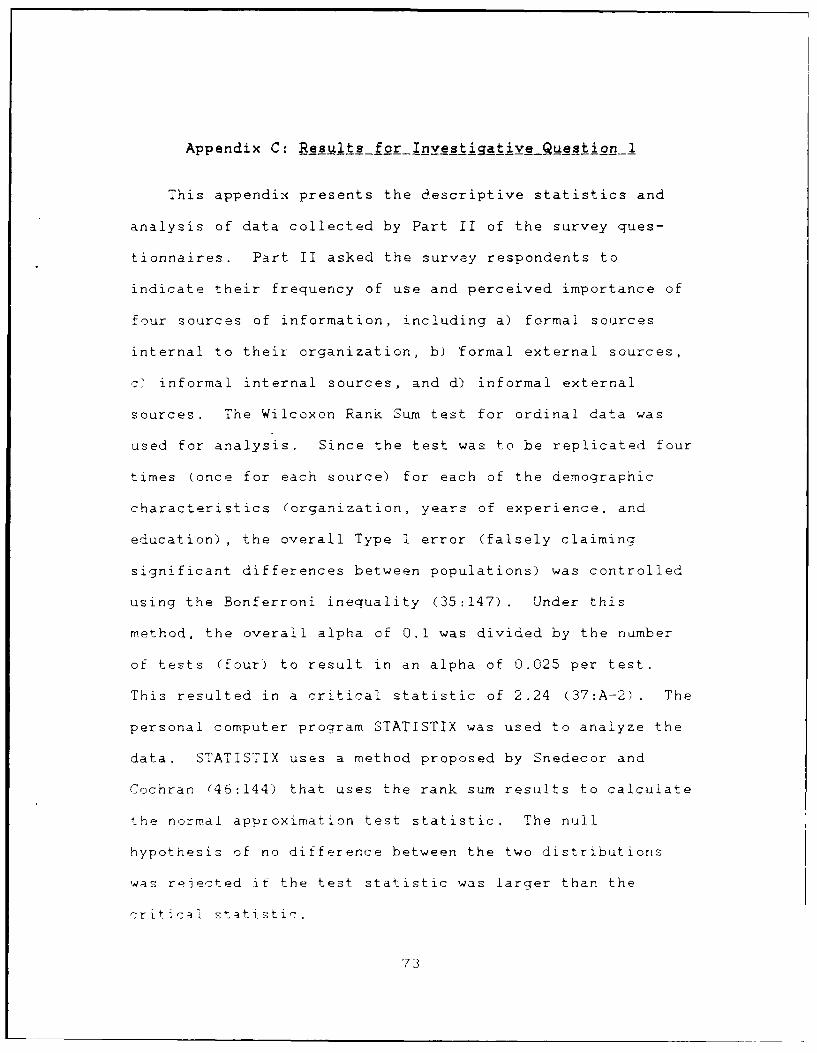
Appendix C: Results for Investigative Question 1
This appendix presents the descriptive statistics and
analysis of data collected by Part II of the survey ques-
tionnaires. Part II asked the survey respondents to
indicate their frequency of use and perceived importance of
four sources of information, including a) formal sources
internal to their organization, b) formal external sources,
c) informal internal sources, and d) informal external
sources. The Wilcoxon Rank Sum test for ordinal data was
used for analysis. Since the test was to be replicated four
times (once for each source) for each of the demographic
characteristics (organization, years of experience, and
education), the overall Type I error (falsely claiming
significant differences between populations) was controlled
using the Bonferroni inequality (35:147). Under this
method, the overall alpha of 0.1 was divided by the number
of tests (four) to result in an alpha of 0.025 per test.
This resulted in a critical statistic of 2.24 (37:A-2) . The
personal computer program STATISTIX was used to analyze the
data. STATISTIX uses a method proposed by Snedecor and
Cochran (46:144) that uses the rank sum results to calculate
the normal approximation test statistic. The null
hypothesis of no difference between the two distributions
was rejected if the test statistic was larqer than the
critical statistic.
73
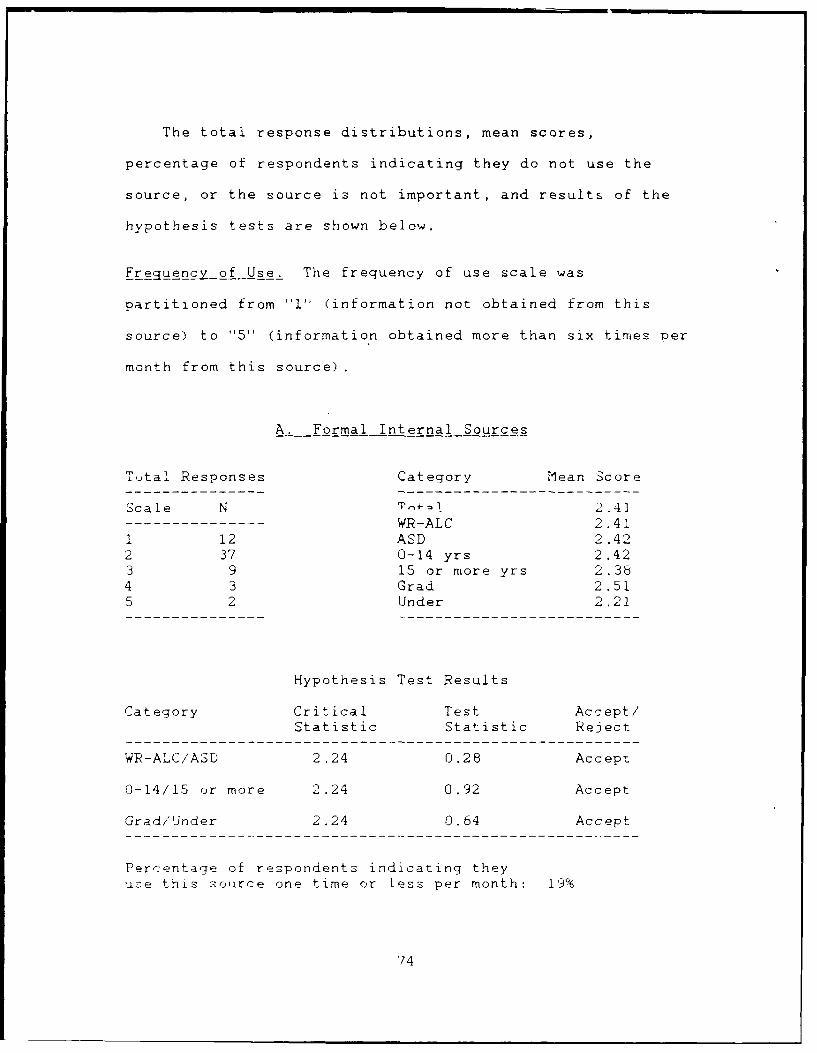
The total response distributions, mean scores,
percentage of respondents indicating they do not use the
source, or the source is not important, and results of the
hypothesis tests are shown below.
Freuencyof-Use. The frequency of use scale was
partitioned from 1i' (information not obtained from this
source) to "5" (information obtained more than six times per
month from this source).
A. Formal Internal Sources
Ttal Responses Category Mean Score
Scale N To* ! 2.4]WR-ALC 2.41
1 12 ASD 2.422 37 0-14 yrs 2.423 9 15 or more yrs 2. 384 3 Grad 2.515 2 Under 2.21
Hypothesis Test Results
Category Critical Test Accept/Statistic Statistic Reject
WR-ALC/ASD 2.24 0.28 Accept
0-14/15 or more 2.24 0.92 Accept
Grad/Under 2.24 0.64 Accept
Percentage of respondents indicating theyuse this source one time or less per month: 19%
7 4
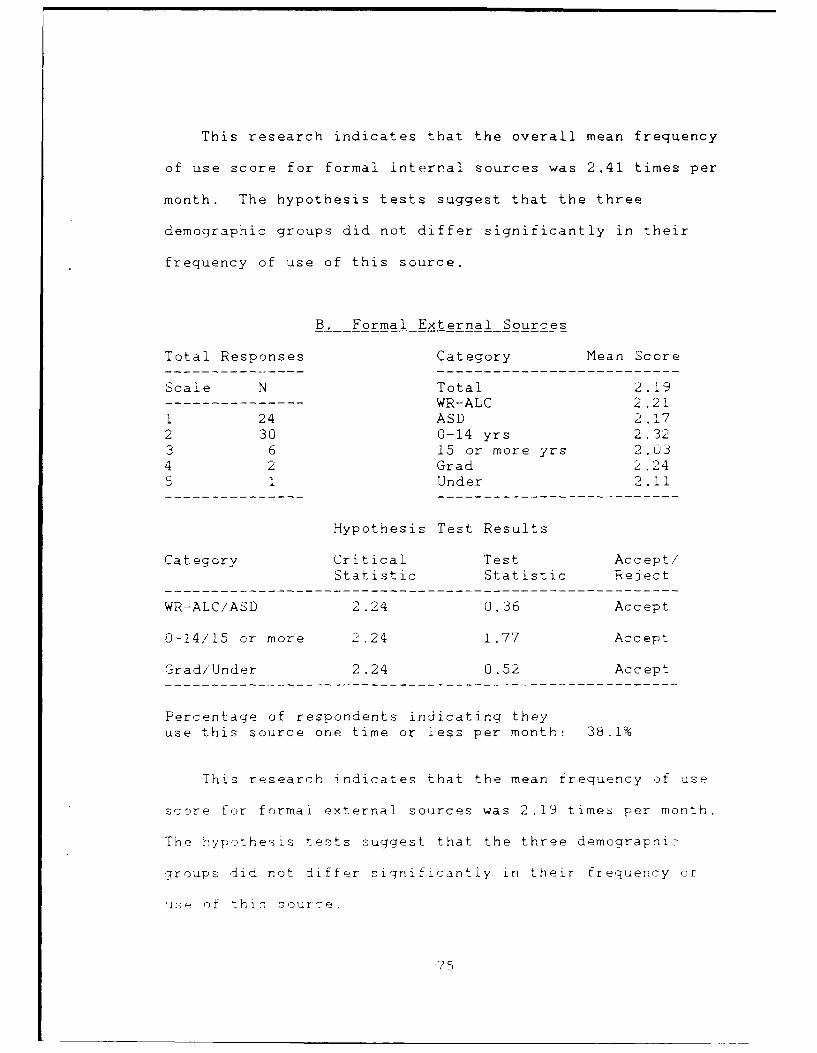
This research indicates that the overall mean frequency
of use score for formal internal sources was 2.41 times per
month. The hypothesis tests suggest that the three
demographic groups did not differ significantly in their
frequency of use of this source.
B. Formal External Sources
Total Responses Category Mean Score
Scale N Total 2.19WR-ALC 2.21
1 24 ASD 2.172 30 0-14 yrs 2.323 6 15 or more yrs 2.034 2 Grad 2.245 1 Under 2.11
Hypothesis Test Results
Category Critical Test Accept/Statistic Statistic Reject
WR-ALC/ASD 2.24 0.36 Accept
0-14/15 or more 2.24 1.77 Accept
Grad/Under 2.24 0.52 Accept
Percentage of respondents indicating theyuse this source one time or less per month: 38.1%
This research indicates that the mean frequency of use
score for formal external sources was 2.19 time6 per month.
The hypothesis tests suggest that the three demographic
groups did not differ significantly in their frequency ot
ose of this source.
5
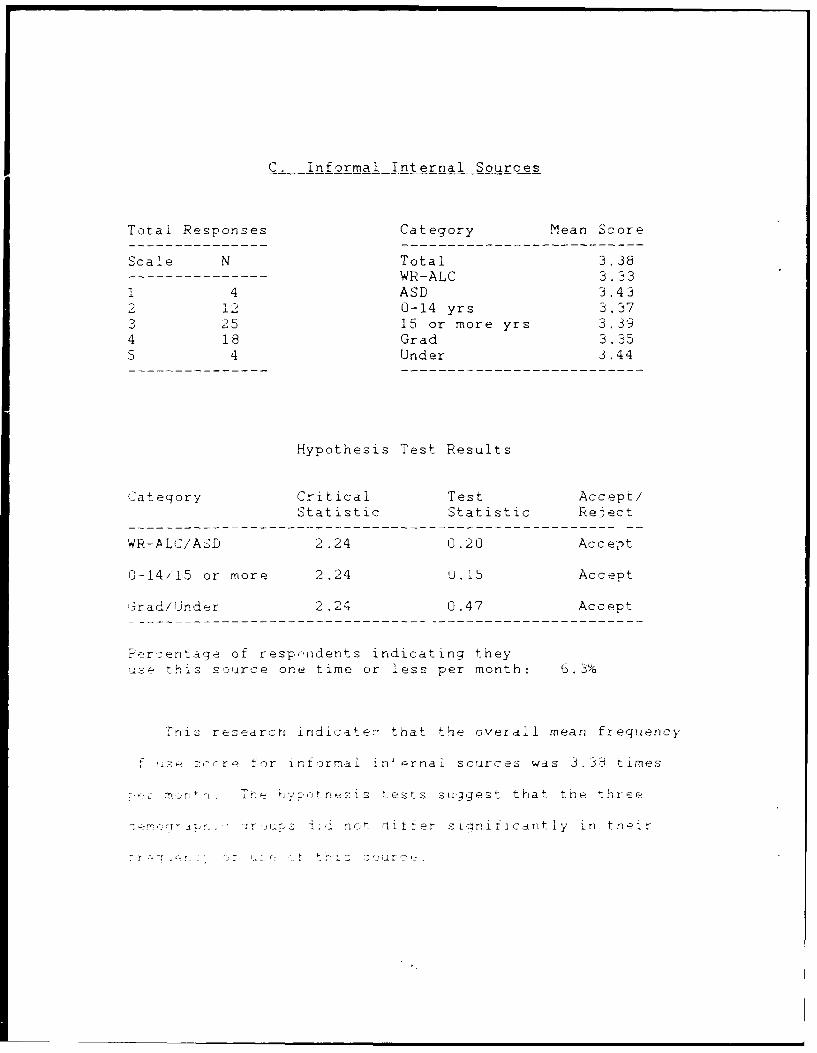
C. Informal Internal Sources
Total Responses Category Mean Score
Scale N Total 3.38WR-ALC 3.33
1 4 ASD 3.432 12 0-14 yrs 3.373 25 15 or more yrs 3.394 18 Grad 3.355 4 Under 3.44
Hypothesis Test Results
Category Critical Test Accept/Statistic Statistic Reject
WR-ALC/ASD 2.24 0.20 Accept
0-14/15 or more 2.24 0.15 Accept
'ad/Inder 2.2 0.47 Accept
Perrentage of respondents indicating they-se this source one time or less per month: 6.3%
This researchi indicate that the overall mean frequency
ru score for informal inernal scurces was 3.3,'- times
. oe_ ~v.otrsIs ests suggest that the three
h -r.u.,s r.s not liter significantly in tneir
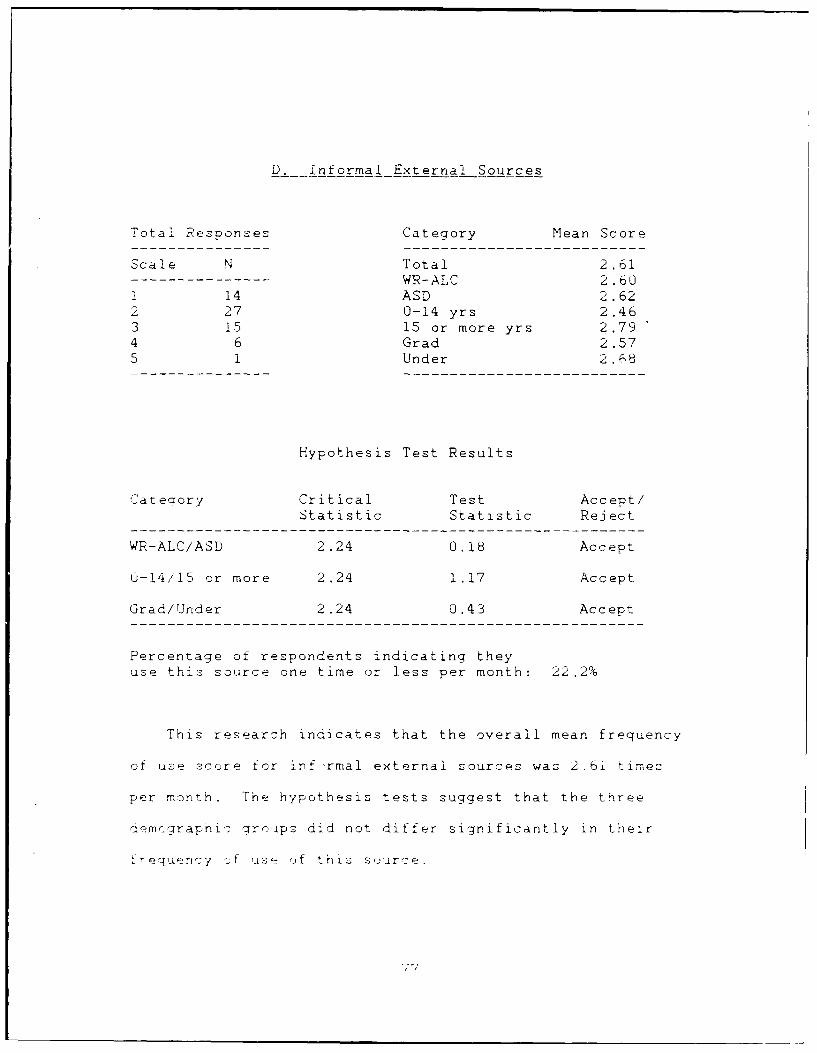
D9. informal External Sources
Total Responses Category Mean Score
Scale N Total 2.61WR-ALC 2 .60
1 14 ASD 2.622 27 0-14 yrs 2.463 15 15 or more yrs 2.794 6 Grad 2.575 1 Under 2.,8
Hypothesis Test Results
Category Critical Test Accept/
Statistic Statistic Reject
WR-ALC/ASD 2 .24 0.18 Accept
0-14/15 or more 2.24 1.17 Accept
Grad/Under 2.24 0.43 Accept
Percentage of respondents indicating theyuse this source one time or less per month: 22.2%
This research indicates that the overall mean frequency
of use score for infrmal external sources was 2.6i times
per month. The hypothesis tests suggest that the three
demographic grnups did not differ significantly in their
_requency of use of this source.
7 ;
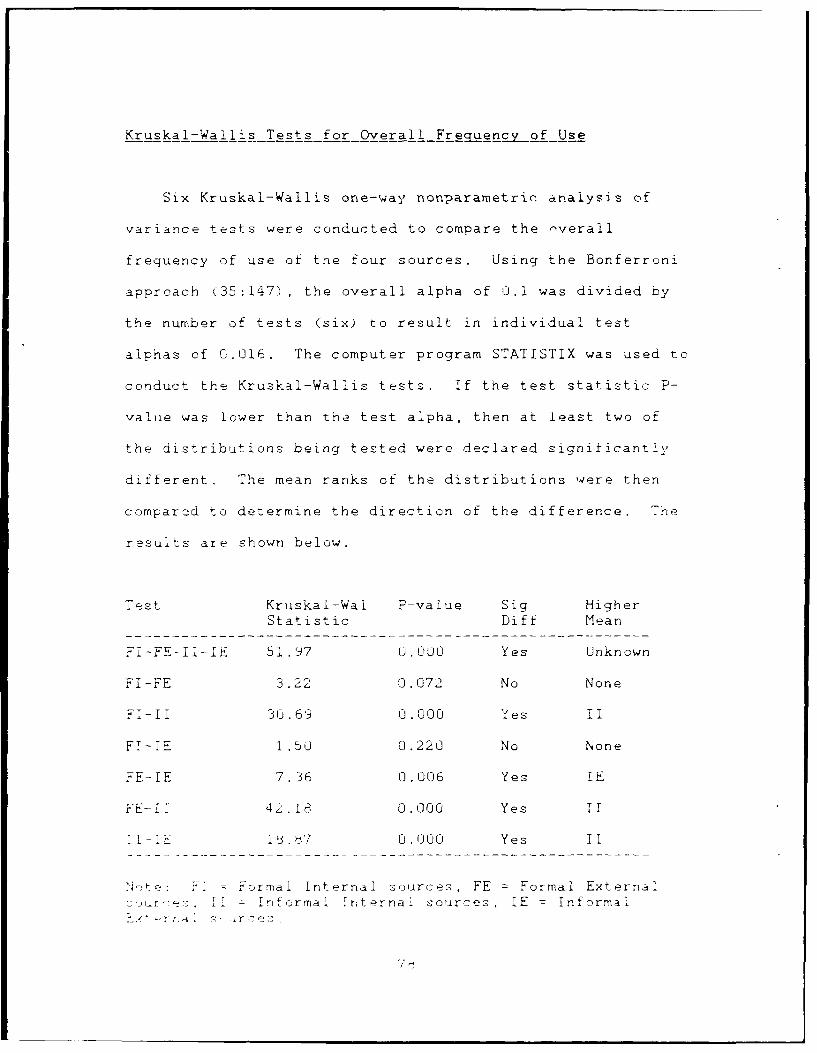
Kruskal-Wallis Tests for Overall Fregjuenc__ of Use
Six Kruskal-Wallis one-way nonparametrin analysis of
variance tests were conducted to compare the -verall
frequency of use of the four sources. Using the Bonferroni
approach (35:147) , the overall alpha of 0.1 was divided by
the number of tests (six) to result in individual test
alphas of 0.016. The computer program STATISTIX was used to
conduct the Kruskal-Wallis tests. If the test statistic P-
value was lower than the test alpha, then at least two of
the distributions being tested were declared significantly
different. The mean ranks of the distributions were then
compared to determine the direction of the difference. The
results are shown below.
Test Kruskal-Wal P-value Sig HigherStatistic Diff Mean
FI-FE-II-IE 51.97 0.000 Yes Unknown
FI-FE 3.22 0.072 No None
FI-lI 30.69 0.000 Yes II
F!-1E 1.5u 0.220 No None
FE-IE 7,36 0.006 Yes IE
FE-TT 42IR 0.000 Yes II
!I-LE 19.d7 0.000 Yes II
Note: F! n Formal internal sources, FE = Formal External,ur,-vz, 11 - informal internaIl ources. IE = Informal

Source Perceived Importance. The perceived importance scale
was partitioned from "1" (source is not important) to "5"
(source is extremely important).
A. Formal Internal Sources
Total Responses Category Mean Score
Scale N Total 3.14WR-ALC 2 .94
1 4 ASD 3.342 17 0-14 yrs 3.163 30 15 or more yrs 3.124 9 Grad 3.325 2 Under 2.82
Hypothesis Test Results
Category Critical Test Accept/Statistic Statistic Reject
WR-ALC/ASD 2.24 2.17 Accept
0-14/15 or more 2.24 0.25 Accept
Grad/Under 2.24 2.23 Reject
Percentage of respondents indicating they perceivethis source as less *ln "somewhat important": 33.8%
This researc, . icates that the overall mean perceived
irportpnce score for formal internal sources was 3.14
(slightly higher than "important"). The hypothesis tests
suggest that persons who have completed graduate coursework
value formal internal sources differently than their
undergraduate counterparts. The mean graduate score was
one-half point hiqher than the mean underqraduate score.
Y q
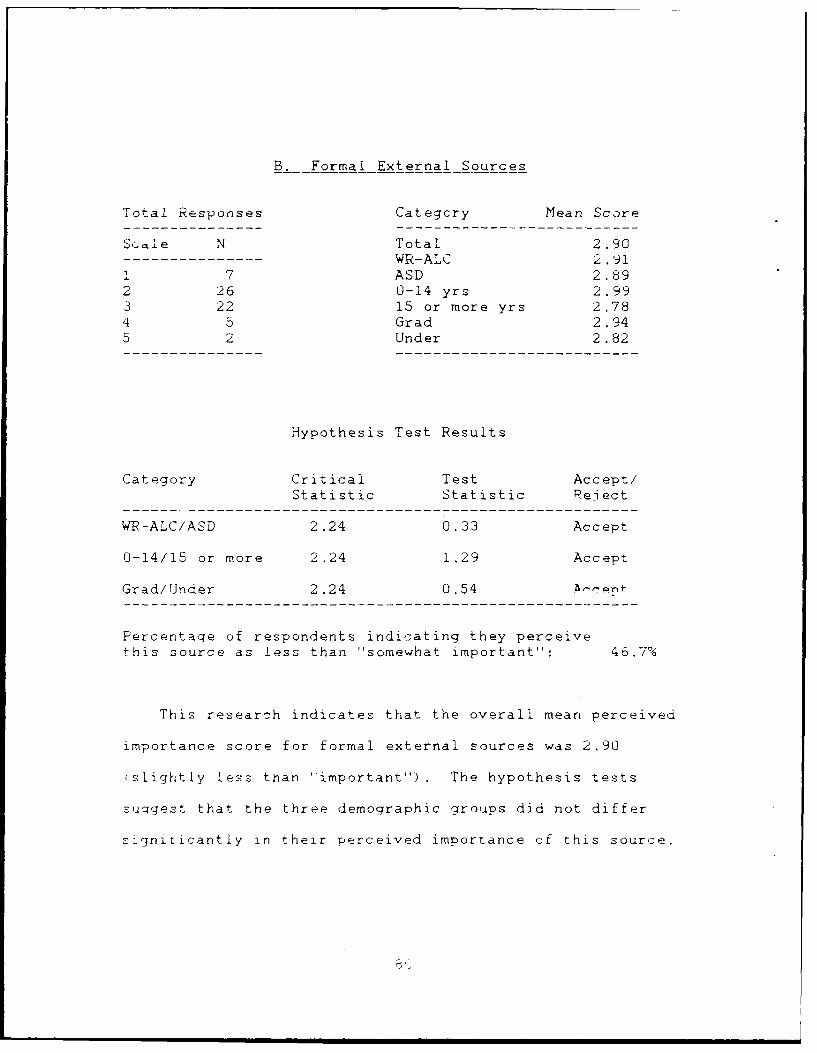
B. Formal External Sources
Total Responses Categcry Mean Scare
S ,ie N Total 2.90WR-ALC 2 .91
1 7 ASD 2.892 26 0-14 yrs 2.993 22 15 or more yrs 2.784 5 Grad 2.945 2 Under 2.82
Hypothesis Test Results
Category Critical Test Accept/Statistic Statistic Reject
WR-ALC/ASD 2.24 0.33 Accept
0-14/15 or more 2.24 1.29 Accept
Grad/Under 2.24 0.54 A-7 er+
Percentaqe of respondents indicating they perceivethis source as less than "somewhat important'': 46.7%
This research indicates that the overall mean perceived
importance score for formal external sources was 2.90
(slightly less than ''important"). The hypothesis tests
suggest that the three demographic groups did not differ
significantly in their perceived importance of this source.
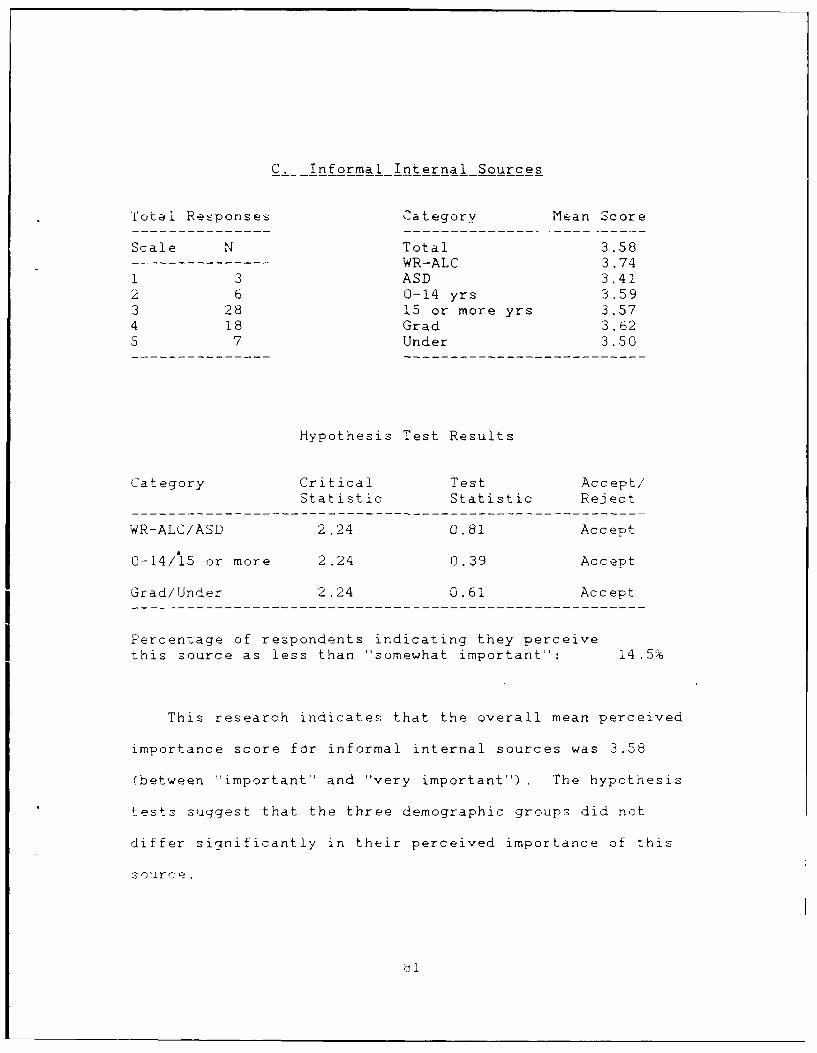
C. Informal Internal Sources
Total Responses Category Mean Score
Scale N Total 3.58-- -- WR-ALC 3.74
1 3 ASD 3.412 6 0-14 yrs 3.593 28 15 or more yrs 3.574 18 Grad 3.625 7 Under 3.50
Hypothesis Test Results
Category Critical Test Accept/Statistic Statistic Reject
WR-ALC/ASD 2.24 0.81 Accept
0-14/15 or more 2.24 0.39 Accept
Grad/Under 2.24 0.61 Accept
Percentage of respondents indicating they perceive
this source as less than ''somewhat important': 14.5%
This research indicates that the overall mean perceived
importance score for informal internal sources was 3.58
(between "important '' and 'very important''). The hypothesis
tests suggest that the three demographic groups did not
differ significantly in their perceived importance of this
source.
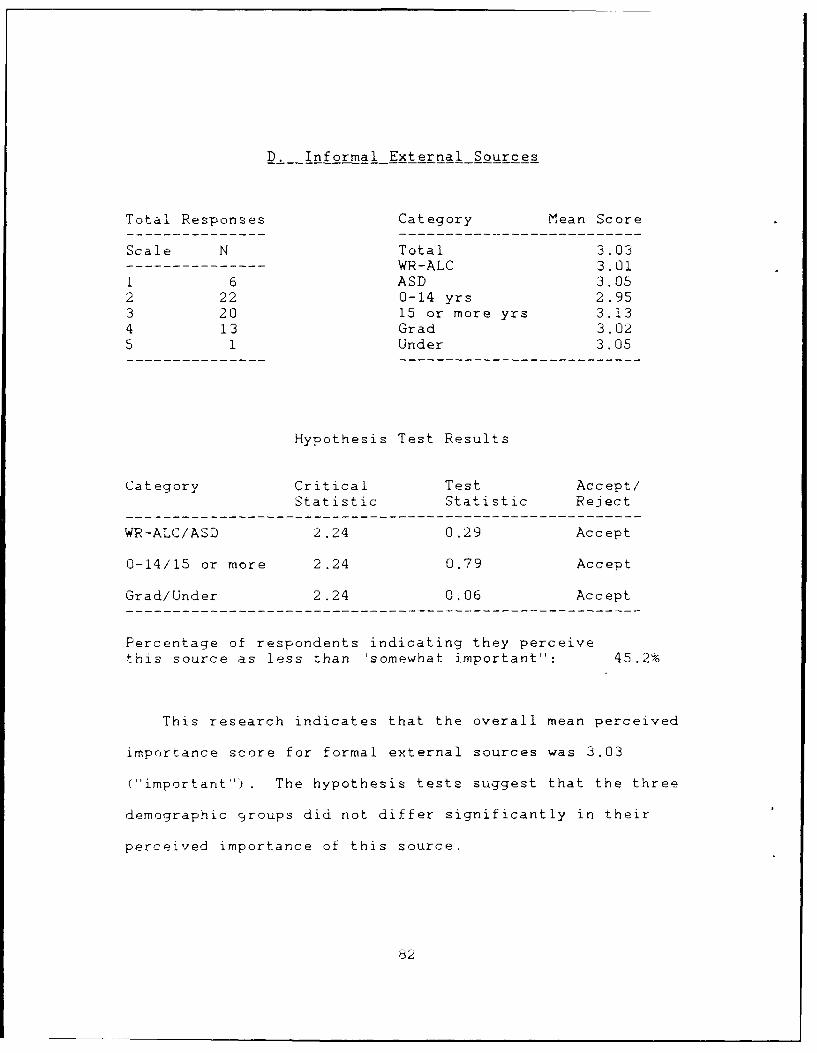
D. Informal External Sources
Total Responses Category Mean Score
Scale N Total 3.03WR-ALC 3.01
1 6 ASD 3.052 22 0-14 yrs 2.953 20 15 or more yrs 3.134 13 Grad 3.025 1 Under 3.05
Hypothesis Test Results
Category Critical Test Accept/Statistic Statistic Reject
WR-ALC/ASD 2.24 0.29 Accept
0-14/15 or more 2.24 0.79 Accept
Grad/Under 2.24 0.06 Accept
Percentage of respondents indicating they perceivethis source as less than 'somewhat important': 45.2%
This research indicates that the overall mean perceived
importance score for formal external sources was 3.03
("important'). The hypothesis tests suggest that the three
demographic groups did not differ significantly in their
perceived importance of this source.
82
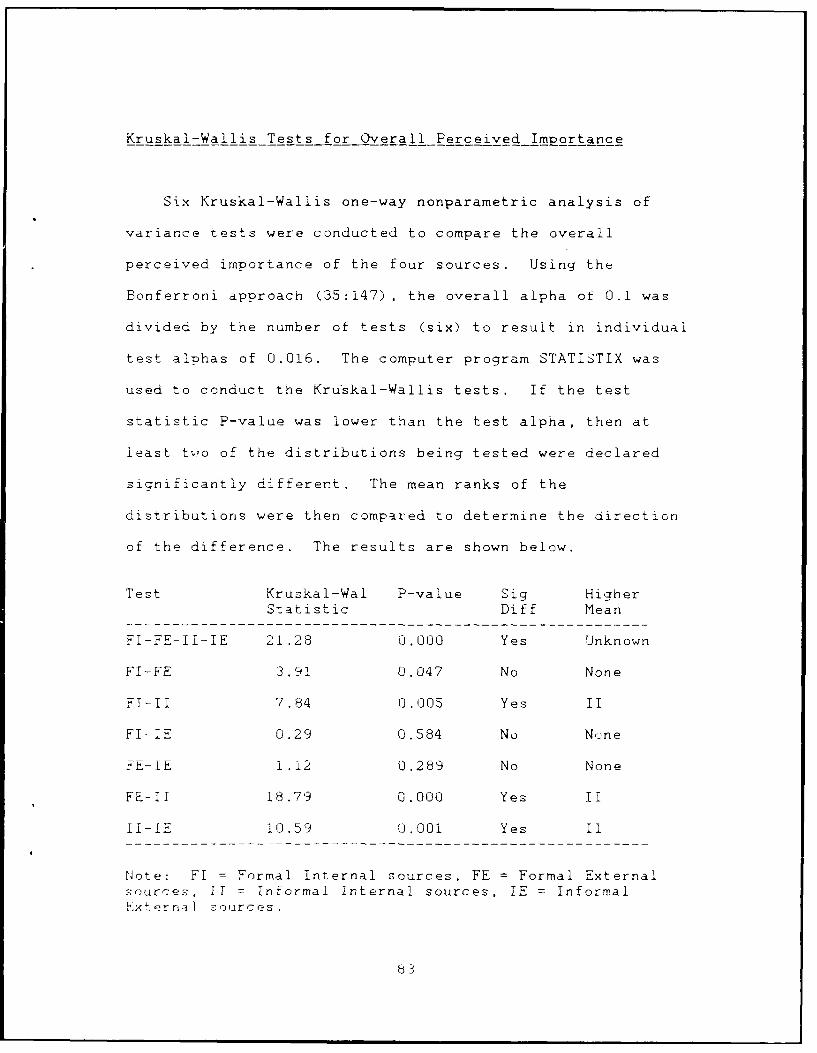
Kruskal-Wallis Tests for Overall Perceived Importance
Six Kruskal-Wallis one-way nonparametric analysis of
variance tests were conducted to compare the overall
perceived importance of the four sources. Using the
Bonferroni approach (35:147), the overall alpha of 0.1 was
divided by the number of tests (six) to result in individual
test alphas of 0.016. The computer program STATISTIX was
used to conduct the Kru'skal-Wallis tests. If the test
statistic P-value was lower than the test alpha, then at
least two of the distributions being tested were declared
significantly different. The mean ranks of the
distributions were then compared to determine the direction
of the difference. The results are shown below.
Test Kruskal-Wal P-value Sig HigherStatistic Diff Mean
FI-FE-Il-IE 21.28 0.000 Yes Unknown
FI-FE 3.91 0,047 No None
FI-I1 7.84 0.005 Yes II
FI- E 0.29 0.584 No None
FE-iE 1.12 0.289 No None
FE-II 18.79 0.000 Yes II
Il-IE 10.59 0.001 Yes II
Note: FI = Formal Internal sources, FE = Formal Externalsources, II = Informal Internal sources, IE = InformalExterna1 Durces
b3

Gatekeeper Activ i t
Gatekeeper activity was a construct variable formed by
averaging the responses to survey questions 10.b., 12, 13,
and 14. The frequency of occurrence scale ranged from ""
(no gatekeeping activity) , to "5" (gatekeeping activity more
than six times per month).
Total Responses Category Mean Score
Scale N fotal 3.00--------------- WR-ALC 3.111 5 ASD 2.882 22 0-14 yrs 2.883 32 15 or more yrs 3.154 3 Grad 2.945 0 Under 3.14
Hypothesis Test Results
Category Critical Test Accept/Statistic Statistic Reject
WR-ALC/ASD 2.24 1,41 Accept
0-14/15 or more 2.24 1.36 Accept
Grad/Under 2.24 1.21 Accept
Percentage of respondents indicatingthat they do not engage in gatekeeping activity: 8.1%
The overall mean gatekeeping activity score was 3.00
'three to four times per month) . The hypothesis tests
suggest that the three demographic groups did not differ
ziqnificantly in their reported gatekeeping activitI.
84
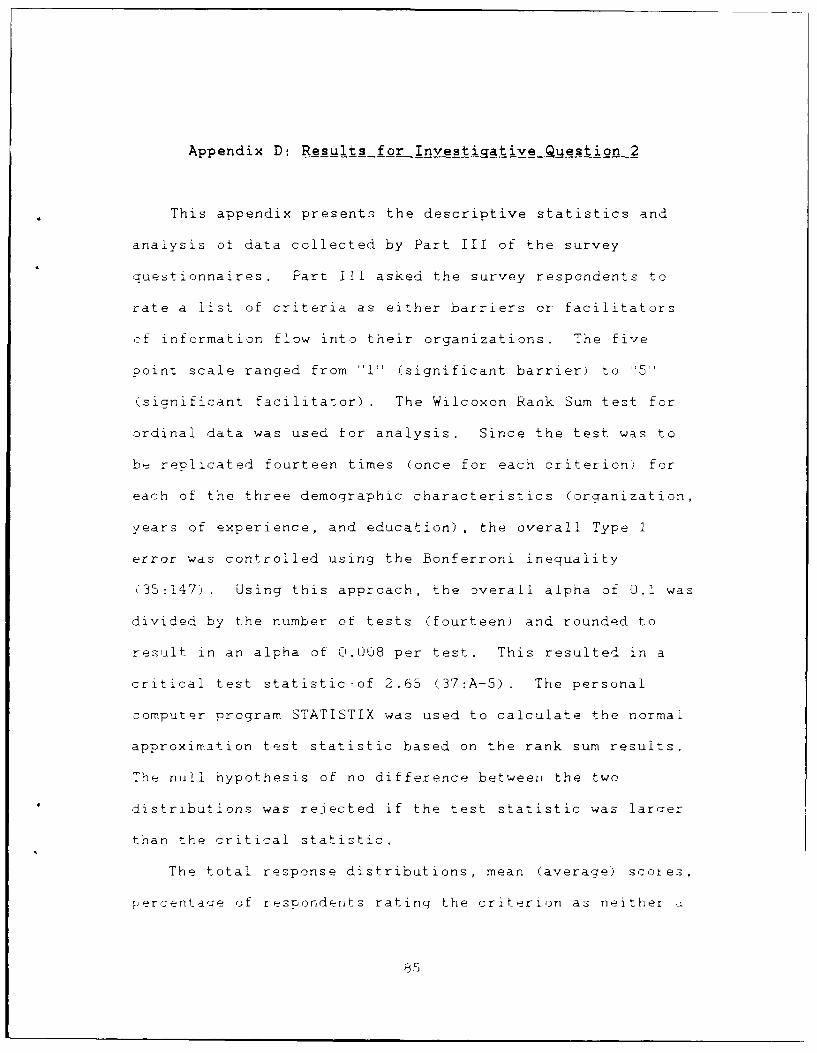
Appendix D: Results for Investi ative Question 2
This appendix presents the descriptive statistics and
analysis of data collected by Part III of the survey
questionnaires. Part III asked the survey respondents to
rate a list of criteria as either barriers or facilitators
cf information flow into their organizations. The five
point scale ranged from 'I (2ignificant barrier) to '5
(significant facilitator) . The Wilcoxon Rank Sum test for
ordinal data was used for analysis. Since the test was to
b.- replicated fourteen times (once for each criterion) for
each of the three demographic characteristics (organization,
years of experience, and education), the overall Type 1
error was controlled using the Bonferroni inequality
<35:147). Using this approach, the overall alpha of 0.1 was
divided by the number of tests (fourteen) and rounded to
result in an alpha of 0.008 per test. This resulted in a
critical test statistic-of 2.65 (37:A-5). The personal
computer program STATISTIX was used to calculate the normal
approximation test statistic based on the rank sum results.
The null hypothesis of no difference between the two
distributions was rejected if the test statistic was larqer
than the critical statistic.
The total response distributions, mean (average) scores,
percentaqe of respondents rating the criterion as neither
J5F
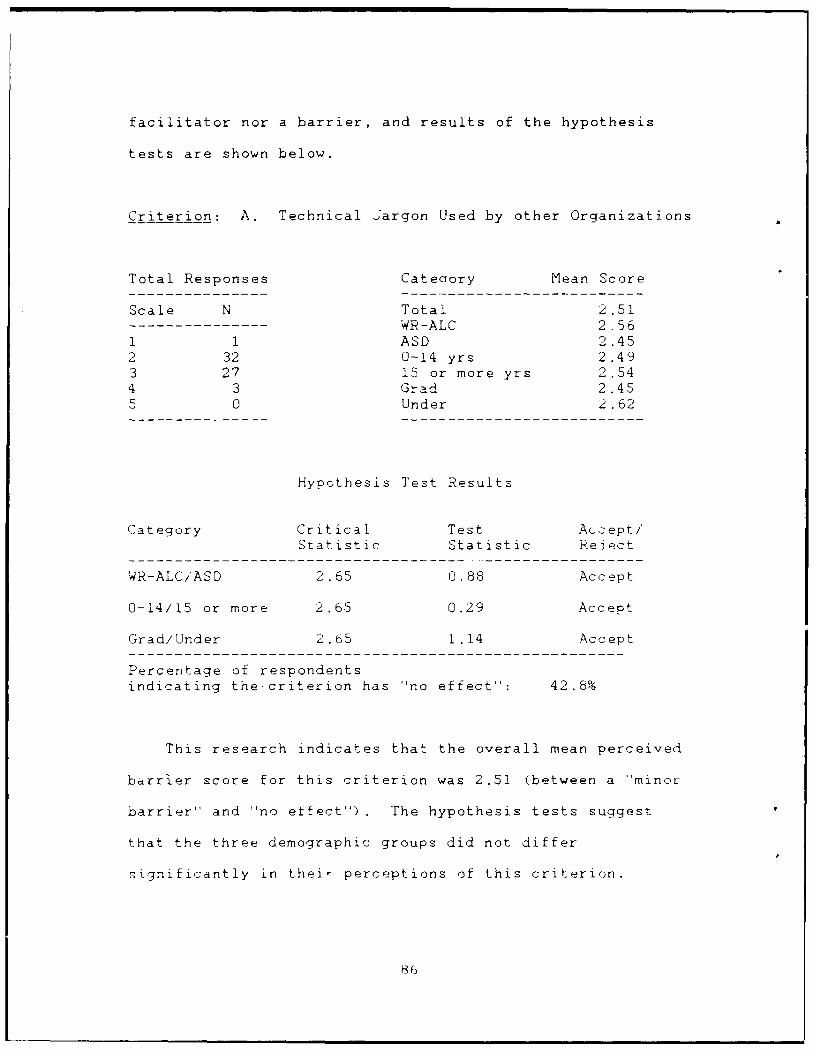
facilitator nor a barrier, and results of the hypothesis
tests are shown below.
Criterion: A. Technical Jargon Used by other Organizations
Total Responses Category Mean Score
Scale N Total 2.51- WR-ALC 2 .56
1 1 ASD 2.452 32 0-14 yrs 2.493 27 15 or more yrs 2.544 3 Grad 2.455 0 Under 2.62
Hypothesis Test Results
Category Critical Test Accept/Statistic Statistic Reject
WR-ALC/ASD 2.65 0.88 Accept
0-14/15 or more 2.65 0.29 Accept
Grad/Under 2.65 1.14 Accept
Percentage of respondentsindicating the-criterion has "no effect": 42.8%
This research indicates that the overall mean perceived
barrier score for this criterion was 2.51 (between a "minor
barrier" and "no effect"). The hypothesis tests suggest
that the three demographic groups did not differ
significantly in their perceptions of this criterion.
86
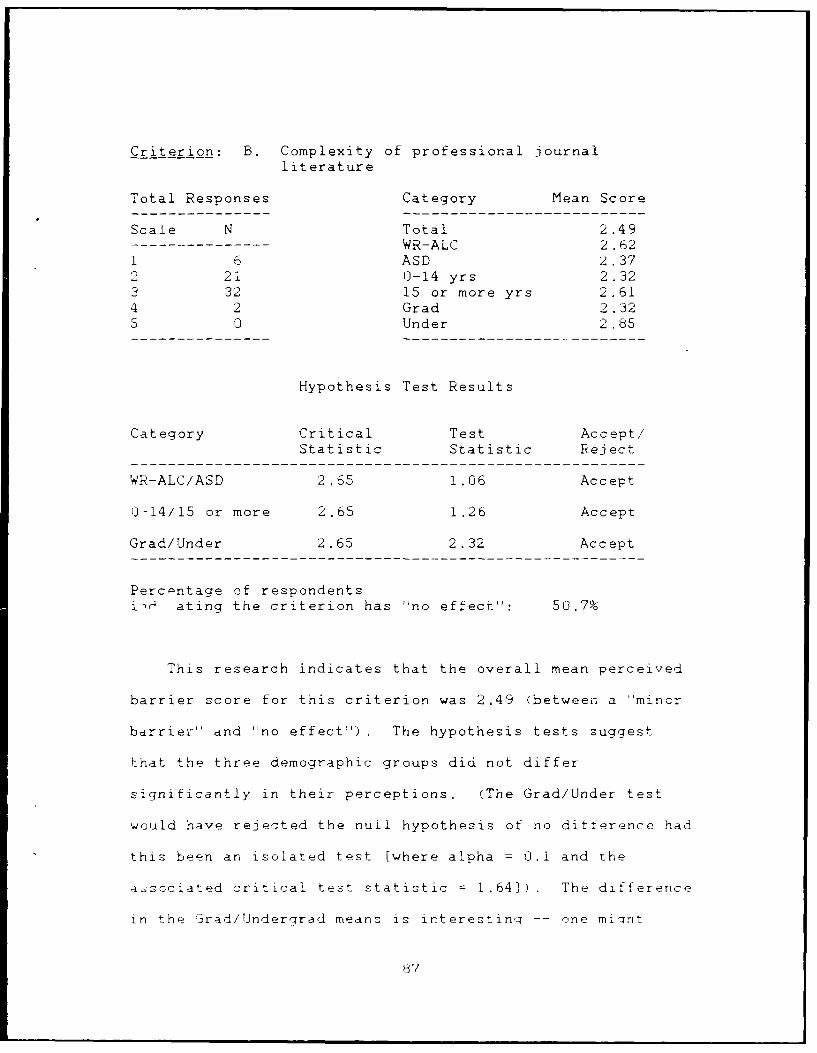
Criterion: B. Complexity of professional journal
literature
Total Responses Category Mean Score
Scale N Total 2 .49WR-ALC 2 .62
1 6 ASD 2.372 21 0-14 yrs 2.323 32 15 or more yrs 2.614 2 Grad 2.325 0 Under 2.85
Hypothesis Test Results
Category Critical Test Accept/Statistic Statistic Reject
WR-ALC/ASD 2.65 1.06 Accept
0-14/15 or more 2.65 1.26 Accept
Grad/Under 2.65 2.32 Accept
Percentage of respondentsi,& ating the criterion has "no effect": 50.7%
This research indicates that the overall mean perceived
barrier score for this criterion was 2.49 (between a "mincr
barrier" and "no effect"). The hypothesis tests suggest
that the three demographic groups did not differ
significantly in their perceptions. (The Grad/Under test
would have rejected the null hypothesis of no difference had
this been an isolated test [where alpha = 0.1 and the
a4sociated critical test statistic = 1.64]). The difference
in the Grad/Underqrad means is irterestinq -- one might
87

normally assume that t-he more education one receives, the
less complicated Lhe literature would seem.
Criterion: C. Publication activity -- probability ofengireers to report their findings inthe open literature
Total Responses Category Mean Score
Scale N Total 2.73WR-ALC 2 .64
1 8 ASD 2.812 14 0-14 yrs 2.693 27 15 or more yrs 2.774 8 Grad 2.945 3 Under 2.62
Hypothesis Test Results
Category Critical Test Accept!Statistic Statistic Reject
WR-ALC/ASD 2.65 0.75 Accept
0-14/15 or more 2.65 0.35 Accept
Grad/Under 2.65 1.07 Accept
Percentage of respondentsindicating the criterion has "no effect": 45.0%
The overall mean perceived barrier score for this
criterion was 2.73 (close to the "no effect" point). The
hypothesis tests suggest that the three demographic groups
did not differ significantly in their perceptions of this
criterion.
68

Criterion: D. Contractor proprietary data rights
Total Responses Category Mean Score
Scale N Total 2.24WR-ALC 2.06
1 14 ASD 2.392 26 0-14 yrs 2.223 20 15 or more yrs 2.254 0 Grad 2.285 3 Under 2.21
Hypothesis Test Results
Category Critical Test Accept/Statistic Statistic Reject
WR-ALC/ASD 2.65 1.36 Accept
0-14/15 or more 2.65 0.21 Accept
Gra/Una r 2.65 0.22 Accept
Perce:,tage of respondentsindicating the criterion has "no effect": 31.7%
The overall mean perceived barrier score for this
criterion was 2.24 (close to the "minor barrier" point).
The hypothesis tests suggest that the three demographic
groups did not differ signiFicant]y in their perceptions of
this criterion.
:-5'i
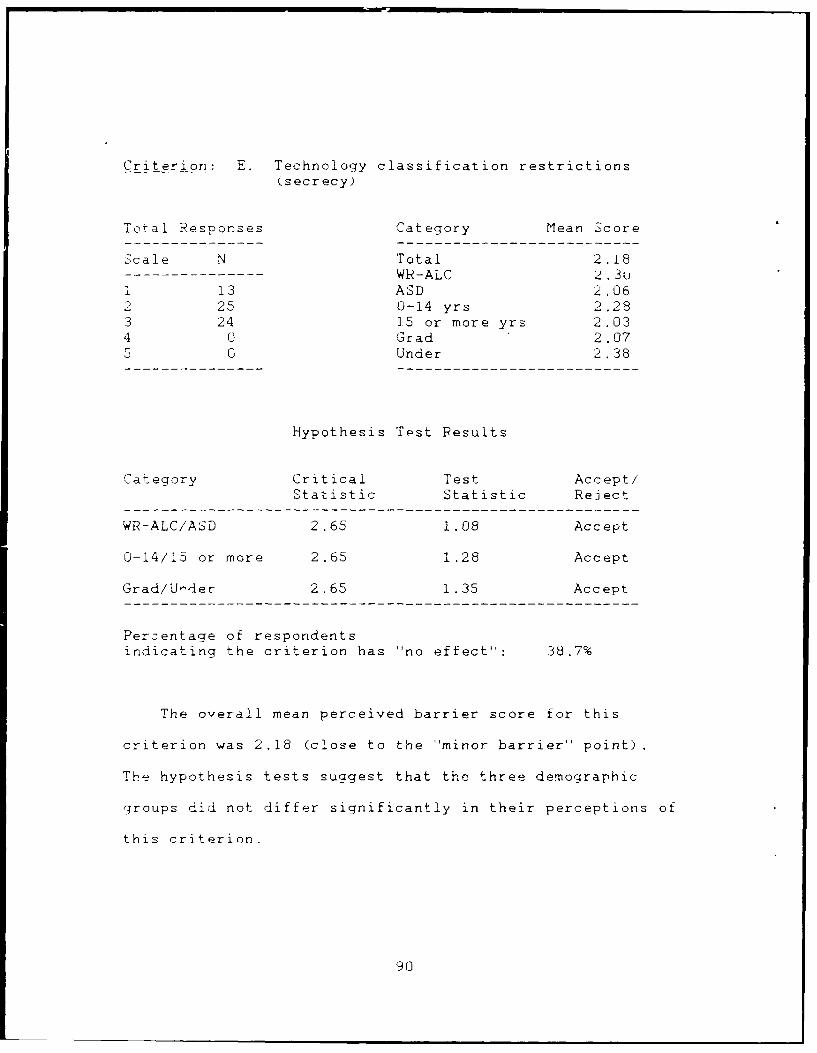
Criterion: E. Technology classification restrictions(secrecy)
Total Responses Category Mean Score
Scale N Total 2.18WR-ALC 2 .0
1 13 ASD 2.062 25 0-14 yrs 2.283 24 15 or more yrs 2.034 0 Grad 2.075 0 Under 2.38
Hypothesis Test Results
Category Critical Test Accept/Statistic Statistic Reject
WR-ALC/ASD 2.65 1.08 Accept
0-14/15 or more 2.65 1.28 Accept
Grad/Under 2.65 1.35 Accept
Percentage of respondentsindicating the criterion has "no effect": 38.7%
The overall mean perceived barrier score for this
criterion was 2.18 (close to the "minor barrier" point).
The hypothesis tests suggest that the three demographic
groups did not differ significantly in their perceptions of
this criterion.
90

Criterion: F. Information volume -- data quantityrequired to search for relevantinformation
Total Responses Category Mean Score
Scale N Total 2.19WR-ALC 2.26
1 17 ASD 2.122 19 0-14 yrs 2.343 24 15 or more yrs 2.004 1 Grad 2.165 1 Under 2.25
Hypothesis Test Results
Category Critical Test Accept/Statistic Statistic Reject
WR-ALC/ASD 2.65 0.39 Accept
0-14/15 or more 2.65 1.66 Accept
Grad/Under 2.65 0.41 Accept
Percentage of respondentsindicating the criterion has "no effect": 38.7%
The overall mean perceived barrier score for this
criterion was 2.19 (close to the "minor barrier" point).
The hypothesis tests suggpst that the three demographic
groups did not differ significantly in their perceptions of
this criterion. (A significant difference would have been
declared between the two "years of experience" groups, had
this been an isolated test [alpha = 0.1. t = 1.64]).
91
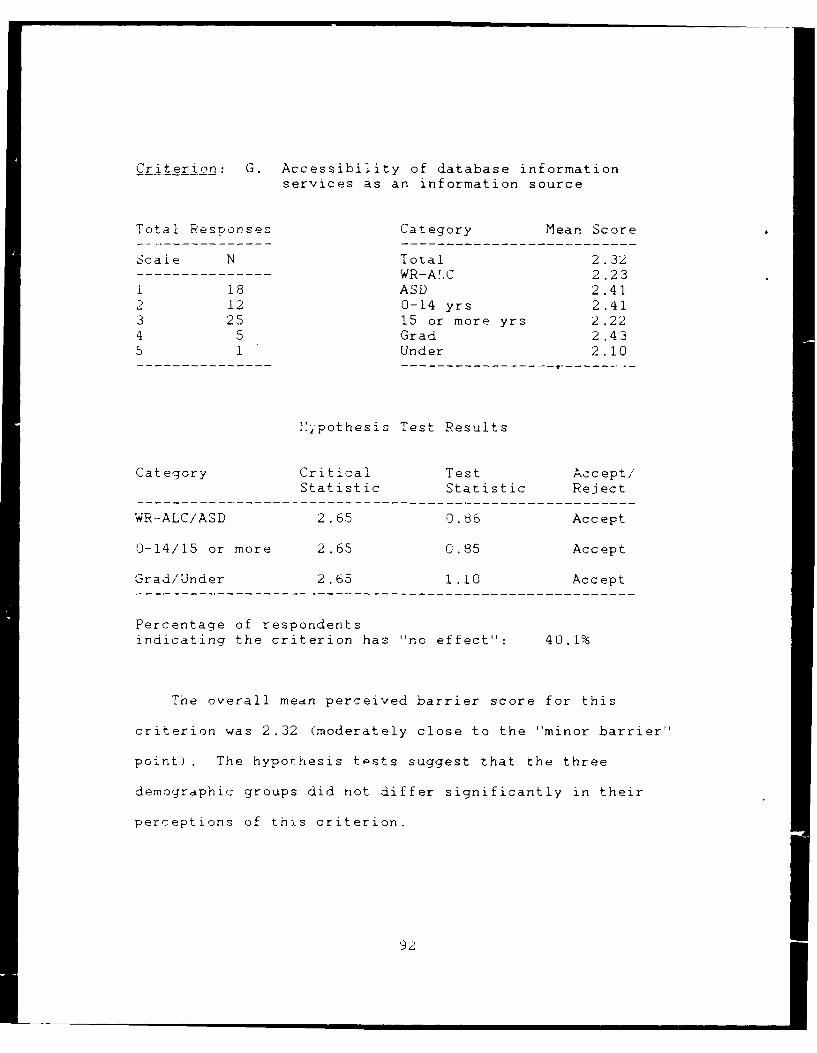
Criterion: G. Accessibility of database informationservices as an information source
Total Responses Category Mean Score
Scale N Total 2.32- WR-ALC 2.23
1 18 ASD 2.412 12 0-14 yrs 2.413 25 15 or more yrs 2.224 5 Grad 2.435 1 Under 2.10
Hypothesis Test Results
Category Critical Test Accept/Statistic Statistic Reject
WR-ALC/ASD 2.65 0.86 Accept
0-14/15 or more 2.65 0.85 Accept
Grad/Under 2.65 1.10 Accept
Percentage of respondentsindicating the criterion has "no effect": 40.1%
The overall mean perceived barrier score for this
criterion was 2.32 (moderately close to the "minor barrier"
point) . The hypothesis tests suggest that the three
demographic groups did not differ significantly in their
perceptions of this criterion.
92

Criterion: H. Incentives (rewards, recognition) toinnovate (or lack of)
Total Responses Category Mean Score
Scale N Total 2.65WR-ALC 2.46
1 11 ASD 2.832 10 0-14 yrs 2 .543 30 15 or more yrs 2.814 9 Grad 2.715 1 Under 2.55
Hypothesis Test Results
Vategory Critical Test Accept/Statistic Statistic Reject
WR-ALC/ASD 2.65 1.42 Accept
0-14/15 or more 2.65 0.91 Accept
Grad/Under 2.65 0.36 Accept
Percentage of respondentsindicating the criterion has "no effect": 49.1%
The overall mean perceived ba ' ar score for this
criterion was 2.65 (moderately cli: to the "no effect'
point). The hypothesis tests suggest that the three
demographic groups did not differ significantly in their
percwpti.rn of this criterion.
93
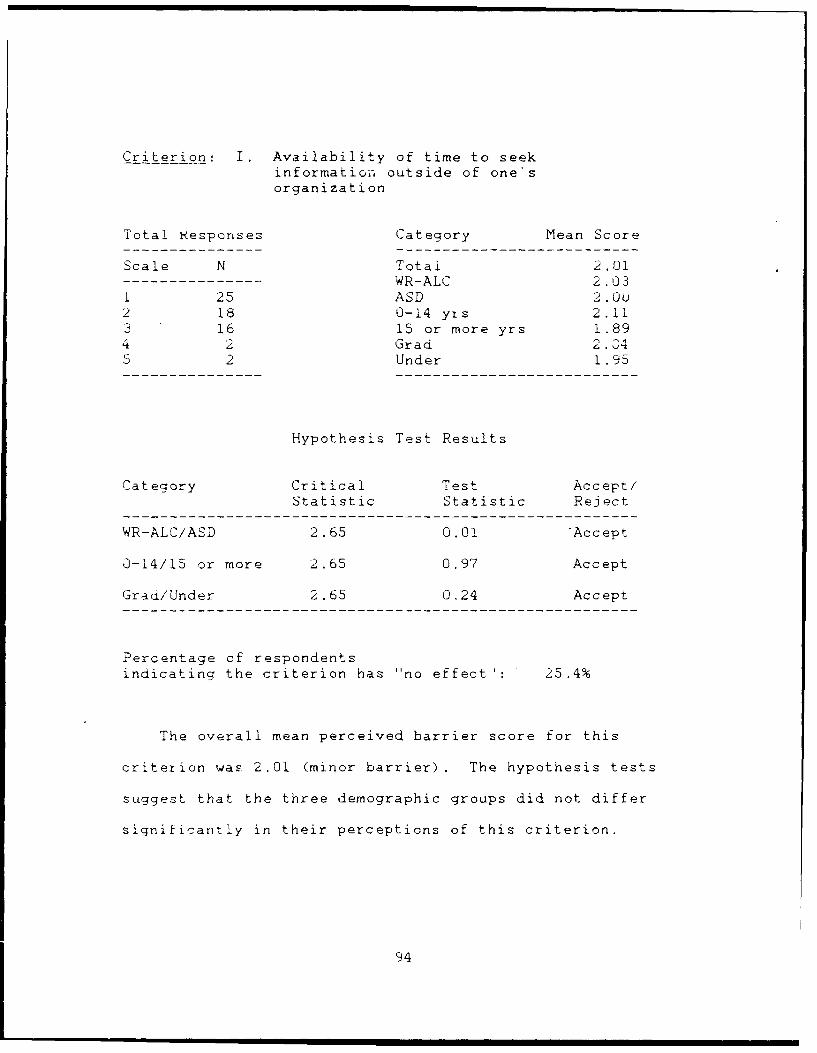
Criterion: I. Availability of time to seekinformation outside of one'sorganization
Total Responses Category Mean Score
Scale N Total 2.01WR-ALC 2 .03
1 25 ASD 2.0U2 18 0-14 yis 2.113 16 15 or more yrs 1.894 2 Grad 2.345 2 Under 1.95
Hypothesis Test Results
Category Critical Test Accept!Statistic Statistic Reject
WR-ALC/ASD 2.65 0.01 Accept
0-14/15 or more 2.65 0.97 Accept
Grad/Under 2.65 0,24 Accept
Percentage of respondentsindicating the criterion has "no effect": 25.4%
The overall mean perceived barrier score for this
criterion was 2.01 (minor barrier). The hypothesis tests
suggest that the three demographic groups did not differ
significantly in their perceptions of this criterion.
94
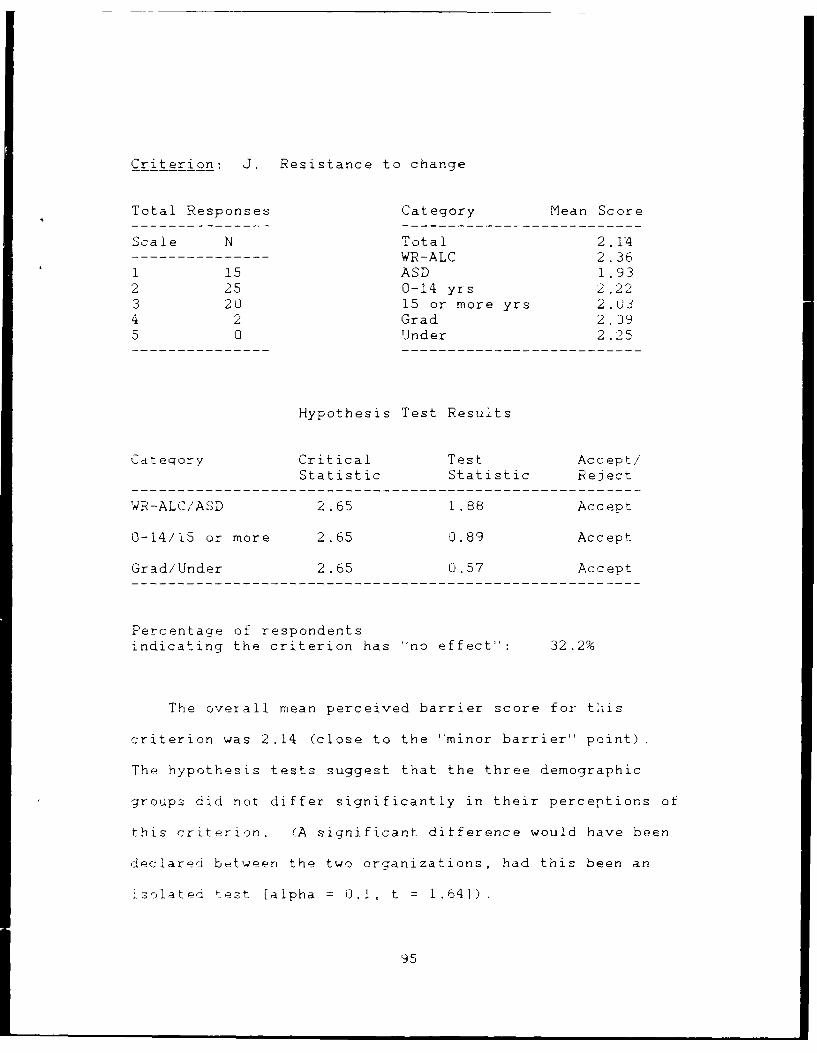
Criterion: J. Resistance to change
Total Responses Category Mean Score
Scale N Total 2.14WR-ALC 2 .36
1 15 ASD 1.932 25 0-14 yrs 2.223 20 15 or more yrs 2.U34 2 Grad 2.095 0 Under 2.25
Hypothesis Test Results
Category Critical Test Accept/'Statistic Statistic Reject
WR-ALC/ASD 2.65 1.88 Accept
0-14/15 or more 2.65 0.89 Accept
Grad/Under 2.65 0.57 Accept
Percentage of respondentsindicating the criterion has "no effect-: 32.2%
The overall mean perceived barrier score for this
criterion was 2.14 (close to the "minor barrier" point).
The hypothesis tests suggest that the three demographic
groups did not differ significantly in their perceptions of
this criterion. (A significant difference would have been
declared between the two organizations, had this been an
isolated test [alpha = 0.1, t = 1.64]).
95
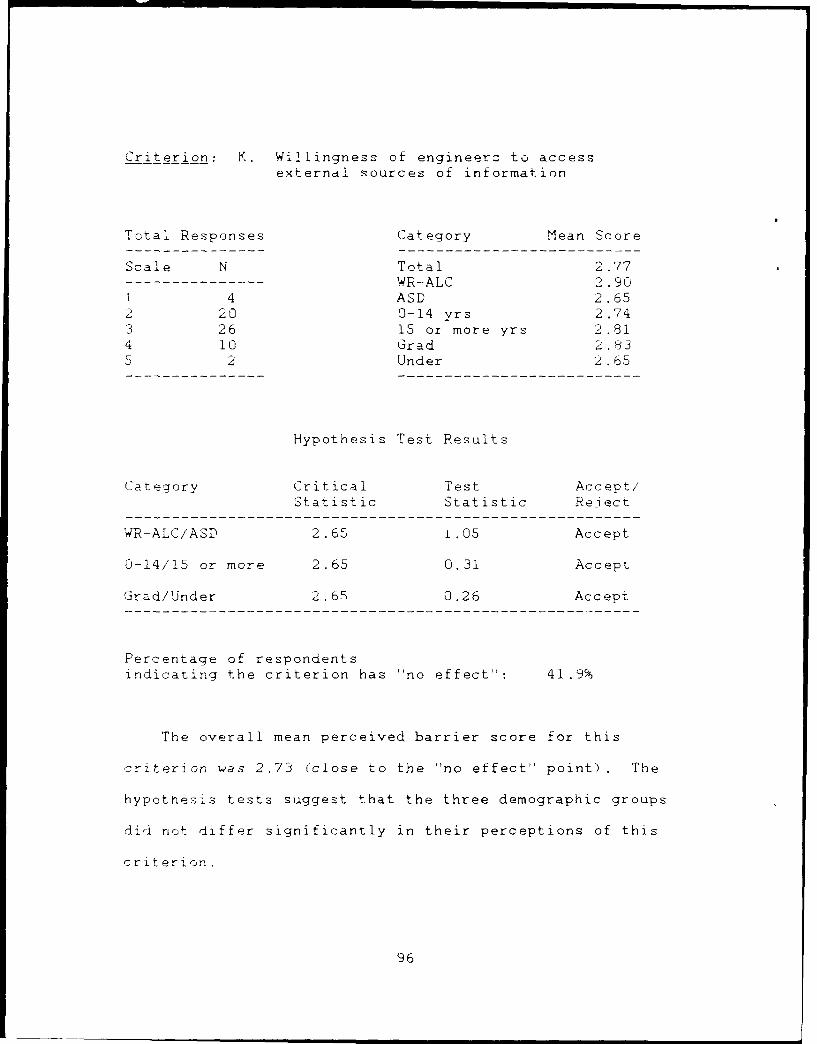
Criterion: K. Willingness of engineerz to accessexternal sources of information
Total Responses Category Mean Score
Scale N Total 2.77WR-ALC 2 .90
1 4 ASD 2.652 20 0-14 vrs 2.743 26 15 or more yrs 2.814 10 Grad 2.835 2 Under 2.65
Hypothesis Test Results
Category Critical Test Accept,'Statistic Statistic Reject
WR-ALC/ASD 2 .65 1 .05 Accept
0-14/15 or more 2.65 0.31 Accept
Grad/Under 2.65 0.26 Accept
Percentage of respondentsindicating the criterion has "no effect": 41.9%
The overall mean perceived barrier score for this
criterion was 2.73 (close to the "no effect" point) . The
hypothesis tests suggest that the three demographic groups
did not differ significantly in their perceptions of this
criterion.
96

Criterion: L. Organization priorities that affectinnovation (example: productionquantity versus quality improvement)
Total Responses Category Mean Score
Scale N Total 2.0WR-ALC 1 .97
1 21 ASD 2.072 18 0-14 yrs 2.123 18 15 or more yrs 1.884 2 Grad 2.005 0 Under 1.91
Hypothesis Test Results
Category Critical Test Accept/Statistic Statistic Reject
WR-ALC/ASD 2.65 0.42 Accept
0-14/15 or more 2.65 1.02 Accept
Grad/Under 2.65 0.60 Accept
Percentage of respondentsindicating the criterion has "no effect-: 30.5%
The overall mean perceived barrier score for this
criterion was 2.01 (minor barrier.. The hypothesis tests
suggest that the three demographic groups did not differ
significantly in their perceptions of this criterion.
97

Criterion: M. Communication between AFSC productdivisions and AFLC ALC's
Total Responses Category Mean Score
Scale N Total 2.39
- WR-ALC 2.06
1 14 ASD 2.7U2 19 0-14 yrs 2.413 24 15 or more yrs 2.394 3 Grad 2.535 3 Under 2.14
Hypothesis Test Results
Category Critical Test Accept/Statistic Statistic Reject
WR-ALC/ASD 2.65 2.71 Reject
0-14/15 or more 2.65 0.01 Accept
Grad/Under 2.65 1.38 Accept
Percentage of respondentsindicating the criterion has "no effect": 38.1%
The overall mean perceived barrier score for this
criterion was 2.39 (moderately close to the "minor barrier''
point) . The hypothesis tests suggest that WR-ALC and ASD
differ significantly in their perceptions of whether
technical communication barriers exist between AFSC and
AFLC.
98
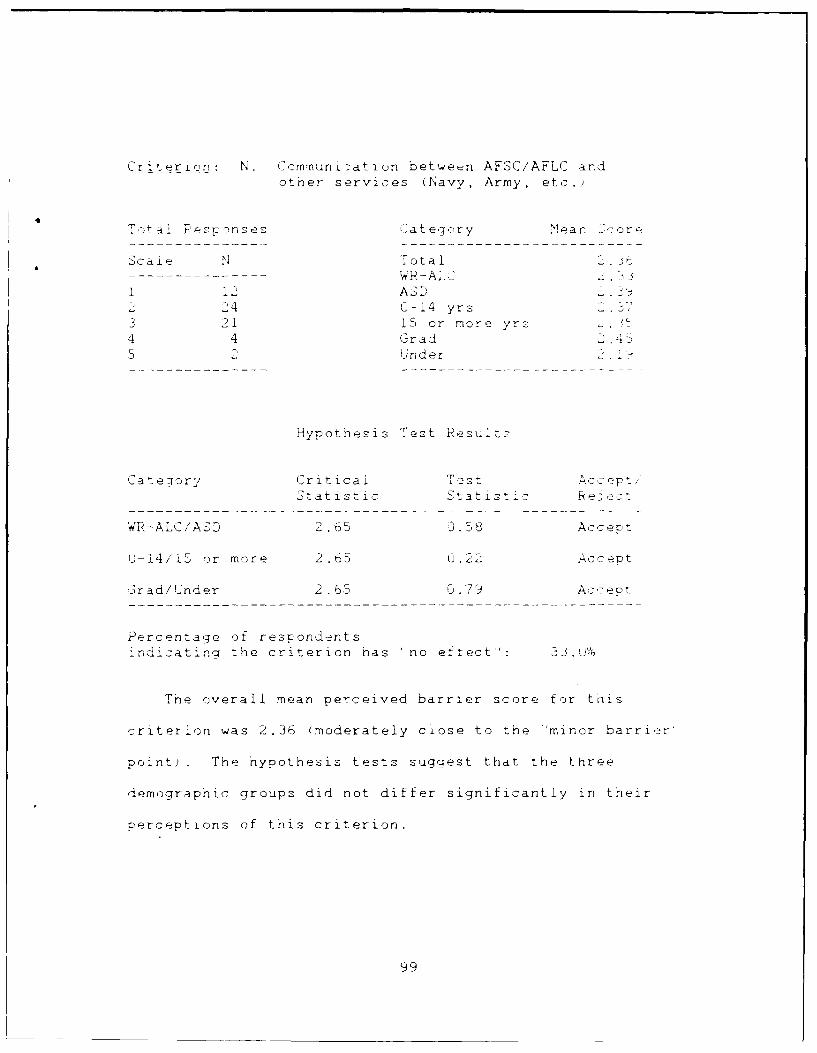
Criterion: N. Communication between AFSC/AFLC andother services (Navy, Army, etc.)
Totia.. Responses Category M1ean Ecore
Scaie N Total 2. j6---- ----- WR-ALC.
12 ASD24 0-14 yrs 2 3"
3 21 15 or more yrs4 4 Grad3 Under 2 .
Hypothesis Test Results
Cateory Critical Test Accep.,Statistic Stat ist ic Reject
WR-ALC/ASD 2.65 0.58 Accept
IJ-14/15 or more 2.Y5 0.22 Accept
Grad/Under 2 .V 0. 7,J Accept
Percentage of respondentsindicating the criterion has -no effect': 33.ou
The overall mean perceived barrier score for this
criterion was 2.36 (moderately close to the -minor barrier '
point). The hypothesis tests suggest that the three
demographic groups did not differ significantly in their
perceptions of this criterion.
99
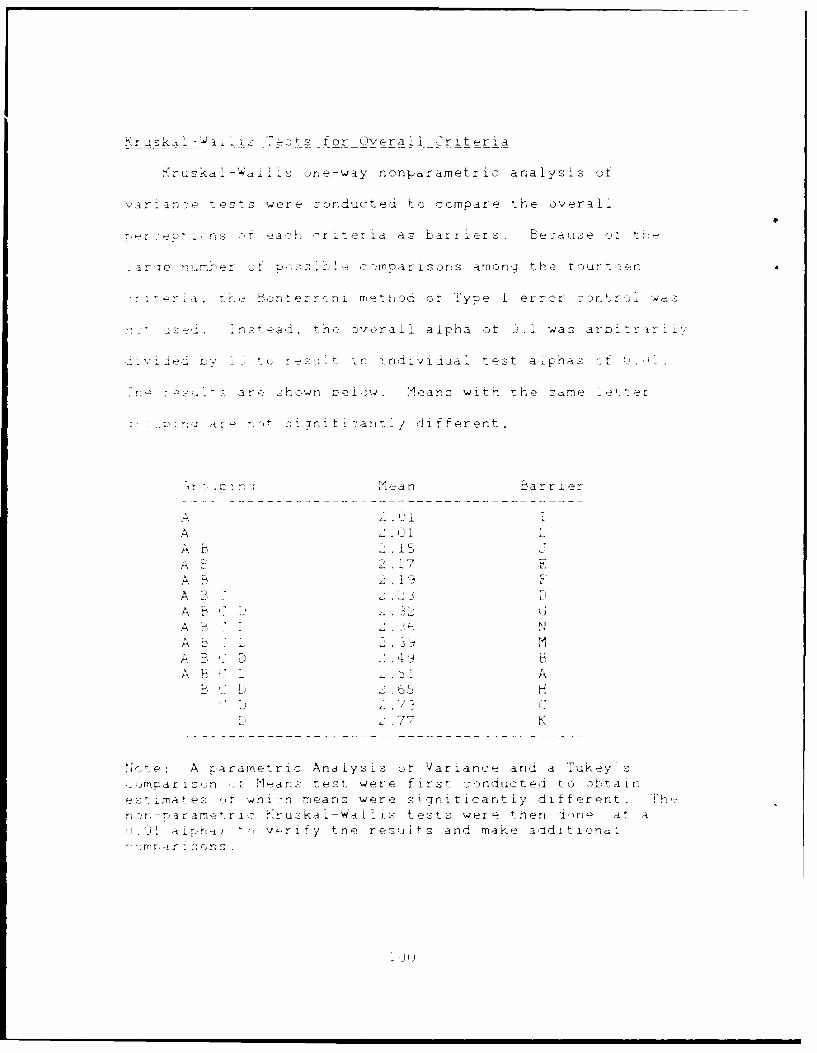
: -w e _for (veral 'i y _ Criter ia
ruska!-"- :I -one-way nonparametric analysis or
variance tests were conducted to compare the overall
,erjep cns rf each cr: teria as barriers. Because o, t:,.
_aroe n omber of p,:ss e *-romarisons arn, , the f enrteen
• e a tr-v ronerrcni retn.od of .Type err-2r con _tro -'
. .tead, the :verai aipha of '.1 was arnitrari, L%
ve~i u'! to reu t u n rnisividual test a phas -D J.:
Sare Dhown belw . [Means with the same .e'e
: : < r;- i re noDt -- s[inli- I t diff erent.
-ean Barrier
- -- - - - - - - -- -- -- -- -- -- -- - -
A L
b 15
A ) 217A 9, 2 i9
A 9]'* . L3
L M
B Di
B ' D 6 H
7 K
Note A parametric Analysis ut Variance and a Tukey s,imparsn ,r fleans test were f rst conducted to obtainestimat of which means were siniticantiy ditferent. !h-nn-prametric ?r uska- WaiIs t e fs were then done ,at a
tI j.1 aipha to verify the resuits and make _additional
mr i r r; s

Bib 1jagrphy
1.Agresti, Alan. AalssoOrna Caeoria DtaNew York: Johr. Wiley & Sons, 1984.
Air Force Coordinating Office for Logistics hesearcn.
Dayton OH,. 27-28 September 1988.
--. TechTIP Report Program." xFCOLRAT, rat
Patterson AFB CH 45433-5G01. Tel (5130 255-166.
Allen Thomas J. MAna~in the nlow of TeqhnS~qyy.Cambridge MA: The MIT Press. 1984.
Allen, Thomas J, Michael L. Tushrnan and Denis M.S. LeeTechnology Transfer as a Function of Position ;n tne
Spectrumn from Research Through Development to Tochnicaivices. Acdm fNngmetjournal, J': :?-w
asilico. Alton, Technology insertion ProjectsTelephone interviews. WR-ALC/MMETE, Robins AF3 GA, !I3rnuary through 14 June 1989.
7. Bandin, James S. and Warren B. Brown. -Yncernaintyani tanagem-nt's Search for Information.- IEEETrnsactiomns on Eniern~ngmnEfi-2: 1i414 :751ember U 3770
1, Erw Lawrence A. Innovto Difso A New,,r-erspyeoive. New York: Nethuen &~ Co, 1981
J. akrabarti, Aiok K., Stephen Feineman * and WilliamFurtevilla. 'Ch.racteristics of Sources, Channels, and!ontents for Scientific and Technical Information
Systems in industrial R&D, IE"rasciosoEngneeingNaiagm~n ,EN-3D: 83-88 (May 1983).
1U. (ihenny, Richard, Secretary if Defense. Defense~1an~emn tReprt t th Prsidnt. Office of the
Secretary of Defense, Washington DC, July 1989.
L-orover, W.J. Practical Non-Parametric Statistics.New York: John 4iley -'. Sons, 1)71.
l1ii
12. Cormier, Rene V. and Ralph J. Salvucci. A Study ofTechnology Transfer Within the Air Force _. _Command. MS thesis. School of Engineering,Massachussets Institute of Technology, June 1986.
13. Creighton, J.W. et al. ''The Manager's Role inTechnology Transfer,'' Journal of Technol osy Transfer.'1-i : 65-78 "Fall 1985) .
A. David, Fred R. and Daniel S. Cochran. "Characteristi -rof Boundary Spanning Communicators," Journal ofTechnical Writing and Communication, 17: 16.5-177 (1 87;)
. 'Defense Documentation Center (DTIC). Especi ally DDC.
Users Look at the DoD Information Transfer Process..ommittee on Information Hang-Ups, Washington DC,
January 1975 (.AD-AU05400)
1i. L ewhirst, Dudley H., Richard D. Arvey and Edward M.rjwn. )atisfaction and Performance in Research and
Development Tasks as Related to InformationAccessib-iity," IEEE Transactions on Enqineeringangemenr. EM-25: 58-63 (August 1978).
qide, Kenneth E. ''Technology Transfer: A Look at 'hereieral Sector," Journal of TechnologyTransfer, : 7o-7' (Fall !J84.,
1. mery, (. William. Business Research Methods (ThirdWlition . Homewood, IL: Richard D. Irwin incorporated.
7iscner, William A. "Scientific and Technicalinformation and the Performance of R&D Groups," TIMSS.:tudies in the Manaqement Sciences, 15: 67-89 (1980).
'3erstberger, Peter G. and Thomas J. Allen. "CriteriaUsed by Research and Development Engineers in theSelection of an Information Source," Journal of Appl edsycholog, 52: 272-279 (1968).
.1 Gillespie, George C. "Federal Laboratories: EconomicDevelopment and Intellectual Property Constraints,"Journal of Technoloqy_Transfer. 13: 20-26 (Fall 1988).
,J ,Guilfoos, Stephen J. ''Technology Crosstalk." Reportto AFLC/CC. AFALC/PTN, Wright-Patterson AFB OH February1i 4.
2". Hamlin, Donna M. and Craig Harkins. "A Model forTechnical Communication,'' Journal of Technical Writinga'd Crmmuniqation 13: 57-79 (1983)
102

24. Hubbard, Robert V. and Kathleen F. Zaccardo. Anclysisof the Use of Defense Technical Information CenterResources _kyResparh and Development Centers andLaboratories in the U.S. Army. Technical Report No.694. Office of the Deputy Chief of Staff for TechnologyPlanning and Manaqement, Headquarters, U.S. ArmyMaterial Command, Alexanria VA, November 1985(AD--A168441).
25. Huqhes, P.S. and M.N. Olson. A Reqional Center forUtilization and Transfer of Technology. MS thesis.Naval Postgraduate School, Monterey CA, September i976(AD-A031873).
26. Johnson, Douglas F. Should There be a CentralizedOffice of Technology Transfer?' Journal of TechnologyTransfer, 1: 61-65 (Fall 1976).
27, Jolly, J.A. , J.W. Creighton and S.A. Denning.Enhancement of Research and Devel opment (jut putUtilization Efficiencies: Linker Concept_ Nethodolocrv inthe Technoloqy Transfer Process. Naval PostgraduateSchool, NPS-55CF72061A, Monterey CA, 1972.
28. Jung, Werner. 'Barriers to Technology Transfer andtheir Elimination,'' Journal ot Technology Transfer, 4:15-25 (1980)
29. Katz, Ralph. 'The Effects of Group Longevity onProject Communication and Performance,' AdministrdLiveScience Quarterly, 27: 81-104 (March 1982).
30. Lantz, Alma E. and Anita West. 'The Role of PersonneiMigration in the Introduction of Innovations,' Journalof Technology Transfer, 2: 49-59 (Fall 1977).
31. Liker, Jeffrey K. and Walton M. Hancock."Organizational Systems Barriers to EnqineerinqEffectiveness,'' IEEE Transactions on EngineeringManagement, EM-33: 82-91 (May 1986).
32. Mansfield, Edwin. Research and Innovation in theModern Corporation. New York: W.W. Norton & Company,1971.
33. Mercer, Kristin. ''rganization Structure as a Factorin Innovation: A Review of the Literature,'' Journal ofTechnoloqy Transfer, 7: 15-19 (Winter 19d3).
34. McCorkendale, Don B. An Examination of Techno logyTransfer as a Tool for Management. MS thesis. NavalPostgraduate School, Monterey CA, March 1986(AD-A169184)
lI (3
35. Neter, John and William Wasserman. Ap2iod Linear
Statistical Models. Homewood IL: Richard D. Irwinincorporated. 1974.
36. Olsen. Michael J. A Study of Federal Technolo2yTransfer to the Commercial Sector. MS thesis,AFij/SGLMI/LSP/87S-5. School of Systems and Logistics,Air Force Institute of Technology (AU) , September 1987AD-Al 870i7'
0. 'jtt, Lyman. An introduction to Statistical Methods andData Analysis. ,Third Edition). Boston: PWS-KentPublishing Company, 1988.
38. Pace, Roger C. 'Technical Communication, GroupDifferentiation, and the Decision to Launch the SpaceShuttle -,a 1ienge , ' Jurnal of Thnal '"ritin c anKCommunication. 18: 207-220 (1988).
39. Padula, 1ajor Gregory F. Technoioqy Transrusion - ANetwork Recommendation. Report No. 88-2030. AirC1ommand and Staff College ,.AU) , Maxwell AFB AL.April 1988.
41. Premus, Robert. Pr,-ressor of Economics, Wright -taUniversity, Dayton OH. 'US Technology Transfer anaRegional Policy.' Presentation to European SummerInstitute of 'he Regional Science Association. Arco,Italy, 17 July 1988.
41. Rogers, Everett M. Diffusion of innovations (ThirdEdition) . New York: Macmillian Publishing Company,_I J83
42. Rosenberg. V. ''Factors Affectinq the Preference ofIndustrial Personnel for Information Gathering Methods,'information Storage and Retrieval, 3: 95 (July 1967).
43. Salasin. J. and Cedar. T. Knowledge Transfer in an-plicd Rearch,/'Servi- D)liverv Setting. MITRETechnical Report Number MTR-82W122, Alexandria VA.August 1982.
44. Sayers, Marrick. The Implications of a Video-Conferencinq Installation for Diffusion of InnovationResearch. PhD dissertation. University of SouthernCalifornia, Los Angeles CA 1987.
45. Shapiro, S.S. and M. Wilk. ''An Analysis of VarianceTest for Normality,'' Biometrika. 52: 591-611 (1965).
104
46. Snedecor, G.W. and W.G. Cochran. Statistical Method ,(Seventh Edition). Ames !A: The Iowa State UniversityPress, 1980.
47. Stewart, Charles T. Jr. "Technology Transfer VersusDiffusion: A Conceptual Clarification," JouLnal ofTechnoloqy Transfer, 12: 71-79 (Winter 1987).
48. Taylor, Robert L. 'A Longitudinal Analysis ofTechnical Communication in Research and Development, ''Journal of TechnoloqyTransfer, 1: 17-31 (1977).
49. Triscari, Thomas Jr. Orqanizations and InformationProcessing: A Field Study of Research and Deve1opmentUnits Within the United States Air Force SystemsCommand. PhD dissertation. Rensselaer Polytechnicinstitute, Troy NY, August 19b4 (AD-A147381).
50. Varieur, Normand L. International Defense InformationConference (IDIC) - Proceedings of the First IDIC. U.S.Army Armament Research, Development and EngineeringCenter. Information Management Institute, PicatinnyArsenal NJ, April 1987 (AD-A180372).
51. Wyckoff, Andrew W. and Louis (3, Tornatzky. -State-level Efforts to Transfer Manufacturing Technology: ASurvey of Programs and Practices," Management Science,34: 469-481 (April 1988).
105

VITA
Captain Alan W. Johnson
Sattended Montana State University from
which he received the degree of Bachelor of Science of
Mechanical Engineering in December 1982. After graduation
he was commissioned a second lieutenant in the U.S. Air
Force and served as a project management officer with the
Reconnaissance and Electronic Warfare Systems Program Office
at Wright-Patterson A.F.B. He entered the Air Force
Institute of Technology in June 1988.
106
UNCLASSI FI ED
Form ApprovedREPORT DOCUMENCATION PAGE OM6No. 0704-0188
la REPORT SECURITY CLASS IF'CATION lb RESTRICTIVE MARKINGS
UNCLASSI FIED2a. SECURITY CLASSIFICATION AUTHORITY 3 DISTRIBUTION/AVAILABILITY OF REPORT
Approved for public release;)b. DFCI, MSSIFICATION, DOWNGRADING SCHEDULE di stri buti on unlimited
4 PERFORMING ORGANIZATION REPORT NUMBER(S) 5. MONITORING ORGANIZATION REPORT NUMBER(S)
AFI T/GSM/LSM/89S-20
6a. NAME OF PERFORMING ORGANIZATION 6b. OFFICE SYMBOL 7a. NAME OF MONITORING ORGANIZATION
School of Systems and (if applicable)
Loqistics a6c. ADDRESS (City, State, and ZIPCode) 7b, ADDRESS(City, State, and ZIP Code)
Air Force Institute of Tech-,ology (AU)tWrigi,-Patt-ers-n Ar. -- , 3-6583
8a NAME OF FUNDING/SPONSORING 8b. OFFICE SYMBOL 9. PROCUREMENT INSTRUMENT IDENTIFICATION NUMBERORGANIZATION (If applicable)
Office for Logistics Research ALD/LTT8c ADDRESS (City, State, and ZIP Code) 10. SOURCE OF FUNDING NUMBERS
PROGRAM PROJECT TASK WORK UNITWright-Patterson AFB OH 45433-6503 ELEMENT NO. NO. NO ACCESSION NO.
11. TITLE (Include Security Classification)PERCEIVED BARRIERS AND OPPORTUNITIES TO ENGINEERING TECHNICAL CO,.UNICATIO,,,N SELECTED AIR FORCE ORGANIZATIONS
12. PERSONAL AUTHOR(S)A'.an . Johnson, B.S., Captain, USAF
13aTYPE sOF REPORT" 13b. TIME COVERED 149DATE OF REPORT (YearMonthDay) 15. PAGE COUNTMS ThssFROM TO ___ 1989 September y 1 15
16. SUPPLEMENTARY NOTATION
17 COSATI CODES 18. SUBJECT TERMS (Continuc on reverse if necessary and identify by block number)FIELD GROUP SUB-GROUP --Technology Transfer Information Transfer
05 02 Information Exchange
19 ABSTRACT (Continue on reverse if necessary and identify by block number)
Thesis Advisor: Dr. Robert WeaverAssociate Prcfessor of Tzchnical ,m, . cationDepartment of Ccmmunication and Organizational Sciences
Appr ed for p lc re ease: IAW AFR 190-1.
LRRYW. EMMELHAINZ, Lt CI1, USAF 14 Oct 89Director of Research and Consultation
Air Force Institute of Technology (AU)
Wright-Patterson AFB OH 45433-6583
20. DISTRIBUTION/AVAILABILITY OF ABSTRACT 21. ABSTRACT SECURITY CLASSIFICATION'0 UNCLASSIFIED/UNLIMITED 0 SAME AS RPT . DTIC USERS UNCLASSIFIED
22a. NAME OF RESPONSIBLE INDIVIDUAL 22b. TEJPH,,ONE (Inclu ie Area Code) 22c. OFFICE SYMBOL
nr Pnhprt Wn; r 513)255-452, AFIT/LSRDD Form 1473, JUN 86 Previous editions are obsolete. SECURITY CLASSIFICATION OF THIS PAGE
UNCLASSIFIED

UNCLASSIFIEDj
Once successfully used, mature (empirically proven)technologies are rarely diffused (retrarketed and used) onsubsequent systems. One of the greatest barriers to thediffusion of technology is a lack of widespread awarenessthat a technology exists. The objective of this researchwas to identify technical communication barriers andopportunities, as perceived by selected Air Force SystemsCommand ,AFSC) and Logistics Command (AFLC) engineers, thataffect tr.e diffusion of technologies into theirorganizations. A survey of 86 selected AFSC and AFLCengineers was conducted in support of the above objective.Overall, the results of the study support the findings ofprevious research. Recommendations are offered to helpimprove the widespread awareness of (and hopefully thesubsequent use of) mature technologies by defenseengireering organizations.
UNCLASSIFIED
View publication statsView publication stats