Embed Size (px)
Citation preview

PepsiCo, Inc. - Water Security 2019
W0. Introduction
W0.1
(W0.1) Give a general description of and introduction to your organization.
PepsiCo products are enjoyed by consumers more than one billion times a day in more than 200 countries and territories around theworld. PepsiCo generated more than $64 billion in net revenue in 2018, driven by a complementary food and beverage portfolio thatincludes 22 brands that generate more than $1 billion each in estimated annual retail sales (e.g., Frito-Lay, Gatorade, Pepsi-Cola,Quaker and Tropicana). At the heart of PepsiCo is our goal to deliver top-tier financial performance while creating sustainable growthand shareholder value. In practice, this means providing a wide range of foods and beverages from treats to nutritious eats; trying tofind innovative ways to reduce our impact on the environment and lower our operating costs; working to provide a safe and inclusiveworkplace for our employees globally; and respecting, supporting and investing in the local communities where we operate.
This CDP Water Security Questionnaire contains statements reflecting our views about our future performance that constitute“forward-looking statements” within the meaning of the Private Securities Litigation Reform Act of 1995 (Reform Act). Statements thatconstitute forward-looking statements within the meaning of the Reform Act are generally identified through the inclusion of wordssuch as “aim,” “anticipate,” “believe,” “drive,” “estimate,” “expect,” “expressed confidence,” “forecast,” “future,” “goal,” “guidance,”“intend,” “may,” “objective,” “outlook,” “plan,” “position,” “potential,” “project,” “seek,” “should,” “strategy,” “target,” “will” or similarstatements or variations of such words and other similar expressions. All statements addressing our future operating performance,and statements addressing events and developments that we expect or anticipate will occur in the future, are forward-lookingstatements within the meaning of the Reform Act. These forward-looking statements are based on currently available information,operating plans and projections about future events and trends. They inherently involve risks and uncertainties that could cause actualresults to differ materially from those predicted in any such forward-looking statement. These risks and uncertainties include, but arenot limited to, those described in “Item 1A. Risk Factors” and “Item 7. Management’s Discussion and Analysis of Financial Conditionand Results of Operations – Our Business – Our Business Risks.” Investors are cautioned not to place undue reliance on any suchforwardlooking statements, which speak only as of the date they are made. We undertake no obligation to update any forward-lookingstatement, whether as a result of new information, future events or otherwise. The discussion of risks below and elsewhere in thisreport is by no means all-inclusive but is designed to highlight what we believe are important factors to consider when evaluating ourfuture performance.
W-FB0.1a
(W-FB0.1a) Which activities in the food, beverage, and tobacco sector does your organization engage in?Processing/ManufacturingDistribution
W0.2
(W0.2) State the start and end date of the year for which you are reporting data.
Start date End date
Reporting year January 1 2018 December 31 2018
CDP Page of 671

W0.3
(W0.3) Select the countries/regions for which you will be supplying data.IndiaSouth AfricaUnited States of America
W0.4
(W0.4) Select the currency used for all financial information disclosed throughout your response.USD
W0.5
(W0.5) Select the option that best describes the reporting boundary for companies, entities, or groups for which waterimpacts on your business are being reported.Companies, entities or groups over which financial control is exercised
W0.6
(W0.6) Within this boundary, are there any geographies, facilities, water aspects, or other exclusions from your disclosure?Yes
W0.6a
(W0.6a) Please report the exclusions.
Exclusion Please explain
Operational control farmsand dairies
Company farms in China and Egypt do not have the capability to measure consumption at this time. Collectively, we estimate thatexclusions represent less than 1% of total consumption.
Internationaloffices/warehouse (partial)
These facilities do not report water consumption. Collectively, we estimate that exclusions represent less than 1% of totalconsumption.
Offices/warehousesassociated with significantacquisitions in 2010 and2011.
These facilities do not report water consumption. Collectively, we estimate that exclusions represent less than 1% of totalconsumption.
Agriculture PepsiCo owns/manages some agricultural land within our direct operations. Lands are usually used to grow crops for our products. Theamount of land this represents in our overall agricultural supply chain is judged to be small and therefore de minimis.
Venezuela We determined that the inclusion of data for our Sustainability reporting should align with the reporting framework used as well as anyexclusions in our financial reporting. Because Venezuela is excluded from our financial report and its water use representsapproximately 0.1% of our water inventory, it is considered de minimis and we can meet the required alignment.
W1. Current state
W1.1
CDP Page of 672

(W1.1) Rate the importance (current and future) of water quality and water quantity to the success of your business.
Direct useimportancerating
Indirectuseimportancerating
Please explain
Sufficientamountsof goodqualityfreshwateravailablefor use
Vital Vital Direct: Good quality fresh water is considered vital because it is a key ingredient for our beverages. Additionally, it is vital formaintaining sanitary conditions throughout our food and beverage operations (direct) and those of our third-partymanufacturers and franchise bottlers (indirect). Indirect: Good quality freshwater is also vital in our raw material supply chainand particularly within our agricultural supply chain where water is vital for growing crops. We expect that future waterdependency in our direct and indirect operations will change because of improvements in both operational and agriculturalwater-use efficiency.
Sufficientamountsofrecycled,brackishand/orproducedwateravailablefor use
Important Important We selected the ‘Important’ rating for direct operations because while we use internal recycled and reused water in utilitiesand within our snacks and food operations, our ingredient standards limits how we can use brackish, recycled or producedwater in our beverage manufacturing processes. Our future dependency on brackish, recycled or produced water for ourmanufacturing processes could increase if there were specific and suitable uses for it to offset freshwater withdrawals. Wealso selected ‘Important’ rating for indirect operations because the power plants that provide energy to our operations andour suppliers may rely on recycled, brackish and/or produced water for cooling. In the future, we will still depend on sufficientamounts of produced and other water for cooling in the power plants that provide energy to our operations; our futuredependency on brackish, recycled or produced water for cooling could increase based on increased stress on freshwaterresources.
W-FB1.1a
(W-FB1.1a) Which water-intensive agricultural commodities that your organization produces and/or sources are the mostsignificant to your business by revenue? Select up to five.
Agriculturalcommodities
% of revenue dependent onthese agriculturalcommodities
Producedand/orsourced
Please explain
Maize 41-60 Sourced Revenue dependent on this commodity is disclosed as an aggregate of all commodities listed here.We do not have sufficient data to determine revenue dependence of each commodity at this time.
Palm oil 41-60 Sourced Revenue dependent on this commodity is disclosed as an aggregate of all commodities listed here.We do not have sufficient data to determine revenue dependence of each commodity at this time.
Sugar 41-60 Sourced Revenue dependent on this commodity is disclosed as an aggregate of all commodities listed here.We do not have sufficient data to determine revenue dependence of each commodity at this time.
Other, pleasespecify(Potatoes)
41-60 Sourced Revenue dependent on this commodity is disclosed as an aggregate of all commodities listed here.We do not have sufficient data to determine revenue dependence of each commodity at this time.
Other, pleasespecify(Wheat)
41-60 Sourced Revenue dependent on this commodity is disclosed as an aggregate of all commodities listed here.We do not have sufficient data to determine revenue dependence of each commodity at this time.
W1.2
(W1.2) Across all your operations, what proportion of the following water aspects are regularly measured and monitored?
% ofsites/facilities/operations
Please explain
Waterwithdrawals –total volumes
100% 100% of our manufacturing sites are measured and monitored. We track all water withdrawals on a monthly basis andhave done so since 2006, leveraging our enterprise-wide sustainability metrics platform, in which facilities areresponsible for entering water withdrawal data every month and the volumes of purchased water are obtained frominvoices or meter readings. Data collection methods are set out in our Data Excellence Governance and Controlsprotocol that documents detailed responsibilities and accountabilities for externally reported sustainability metrics.From source data in the field to data input to the data management system, this protocol calls for our sector teams’process and control owners to assure accuracy as part of this process. In addition, the protocol also calls for us totrack water withdrawal quarterly as part of our performance tracking and report against our sustainability goals; wemeasure progress against our operational water-use efficiency goal.
CDP Page of 673

Waterwithdrawals –volumes fromwater stressedareas
100% 100% of our manufacturing sites are measured and monitored. We track all water withdrawals on a monthly basisacross PepsiCo, leveraging our enterprise-wide sustainability metrics platform, in which facilities, including thoselocated in high water stressed areas, are responsible for entering their water withdrawal data every month, trackingvolumes of water purchased on invoices or meter readings. We also track our water withdrawal and usage efficiencyperformance quarterly as part of our sustainability goals, in which we measure progress against our operational water-use efficiency goal. Data collection adheres to our PepsiCo Data Excellence Governance and Controls protocol,where detailed responsibilities and accountabilities for externally reported sustainability metrics are documented.From source data in the field to data input to the data management system, this protocol calls for our sector teams’process and control owners to assure accuracy as part of this process.
Waterwithdrawals –volumes bysource
100% One hundred percent of our manufacturing sites track water withdrawal by source on a monthly basis and capture it inour enterprise-wide sustainability metrics tracking platform, in which facilities are responsible for entering their waterwithdrawal data every month, including from the volumes of purchased water as recorded on invoices or from meterreadings. Our enterprise-wide sustainability metrics platform allows us to measure and track performance in astandardized manner across our operations and it further supports our company strategy of digitization andautomation. Data collection methods are set out in our PepsiCo Data Excellence Governance and Controls protocol,where detailed responsibilities and accountabilities for externally reported sustainability metrics are documented.From source data in the field to data input to the data management system, this protocol calls for our sector teams’process and control owners to assure accuracy as part of this process.
Entrained waterassociated withyour metals &mining sectoractivities - totalvolumes [onlymetals andmining sectors]
<Not Applicable> <Not Applicable>
Produced waterassociated withyour oil & gassector activities- total volumes[only oil andgas sector]
<Not Applicable> <Not Applicable>
Waterwithdrawalsquality
100% The quality of incoming water is critical to our finished products. One hundred percent of our beverage operations trackand monitor quality of raw water withdrawals on at least a quarterly basis, using the WHO Potable Water Standardand leveraging our enterprise-wide sustainability metrics platform, which allows us to measure and track performancein a standardized manner across our operations and it further supports our company strategy of digitization andautomation. Data collection methods are set out in our PepsiCo Data Excellence Governance and Controls protocol,where detailed responsibilities and accountabilities for externally reported sustainability metrics are documented.From source data in the field to data input to the data management system, this protocol calls for our sector teams’process and control owners to assure accuracy as part of this process.
Waterdischarges –total volumes
100% One hundred percent of our manufacturing operations track and monitor volume of water discharges on at least aquarterly basis, leveraging our enterprise-wide sustainability metrics platform, which allows us to measure and trackperformance in a standardized manner across our operations and it further supports our company strategy ofdigitization and automation. Data collection methods are set out in our PepsiCo Data Excellence Governance andControls protocol, where detailed responsibilities and accountabilities for externally reported sustainability metrics aredocumented. From source data in the field to data input to the data management system, this protocol calls for oursector teams’ process and control owners to assure accuracy as part of this process.
Waterdischarges –volumes bydestination
76-99 Seventy-seven percent of our manufacturing operations track and monitor water discharges on at least a quarterlybasis, leveraging our enterprise-wide sustainability metrics platform, which allows us to measure and trackperformance in a standardized manner across our operations and it further supports our company strategy ofdigitization and automation. Data collection methods are set out in our PepsiCo Data Excellence Governance andControls protocol, where detailed responsibilities and accountabilities for externally reported sustainability metrics aredocumented. From source data in the field to data input to the data management system, this protocol calls for oursector teams’ process and control owners to assure accuracy as part of this process.
Waterdischarges –volumes bytreatmentmethod
100% One hundred percent of our manufacturing operations track and monitor wastewater discharges on a monthly basis,leveraging our enterprise-wide sustainability metrics platform, which allows us to measure and track performance in astandardized manner across our operations and it further supports our company strategy of digitization andautomation. Data collection methods are set out in our PepsiCo Data Excellence Governance and Controls protocol,where detailed responsibilities and accountabilities for externally reported sustainability metrics are documented.From source data in the field to data input to the data management system, this protocol calls for our sector teams’process and control owners to assure accuracy as part of this process.
Waterdischargequality – bystandardeffluentparameters
100% One hundred percent of our manufacturing operations track and monitor water discharges on a monthly basis,leveraging our enterprise-wide sustainability metrics platform, which allows us to measure and track performance in astandardized manner across our operations and it further supports our company strategy of digitization andautomation. Data collection adheres to our PepsiCo Data Excellence Governance and Controls protocol, wheredetailed responsibilities and accountabilities for externally reported sustainability metrics are documented. Fromsource data in the field to data input to the data management system, this protocol calls for our sector teams’ processand control owners to assure accuracy as part of this process.
% ofsites/facilities/operations
Please explain
CDP Page of 674

Waterdischargequality –temperature
51-75 Fifty-one percent of our manufacturing operations track and monitor water discharge quality- temperature. We trackwater discharge quality - temperature where and when it is required by permit. Data collection adheres to our PepsiCoData Excellence Governance and Controls protocol, where detailed responsibilities and accountabilities for externallyreported sustainability metrics are documented. From source data in the field to data input to the data managementsystem, this protocol calls for our sector teams’ process and control owners to assure accuracy as part of this process.
Waterconsumption –total volume
100% One hundred percent of our manufacturing operations track and monitor water consumption at least quarterly,leveraging our enterprise-wide sustainability metrics platform, which allows us to measure and track performance in astandardized manner across our operations and it further supports our company strategy of digitization andautomation. Data collection methods are set out in our PepsiCo Data Excellence Governance and Controls protocol,where detailed responsibilities and accountabilities for externally reported sustainability metrics are documented.From source data in the field to data input to the data management system, this protocol calls for our sector teams’process and control owners to assure accuracy as part of this process.
Waterrecycled/reused
100% All manufacturing sites recycling or reusing water track this volume monthly using meter readings from theirmembrane bioreactors (MBRs) and reverse osmosis (RO) systems, leveraging our enterprise-wide sustainabilitymetrics platform, which allows us to measure and track performance in a standardized manner across all ouroperations and it further supports our company strategy of digitization and automation. Data collection methods areset out in our PepsiCo Data Excellence Governance and Controls protocol, where detailed responsibilities andaccountabilities for externally reported sustainability metrics are documented. From source data in the field to datainput to the data management system, this protocol calls for our sector teams’ process and control owners to assureaccuracy as part of this process.
The provision offully-functioning,safely managedWASH servicesto all workers
100% PepsiCo’s internal self-assessment program to measure water, sanitation, and hygiene (WASH) compliance takesplace annually and has been implemented at all company-owned plants. We use a WASH self-audit questionnairethat is sent out to all of our company-owned manufacturing facilities. However, if a facility is scheduled for an annualexternal audit it would not complete a self-audit. In line with our 2025 agenda, we have set a goal to provideappropriate access to WASH for all of our own manufacturing locations by 2025. By the end of 2018, ourmanufacturing facilities' WASH conformance was at 92 percent. Annual audits are conducted for compliance per ourinternal PepsiCo governance documents.
% ofsites/facilities/operations
Please explain
W1.2b
(W1.2b) What are the total volumes of water withdrawn, discharged, and consumed across all your operations, and how dothese volumes compare to the previous reporting year?
Volume(megaliters/year)
Comparisonwithpreviousreportingyear
Please explain
Totalwithdrawals
86702 Lower Three percent less water volume was withdrawn compared with last year. This decrease was due to water reductioninitiatives implemented towards our water-use efficiency sustainability goal. In the future, it is possible that thevolume of water withdrawals could decrease due to our investments in water reduction initiatives. PepsiCo has astrong water sustainability innovation pipeline which is coupled with a centralized environmental sustainabilitycapital investment fund. For example, some innovative projects currently being commercialized and deployedacross our company include a successful 2018 R&D pilot in which we tested a mechanism to treat potato fryersteam back to potable water equivalent, offsetting the need for freshwater. Another project successfully redesigneda potato slicing and lubricating component which allows a 64% reduction in water used.
Totaldischarges
51168 Lower We discharged less water in 2018 than we did in 2017. This decrease is due in part as a result of our investments inwater reduction initiatives. In the future, it is possible that our total discharges may continue to decrease due to ourinvestments in water efficiency. Utilizing the formula C = W-D, please note that this figure does not match the sumof the water withdrawal by source figures reported in W1.2i as we do not currently track water discharges to alldestination categories listed.
Totalconsumption
35534 Higher We are reporting a higher total consumption in 2018 as compared to 2017. PepsiCo continues to drive waterefficiency across our manufacturing locations, which has in turn lowered consumption. By driving technologyinnovation through our R+D and Food safety groups we are developing industry-leading water efficient technology.We continue to leverage our PepsiCo Resource Conservation program (ReCon) across all our company ownedoperations from front line to plant director. Continuous improvement is very much the ethos of PepsiCo. Futuretrends in our water consumption are expected to be driven by our water efficiency investments and globalreapplication of best practices through our Resource Conservation (ReCon) program. In the future, it is possiblethat the volume of water consumption could decrease as a result of our water reduction initiatives. However, ourconsumption is also tied to our production volumes.
W1.2d
CDP Page of 675

(W1.2d) Provide the proportion of your total withdrawals sourced from water stressed areas.
%withdrawnfromstressedareas
Comparisonwithpreviousreportingyear
Identificationtool
Please explain
Row1
26 Lower WRIAqueduct
In 2018, our operations withdrew 3% less water in water-stressed areas than in 2017 thanks to a combination oftactics under our operational water use efficiency strategy such as Resource Conservation Captain training, plants'efficiency improvements, including RO Bootcamp, strong operations leadership engagement, front-line engagementand behavior-based programs, technology investment, best practice redeployment, and R&D and QA innovationsin process and technology innovation. PepsiCo conducts detailed manufacturing location water stress assessmentsevery three years - leveraging WRI Aqueduct and a detailed site risk assessment, encompassing context, physical,regulatory, social, and reputational risks. PepsiCo used WRI Aqueduct as it is designed to help users understandwhere and how water risks are emerging worldwide. In order to get more granular and nuanced perspectives of onthe ground risks, we also utilized local site surveys at all company-owned facilities. Collectively, we determined thelevel of water risk in three categories: physical, regulatory and reputational/social. Both current risk and anticipatedfuture water risk were assessed and assigned a risk score. All sites with a score in excess of 3.5 (out of 5) weredesignated as high water risk. Additional sites with a lower score were designated as high water risk based on localknowledge.
W-FB1.2e
(W-FB1.2e) For each commodity reported in question W-FB1.1a, do you know the proportion that is produced/sourced fromwater stressed areas?
Agriculturalcommodities
Theproportionof thiscommodityproduced inwaterstressedbasins isknown
Theproportionof thiscommoditysourcedfrom waterstressedbasins isknown
Please explain
Maize Notapplicable
Yes This information is based on our agricultural water risk assessment, completed as part of our agricultural waterefficiency goal. We utilized the WRI Aqueduct tool to identify our water stressed growing areas.
Othercommoditiesfrom W-FB1.1a,pleasespecify(Potatoes)
Notapplicable
Yes This information is based on our agricultural water risk assessment, completed as part of our agricultural waterefficiency goal. We utilized the WRI Aqueduct tool to identify our water stressed growing areas.
Palm oil Notapplicable
No, notcurrently butwe intend tocollect thisdata withinthe next twoyears
Palm oil was not in scope for our agricultural water efficiency goal, so this information is not available as part of ouragricultural water risk assessment. In 2018 we enlisted Verisk Maplecroft, a global research firm and risk consultancy,to conduct a comprehensive risk assessment of 25 of our top agricultural raw materials and sourcing origins to betterunderstand the supply chains and geographic regions where we should prioritize our efforts. The assessment includesan evaluation of several dimensions of environmental risks, including water. The results of this assessment will helpinform sustainable agriculture strategy and we intend to collect this data within the next two years.
Sugar Notapplicable
No, notcurrently butwe intend tocollect thisdata withinthe next twoyears
Sugar was not in scope for our agricultural water efficiency goal, so this information is not available as part of ouragricultural water risk assessment. In 2018 we enlisted Verisk Maplecroft, a global research firm and risk consultancy,to conduct a comprehensive risk assessment of 25 of our top agricultural raw materials and sourcing origins to betterunderstand the supply chains and geographic regions where we should prioritize our efforts. The assessment includesan evaluation of several dimensions of environmental risks, including water. The results of this assessment will helpinform sustainable agriculture strategy and we intend to collect this data within the next two years.
Othercommoditiesfrom W-FB1.1a,pleasespecify(Wheat)
Notapplicable
No, notcurrently butwe intend tocollect thisdata withinthe next twoyears
Wheat was not in scope for our agricultural water efficiency goal, so this information is not available as part of ouragricultural water risk assessment. In 2018 we enlisted Verisk Maplecroft, a global research firm and risk consultancy,to conduct a comprehensive risk assessment of 25 of our top agricultural raw materials and sourcing origins to betterunderstand the supply chains and geographic regions where we should prioritize our efforts. The assessment includesan evaluation of several dimensions of environmental risks, including water. The results of this assessment will helpinform sustainable agriculture strategy and we intend to collect this data within the next two years.
CDP Page of 676

W-FB1.2g
(W-FB1.2g) What proportion of the sourced agricultural commodities reported in W-FB1.1a originate from water stressedareas?
Agriculturalcommodities
% of totalagriculturalcommodity sourcedin water stressedareas
Please explain
<NotApplicable>
47 47% of our whole maize volume originates from water stressed areas and is in-scope of PepsiCo’s agriculture water efficiencygoal. This figure is unchanged from prior reporting years. This figure was calculated as part of our baselining exercise for theagriculture water efficiency goal. The figure could either increase or decrease in future years depending on changes to ourprocurement of maize.
<NotApplicable>
47 47% of our potato volume originates from water stressed areas and is in-scope of PepsiCo’s agriculture water efficiency goal.This figure was calculated as part of our baselining exercise for the agriculture water use efficiency goal. This figure isunchanged from prior reporting years. The figure could either increase or decrease in future years depending on changes toour procurement of potatoes.
<NotApplicable>
W1.2h
(W1.2h) Provide total water withdrawal data by source.
Relevance Volume(megaliters/year)
Comparisonwithpreviousreportingyear
Please explain
Fresh surfacewater, includingrainwater, waterfrom wetlands,rivers, and lakes
Relevant 112 Higher Fresh surface water accounts for a very small percentage of PepsiCo's source water supply.Our goal is to increase this volume in the future through investment in rainwater harvesting,where appropriate to do so. As PepsiCo incentivizes rainwater harvesting within its operations,we can see the resulting benefits; rainwater volume used in plants has increased by 89% overprior year. However, given the small overall percentage that fresh surface water accounts for,the volume of water withdrawn was about the same as what we reported last year and freshsurface water, including rainwater, water from wetlands, rivers and lakes still represents a verysmall percentage of the total water withdrawals.
Brackish surfacewater/Seawater
Relevant 273 Lower Our ingredient and food safety standards mean that we cannot use brackish water in ourmanufacturing processes. The power plants that provide energy to our operations and oursuppliers may rely on recycled and/or brackish water for cooling. Some countries in whichPepsiCo operates, such as Saudi Arabia, produce municipal fresh water through desalinationsystems. PepsiCo currently has no future plans to incorporate brackish surface water orseawater into our water sourcing, so we do not currently anticipate any changes to this in thefuture. However, our future dependency on brackish, recycled or produced water for ourmanufacturing processes could increase if there were specific and suitable uses for it to offsetfreshwater withdrawals. This volume is lower than what we reported last year due in part due toproduction changes in locations that utilize brackish or seawater.
Groundwater –renewable
Relevant 24995 About thesame
Renewable groundwater is PepsiCo’s second largest source of water withdrawals (after third-party or municipal sources). We withdrew approximately the same amount of groundwater in2018 as we did in 2017, as our efficiencies this year were focused on the amount of water wesourced from third parties. In the future, as we continue to drive water-use efficiency across ourbusiness we could see less groundwater withdrawals.
Groundwater –non-renewable
Notrelevant
<Not Applicable> <NotApplicable>
PepsiCo does not draw from non-renewable groundwater sources and does not plan to do so inthe future.
Produced/Entrainedwater
Relevant 5 About thesame
PepsiCo does not rely on or draw produced or process water, and does not plan to do so in thefuture.
Third party sources Relevant 61317 Lower Third party sources represent the largest source of PepsiCo’s water withdrawals. We reducedthis amount by nearly 4% between 2017 and 2018 through water efficiency efforts. This volumemay decrease as we continue to drive water-use efficiency across our business but it will likelyremain our largest withdrawal source.
CDP Page of 677

W1.2i
(W1.2i) Provide total water discharge data by destination.
Relevance Volume(megaliters/year)
Comparisonwithpreviousreportingyear
Please explain
Fresh surfacewater
Relevantbut volumeunknown
<Not Applicable> <NotApplicable>
We are unable to answer this question this year but intend to next year.
Brackishsurfacewater/seawater
Relevantbut volumeunknown
<Not Applicable> <NotApplicable>
We are unable to answer this question this year but intend to next year.
Groundwater Relevant 1634 Lower This is the first year we are reporting a volume of water by destination. Groundwater is relevant as itis the second-largest destination for our wastewater. As our water withdrawals have decreased, ourwastewater discharges have also decreased. We anticipate the same trend in the future.
Third-partydestinations
Relevant 40437 Lower This is the first year we are reporting a volume of water by destination. Third party destinations arerelevant as they represent the largest destination for our wastewater. As our water withdrawals havedecreased, our wastewater discharges have also decreased. We anticipate the same trend in thefuture.
W1.2j
(W1.2j) What proportion of your total water use do you recycle or reuse?
%recycledandreused
Comparisonwithpreviousreportingyear
Please explain
Row1
1-10 Higher We have increased our volumes of water recycled/reused across our company by a further 0.4% in 2018. Our water efficiencystrategy builds on the successes we have already achieved in water reuse technology, particularly in our foods business. We havebeen continuing our investment strategy in water reuse technology such as membrane bioreactor/reverse osmosis (MBR/RO)technology in Latin America, and India during 2018, and the savings off setting freshwater usage are being realised during the year.At the end of 2018 we had 18 active MBR Systems within our company owned operations, 9 of which are producing potable wateroffsetting freshwater usage within our process, the remaining 9 offset freshwater into our site utilities plants - non product contact.Our strategy is to continue to increase the percentage of recycled water across our foods business, particularly at hour high water risklocations, which will further reduce our dependence on freshwater at these priority locations. Our capital investment plan is supportedby our Corporate Planet fund.
W-FB1.3
CDP Page of 678

(W-FB1.3) Do you collect/calculate water intensity for each commodity reported in question W-FB1.1a?
Agriculturalcommodities
Water intensityinformation for thisproducedcommodity iscollected/calculated
Water intensityinformation for thissourced commodityiscollected/calculated
Please explain
Maize Not applicable Yes We have a goal to improve the water-use efficiency of our direct agricultural supply chain by 15% by2025 in high-water-risk sourcing areas against a 2015 baseline. Maize is in-scope for this goal. We aremeasuring theoretical water-use efficiency based on applied water, which will be validated and refinedthrough in-field measurements. In collaboration with WRI, we undertook a study to evaluate our highwater risk crops, and we utilized the UN Food and Agriculture Organization’s (FAO) Cropwat 8modelling tool to determine our baseline crop water footprint. We gathered the baseline data andprogress through the 2017 crop year. For each farmer group, we have calculated their baseline wateropportunity and identified local goals and implementation plans.
Othercommoditiesfrom W-FB1.1a,pleasespecify(Potatoes)
Not applicable Yes We have a goal to improve the water-use efficiency of our direct agricultural supply chain by 15% by2025 in high-water-risk sourcing areas against a 2015 baseline. Potatoes are in-scope for this goal. Weare measuring theoretical water-use efficiency based on applied water, which will be validated andrefined through in-field measurements. In collaboration with WRI, we undertook a study to evaluate ourhigh water risk crops, and we utilized the UN Food and Agriculture Organization’s (FAO) Cropwat 8modelling tool to determine our baseline crop water footprint. We gathered the baseline data andprogress through the 2017 crop year. For each farmer group, we have calculated their baseline wateropportunity and identified local goals and implementation plans.
Palm oil Not applicable Yes PepsiCo’s Sustainable from the Start Program (SftS) aims to incorporate life cycle thinking into allaspects of new product development. The goal of the program is to ensure that our new products aremore sustainable right out of the gate. We evaluate sustainability by looking at lifecycle carbon andwater impacts of our products and recyclability of our packaging. Life cycle impacts include everythingfrom growing the agricultural ingredients, manufacturing, packaging and moving the product, anddisposing of the packaging. SftS includes water impact factors for all of our agricultural ingredients,including palm oil.
Sugar Not applicable Yes PepsiCo’s Sustainable from the Start Program (SftS) aims to incorporate life cycle thinking into allaspects of new product development. The goal of the program is to ensure that our new products aremore sustainable right out of the gate. We evaluate sustainability by looking at lifecycle carbon andwater impacts of our products and recyclability of our packaging. Life cycle impacts include everythingfrom growing the agricultural ingredients, manufacturing, packaging and moving the product, anddisposing of the packaging. SftS includes water impact factors for all of our agricultural ingredients,including sugar.
Othercommoditiesfrom W-FB1.1a,pleasespecify(Wheat)
Not applicable Yes PepsiCo’s Sustainable from the Start Program (SftS) aims to incorporate life cycle thinking into allaspects of new product development. The goal of the program is to ensure that our new products aremore sustainable right out of the gate. We evaluate sustainability by looking at lifecycle carbon andwater impacts of our products and recyclability of our packaging. Life cycle impacts include everythingfrom growing the agricultural ingredients, manufacturing, packaging and moving the product, anddisposing of the packaging. SftS includes water impact factors for all of our agricultural ingredients,including wheat.
W-FB1.3b
(W-FB1.3b) Provide water intensity information for each of the agricultural commodities identified in W-FB1.3 that yousource.
Agricultural commodities<Not Applicable>
Water intensity value (m3)513
Numerator: Water aspectTotal water withdrawals
Denominator: Unit of productionOther, please specify (Metric tons)
Comparison with previous reporting yearLower
Please explainWe have a global goal to improve water-use efficiency in our high water risk direct agricultural supply chain by 15 percent by 2025.We undertook a study to evaluate our high water risk crops, and we utilized the UN FAO Cropwat 8 modelling tool to determine our
CDP Page of 679

baseline crop water footprint. We gathered the baseline data and progress through the 2017 crop year (which ended in 2018calendar year). We calculated each farmer group's baseline water opportunity and identified local goals and implementation plans.We calculated water intensity of corn as 513 m3 of water per metric ton of corn, which reflected 1 m3 of water per metric ton of cornimprovement from 2015. Some of the ways we work with farmers include helping them access more efficient irrigation equipment,supporting best practices for scheduling and maintenance, and enabling them to move from flood irrigation to more efficientmethods like drip irrigation. We expect the water intensity to continue to decrease in the future.
Agricultural commodities<Not Applicable>
Water intensity value (m3)175
Numerator: Water aspectTotal water withdrawals
Denominator: Unit of productionOther, please specify (Metric tons)
Comparison with previous reporting yearMuch lower
Please explainWe set a global goal to improve water-use efficiency in our high water risk direct agricultural supply chain by 15 percent by 2025.We undertook a study to evaluate our high water risk crops, and we utilized the UN FAO Cropwat 8 modelling tool to determine ourbaseline crop water footprint. We gathered the baseline data and progress through the 2017 crop year (which ended in 2018calendar year). For each farmer group, we have calculated their baseline water opportunity and identified local goals andimplementation plans. We calculated water intensity of potatoes as 175 m3 of water per metric ton of potato, an improvement from182 m3 of water per metric ton of potato since 2015. We work with farmers by helping them access more efficient irrigationequipment, supporting best practices for scheduling and maintenance, and enabling them to move from flood irrigation to moreefficient methods, such as drip irrigation. We expect the water intensity to continue to decrease in the future.
Agricultural commodities<Not Applicable>
Water intensity value (m3)4692
Numerator: Water aspectOther, please specify (Footprint indicator)
Denominator: Unit of productionOther, please specify (Metric tons)
Comparison with previous reporting yearThis is our first year of measurement
Please explainPepsiCo’s Sustainable from the Start Program (SftS) aims to incorporate life cycle thinking into all aspects of new productdevelopment. The goal of the program is to ensure that our new products are more sustainable right out of the gate. We evaluatesustainability by looking at lifecycle carbon and water impacts of our products and recyclability of our packaging. Life cycle impactsinclude the water impact of growing agriculture ingredients, and the water intensity value for palm oil is included here. As this is ourfirst year of measurement, we are not able to compare to previous reporting year and will wait to anticipate future trends until weevaluate the data.
Agricultural commodities<Not Applicable>
Water intensity value (m3)1562
Numerator: Water aspectOther, please specify (Footprint indicator)
Denominator: Unit of productionOther, please specify (Metric tons)
CDP Page of 6710

Comparison with previous reporting yearThis is our first year of measurement
Please explainPepsiCo’s Sustainable from the Start Program (SftS) aims to incorporate life cycle thinking into all aspects of new productdevelopment. The goal of the program is to ensure that our new products are more sustainable right out of the gate. We evaluatesustainability by looking at lifecycle carbon and water impacts of our products and recyclability of our packaging. Life cycle impactsinclude the water impact of growing agriculture ingredients, and the water intensity value for sugarcane is included here. As this isour first year of measurement, we are not able to compare to previous reporting year and will wait to anticipate future trends until weevaluate the data.
Agricultural commodities<Not Applicable>
Water intensity value (m3)1620
Numerator: Water aspectOther, please specify (Footprint indicator)
Denominator: Unit of productionOther, please specify (Metric tons)
Comparison with previous reporting yearThis is our first year of measurement
Please explainPepsiCo’s Sustainable from the Start Program (SftS) aims to incorporate life cycle thinking into all aspects of new productdevelopment. The goal of the program is to ensure that our new products are more sustainable right out of the gate. We evaluatesustainability by looking at lifecycle carbon and water impacts of our products and recyclability of our packaging. Life cycle impactsinclude the water impact of growing agriculture ingredients, and the water intensity value for wheat is included here. As this is ourfirst year of measurement, we are not able to compare to previous reporting year and will wait to anticipate future trends until weevaluate the data.
W1.4
(W1.4) Do you engage with your value chain on water-related issues?Yes, our suppliersYes, our customers or other value chain partners
W1.4a
CDP Page of 6711

(W1.4a) What proportion of suppliers do you request to report on their water use, risks and/or management information andwhat proportion of your procurement spend does this represent?
Row 1
% of suppliers by numberUnknown
% of total procurement spend26-50
Rationale for this coverageOur Sustainable Farming Program (SFP) (formerly our Sustainable Farming Initiative, or SFI), is a program we use to engage withgrowers on farms of all sizes and types around the world in order to encourage continual improvement in sustainable farmingpractices, expand respect for workers' human rights, enhance growers' capabilities, and address risks. We have initiated SFP withfarmers from which we source directly, given our existing relationships with those farmers and the importance of directly sourcedagricultural raw materials to the continuity of our business. This coverage is part of our ongoing efforts related to our agriculturalwater efficiency goal. We select suppliers for reporting based on their business activity (farming), relationship to PepsiCo (directsuppliers) and location (water-stressed regions). Incentives - It is expected that by participating in this engagement, they will benefitfrom SFPs tools, learnings, and best practices.
Impact of the engagement and measures of successWithin PepsiCo, this information is used to create a strategy for water-use efficiency improvements. The information requestedfrom suppliers includes on-farm water management practices and the methods and timing for how they plan on improving water-use efficiency in their operations. For us, success here would be an improvement in water-use efficiency. The percentage of FarmManagement Groups (FMGs) engaged is one metric by which we are measuring progress. The second metric - representing ourultimate objective - is the percentage of directly sourced agricultural raw materials that we have verified as sustainably sourced. In2018, this number was 51%.
CommentThis response is in regards to our agricultural supply chain. At this time, we are not able to report the percent of suppliers bynumber that report on their water use, risks and/or management information. Our water stewardship program is based onaddressing key areas of risk across the PepsiCo value chain.
W1.4b
CDP Page of 6712

(W1.4b) Provide details of any other water-related supplier engagement activity.
Type of engagementInnovation & collaboration
Details of engagement<Not Applicable>
% of suppliers by number<Not Applicable>
% of total procurement spend<Not Applicable>
Rationale for the coverage of your engagementOur Sustainable Farming Program (SFP) (formerly our Sustainable Farming Initiative, or SFI), is a program we use to engage withgrowers on farms of all sizes and types around the world in order to encourage continual improvement in sustainable farmingpractices, expand respect for workers' human rights, enhance growers' capabilities, and address risks. We have initiated SFP withfarmers from which we source directly, given our existing relationships with those farmers and the importance of directly sourcedagricultural raw materials to the continuity of our business. We believe that both incentivizing innovation and providing training andsupport on sustainable agriculture practices are crucial for farmers to improve those practices.
Impact of the engagement and measures of success<Not Applicable>
Comment<Not Applicable>
Type of engagementIncentivizing for improved water management and stewardship
Details of engagement<Not Applicable>
% of suppliers by number<Not Applicable>
% of total procurement spend<Not Applicable>
Rationale for the coverage of your engagementWe believe that incentivizing farmers for improved water management and stewardship practices is crucial for them to improvethose practices.
Impact of the engagement and measures of success<Not Applicable>
Comment<Not Applicable>
W1.4c
CDP Page of 6713

(W1.4c) What is your organization’s rationale and strategy for prioritizing engagements with customers or other partners inits value chain?
We value our collaborations with other stakeholders and are actively involved in creating and fostering pre-competitive collaborationsto improve water security. Stakeholders include peer companies, as well as non-profit organizations and industry groups. Theseengagements help us learn about emerging sustainability topics, better inform our efforts, and help us work to create value forsociety. We use a variety of mechanisms to solicit feedback from our stakeholders, including bilateral meetings and participation instakeholder networks, outreach programs, webinars and working together on a wide variety of topics, including water. Someexamples of our water-related value chain engagements are provided here. We work with value chain partners and certificationschemes. As an example, along with Walmart and others, PepsiCo is a founding member of the Midwest Row Crop Collaborative(MRCC). MRCC is a diverse coalition of industry and nonprofit groups working to expand agricultural solutions that protect air andwater quality and enhance soil health. In another example, in 2018 PepsiCo provided full access to our Sustainable Farming Program(SFP) Toolkit with the SAI Platform. The SFP Toolkit is an elaborate set of training materials, workshop activities, guides andexercises to support farmers in adopting more sustainable agriculture practices. Sharing this Toolkit will help the SAI Platformstrengthen the reach and adoption of its Farm Sustainability Assessment program. One measure of success is the increasedadoption of sustainable agriculture practices at a large scale. We are strong believers that collaboration can be a powerful driver ofchange. That is why we actively work with several organizations that foster insights and best practice sharing on agricultural practiceswithin the global food and beverage and related industries. In addition to the SAI Platform, these also include Cool Farm Alliance andField to Market Initiative.
W2. Business impacts
W2.1
(W2.1) Has your organization experienced any detrimental water-related impacts?No
W2.2
(W2.2) In the reporting year, was your organization subject to any fines, enforcement orders, and/or other penalties forwater-related regulatory violations?Yes, fines, enforcement orders or other penalties but none that are considered as significant
W2.2a
(W2.2a) Provide the total number and financial value of all water-related fines.
Row 1
Total number of fines7
Total value of fines39804
% of total facilities/operations associated0.02
Number of fines compared to previous reporting yearAbout the same
Comment
CDP Page of 6714

W3. Procedures
W-FB3.1
(W-FB3.1) How does your organization identify and classify potential water pollutants associated with its food, beverage,and tobacco sector activities that could have a detrimental impact on water ecosystems or human health?
PepsiCo has strict requirements for incoming and effluent water quality at our facilities, and we require adherence to the Company'sstandards, or local regulatory standards, whichever is more stringent. Methods used to identify potential pollutants includingstandards used: PepsiCo’s Global Environment, Health and Safety Management System is a set of management and technicalstandards that provide guidance on acceptable and applicable operating parameters for our operations. Wastewater constituents thatare considered pollutants and monitored vary depending on the type of facility, their discharge destinations, and local requirements,but PepsiCo standard parameters include biochemical oxygen demand (BOD), chemical oxygen demand (COD), total suspendedsolids (TSS), total Nitrogen, Phosphorous, Oil and grease, pH, Temperature, and Fecal coliform or E. coli. These are categorized bythe type of facility discharging the wastewater and we monitor each separately. Our level of concern of and discharge standards foreach of these parameters is dependent on local conditions such as the receiving body of water’s quality and local ecosystems. Onetechnical standard that we use is the Discharge of Process Wastewater Standard, which is aligned with the World Bank’sInternational Finance Council and Business for Social Responsibility’s (BSR) Sustainable Water Group. Types of impacts on humansand ecosystems: We have identified the chemical, biological, and physical properties of water outlined in our standard as ones thatcould negatively affect human and ecosystem use. Examples of impacts include potential eutrophication and groundwatercontamination. Value chain & variations across value chain: Within our value chain, agrochemicals are one of the nine pillars underour Sustainable Farming Program (formerly referred to as our Sustainable Farming Initiative), providing a platform through whichPepsiCo gathers information on pesticide management and application, including measures to support safe, legal and responsibleuse while minimizing agrochemical application through practices such as Integrated Pest Management (IPM). The agrochemical pillarincludes four fundamental principles that are required and three progressive principles that are encouraged. Because we source frommany countries, local watershed considerations may vary across our value chain. For example, in the United States, excess nutrientsare the main driver of the growth of algae blooms and harmful conditions for aquatic life in the Chesapeake Bay. And in India, thelargest source of water pollution is untreated effluent and are more relevant concerns for all water stakeholders.
W-FB3.1a
(W-FB3.1a) Describe how your organization minimizes the adverse impacts of potential water pollutants on waterecosystems or human health associated with your food, beverage, and tobacco sector activities.
Potential water pollutantOther, please specify (Organic matter)
Activity/value chain stageManufacturing – direct operations
Response shortened due to character limits: "Other, properties of water that can negatively affect human and ecosystem use"
Description of water pollutant and potential impactsBiological oxygen demand (BOD) refers to the amount of dissolved oxygen needed by aerobic biological organisms to break downorganic material in water. Untreated wastewater from beverage operations that includes organic materials has the potential toreduce dissolved oxygen. BOD can therefore pose a risk to aquatic ecosystems of receiving water bodies.
Management proceduresWaste water managementFollow regulation standards
Please explainPepsiCo has set a goal to have 100 percent of wastewater from our operations meet PepsiCo’s high standards for protection of theenvironment. Success is measured according to this goal and against our wastewater standard. As part of this wastewaterstandard, we have set a limit of 50 mg BOD/L of wastewater discharged from our manufacturing facilities. Each of our facilitieshave written wastewater management plans that define the specific policies and procedures in place to manage wastewater-associated environmental aspects and impacts. These management procedures, as well as our effluent treatment infrastructure,help us ensure that we meet our target of 50mg/L to avoid the associated risk of disrupting any aquatic ecosystems with reducingdissolved oxygen.
CDP Page of 6715

Potential water pollutantFertilizers
Activity/value chain stageAgriculture – supply chain
Description of water pollutant and potential impactsWe recognize the potential impacts of fertilizers (such as phosphorous loading which can speed up eutrophication in aquaticenvironments) and have therefore incorporated best management practices for fertilizers into our Sustainable Agriculture Policy.For example, our Sustainable Farming Program trains farmers on optimal fertilizer management. For both our direct agriculturaloperations as well as our agricultural supply chain operations, the scale and magnitude of the potential impacts of fertilizers isdependent on local conditions, including the on-farm management practices, the crops being grown and fertilizers used, and theproximity to water sources.
Management proceduresSoil conservation practicesCrop management practicesSustainable irrigation and drainage managementFertilizer managementCalculation of fertilizer intensity dataWaste water managementFollow regulation standards
Please explainPepsiCo aims to optimize the applied water footprint to crop and livestock systems, as well as responsibly manage runoff risks ofpollution or contamination of ground or surface water with pesticides, nutrients, or soil. PepsiCo aims to work with farmers todevelop effective water management plans for addressing water risk. We evaluate success by routinely evaluating farmercompliance with our Sustainable Farming Program, including the implementation of fertilizer management through our farmerengagement. To achieve compliance with our Sustainable Farming Program, farmers must demonstrate adoption of bestmanagement practices.
Potential water pollutantPesticides and other agrochemical products
Activity/value chain stageAgriculture – direct operationsAgriculture – supply chain
Description of water pollutant and potential impactsWe recognize the potential impacts of pesticides and other agrochemical products as listed here and have therefore incorporatedthem into our Sustainable Farming Program and in our efforts in engaging with farmers. For both our direct agricultural operationsas well as our agricultural supply chain operations, the scale and magnitude of the potential impacts of pesticides is dependent onlocal conditions, including the on-farm management practices, the crops being grown and pesticides used, and the proximity towater sources.
Management proceduresSoil conservation practicesCrop management practicesSustainable irrigation and drainage managementPesticide managementSubstitution of pesticides for less toxic or environmentally hazardous alternativesWaste water managementFollow regulation standards
Please explainWe track the progress of our growers who have integrated pest management (IPM) that meets our minimum expectations. PepsiCois in the process of engaging with our agriculture teams and growers to support the growers and implementing IPM improvementprograms, including training on what constitutes an acceptable IPM that is appropriate for the size/capability of the grower and alsoto build the business case to adopt IPM. Our goal is 100% compliance with our SFP, and we plan to leverage third-party verificationto ensure that growers are using the right practices, including IPM. The impact of IPM on pesticide application will vary according toa complex set of factors, including crop type, region and climate but, in principle IPM supports the reduction in the amount ofpesticides used.
Potential water pollutantManure and slurries
CDP Page of 6716

Activity/value chain stageAgriculture – direct operationsAgriculture – supply chain
Description of water pollutant and potential impactsFor both our direct agricultural operations as well as our agricultural supply chain operations, the scale and magnitude of thepotential impacts of manure and slurries are dependent on local conditions, including the on-farm management practices, the wastemanagement procedures, and the proximity to water sources.
Management proceduresAnimal waste managementLivestock managementWaste water management
Please explainPepsiCo aims to optimize the applied water footprint to crop and livestock systems, as well as responsibly manage runoff risks ofpollution or contamination of ground or surface water with pesticides, nutrients or soil. PepsiCo aims to work with farmers todevelop effective water management plans for addressing water risk. We routinely evaluate farmer compliance with ourSustainable Farming Program, including the implementation of manure and slurries management, where applicable. To achievecompliance with our Sustainable Farming Program, farmers must demonstrate adoption of best management practice. This is ofparticular relevance to our dairy operations and suppliers in Russia and Eastern Europe.
W3.3
(W3.3) Does your organization undertake a water-related risk assessment?Yes, water-related risks are assessed
W3.3a
(W3.3a) Select the options that best describe your procedures for identifying and assessing water-related risks.
CDP Page of 6717

Direct operations
CoverageFull
Risk assessment procedureWater risks are assessed as part of an enterprise risk management framework
Frequency of assessmentSix-monthly or more frequently
How far into the future are risks considered?>6 years
Type of tools and methods usedTools on the marketInternational methodologiesOther
Tools and methods usedWRI AqueductAlliance for Water Stewardship StandardInternal company methodsExternal consultants
CommentIn addition to the global operations water risk assessments described below, we identify and assess water-related risks through anEnterprise Risk Management process on a 6-month time frame. For our global operations assessment, we use the WRI Aqueducttool, combined with local site surveys, to determine the level of water risk in three categories: physical, regulatory andreputational/social. Both current risk and anticipated future water risk were assessed and assigned a risk score. We conduct this fulloperations water risk assessment every three years, but we review and assess our water risk every year based on changes to thebusiness and our facilities. In addition, we joined the Alliance for Water Stewardship in 2018 and are beginning to adopt theStandard at high water risk facilities.
Supply chain
CoveragePartial
Risk assessment procedureWater risks are assessed as part of an enterprise risk management framework
Frequency of assessmentSix-monthly or more frequently
How far into the future are risks considered?>6 years
Type of tools and methods usedTools on the marketDatabasesOther
Tools and methods usedWRI AqueductFAO/AQUASTATInternal company methodsExternal consultants
CommentWe identify and assess water-related risks through an Enterprise Risk Management process on a 6-month time frame. We alsoevaluate our water risk specific to our direct agricultural supply chain as part of our agricultural water-use efficiency goal describedabove
CDP Page of 6718

Other stages of the value chain
CoveragePartial
Risk assessment procedureWater risks are assessed in an environmental risk assessment
Frequency of assessmentAnnually
How far into the future are risks considered?>6 years
Type of tools and methods usedInternational methodologiesDatabasesOther
Tools and methods usedLife Cycle AssessmentInternal company methodsOther, please specify (Ecoinvent, World Food Lifecycle Database, and an in-house customized LCA tool for Pepsico)
CommentWe identify and assess water-related risks for our products and their value chain using ISO standard life cycle assessmentmethodologies. Our Packaging Research & Development team created a Life Cycle Analysis tool utilizing ISO 14040/44 and PAS2050 standards. PepsiCo uses the findings and tool capabilities to incorporate life cycle thinking in our day-to-day R&D data-baseddecision making. For ingredients, we use the impacts of the World Food Lifecycle Database to understand what crops are water-intensive in what regions.
W3.3b
(W3.3b) Which of the following contextual issues are considered in your organization’s water-related risk assessments?
Relevance&inclusion
Please explain
Wateravailability at abasin/catchmentlevel
Relevant,alwaysincluded
Relevance: Water availability is highly relevant to our business because water is a key ingredient in our beverages and is critical forgrowing ingredients for our food products. Assessment: We conduct source vulnerability assessments at priority high-risk facilities toensure that we have a comprehensive picture of local water availability within the context of the local watershed. Through theseassessments along with our water risk assessment process, we gain knowledge of both current stressors on water availability as wellas projected future stressors. PepsiCo's water risk assessments for all of its company-owned manufacturing operations use a methodin which data are collected from 4 inputs: 1) WRI Aqueduct tool; 2) WBCSD Global Water Tool; 3) internal company knowledge at sitelevel, and; 4) expertise of external independent hydrologists with local knowledge and expertise. Information from these sources iscompiled to develop a comprehensive view of water-related risk facing each site within their specific local context, both now and outto 2025, and to categorize risks as physical, regulatory or social/reputational. All sites receiving a score of 3.5 or higher (from within arange of 0 to 5) are classified as high water risk and are subject to mitigation requirements, including targets on water efficiencyimprovements and watershed replenishment. Additional sites with a lower score that are designated as high water risk based onlocal knowledge are subject to mitigation requirements as well. We utilize the expertise of independent hydrologists to validate theresults of both the tools and the site surveys in an effort to ensure that the results are consistent and credible. Water riskassessments are done for our direct operations as well as our direct agricultural sourcing of key ingredients. Based on the tools weutilize, we consider both current and emerging issues regarding water availability.
Water quality atabasin/catchmentlevel
Relevant,alwaysincluded
Water quality is highly relevant to our business because high quality freshwater is a key ingredient in our products. We conductsource vulnerability assessments at priority high-risk facilities to ensure that we have a comprehensive picture of local wateravailability, including quality, within the context of the local watershed. Through these assessments along with our water riskassessment process utilizing WRI Aqueduct, internal company methods, and external consultants, we gain knowledge of bothcurrent stressors on water quality as well as projected future stressors.
Stakeholderconflictsconcerningwater resourcesat abasin/catchmentlevel
Relevant,alwaysincluded
Local stakeholder conflicts concerning water resources at a basin or catchment level are of high relevance to our business becauseour manufacturing facilities are often co-located with communities and other industries; all stakeholders are relying on a sharedresource. As part of our ‘Other, internal company methods’ tool, we utilized a water stress assessment survey for our sites thatprovides more detailed insight into local water conditions by addressing water quantity, water quality and external factors such ascompetition, economics and community concerns. This tool factors in both current and emerging stakeholder concerns or potentialconflicts that our business may be impacted by.
CDP Page of 6719

Implications ofwater on yourkeycommodities/rawmaterials
Relevant,alwaysincluded
Water is key to our ability to source ingredients for our products; droughts and other water-related events can disrupt our commoditysupply chains and impact the availability and cost of our raw materials. We conducted a water risk assessment on our majoragricultural sourcing regions around the globe using WRI Aqueduct, FAO/AQUASTAT, and external consultants. This assessmentidentified areas of high water risk and enables us to target investment in water efficiency improvements with our farmer communitiesas well as plan for future supply disruptions. We include this information in our water risk assessments as it is vital to our business;water is key for agriculture. We assess the issue and identify risks in partnership with external consultants and non-governmentalorganization (NGO) partners to best identify current issues with emerging urgency as well as emerging issues that may arise basedon trends and changes such as climate change.
Water-relatedregulatoryframeworks
Relevant,alwaysincluded
Water-related regulatory frameworks, or governance and regulations, will likely increase in many of the areas we operate in as moreregions continue to face increased water stress. Our license to operate in communities is dependent on these frameworks. As part ofour ‘Other, internal company methods’ and ‘Other, external consultants’ tools, we engaged with external consultants to develop andutilize a water stress assessment survey for our sites that provides a more detailed insight into local regulatory conditions affectingboth water supply (i.e., allocation restrictions) and water costs (i.e., tariffs). This includes both current and emerging regulatoryframeworks that our facilities may be impacted by.
Status ofecosystems andhabitats
Relevant,alwaysincluded
Sustainable water management requires us to consider the status of ecosystems and habitats where we operate and that we mightimpact. In 2018 we joined the Alliance for Water Stewardship, through which we will strive for sustainable water management in acatchment context, and whose Standard includes ecosystems as an important 'water stakeholder'. As part of our ‘Other, internalcompany methods’ and ‘Other, external consultants’ tools, we engaged with external consultants to develop and utilize a waterstress assessment survey for our sites to provide a more detailed insight into local conditions. This can include situations wherethere are water quality concerns that could impact the status of ecosystems and habitats. We regularly review the need, opportunityand our ability to increase the number of factors that we consider in assessing risks related to water and may more explicitlyincorporate this in our future assessments. In addition, we believe that sustainable agriculture should optimize the use of resourcesto improve farm productivity and preserve soil fertility, water and air quality, and biodiversity in agricultural operations. Working withexternal consultants and NGOs, we aim to keep an eye on emerging issues as well as current issues with emerging importance.
Access to fully-functioning,safely managedWASH servicesfor all employees
Relevant,alwaysincluded
Our business depends on the thousands of dedicated employees in our manufacturing sites who ensure the safety and quality of ourproducts, and we in turn, are committed to ensuring safe conditions for them. Critical to this is the provision of employees’ access tosafe water, sanitation and hygiene (WASH) for our employees. In 2014, we developed a global PepsiCo standard for Potable WaterManagement, which includes water, sanitation and hygiene (WASH), which applies to all company-owned facilities, all company-managed and leased facilities, as well as majority-owned joint ventures. This standard was developed in part due to our ‘Other,external consultants’ tools as we consulted with others to develop these requirements. As part of this, PepsiCo has an internal self-assessment program to measure WASH compliance. The assessment takes place annually and has been implemented at allcompany-owned plants. We use a WASH self-assessment questionnaire that is sent out to all of our company-owned manufacturingfacilities. However, if a facility is scheduled for an annual external audit it would not complete a self-assessment. We are also asignatory of the WASH in the Workplace pledge and have a goal of appropriate access to WASH for 100% of our own manufacturingemployees by 2025.
Other contextualissues, pleasespecify
Relevant,alwaysincluded
PepsiCo collects data from 4 inputs in its assessment process: 1) WRI Aqueduct tool; 2) WBCSD Global Water Tool; 3) internalcompany knowledge at site level, and; 4) expertise of external independent hydrologists with local knowledge and expertise.Information from these sources is compiled to develop a comprehensive view of water-related risk facing the site within their specificlocal context, both now and out to 2025, and to categorize risks as physical, regulatory or social/reputational. Sites receiving a scoreof 3.5 or higher (from within a range of 0 to 5) are classified as high water risk and are subject to mitigation requirements, includingtargets on water efficiency improvements and watershed replenishment. We utilize the expertise of independent hydrologists tovalidate the results of both the tools and the site surveys in an effort to ensure the results are consistent and credible.
Relevance&inclusion
Please explain
W3.3c
CDP Page of 6720

(W3.3c) Which of the following stakeholders are considered in your organization’s water-related risk assessments?
Relevance&inclusion
Please explain
Customers Relevant,alwaysincluded
We consider customers in our water related risk assessments because some of our key customers have expectations forperformance on water by their suppliers, including Walmart and Sam's Club. We engage these stakeholders through dialogue andthe expectations of these customers are included in risk assessments related to PepsiCo’s water stewardship strategy and programimplementation. We also respond to Walmart's request for our participation in their CDP Supply Chain program.
Employees Relevant,alwaysincluded
We consider employees in our water-related assessments because they have the potential to significantly impact PepsiCo waterstewardship programs and water goal achievement. As such, risks associated with employee behavior with regard to water may beincluded in local risk assessments, particularly where water-related risks have occurred. In such cases, the potential for employeesto reduce risk and improve site performance on water is assessed and actions are taken accordingly. We engage senior managersat the facility level through dialogue during our water risk assessment process in order to obtain information regarding water risks thatare specific to each site.
Investors Relevant,alwaysincluded
A key element of our overall water stewardship strategy and risk management approach is to achieve and maintain a reputation fortransparency and leadership in this area, including among our investors. Investor inquiries regarding PepsiCo's water-relatedperformance is taken into account in our water risk assessments. The primary means that we employ to address and manage riskwith investors is through participation in the CDP Water public reporting platform.
Localcommunities
Relevant,alwaysincluded
Local communities are key to our continued licenses to operate, and their interests in water and PepsiCo’s performance on water arefoundations of our water strategy. As such, risks to PepsiCo’s reputation as a water steward within the local community are assessedas part of our internal company method, the site survey element of our risk assessment process. We also keep an eye on externalmedia information regarding water in the areas where we operate, as they are often linked to local communities’ concerns orimpacts.
NGOs Relevant,alwaysincluded
NGOs are relevant to our water-related risk assessments because they often have deep local knowledge and experience with localwater-related areas. For example, we partner with The Nature Conservancy (TNC) at the watershed level in Latin America, theUnited States, and in South Africa, in watersheds where TNC is considered an expert on watershed protection. We also consult withNGOs for their technical knowledge; on example is how we utilize WRI’s Aqueduct tool.
Other waterusers at abasin/catchmentlevel
Relevant,alwaysincluded
At some sites with high water risk, the other water users at the local level may be important for scaled-up risk mitigation efforts thatgoes beyond our operations. For example, our facility teams at several sites in India have coordinated with community groups andwater users on the water stewardship projects that PepsiCo has supported. In these cases, we include them in risk assessment andmitigation planning.
Regulators Relevant,alwaysincluded
At some sites with high water risk, local regulators and government administrators responsible for water governance can beimportant to efforts for scaled-up risk mitigation efforts because they have the ability to impact change beyond what we can do in ourown operations and practices. In these cases, we include them in risk assessment and mitigation planning by taking intoconsideration their current and upcoming regulations regarding water and wastewater. For example, we look at regulatory impactsand a horizon scan for future changes in the 3-5-year timeframe through our internal company method of site surveys.
River basinmanagementauthorities
Relevant,sometimesincluded
At some sites with high water insecurity, river basin management authorities responsible for regional water planning can be importantto efforts for scaled-up risk mitigation efforts because they have the ability to impact change beyond what we can do in our ownoperations and practices. In these cases, we include them in risk assessment and mitigation planning by considering their river basinmanagement plans and assessments.
Statutoryspecial interestgroups at alocal level
Notrelevant,explanationprovided
For PepsiCo, special interest groups tend to be focused primarily on nutrition and plastics/packaging and for this reason they do notplay a signficant role in our water risk assessments. Based on these current trends, we don’t anticipate those groups to increase inrelevance in the future; however, they are included in broader business risk assessment procedures.
Suppliers Relevant,alwaysincluded
Water risk in our supply chain is centered on our franchise bottler operations, co-manufacturing/co-packing partners, and farmer-sourced agriculture suppliers because many of them are located in water stress locations. We work directly with such businesspartners to mitigate water risk. Part of our Sustainable Sourcing Program provides us with the opportunity to engage our supplierswith the Sedex/SMETA 4-Pillar Audit, which includes meeting environmental regulations and laws and environmental managementsystems, policies, and procedures under its Environment pillar.
Water utilities ata local level
Relevant,alwaysincluded
At some locations, the root cause of water scarcity is the inability of local water utility infrastructure to deliver water in an efficient andeffective way. Thus, the local water utility and its plans to improve infrastructure would be an important consideration in local waterrisk assessments at these sites. Engagement with the local water utility could come in the form of evaluating existing water andwastewater services as well as plans for system maintenance, monitoring, and upgrades.
Otherstakeholder,please specify
Pleaseselect
W3.3d
CDP Page of 6721
(W3.3d) Describe your organization’s process for identifying, assessing, and responding to water-related risks within yourdirect operations and other stages of your value chain.
Through our Enterprise Risk Management process, we identify and assess water-related risks within our direct operations and otherstages of our value chain twice a year. Supplementing that process, we also conduct a global water risk assessment of all ourcompany-owned operations every three years. This was last completed in 2016 and the next global operations assessment will becompleted in 2019. We used the WRI Aqueduct tool, combined with local site surveys and engagement of an external consultant todetermine the level of water risk in three categories: physical, regulatory and reputational/social. We chose to use a combination of allthree tools in order to make our assessment comprehensive. Both current risk and anticipated future water risk were assessed andassigned a combined risk score using all three tools. All sites with a score in excess of 3.5 (out of 5) were designated as high waterrisk. Additional sites with a lower score were also designated as high water risk based on local knowledge. One important way inwhich we use the outcomes of the water risk assessment is that sites designated as high risk are subject to three 2025 goals: theywill need to replenish 100% of water consumed at the site, they are in-scope for our 25% operational water use efficiency goal, andthey will need to adopt the Alliance for Water Stewardship standard as a vehicle for water advocacy by 2025. We completed a similarwater risk assessment process for our major farmer-sourced agricultural sourcing regions. We anticipate repeating this globalagriculture risk assessment on a three-year cycle with annual reviews, with our next assessment planned for 2019. All top tier risklocations list will be reviewed based on the results of the global exercise. On a country by country basis, risk assessment may becarried out more frequently as per local demands. Any new construction of PepsiCo facilities now requires a PepsiCo SustainabilityCapital Expenditure Filter to be completed as part of the business case justification, of which water sustainability is a significantelement.
W4. Risks and opportunities
W4.1
(W4.1) Have you identified any inherent water-related risks with the potential to have a substantive financial or strategicimpact on your business?Yes, both in direct operations and the rest of our value chain
W4.1a
(W4.1a) How does your organization define substantive financial or strategic impact on your business?
PepsiCo incorporates the following factors when defining substantive change in PepsiCo’s direct operations, revenue or expenditurefrom water risk: 1) magnitude of potential impact on operating costs and/or current and future revenue; and 2) potential impact onstakeholder expectations or perceptions. Substantive change would generally be considered any material change (+/- 5%) to a site'soperating environment/costs and/or to PepsiCo’s reputation locally, regionally or globally. One example of a potential substantiveimpact would be the prolonged closure of a manufacturing facility due to water-related issues. While neither were characterized as'substantive', in 2018 we saw examples of production disruptions at our facilities in Cape Town (due to the 2018 'Day Zero'emergency) and in southern India due to flooding. Should such material change occur, the impact (and any potential need to reviewthe definition) would be reviewed and re-assessed by our senior executive team. This definition of substantive change applies to bothdirect operations and to elements of our supply and value chains (for example, changes to how we source agricultural raw materialsdue to water-related risks).
W4.1b
CDP Page of 6722

(W4.1b) What is the total number of facilities exposed to water risks with the potential to have a substantive financial orstrategic impact on your business, and what proportion of your company-wide facilities does this represent?
Totalnumberoffacilitiesexposedto waterrisk
%company-widefacilitiesthisrepresents
Comment
Row1
75 26-50 PepsiCo conducts water risk assessments for all of its company-owned manufacturing operations using the data collected from thefollowing four input methods: 1) WRI Aqueduct tool; 2) internal company knowledge at site level; and 3) expertise of externalindependent hydrologists with local knowledge and expertise. Information from these sources is compiled to develop a comprehensiveview of water-related risk facing each site within their specific local context, both now and out to 2025, and to categorize risks asphysical, regulatory or social/reputational. All sites receiving a score of 3.5 or higher (from within a range of 0 to 5) are classified ashigh water risk and are subject to mitigation requirements, including targets on water efficiency improvements and watershedreplenishment. Additional sites with a lower score that are designated as high water risk based on local knowledge are subject tomitigation requirements as well. We utilize the expertise of independent hydrologists to validate the results of both the tools and thesite surveys in an effort to ensure the results are consistent and credible.
W4.1c
CDP Page of 6723

(W4.1c) By river basin, what is the number and proportion of facilities exposed to water risks that could have a substantiveimpact on your business, and what is the potential business impact associated with those facilities?
Country/RegionIndia
River basinCauvery River
This also includes a facility outside of the Cauvery River basin.
Number of facilities exposed to water risk2
% company-wide facilities this representsLess than 1%
Production value for the metals & mining activities associated with these facilities<Not Applicable>
% company’s annual electricity generation that could be affected by these facilities<Not Applicable>
% company’s global oil & gas production volume that could be affected by these facilities<Not Applicable>
% company’s total global revenue that could be affectedLess than 1%
CommentEstimate based on net book value of reported facilities
Country/RegionUnited States of America
River basinColorado River (Pacific Ocean)
Number of facilities exposed to water risk9
% company-wide facilities this represents1-25
Production value for the metals & mining activities associated with these facilities<Not Applicable>
% company’s annual electricity generation that could be affected by these facilities<Not Applicable>
% company’s global oil & gas production volume that could be affected by these facilities<Not Applicable>
% company’s total global revenue that could be affectedLess than 1%
CommentEstimate based on net book value of reported facilities
W4.2
(W4.2) Provide details of identified risks in your direct operations with the potential to have a substantive financial orstrategic impact on your business, and your response to those risks.
Country/RegionIndia
CDP Page of 6724

River basinCauvery River
Type of riskPhysical
Primary risk driverIncreased water stress
Primary potential impactReduction or disruption in production capacity
Company-specific descriptionSocial and regulatory changes in several areas of India impact the ability of our facilities to maintain and/or increase production. Inrecent years, increased water stress in the Indian states of Tamil Nadu and Kerala has driven local opposition to multinationalcorporations, resulting in product boycotts. In 2018, PepsiCo had ten high water risk facilities across India, most of whom relied onsingle water sources that were dependent on annual rainfall volumes and became increasingly strained during drought conditions.Detailed Water Vulnerability Assessments were completed for each of these sites to better understand the company risks andopportunities.
TimeframeCurrent up to 1 year
Magnitude of potential impactMedium
LikelihoodVirtually certain
Are you able to provide a potential financial impact figure?Yes, a single figure estimate
Potential financial impact figure (currency)20000000
Potential financial impact figure - minimum (currency)<Not Applicable>
Potential financial impact figure - maximum (currency)<Not Applicable>
Explanation of financial impactThe potential financial impact estimate is based on a scenario whereby PepsiCo’s highest water risk facility in the region could beforced to close due to lack of water, leaving a stranded asset.
Primary response to riskWater management incentives
Description of responsePepsiCo’s response in these watersheds is to implement our global water strategy where we strive for Positive Water Impact in andnear the communities where we work - meaning our efforts and collaborations will be designed to enable long-term, sustainablewater security for our business and others who depend on water availability. This global strategy is implemented through focusingon watershed management, conserving water within our operations, reducing water use in our agricultural supply chain, promotingaccess to water and advocating for strong water governance within communities. We are implementing this strategy now in India.For example, we are actively replenishing high water risk watersheds where we operate. In 2018, we replenished over 2.7 billionliters of water in India through community programs such as rainwater harvesting, storage pond rehabilitation and check daminstallations. These efforts support both water risk mitigation and enhance PepsiCo's reputation.
Cost of response10000000
Explanation of cost of responseWe estimate response costs to be ‘low’, specifically we estimate them to be <1% of PepsiCo’s global revenue. We utilized currentcosts of response through our India community water programs to estimate an approximate total annual cost of response to theserisks. We expect these costs to continue into the future at approximately the same level.
Country/RegionUnited States of America
CDP Page of 6725

River basinColorado River (Pacific Ocean)
Type of riskPhysical
Primary risk driverDrought
Primary potential impactReduction or disruption in production capacity
Company-specific descriptionCurrent and future water stress around the Colorado water basin in the U.S. could impact the ability of our current facilities tocontinue production without disruption in the future. In 2018, PepsiCo had 13 high water risk food and beverage manufacturingfacilities located within the Colorado River Basin, in California, Arizona, Nevada, and Colorado. Drought conditions in the ColoradoRiver basin affect water availability for all water stakeholders, including our facilities.
Timeframe1 - 3 years
Magnitude of potential impactMedium-low
LikelihoodLikely
Are you able to provide a potential financial impact figure?Yes, a single figure estimate
Potential financial impact figure (currency)40000000
Potential financial impact figure - minimum (currency)<Not Applicable>
Potential financial impact figure - maximum (currency)<Not Applicable>
Explanation of financial impactThe potential financial impact estimate is based on a scenario whereby PepsiCo’s highest water risk facility in the region could beforced to close due to lack of water, leaving a stranded asset.
Primary response to riskWater management incentives
Description of responsePepsiCo’s response in these watersheds is to implement our global water strategy where we strive for Positive Water Impact in andnear the communities where we work - meaning our efforts and collaborations will be designed to enable long-term, sustainablewater security for our business and others who depend on water availability. This global strategy is implemented through focusingon watershed management, conserving water within our operations, reducing water use in our agricultural supply chain, promotingaccess to water and advocating for strong water governance within communities. We are implementing this strategy now in theColorado River basin through our collaboration with The Nature Conservancy (TNC). In this program, we collaborate with TNC onconservation activities within the Colorado River basin as well as support irrigation efficiency improvements to reduce demand forwater in this area. In 2018 we replenished over 500 million liters of water back to the Colorado River basin. These efforts supportboth water risk mitigation and enhance PepsiCo's reputation.
Cost of response600000
Explanation of cost of responseWe estimate response costs to be ‘low’, specifically we estimate them to be less than 1% of PepsiCo’s global revenue. We utilizedcurrent costs of response through our ‘Recycle for Nature’ collaboration to estimate an approximate total cost of response. Weexpect these costs to continue into the future at approximately the same level.
W4.2a
CDP Page of 6726

(W4.2a) Provide details of risks identified within your value chain (beyond direct operations) with the potential to have asubstantive financial or strategic impact on your business, and your response to those risks.
Country/RegionSouth Africa
River basinBerg-Olifants
Stage of value chainSupply chain
Type of riskPhysical
Primary risk driverIncreased water scarcity
Primary potential impactSupply chain disruption
Company-specific descriptionMean precipitation increases or decreases could lead to change in supply patterns for key crops such as potatoes, oranges andoats, potentially higher transportation costs, potentially higher commodity costs and uncertainty of crop availability. Wecontinuously monitor our operations and sourcing from high water risk areas using the Aqueduct tool from the World ResourcesInstitute (WRI), as well as internal assessments. For example, in South Africa, 100% of our potatoes used in Simba Foods aresourced domestically, and 30% of those come from Western Cape, a region which is highly water stressed and is facing increasedwater risk due to climate change. Our Sustainable Agriculture team is working with our growers in South Africa and other high waterrisk areas to improve agricultural water use efficiency as part of our sustainability objectives in the supply chain.
Timeframe>6 years
Magnitude of potential financial impactHigh
LikelihoodLikely
Are you able to provide a potential financial impact figure?Yes, a single figure estimate
Potential financial impact figure (currency)6000000
Potential financial impact figure - minimum (currency)<Not Applicable>
Potential financial impact figure - maximum (currency)<Not Applicable>
Explanation of financial impactThis potential financial impact South Africa-wide, not just specific to the Berg River basin. Changes in average precipitation candisrupt crop yields and locations. Such an event could significantly impact PepsiCo’s revenues with increased commodity pricesand transportation costs. Using a hypothetical example, financial implications could include an increase of 15% premium, whichwould equate to approximately $6 million cost increase for the market.
Primary response to riskPromote the adoption of sustainable irrigation practices among suppliers
Description of responsePepsiCo’s goal is to operate in a sustainable manner and we have undertaken several initiatives to manage the risk of consumerbuying habits while simultaneously lessening our dependence upon climate-sensitive commodities. For example, to adapt to andmitigate the temperature and precipitation impact, PepsiCo has implemented our Sustainable Farming Program (SFP) (formerly ourSustainable Farming Initiative, or SFI) which enables our company-owned and contract growers, including those in South Africa, tocompete in a resource constrained future. In 2018, we have invested in programs to improve water efficiency in water stressedregions, enhance soil health and improve farm yields and resiliency at the same time. PepsiCo investments in improving crop yieldsare proprietary. PepsiCo has a corporate Sustainable Agriculture team in place comprising a Vice President, Director and Manager.The team is supported by agriculture experts in our business divisions in implementing sustainable agriculture practices at our key
CDP Page of 6727

crop suppliers.
Cost of response8000000
Explanation of cost of responseThis estimate is not limited to South Africa. PepsiCo investments in improving crop yields are proprietary. PepsiCo has a corporateSustainable Agriculture team in place comprised of a Vice President, Director and Manager. The team is supported by agricultureexperts in our business divisions in implementing sustainable agriculture practices at our key crop suppliers.
W4.3
(W4.3) Have you identified any water-related opportunities with the potential to have a substantive financial or strategicimpact on your business?Yes, we have identified opportunities, and some/all are being realized
W4.3a
(W4.3a) Provide details of opportunities currently being realized that could have a substantive financial or strategic impact onyour business.
Type of opportunityOther
Primary water-related opportunityOther, please specify (Securing supply chain)
Company-specific description & strategy to realize opportunityThe aspirational aim of our water stewardship program is to improve water security for our supply chain and the communities inwhich we operate. This is a strategic opportunity for PepsiCo because mitigating local water insecurity will lead to increasedbusiness resilience to water stress. As one example, part of our strategy is to replenish 100% of the water we consume inmanufacturing operations located in high-water-risk areas, ensuring that such replenishment takes place in the same watershedwhere the extraction has occurred. For example, in Monterrey, Mexico, we have invested in the TNC Water Fund which usesmarket financial mechanisms to drive improved protection of source watersheds. We have invested over $3 million in Water Fundsin Latin America as well as watershed conservation projects in North America.
Estimated timeframe for realization4 to 6 years
Magnitude of potential financial impactLow
Are you able to provide a potential financial impact figure?Yes, a single figure estimate
Potential financial impact figure (currency)30000000
Potential financial impact figure – minimum (currency)<Not Applicable>
Potential financial impact figure – maximum (currency)<Not Applicable>
Explanation of financial impactThis estimate is based on the financial impact of ongoing watershed initiatives, of about $30M, that PepsiCo is supporting inworking with The Nature Conservancy (TNC) in the United States and in Latin America, in addition to community water protectionwork that PepsiCo is supporting in India.
Type of opportunityMarkets
CDP Page of 6728

Primary water-related opportunityImproved community relations
Company-specific description & strategy to realize opportunityWorking collaboratively with the PepsiCo Foundation and other partners, our strategy is to provide access to safe water to a total of25 million people (from 2006) in the worlds’ most at-water-risk areas, with a focus on communities near our operations. This is astrategic opportunity for PepsiCo because many of the geographies that PepsiCo operates in have populations without basicaccess to water; as these geographies are important to PepsiCo's business, we also have a responsibility to act as a responsiblecorporate citizen in the communities where we operate. The initiatives, in which we have engaged with our portfolio of NGOcollaborators, provide a transformative opportunity. Our collaboration is expected to result in greater water availability where it didnot previously exist, thereby providing more sustainable access to water for those communities, more sustainable solutions to theglobal water crisis, and more sustainable access to water for our manufacturing operations. For example, the PepsiCo Foundationhas partnered with several organizations to invest millions of dollars in providing access to safe water to over 22 million people insome of the planet’s most water-stressed regions such as India, Latin America, and China.
Estimated timeframe for realization4 to 6 years
Magnitude of potential financial impactLow
Are you able to provide a potential financial impact figure?Yes, a single figure estimate
Potential financial impact figure (currency)65000000
Potential financial impact figure – minimum (currency)<Not Applicable>
Potential financial impact figure – maximum (currency)<Not Applicable>
Explanation of financial impactThis is an estimate based on costs incurred to date and expected costs in the future. PepsiCo has invested over $40 million in safewater access solutions with strategic collaborators as part of its goal to support a total of 25 million people with safe water accessby 2025, and has reached over 22 million people so far.
Type of opportunityEfficiency
Primary water-related opportunityCost savings
Company-specific description & strategy to realize opportunityOur strategy is to build on the 25% improvement in water-use efficiency achieved from our original Performance with Purposetarget with an additional 25% improvement by 2025, with a focus on manufacturing operations in high-water-risk areas. Conservingwater is good for our business and the environment wherever we operate. We are targeting to increase water-use efficiency by afurther 25% by 2025.This water efficiency will also deliver cost savings to our operations in relation to water abstraction costs,utilities costs as well as waste water discharge compliance costs and chemical consumables. We set annual efficiency targets. In2018, aiming to reduce the amount of water used for potato slicing and lubricating, our R&D and manufacturing teams designed,prototyped, tested and successfully validated a new patented component-one that’s just as effective as the standard equipmentwhile using 64% less water. We’re deploying this innovation globally, and it has the potential to save 640 million liters of water peryear.
Estimated timeframe for realization4 to 6 years
Magnitude of potential financial impactMedium
Are you able to provide a potential financial impact figure?Yes, a single figure estimate
Potential financial impact figure (currency)18100000
Potential financial impact figure – minimum (currency)
CDP Page of 6729

<Not Applicable>
Potential financial impact figure – maximum (currency)<Not Applicable>
Explanation of financial impactIn 2018 PepsiCo spent $18.1 million via its centrally-funded Capital Investments Sustainability fund for water use efficiency andupgrade projects.
Type of opportunityResilience
Primary water-related opportunityIncreased supply chain resilience
Company-specific description & strategy to realize opportunityOur strategy is to improve the water-use efficiency of our direct agricultural supply chain by 15% in high-water-risk sourcing areas,a volume approximately equivalent to the entire water use of all PepsiCo direct operations. PepsiCo has an opportunity to improvethe resiliency of our agricultural supply chain through better water management. PepsiCo is engaged in a dialogue partnership withindustry peers as part of the Midwest Row Crop Collaborative (MRCC), which also includes leading NGOs. MRCC focuses on U.S.states that PepsiCo relies on heavily for corn. Relevant to both our supply chain and the agriculture industry and region at large isthat necessary improvements in Midwest farming practices are necessary to ensure supply resiliency and reduce pollution (one ofMRCC's goals is to reduce nutrient loading from target states in support of the Gulf of Mexico Hypoxia Task Force goal); thisincludes PepsiCo's individual supply chain but extends beyond our individual influence.
Estimated timeframe for realization4 to 6 years
Magnitude of potential financial impactLow
Are you able to provide a potential financial impact figure?Yes, a single figure estimate
Potential financial impact figure (currency)450000
Potential financial impact figure – minimum (currency)<Not Applicable>
Potential financial impact figure – maximum (currency)<Not Applicable>
Explanation of financial impactPepsiCo has invested $450,000 in MRCC, but the total partner investment is $8MM. This is a good example of a collective actioneffort to improve supply chain resilience in an important agriculture region for PepsiCo as well as our industry peers.
Type of opportunityOther
Primary water-related opportunityOther, please specify (Collective Action)
Company-specific description & strategy to realize opportunityOur strategy is to advocate for strong water governance in communities and watersheds where we operate, promoting watersolutions that meet local water needs, and to initiate and support collaborative efforts with other stakeholders to address water riskand mitigate water insecurity. Our ability to achieve our goals is possible in part by collaborating with businesses, academic expertsand NGOs. For example, we are actively involved in the UN Global Compact’s CEO Water Mandate, the WBCSD water leadershipgroup, the International Finance Corporation’s 2030 Water Resources Group and the Beverage Industry Environmental Roundtable.These forums allow us to learn from other companies and share our own experiences across a spectrum of industries, includingfood and beverage manufacturing, power generation and construction. This also enables us to discuss water-related issues andadvance solutions on a pre-competitive basis.
Estimated timeframe for realization4 to 6 years
Magnitude of potential financial impactLow
CDP Page of 6730

Are you able to provide a potential financial impact figure?Yes, a single figure estimate
Potential financial impact figure (currency)2000000
Potential financial impact figure – minimum (currency)<Not Applicable>
Potential financial impact figure – maximum (currency)<Not Applicable>
Explanation of financial impactThis is an estimate; our collective action efforts will, in most cases, align with our water stewardship efforts, whose costs have beenestimated separately. One specific example here is our $1.5 million commitment to the 2030 Water Resources Group over threeyears.
W5. Facility-level water accounting
W5.1
(W5.1) For each facility referenced in W4.1c, provide coordinates, total water accounting data and comparisons with theprevious reporting year.
Facility reference numberFacility 1
Facility name (optional)Palakkad
Country/RegionIndia
River basinOther, please specify (Bharathappuzha)
Latitude10.79
Longitude76.78
Primary power generation source for your electricity generation at this facility<Not Applicable>
Oil & gas sector business division<Not Applicable>
Total water withdrawals at this facility (megaliters/year)152
Comparison of withdrawals with previous reporting yearHigher
Total water discharges at this facility (megaliters/year)43.3
Comparison of discharges with previous reporting yearLower
Total water consumption at this facility (megaliters/year)85
Comparison of consumption with previous reporting year
CDP Page of 6731

Higher
Please explainProduction output at this plant almost doubled over prior year which has been the main cause of the increase in withdrawal andconsumed water volumes in the same period. However the water usage efficiency rate improved by 9% as PepsiCo continuesdriving its water efficiency strategy across all operations.
Facility reference numberFacility 2
Facility name (optional)Nelamangala
Country/RegionIndia
River basinCauvery River
Latitude13.14
Longitude77.34
Primary power generation source for your electricity generation at this facility<Not Applicable>
Oil & gas sector business division<Not Applicable>
Total water withdrawals at this facility (megaliters/year)210
Comparison of withdrawals with previous reporting yearLower
Total water discharges at this facility (megaliters/year)100.03
Comparison of discharges with previous reporting yearLower
Total water consumption at this facility (megaliters/year)107
Comparison of consumption with previous reporting yearLower
Please explainWe withdrew 19% less water in 2018 compared to 2017 by a combination of a reduction in production output and running a waterrecovery process allowing us to reuse water in the site’s utilities. While production volumes will always fluctuate year to year thewater usage efficiency metric has improve by 6% Year on year.
Facility reference numberFacility 3
Facility name (optional)Riverside, CA
Country/RegionUnited States of America
River basinColorado River (Pacific Ocean)
Latitude33.93
Longitude
CDP Page of 6732

-117.3
Primary power generation source for your electricity generation at this facility<Not Applicable>
Oil & gas sector business division<Not Applicable>
Total water withdrawals at this facility (megaliters/year)373
Comparison of withdrawals with previous reporting yearAbout the same
Total water discharges at this facility (megaliters/year)137.05
Comparison of discharges with previous reporting yearLower
Total water consumption at this facility (megaliters/year)224
Comparison of consumption with previous reporting yearAbout the same
Please explainA production reduction together with an increased water efficiency focus allowed the site to reduce water withdrawal - water usageefficiency improve by 2% in 2018.
Facility reference numberFacility 4
Facility name (optional)City Of Industry, CA
Country/RegionUnited States of America
River basinColorado River (Pacific Ocean)
Latitude34.04
Longitude-117.98
Primary power generation source for your electricity generation at this facility<Not Applicable>
Oil & gas sector business division<Not Applicable>
Total water withdrawals at this facility (megaliters/year)357
Comparison of withdrawals with previous reporting yearAbout the same
Total water discharges at this facility (megaliters/year)177
Comparison of discharges with previous reporting yearLower
Total water consumption at this facility (megaliters/year)94
Comparison of consumption with previous reporting yearAbout the same
CDP Page of 6733
Please explainThis site continues to invest in efficiency innovation and achieved a 3.2% water usage efficiency rate in 2018. Optimizing ingredientwater production at our utilities was conducted across our California beverage operations in 2018.
Facility reference numberFacility 5
Facility name (optional)Buena Park, CA
Country/RegionUnited States of America
River basinColorado River (Pacific Ocean)
Latitude33.87
Longitude-118.02
Primary power generation source for your electricity generation at this facility<Not Applicable>
Oil & gas sector business division<Not Applicable>
Total water withdrawals at this facility (megaliters/year)171
Comparison of withdrawals with previous reporting yearAbout the same
Total water discharges at this facility (megaliters/year)78.73
Comparison of discharges with previous reporting yearLower
Total water consumption at this facility (megaliters/year)179
Comparison of consumption with previous reporting yearMuch higher
Please explainThis site continued to be our most water efficient beverage operations. It achieved better than world class water usage efficiencyrates for the portfolio mix and improved its efficiency by a further 0.6% in 2018.
Facility reference numberFacility 6
Facility name (optional)Fresno, CA
Country/RegionUnited States of America
River basinSacramento River - San Joaquin River
Latitude36.39
Longitude-119.77
Primary power generation source for your electricity generation at this facility<Not Applicable>
CDP Page of 6734

Oil & gas sector business division<Not Applicable>
Total water withdrawals at this facility (megaliters/year)327
Comparison of withdrawals with previous reporting yearAbout the same
Total water discharges at this facility (megaliters/year)137.38
Comparison of discharges with previous reporting yearLower
Total water consumption at this facility (megaliters/year)217
Comparison of consumption with previous reporting yearAbout the same
Please explainThis is a beverage site that continues to drive water efficiency opportunities delivering a 4.2% efficiency improvement in 2018.
Facility reference numberFacility 7
Facility name (optional)Sacramento, CA
Country/RegionUnited States of America
River basinSacramento River - San Joaquin River
Latitude38.48
Longitude-121.4
Primary power generation source for your electricity generation at this facility<Not Applicable>
Oil & gas sector business division<Not Applicable>
Total water withdrawals at this facility (megaliters/year)378
Comparison of withdrawals with previous reporting yearAbout the same
Total water discharges at this facility (megaliters/year)172.17
Comparison of discharges with previous reporting yearLower
Total water consumption at this facility (megaliters/year)223
Comparison of consumption with previous reporting yearAbout the same
Please explainThis site is undergoing a water-use efficiency drive. It continues to develop and execute its efficiency strategy while the portfoliomix continues to move toward more micro sensitive products with a higher water footprint.
CDP Page of 6735

Facility reference numberFacility 8
Facility name (optional)Hayward, CA
Country/RegionUnited States of America
River basinOther, please specify (California)
Latitude37.61
Longitude-122.09
Primary power generation source for your electricity generation at this facility<Not Applicable>
Oil & gas sector business division<Not Applicable>
Total water withdrawals at this facility (megaliters/year)273
Comparison of withdrawals with previous reporting yearAbout the same
Total water discharges at this facility (megaliters/year)90.9
Comparison of discharges with previous reporting yearLower
Total water consumption at this facility (megaliters/year)154
Comparison of consumption with previous reporting yearAbout the same
Please explainThis site is maintaining its performance in spite of business challenges. We expect changes in portfolio shift and smaller batchmanufacturing will impact our beverages operations into the future.
Facility reference numberFacility 9
Facility name (optional)Oakland, CA
Country/RegionUnited States of America
River basinOther, please specify (California)
Latitude37.77
Longitude-122.2
Primary power generation source for your electricity generation at this facility<Not Applicable>
Oil & gas sector business division<Not Applicable>
Total water withdrawals at this facility (megaliters/year)
CDP Page of 6736

212
Comparison of withdrawals with previous reporting yearLower
Total water discharges at this facility (megaliters/year)143.16
Comparison of discharges with previous reporting yearLower
Total water consumption at this facility (megaliters/year)119
Comparison of consumption with previous reporting yearLower
Please explainThis facility withdrew lower amounts of water in 2018 compared to 2017. The site's product portfolio mix changes and efficiencyimprovements can impact water withdrawals.
Facility reference numberFacility 10
Facility name (optional)Rancho Cucamonga
Country/RegionUnited States of America
River basinColorado River (Pacific Ocean)
Latitude34.08
Longitude-117.59
Primary power generation source for your electricity generation at this facility<Not Applicable>
Oil & gas sector business division<Not Applicable>
Total water withdrawals at this facility (megaliters/year)368
Comparison of withdrawals with previous reporting yearAbout the same
Total water discharges at this facility (megaliters/year)328.86
Comparison of discharges with previous reporting yearLower
Total water consumption at this facility (megaliters/year)37
Comparison of consumption with previous reporting yearAbout the same
Please explainOur overall water withdrawal at this location remained about the same in 2018 as compared to 2017. However, the site achieved a5.9% efficiency improvement.
Facility reference numberFacility 11
CDP Page of 6737

Facility name (optional)Kern, CA
Country/RegionUnited States of America
River basinColorado River (Pacific Ocean)
Latitude35.4
Longitude-119.32
Primary power generation source for your electricity generation at this facility<Not Applicable>
Oil & gas sector business division<Not Applicable>
Total water withdrawals at this facility (megaliters/year)1554
Comparison of withdrawals with previous reporting yearAbout the same
Total water discharges at this facility (megaliters/year)51.26
Comparison of discharges with previous reporting yearLower
Total water consumption at this facility (megaliters/year)155
Comparison of consumption with previous reporting yearAbout the same
Please explainThis snacks operation is a relatively high water consumer among PepsiCo sites due to the nature of its land application wastewatertreatment system. In 2018, we achieved a 3.4% efficiency improvement, which is significant for a plant this size. We have waterefficient technology investment plans to invest in this location further in the coming years, to further increase our water useefficiency at this site.
W5.1a
(W5.1a) For each facility referenced in W5.1, provide withdrawal data by water source.
Facility reference numberFacility 1
Facility namePalakkad
Fresh surface water, including rainwater, water from wetlands, rivers and lakes0
Brackish surface water/seawater0
Groundwater - renewable152
Groundwater - non-renewable0
CDP Page of 6738

Produced/Entrained water0
Third party sources0
CommentOn-site well supply, single
Facility reference numberFacility 2
Facility nameNelamangala
Fresh surface water, including rainwater, water from wetlands, rivers and lakes0
Brackish surface water/seawater0
Groundwater - renewable210
Groundwater - non-renewable0
Produced/Entrained water0
Third party sources0
CommentOn-site well supply, single
Facility reference numberFacility 3
Facility nameRiverside, CA
Fresh surface water, including rainwater, water from wetlands, rivers and lakes0
Brackish surface water/seawater0
Groundwater - renewable0
Groundwater - non-renewable0
Produced/Entrained water0
Third party sources373
CommentMunicipal supply
Facility reference numberFacility 4
Facility nameCity Of Industry, CA
CDP Page of 6739

Fresh surface water, including rainwater, water from wetlands, rivers and lakes0
Brackish surface water/seawater0
Groundwater - renewable0
Groundwater - non-renewable0
Produced/Entrained water0
Third party sources357
CommentMunicipal supply
Facility reference numberFacility 5
Facility nameBuena Park, CA
Fresh surface water, including rainwater, water from wetlands, rivers and lakes0
Brackish surface water/seawater0
Groundwater - renewable0
Groundwater - non-renewable0
Produced/Entrained water0
Third party sources171
CommentMunicipal supply
Facility reference numberFacility 6
Facility nameFresno, CA
Fresh surface water, including rainwater, water from wetlands, rivers and lakes0
Brackish surface water/seawater0
Groundwater - renewable0
Groundwater - non-renewable0
Produced/Entrained water0
Third party sources
CDP Page of 6740

327
CommentMunicipal supply
Facility reference numberFacility 7
Facility nameSacramento, CA
Fresh surface water, including rainwater, water from wetlands, rivers and lakes0
Brackish surface water/seawater0
Groundwater - renewable0
Groundwater - non-renewable0
Produced/Entrained water0
Third party sources378
CommentMunicipal supply
Facility reference numberFacility 8
Facility nameHayward, CA
Fresh surface water, including rainwater, water from wetlands, rivers and lakes0
Brackish surface water/seawater0
Groundwater - renewable0
Groundwater - non-renewable0
Produced/Entrained water0
Third party sources273
CommentMunicipal supply
Facility reference numberFacility 9
Facility nameOakland, CA
Fresh surface water, including rainwater, water from wetlands, rivers and lakes0
Brackish surface water/seawater
CDP Page of 6741

0
Groundwater - renewable0
Groundwater - non-renewable0
Produced/Entrained water0
Third party sources212
CommentMunicipal supply
Facility reference numberFacility 10
Facility nameRancho Cucamonga
Fresh surface water, including rainwater, water from wetlands, rivers and lakes0
Brackish surface water/seawater0
Groundwater - renewable0
Groundwater - non-renewable0
Produced/Entrained water0
Third party sources368
CommentMunicipal supply
Facility reference numberFacility 11
Facility nameKern, CA
Fresh surface water, including rainwater, water from wetlands, rivers and lakes0
Brackish surface water/seawater0
Groundwater - renewable1554
Groundwater - non-renewable0
Produced/Entrained water0
Third party sources0
CommentOn-site well supply, single
CDP Page of 6742

W5.1b
(W5.1b) For each facility referenced in W5.1, provide discharge data by destination.
Facility reference numberFacility 1
Facility namePalakkad
Fresh surface water0
Brackish surface water/Seawater0
Groundwater0
Third party destinations43.3
Comment
Facility reference numberFacility 2
Facility nameNelamangala
Fresh surface water0
Brackish surface water/Seawater0
Groundwater0
Third party destinations100.03
Comment
Facility reference numberFacility 3
Facility nameRiverside, CA
Fresh surface water0
Brackish surface water/Seawater0
Groundwater0
Third party destinations137.05
Comment
Facility reference numberFacility 4
CDP Page of 6743

Facility nameCity of Industry, CA
Fresh surface water0
Brackish surface water/Seawater0
Groundwater0
Third party destinations177
Comment
Facility reference numberFacility 5
Facility nameBuena Park, CA
Fresh surface water0
Brackish surface water/Seawater0
Groundwater0
Third party destinations78.73
Comment
Facility reference numberFacility 6
Facility nameFresno, CA
Fresh surface water0
Brackish surface water/Seawater0
Groundwater0
Third party destinations137.38
Comment
Facility reference numberFacility 7
Facility nameSacramento, CA
Fresh surface water0
Brackish surface water/Seawater0
Groundwater
CDP Page of 6744

0
Third party destinations172.17
Comment
Facility reference numberFacility 8
Facility nameHayward, CA
Fresh surface water0
Brackish surface water/Seawater0
Groundwater0
Third party destinations90.9
Comment
Facility reference numberFacility 9
Facility nameOakland, CA
Fresh surface water0
Brackish surface water/Seawater0
Groundwater0
Third party destinations143.16
Comment
Facility reference numberFacility 10
Facility nameRancho Cucamonga
Fresh surface water0
Brackish surface water/Seawater0
Groundwater0
Third party destinations328.86
Comment
Facility reference numberFacility 11
CDP Page of 6745
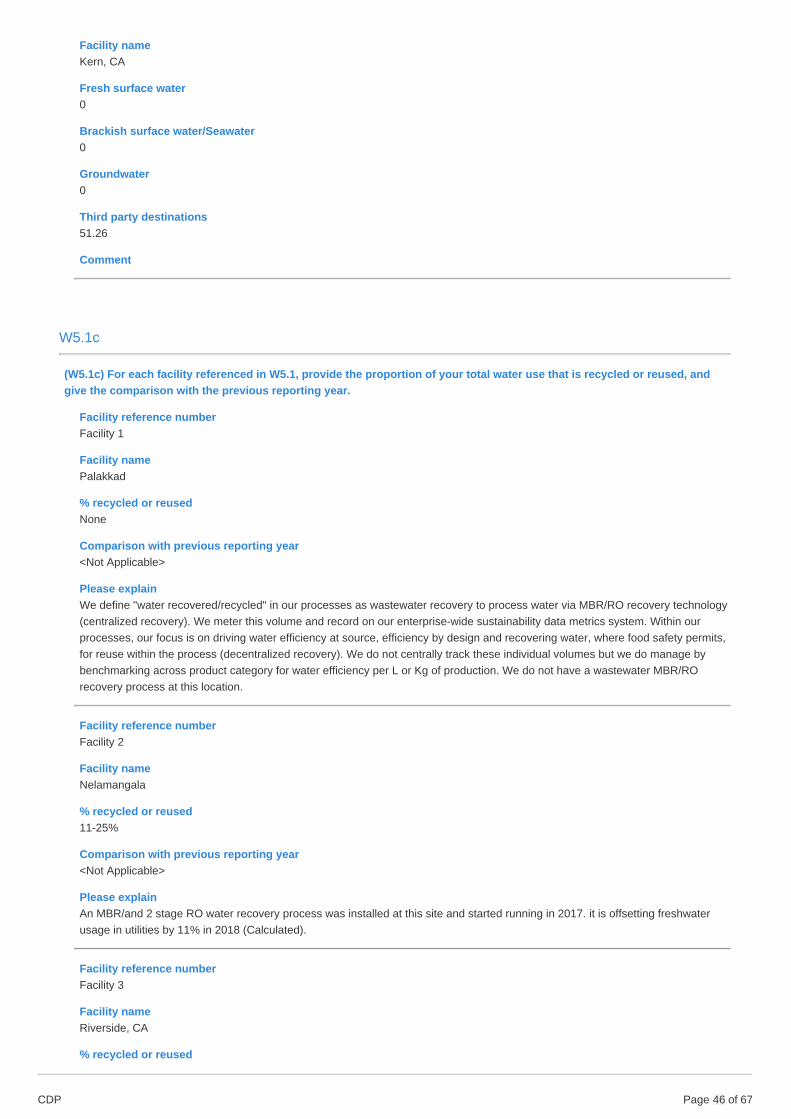
Facility nameKern, CA
Fresh surface water0
Brackish surface water/Seawater0
Groundwater0
Third party destinations51.26
Comment
W5.1c
(W5.1c) For each facility referenced in W5.1, provide the proportion of your total water use that is recycled or reused, andgive the comparison with the previous reporting year.
Facility reference numberFacility 1
Facility namePalakkad
% recycled or reusedNone
Comparison with previous reporting year<Not Applicable>
Please explainWe define "water recovered/recycled" in our processes as wastewater recovery to process water via MBR/RO recovery technology(centralized recovery). We meter this volume and record on our enterprise-wide sustainability data metrics system. Within ourprocesses, our focus is on driving water efficiency at source, efficiency by design and recovering water, where food safety permits,for reuse within the process (decentralized recovery). We do not centrally track these individual volumes but we do manage bybenchmarking across product category for water efficiency per L or Kg of production. We do not have a wastewater MBR/ROrecovery process at this location.
Facility reference numberFacility 2
Facility nameNelamangala
% recycled or reused11-25%
Comparison with previous reporting year<Not Applicable>
Please explainAn MBR/and 2 stage RO water recovery process was installed at this site and started running in 2017. it is offsetting freshwaterusage in utilities by 11% in 2018 (Calculated).
Facility reference numberFacility 3
Facility nameRiverside, CA
% recycled or reused
CDP Page of 6746

None
Comparison with previous reporting year<Not Applicable>
Please explainWe do not have a wastewater MBR/RO recovery process at this beverage location.
Facility reference numberFacility 4
Facility nameCity Of Industry, CA
% recycled or reusedNone
Comparison with previous reporting year<Not Applicable>
Please explainWe do not have a wastewater MBR/RO recovery process at this beverage location.
Facility reference numberFacility 5
Facility nameBuena Park, CA
% recycled or reusedNone
Comparison with previous reporting year<Not Applicable>
Please explainWe do not have a wastewater MBR/RO recovery process at this beverage location.
Facility reference numberFacility 6
Facility nameFresno, CA
% recycled or reusedNone
Comparison with previous reporting year<Not Applicable>
Please explainWe do not have a wastewater MBR/RO recovery process at this beverage location.
Facility reference numberFacility 7
Facility nameSacramento, CA
% recycled or reusedNone
Comparison with previous reporting year<Not Applicable>
Please explainWe do not have a wastewater MBR/RO recovery process at this beverage location.
CDP Page of 6747

Facility reference numberFacility 8
Facility nameHayward, CA
% recycled or reusedNone
Comparison with previous reporting year<Not Applicable>
Please explainWe do not have a wastewater MBR/RO recovery process at this beverage location.
Facility reference numberFacility 9
Facility nameOakland, CA
% recycled or reusedNone
Comparison with previous reporting year<Not Applicable>
Please explainWe do not have a wastewater MBR/RO recovery process at this beverage location.
Facility reference numberFacility 10
Facility nameRancho Cucamonga
% recycled or reusedNone
Comparison with previous reporting year<Not Applicable>
Please explainWe do not have a wastewater MBR/RO recovery process at this beverage location.
Facility reference numberFacility 11
Facility nameKern, CA
% recycled or reusedNone
Comparison with previous reporting year<Not Applicable>
Please explainWe do not have a wastewater MBR/RO recovery process at this beverage location.
W5.1d
(W5.1d) For the facilities referenced in W5.1, what proportion of water accounting data has been externally verified?
CDP Page of 6748

Water withdrawals – total volumes
% verified76-100
What standard and methodology was used?An external process led by auditors, Bureau Veritas, on data verification/assurance has been established and running in PepsiCofor many years. Bureau Veritas performed its assessment in accordance with International Standard on Assurance Engagements3000 Revised, Assurance Engagements Other than Audits or Reviews of Historical Financial Information, effective for assurancereports dated on or after December 15, 2015, issued by the International Auditing and Assurance Standards Board (ISAE 3000Revised). This is part of our Sustainability Data Governance methodology and is documented.
Water withdrawals – volume by source
% verified76-100
What standard and methodology was used?An external audit process on data verification/assurance has been established and running in PepsiCo for many years. ERMperformed its assessment in accordance with PepsiCo's GEHSMS standard 36 on Resource Conservation.
Water withdrawals – quality
% verified76-100
What standard and methodology was used?Beverage plants' treated water must conform to WHO potable water standards at a minimum and is regularly tested by both in-house and external approved water labs. Snacks plant must comply with PepsiCo GEHSMS 40 Potable Water Standard.
Water discharges – total volumes
% verified76-100
What standard and methodology was used?An external audit process on data verification/assurance has been established and running in PepsiCo for many years. ERMperformed its assessment in accordance with PepsiCo's GEHSMS standard 30 on Wastewater Discharge.
Water discharges – volume by destination
% verified76-100
What standard and methodology was used?An external audit process on data verification/assurance has been established and running in PepsiCo for many years. ERMperformed its assessment in accordance with PepsiCo's GEHSMS standard 30 on Wastewater Discharge.
Water discharges – volume by treatment method
% verified76-100
What standard and methodology was used?An external audit process on data verification/assurance has been established and running in PepsiCo for many years. ERMperformed its assessment in accordance with PepsiCo's GEHSMS standard 30 on Wastewater Discharge.
Water discharge quality – quality by standard effluent parameters
% verified76-100
What standard and methodology was used?An external audit process on data verification/assurance has been established and running in PepsiCo for many years. ERMperformed its assessment in accordance with PepsiCo's GEHSMS standard 30 on Wastewater Discharge.
CDP Page of 6749

Water discharge quality – temperature
% verified76-100
What standard and methodology was used?An external audit process on data verification/assurance has been established and running in PepsiCo for many years. ERMperformed its assessment in accordance with PepsiCo's GEHSMS standard 30 on Wastewater Discharge.
Water consumption – total volume
% verified76-100
What standard and methodology was used?An external process lead by auditors, Bureau Veritas, on data verification/assurance has been established and running in PepsiCofor many years. Bureau Veritas performed its assessment in accordance with ISAE 3000 Revised. This is part of our SustainabilityData Governance methodology and is documented. performed its assessment in accordance with ISAE 3000 Revised.
Water recycled/reused
% verified76-100
What standard and methodology was used?Subject to the same data assurance program outlined above led by our external auditors, Bureau Veritas. Bureau Veritasperformed its assessment in accordance with ISAE 3000 Revised.
W6. Governance
W6.1
(W6.1) Does your organization have a water policy?Yes, we have a documented water policy that is publicly available
W6.1a
CDP Page of 6750

(W6.1a) Select the options that best describe the scope and content of your water policy.
Scope Content Please explain
Row1
Company-wide
Description of businessdependency on waterDescription of businessimpact on waterDescription of water-related performancestandards for directoperationsReference to internationalstandards and widely-recognized waterinitiativesCompany water targetsand goalsCommitment to align withpublic policy initiatives,such as the SDGsCommitments beyondregulatory complianceCommitment to water-related innovationCommitment tostakeholder awarenessand educationCommitment to waterstewardship and/orcollective actionAcknowledgement of thehuman right to water andsanitationRecognition ofenvironmental linkages,for example, due toclimate changeOther, please specify(commitment tocollaboration/partnerships)
PepsiCo is reliant on water in our products, our supply chain and in the communities of which we are a part. Thesustained crisis of global water insecurity and the closely interlinked crises of food, climate and health insecurity havebeen increasing in awareness by diverse stakeholders, including influencers, investors, customers, academics,employees and consumers. With awareness of these global realities comes increased visibility of corporate practicesand heightened expectations of performance. PepsiCo continues to activate a robust, comprehensive water-stewardship strategy, underpinned by our public commitment to respect water as a human right, based on five keyimperatives: Improving water efficiency in our direct operations; Extending conservation to our supply chain,particularly agriculture; Pursuing integrated watershed management; Partnering to help provide community access tosafe water; and Stewarding public water advocacy and engagement. In addition, we continue to partner externally toseek innovative solutions to the challenges we face, and also explore competitive opportunities through our productsand business models to use and transport less water.
W6.2
(W6.2) Is there board level oversight of water-related issues within your organization?Yes
W6.2a
CDP Page of 6751

(W6.2a) Identify the position(s) (do not include any names) of the individual(s) on the board with responsibility for water-related issues.
Positionofindividual
Please explain
Board-levelcommittee
Under PepsiCo’s By-Laws and Corporate Governance Guidelines, the Board has the responsibility to manage the business of the Company. Becausesustainability matters are integrated into our business, the Board considers them an integral part of its business oversight. To clarify its role, the Boardamended PepsiCo’s Corporate Governance Guidelines in 2015 to add “sustainability” to the key aspects of PepsiCo’s businesses over which the Boardhas oversight responsibilities. In 2016, PepsiCo reviewed our sustainability governance structure to strengthen the integration of Performance withPurpose (PwP) into our business agenda. The PepsiCo Executive Committee (PEC) then assumed direct oversight of the sustainability agenda,including strategic decisions and performance management. The PEC is made up of the Chairman & CEO, the President, the CFO, Sector CEOs andfunctional heads, ensuring that sustainability is a key accountability for every member of our senior leadership team. Our Board of Directors hasoversight responsibility for PepsiCo’s integrated risk management framework, including risk assessment and risk mitigation of the Company’s top risks.The Board receives regular updates on key risks throughout the year and has tasked designated Committees of the Board with oversight of certaincategories of risk management. The Public Policy and Sustainability Committee of PepsiCo’s Board of Directors is responsible for annually reviewingthe Company’s key public policy and sustainability issues, such as water scarcity, including sustainability initiatives, and its engagement in the publicpolicy process. PepsiCo’s Risk Committee (PRC), including PepsiCo’s Chairman of the Board and Chief Executive Officer, meets regularly to identify,assess, prioritize and address our top strategic, operating, and business risks. The PRC is also responsible for reporting progress on our risk mitigationefforts to the Board, including with respect to water scarcity.
W6.2b
CDP Page of 6752

(W6.2b) Provide further details on the board’s oversight of water-related issues.
Frequencythat water-relatedissues areascheduledagendaitem
Governancemechanismsinto whichwater-relatedissues areintegrated
Please explain
Row1
Scheduled- somemeetings
MonitoringimplementationandperformanceOverseeingacquisitionsand divestitureOverseeingmajor capitalexpendituresProvidingemployeeincentivesReviewing andguiding annualbudgetsReviewing andguidingbusiness plansReviewing andguiding majorplans of actionReviewing andguiding riskmanagementpoliciesReviewing andguidingstrategyReviewing andguidingcorporateresponsibilitystrategyReviewinginnovation/R&DprioritiesSettingperformanceobjectivesOther, pleasespecify(operationsand supplychain priorities)
The Board oversees PepsiCo’s integrated risk management framework designed to identify, assess, prioritize, address,manage, monitor and communicate our top strategic, financial, operating, business, compliance, safety, reputational and otherrisks, including water-related risks across the organization. The PepsiCo Risk Committee (PRC) is a cross-functional diversegroup that meets regularly and is responsible for reporting progress on risk mitigation efforts to the Board. Agendas for thesemeetings include various governance mechanisms including reviewing PepsiCo's progress on water-related targets, budgets formajor capital expenditure investments, and updates to the Company's water risk mitigation strategy. The Risk Committee alsoreviews the potential impacts in agricultural commodity supplies, production disruptions due to water-related weather events,and regulatory changes that may impact PepsiCo's business. The Board receives regular updates on key risks throughout theyear. Key risks related to climate change and water scarcity identified by the Company are included in our 2018 Annual Reporton Form 10-K. The Public Policy and Sustainability Committee of PepsiCo’s Board of Directors oversees governancemechanisms including annual reviews of the Company’s key water-related public policy and sustainability issues and itsengagement in the public policy process.
W6.3
CDP Page of 6753

(W6.3) Provide the highest management-level position(s) or committee(s) with responsibility for water-related issues (do notinclude the names of individuals).
Name of the position(s) and/or committee(s)Other C-Suite Officer, please specify (Chief Vice Chairman and Chief Scientific Officer)
ResponsibilityBoth assessing and managing water-related risks and opportunities
Frequency of reporting to the board on water-related issuesAnnually
Please explainIn 2018, PepsiCo’s Chief Scientific Officer and Vice Chairman reported directly to our Chairman & CEO and oversaw thecompany’s PwP program. He brought deep science-based knowledge and insights to guide the Company's product portfoliotransformation efforts, as well as an intimate understanding of the challenges and opportunities that lie at the intersection of food,the environment, and people. He was involved in the day-to-day management of our strategy toward delivery of our sustainabilityagenda and his responsibilities included providing strategic direction, guidance and leadership on critical water-related issuesfacing the Company and actions the Company must take. He sat on the PRC, which meets regularly to identify, assess, prioritize,address, manage, monitor and communicate our top enterprise risks. The PRC is also responsible for reporting progress on our riskmitigation efforts to the Board on an annual basis, including with respect to water scarcity.
W-FB6.4/W-CH6.4/W-EU6.4/W-OG6.4/W-MM6.4
(W-FB6.4/W-CH6.4/W-EU6.4/W-OG6.4/W-MM6.4) Do you provide incentives to C-suite employees or board members for themanagement of water-related issues?Yes
W-FB6.4a/W-CH6.4a/W-EU6.4a/W-OG6.4a/W-MM6.4a
CDP Page of 6754

(W-FB6.4a/W-CH6.4a/W-EU6.4a/W-OG6.4a/W-MM6.4a) What incentives are provided to C-suite employees or board membersfor the management of water-related issues (do not include the names of individuals)?
Who isentitled tobenefit fromtheseincentives?
Indicator forincentivizedperformance
Please explain
Monetaryreward
CorporateexecutiveteamChiefExecutiveOfficer(CEO)ChiefSustainabilityOfficer(CSO)Other C-suiteOfficer(President)
<NotApplicable>
Our corporate executive officers, including our CEO, our President and our Chief Scientific Officer (who also serves asthe head of our Sustainability agenda), have strategic objectives based on an individual executive’s role andaccountabilities that are aligned with our operational-water-efficiency goal. Performance against this goal impacts aportion of both annual and long-term incentives. Some of our business unit managers, water managers, and facilitymanagers also have annual water efficiency performance targets that line up with our 25% water use efficiency goal.PepsiCo has a pay-for-performance philosophy and the annual performance rating impacts annual merit increases,including bonuses. In addition, a wide range of complementary awards recognizes teams and associates for exceptionalperformance in sustainability, including projects that reduce product water efficiency.
Recognition(non-monetary)
Other,pleasespecify(BusinessUnitManagersand CountrySustainabilityTeams)
<NotApplicable>
Standout environmental performance towards PepsiCo's 2025 water targets (including improvements in operationalwater use efficiency by 25%, replenishing the water consumed by our high water risk manufacturing facilities, andproviding safe water access to 25 million people) were recognized at an annual, company wide award Performance WithPurpose Award celebration recognizing outstanding achievements that position our company for sustainable financialperformance and growth while leaving a positive imprint on society and the environment. In 2018, PepsiCo's El ObourPlant in Egypt won the "Planet" award for their water consumption optimization performance and projects. Beyond thePwP Awards, environmental good practice is recognized by senior leaders with appropriate awards, incentive andrecognition.
Other non-monetaryreward
No one isentitled totheseincentives
<NotApplicable>
W6.5
(W6.5) Do you engage in activities that could either directly or indirectly influence public policy on water through any of thefollowing?Yes, direct engagement with policy makersYes, trade associationsYes, funding research organizations
W6.5a
(W6.5a) What processes do you have in place to ensure that all of your direct and indirect activities seeking to influencepolicy are consistent with your water policy/water commitments?
PepsiCo has specific teams and individuals that are assigned responsibilities for developing corporate policy and regulatory positionsas well as engaging on regulatory policy with external stakeholders, including public policymakers, trade associations and non-government actors. The Public Policy and Government Affairs (PPGA) teams manage relationships with government actors andcoordinates activities that may influence regulatory policy globally. Internally the PPGA team also works closely with the Office ofSustainability to ensure that our external engagements are aligned with our overall water strategy. PPGA teams embedded within ourbusiness divisions and markets also work with their counterpart sustainability teams within those divisions as well as the Office ofSustainability to align on activities. If inconsistencies between corporate policies and business strategies occur, the PPGA and Officeof Sustainability teams work together to resolve those inconsistencies, bringing in senior executives’ input, as needed.
W6.6
CDP Page of 6755

(W6.6) Did your organization include information about its response to water-related risks in its most recent mainstreamfinancial report?Yes (you may attach the report - this is optional)
W7. Business strategy
W7.1
(W7.1) Are water-related issues integrated into any aspects of your long-term strategic business plan, and if so how?
Are water-relatedissuesintegrated?
Long-termtimehorizon(years)
Please explain
Long-termbusinessobjectives
Yes, water-relatedissues areintegrated
> 30 Water issues included in our long-term business objectives include improving our operational water use efficiency. One of theways that this is integrated into the plan includes the investments that we make in support of delivering the target - the capitalexpenditures we make are for long-term technology and infrastructure. In addition, we also integrate this and other goals into ourplan by reporting up on our progress to both PepsiCo's Risk Committee and the Board of Directors. PepsiCo's Positive WaterImpact Strategy is directly aligned with our business strategy to be a good global citizen and to reduce our environmentalfootprint. This was formalized with the 2016 launch of our Performance with Purpose strategy. Specifically, in support of thisstrategy and our long-term business objectives, PepsiCo aims to do the following in high water risk areas by 2025: improve ouroperations water use efficiency by 25%, replenish the amount of water consumed by our manufacturing facilities, and adopt theAlliance for Water Stewardship standard as a vehicle for advocacy.
Strategyforachievinglong-termobjectives
Yes, water-relatedissues areintegrated
> 30 Water issues considered in our strategy for achieving long term objectives include our water risk assessments of both ourmanufacturing operations and our agricultural supply chain. In 2016 we launched our Performance with Purpose strategy, whichincluded our positive water impact strategy, with most goals having target end dates of 2025. However, our strategy for achievingour long-term business objectives extends well beyond 2025. As one example of how we integrate this into our plan, our strategyfor mergers and acquisitions (M&A) includes a requirement for water risk assessment of any M&A activity. In the event that anacquisition is projected to experience water stress now or in the future, we build into our long-term strategy for that acquisitionplans to maximize water-use efficiency in plant locations. Since those locations are long-term (over 30 years) assets to PepsiCo,our strategy is intended to help protect those assets from water-related risks for that time period.
Financialplanning
Yes, water-relatedissues areintegrated
> 30 Our sectors and business units incorporate water-related issues, including necessary investments for our water goals includingoperational water use efficiency and replenishment projects, into annual budgets. In addition, our financial planning also includesconsideration of our business growth and new water-related issues that might impact the business. Our Performance withPurpose strategy, which included our positive water impact strategy, was launched in 2016, with most goals having target enddates of 2025. However, our financial planning to implement our strategy to achieve our long-term business objectives extendswell beyond 2025. As one example of how we integrate this into our plan, our strategy for mergers and acquisitions (M&A)includes a requirement for water risk assessment of any M&A activity. In the event that an acquisition is projected to experiencewater stress now or in the future, we build into our long-term strategy for that acquisition plans to maximize water-use efficiency inplant locations. Since those locations are long-term (over 30 years) assets to PepsiCo, our strategy is intended to help protectthose assets from water-related risks for that time period.
W7.2
CDP Page of 6756

(W7.2) What is the trend in your organization’s water-related capital expenditure (CAPEX) and operating expenditure (OPEX)for the reporting year, and the anticipated trend for the next reporting year?
Row 1
Water-related CAPEX (+/- % change)0
Anticipated forward trend for CAPEX (+/- % change)0
Water-related OPEX (+/- % change)0
Anticipated forward trend for OPEX (+/- % change)0
Please explainOur spending on water-related CAPEX and OPEX was essentially unchanged in 2018. The CAPEX and OPEX spend on water isprioritized to the most acutely water stressed locations and approval is conditional on meeting specific ROI and other criteria. Overthe next two years PepsiCo is planning on additional water recovery, reuse and water efficiency improvement projects involvingCAPEX in support of our 2025 water goals.
W7.3
(W7.3) Does your organization use climate-related scenario analysis to inform its business strategy?
Use ofclimate-relatedscenarioanalysis
Comment
Row1
No, butweanticipatedoing sowithin thenext twoyears
Climate-related scenario analysis is not currently used as we are making efforts towards understanding this new concept, engaging with variousstakeholders and gathering guidance and advice from our strategic partners. It is a fairly new concept within our sector and we are making everyeffort to position ourselves for success in the coming years. During 2019, we are initiating a preliminary effort on conducting climate-relatedscenario analysis to further inform our business strategy and goal. We will evaluate available transition and physical risk scenarios like IEA WEO,IEA ETP, DDPP, IRENA Remap, Greenpeace, and IPCC RDCs and evaluate relevance to our business. For the most material risks we willevaluate business impact and adaptation strategies. We will complete this analysis effort by the end of 2019. Scenario analysis could not only helpus determine possible futures but also help us identify additional pathways and technologies for emissions reduction.
W7.4
(W7.4) Does your company use an internal price on water?
Row 1
Does your company use an internal price on water?No, but we are currently exploring water valuation practices
Please explainPepsiCo does not currently use an internal price on water, but we do recognize and take into account the social and environmentalcosts and benefits of water through our PwP water goals and Positive Water Impact strategy. There are several existing watervaluation techniques, including some highlighted in the World Business Council for Sustainable Development's "Business Guide toWater Valuation" that could apply to different parts of PepsiCo's business.
W8. Targets
CDP Page of 6757

W8.1
(W8.1) Describe your approach to setting and monitoring water-related targets and/or goals.
Levels fortargetsand/orgoals
Monitoringatcorporatelevel
Approach to setting and monitoring targets and/or goals
Row1
Company-widetargetsand goalsBusinesslevelspecifictargetsand/orgoalsActivitylevelspecifictargetsand/orgoalsSite/facilityspecifictargetsand/orgoalsCountryleveltargetsand/orgoalsBasinspecifictargetsand/orgoals
Targets aremonitoredat thecorporatelevelGoals aremonitoredat thecorporatelevel
From the very beginning of Performance with Purpose (PwP) in 2006, water stewardship has been one of our top priorities. We havelearned from our efforts in the last decade and consulted with partners and independent experts to inform the water stewardshipgoals that went into our 2025 agenda. As a result, we have significantly raised the bar from our first set of Performance with Purposegoals. Our 2025 goals are more comprehensive in their scope and focused on a holistic view of our value chain and the watershedswhere we operate. As an example, we have set a company-wide replenishment goal that focuses on high water-risk areas wherewe operate. This is one of seven water goals under our 2025 agenda. At the activity- and site-levels, this goal applies to ourmanufacturing operations in high water-risk areas and they have replenishment targets that roll up at the facility, country, andbusiness sector levels. Key to our goal is the local context and our aim to replenish water in the same watershed where it wasextracted. We monitor progress on replenishment and all other water goals and targets at the corporate level.
W8.1a
(W8.1a) Provide details of your water targets that are monitored at the corporate level, and the progress made.
Target reference numberTarget 1
Category of targetWater use efficiency
LevelCompany-wide
Primary motivationWater stewardship
Description of targetOur goal is to build on the 25% improvement in water-use efficiency achieved in our first generation Performance with Purpose(PwP) goals, which ended in 2015, with an additional 25% improvement by 2025, with a focus on manufacturing operations in highwater-risk areas.
Quantitative metricOther, please specify (% reduction per unit of production)
Baseline year2015
CDP Page of 6758

Start year2016
Target year2025
% achieved22
Please explainIn 2018, we achieved an improvement of approximately 5 percentage points in our water-use efficiency rate per unit of productionacross all of our company-owned manufacturing locations compared to 2015. This improvement builds on the work that we havebeen focused on for the last decade, in which we improved water-use efficiency per unit of production by 25.8% against a baselineof 2006 in our legacy operations.
Target reference numberTarget 2
Category of targetWatershed remediation and habitat restoration, ecosystem preservation
LevelCompany-wide
Primary motivationShared value
Description of targetReplenish 100% of the water we consume in manufacturing operations located in high water-risk areas, ensuring that suchreplenishment takes place in the same watershed where the extraction has occurred.
Quantitative metricOther, please specify (Percent replenished)
Baseline year2015
Start year2016
Target year2025
% achieved13
Please explainIn 2018, we replenished nearly 1.2 billion liters of water in projects in Brazil, Guatemala, India, Mexico, and the US. In India,completed projects have over-delivered on our replenishment targets, reflecting strong local programs to reduce community waterinsecurity that have been in place for several years and which pre-date the launch of our global replenishment goal. Staying true toour goal of replenishing back to each of the high water-risk watersheds we are withdrawing form, we have capped at 100% thereporting of benefits from projects that achieved more than 100% of their watershed targets. Globally, we have met 13% of our2025 target . While this is strong progress, it reflects activity in a limited number of watersheds, thus our focus this year is more onexpanding replenishment activity to high water-risk watersheds across multiple countries. We added projects in the DominicanRepublic and South Africa in 2018, and our goal is to expand the reach of countries in 2019.
Target reference numberTarget 3
Category of targetWater, Sanitation and Hygiene (WASH) services in the community
LevelOther, please specify (communities near where PepsiCo works)
Primary motivationShared value
Description of target
CDP Page of 6759

Goal: With the PepsiCo Foundation and its partners, work to provide access to safe water to a total of 25 million people since 2006in the world’s most at-water-risk areas, with a focus on communities near where PepsiCo works.
Quantitative metricOther, please specify (# people provided access to safe water)
Baseline year2005
Start year2006
Target year2025
% achieved88
Please explainIncreasing access to safe water for vulnerable individuals is one of the most urgent challenges the world faces. Addressing thischallenge has been a priority for PepsiCo. Since 2006, through partnerships funded by the PepsiCo Foundation, we have providedaccess to safe water to over 22 million people by the end of 2018.
Target reference numberTarget 4
Category of targetWater, Sanitation and Hygiene (WASH) services in the workplace
LevelCompany-wide
Primary motivationRecommended sector best practice
Description of targetGoal: Ensure appropriate access to WASH for 100% of our own manufacturing employees.
Quantitative metricOther, please specify (conformance to PEP WASH standard)
Baseline year2015
Start year2016
Target year2025
% achieved92
Please explainOur business depends on the thousands of dedicated employees in our manufacturing sites who ensure the safety and quality ofour products, and we in turn, are committed to providing safe conditions for them. Critical to this is the provision of access toWASH. In 2018, PepsiCo achieved 92 percent against the World Business Council for Sustainable Development (WBCSD) WASHpledge. We grouped these criteria into two categories: critical and programmatic, establishing these designations to prioritizecapital investment.
Target reference numberTarget 5
Category of targetOther, please specify (Agricultural water use efficiency )
LevelCompany-wide
CDP Page of 6760

Primary motivationRisk mitigation
Description of targetGoal: Improve the water-use efficiency of our direct agricultural supply chain by 15% in high-water-risk sourcing areas, a volumeapproximately equivalent to the entire water use of all PepsiCo direct operations.
Quantitative metricOther, please specify (Percent water use efficiency improvement)
Baseline year2015
Start year2016
Target year2025
% achieved20
Please explainWe are supplying farmers with more efficient irrigation equipment, enabling them to move from flood to drip irrigation. Thisconversion in turn, changes the way farmers apply nutrients, improving soil health, yields and crop quality. We are also increasinglypromoting the use of cover crops, which improves soil moisture. We have focused our efforts on establishing the requiredprocesses and protocols and developing individual road maps in specific locations. We have gathered the baseline data fromcountries where we have direct crops in water-stressed regions. For each farmer group, we have calculated their baseline wateropportunity and are identifying local goals and implementation plans. The 3% agriculture water use efficiency here is from 2017,measured against the 2015 baseline. These results were only finalized in 2018 given the overlaps between crop year and calendaryear.
Target reference numberTarget 6
Category of targetWater pollution reduction
LevelCompany-wide
Primary motivationReduced environmental impact
Description of targetGoal: Ensure that 100% of wastewater from our operations meets PepsiCo's high standards for protection of the environment
Quantitative metricOther, please specify (% wastewater tha tmeets PepsiCo's wastewater standard)
Baseline year2015
Start year2016
Target year2025
% achieved98
Please explainPepsiCo’s Global Environment, Health and Safety Management System is a robust set of management and technical standardsthat provide guidance on acceptable and applicable operating parameters for our operations. One such technical standard is theDischarge of Process Wastewater Standard, which is aligned with the World Bank’s International Finance Council and Business forSocial Responsibility’s (BSR) Sustainable Water Group. PepsiCo maintains the high standard that although compliance with localstandards is necessary, it is sometimes not enough. In some parts of the world, local wastewater direct discharge limits may not besufficient to protect against degradation of the water quality of the local environment. In such cases, we require our manufacturing
CDP Page of 6761

operations to meet PepsiCo’s more stringent discharge limits. In 2018, nearly 98 percent of wastewater from our operations metPepsiCo's high standards for protection of the environment.
W8.1b
(W8.1b) Provide details of your water goal(s) that are monitored at the corporate level and the progress made.
GoalEngagement with public policy makers to advance sustainable water management and policies
LevelCompany-wide
MotivationRecommended sector best practice
Description of goalWhile we know we can make a significant impact in water stewardship through the actions we take across our value chain, we alsohave opportunities to help mitigate water insecurity on a broader level, through advocacy. At PepsiCo, we have two goals toaddress this: First, we aim to advocate for strong water governance in communities and watersheds where we operate, promotingwater solutions that meet local needs. Second, we aim to initiate and support collaborative efforts with other stakeholders toaddress water risk and mitigate water insecurity. These goals, which we collectively refer to as 'advocacy' are important to PepsiCobecause we recognize that we cannot mitigate water insecurity on our own. This is a company-wide goal under our 2025 PwPagenda because sustainable water management and policies are important across the globe and across all sectors, and we areprioritizing our actions in the space based on where water insecurity is a challenge, where there is an advocacy need, and wherewe have been able to enter into collaborations with other water stakeholders.
Baseline year2015
Start year2016
End year2025
ProgressThis is a qualitative goal without a numeric target. Indicators of success include initiatives that we have engaged in and assessedas having a ‘positive water impact’ in the local water landscapes. Within the threshold of success, we had several examples ofprogress in the area of advocacy during 2018, including joining the Alliance for Water Stewardship and initiating plans to adopt theAWS standard as a vehicle for advocacy at our high water risk facilities. In addition, we are participating in a collaborative efforttaking place across 12 countries in Latin America, through a partnership between PepsiCo, the PepsiCo Foundation and the Inter-American Development Bank. Enabled by a $5 million grant from the PepsiCo Foundation, we are working together to launch aregional center for applied water resources management through the Hydro-BID program, an innovative data management andmodeling tool that estimates the availability of freshwater in water-scarce regions. Programs like these work because they arerooted in deep understanding of the needs of local communities and are executed in partnership with local partners. In addition,PepsiCo is represented on the Governing Council of the 2030 Water Resources Group. PepsiCo representatives are activelyinvolved with the World Bank’s WRG teams in India and Brazil, where activities align with our Positive Water Impact strategy.
W9. Linkages and trade-offs
W9.1
(W9.1) Has your organization identified any linkages or tradeoffs between water and other environmental issues in its directoperations and/or other parts of its value chain?Yes
CDP Page of 6762

W9.1a
(W9.1a) Describe the linkages or tradeoffs and the related management policy or action.
Linkage or tradeoffLinkage
Type of linkage/tradeoffDecreased GHG emissions
Description of linkage/tradeoffBy 2030, it is expected that the world will need to meet rising demand for the amount of food consumed, either by increasingproduction by 50% or substantially reducing the 35-50% of food that is currently wasted or lost through the value chain. At the sametime, a 40% gap in supply and demand for water and a 54% increase in energy needs are projected to develop based on currenttrends. If we follow business as usual, water use is expected to increase as we increase food production, which in turn shouldincrease GHG emissions, as more energy will typically be required to treat and pump water supplies. Our agricultural andoperations water-use efficiency goals could result in a decreased amount of energy use as well.
Policy or actionOur agriculture and operations water-use efficiency goals in turn were expected to positively impact our energy efficiency intreating, pumping, and distributing water to our facilities and our direct suppliers' fields. In addition, in our agricultural supply chain,we are pursuing adaptation strategies, such as developing drought-resistant potato varieties and transforming our product portfolioto less water intensive materials. This was directly linked to our sustainability strategy, with implications for our water, agriculture,and climate goals, and as a result we strategically consider these linkages. Instances in which we could reduce irrigation needsshould also improve energy efficiency and positively affect GHG emissions. In 2018, we reduced Scope 3 GHG emissions byapproximately 2.1 million metric tonnes versus our 2015 baseline, which represents approximately 7% of our 2030 target reductionamount.
Linkage or tradeoffLinkage
Type of linkage/tradeoffOther, please specify (Health and Wellness)
Description of linkage/tradeoffAccording to the United Nations, every day nearly 800 million people lack access to safe water and more than two billion people livewithout basic sanitation. Our Safe Water Access goal seeks to help address this gap and provide access to safe water to 25 millionpeople by 2025. Since 2006, through partnerships funded by the PepsiCo Foundation, we have provided access to safe water toover 22 million people as of the end of 2018.
Policy or actionIn 2016, as part of our water-related business strategy under Performance with Purpose, PepsiCo announced an increase in itspublic goal of providing access to safe water to 25 million people by 2025 (from a 2006 baseline). We are increasing the positiveimpact of the health and wellness/water linkage by increasing access to safe water: In addition to providing safe water access, ourinvestments also result in a significant improvement in the health, wealth and well-being of our beneficiaries. For example, ourprojects reduce the time spent by beneficiaries, often women and girls, in obtaining safe water for daily uses. Since 2006, throughpartnerships funded by the PepsiCo Foundation, we had provided access to safe water to over 22 million people by the end of2018, an increase from nearly 16 million people reported in 2017.
W10. Verification
W10.1
(W10.1) Do you verify any other water information reported in your CDP disclosure (not already covered by W5.1d)?Yes
CDP Page of 6763

W10.1a
(W10.1a) Which data points within your CDP disclosure have been verified, and which standards were used?
Disclosuremodule
Data verified Verificationstandard
Please explain
W2.Businessimpacts
Water withdrawals(volume andquality)
ISAE3000 An external process led by auditors, Bureau Veritas on data verification/assurance has been established and hasbeen running in PepsiCo for many years. This is part of our Sustainability Data Governance methodology and isdocumented.
W4. Risksandopportunities
Water withdrawals(volume andquality)
ISAE3000 An external process led by auditors, Bureau Veritas on data verification/assurance has been established and hasbeen running in PepsiCo for many years. This is part of our Sustainability Data Governance methodology and isdocumented.
W1. Currentstate
Water withdrawals(volume andquality)
ISAE3000 An external process led by auditors, Bureau Veritas on data verification/ assurance has been established and hasbeen running in PepsiCo for many years. This is part of our Sustainability Data Governance methodology and isdocumented.
W11. Sign off
W-FI
(W-FI) Use this field to provide any additional information or context that you feel is relevant to your organization's response.Please note that this field is optional and is not scored.
W11.1
(W11.1) Provide details for the person that has signed off (approved) your CDP water response.
Job title Corresponding job category
Row 1 Chief Science Officer Chief Sustainability Officer (CSO)
W11.2
(W11.2) Please indicate whether your organization agrees for CDP to transfer your publicly disclosed data on your impactand risk response strategies to the CEO Water Mandate’s Water Action Hub [applies only to W2.1a (response to impacts),W4.2 and W4.2a (response to risks)].Yes
SW. Supply chain module
SW0.1
CDP Page of 6764

(SW0.1) What is your organization’s annual revenue for the reporting period?
Annual revenue
Row 1 64661000000
SW0.2
(SW0.2) Do you have an ISIN for your organization that you are willing to share with CDP?No
SW1.1
(SW1.1) Have you identified if any of your facilities reported in W5.1 could have an impact on a requesting CDP supply chainmember?We do not have this data and have no intentions to collect it
SW1.2
(SW1.2) Are you able to provide geolocation data for your site facilities?Yes, for some facilities
SW1.2a
(SW1.2a) Please provide all available geolocation data for your site facilities.
Identifier Latitude Longitude Comment
1 10.79 76.78 Palakkad facility as reported in W5.1
2 13.14 77.34 Nelamangala facility as reported in W5.1
3 33.93 -117.3 Riverside facility as reported in W5.1
4 34.04 -117.98 City of Industry facility as reported in W5.1
5 33.87 -118.02 Buena Park facility as reported in W5.1
6 36.69 -119.77 Fresno facility as reported in W5.1
7 38.48 -121.4 Sacramento facility as reported in W5.1
8 37.61 -122.09 Hayward facility as reported in W5.1
9 37.77 -122.2 Oakland facility as reported in W5.1
10 34.08 -117.59 Rancho Cucamonga facility as reported in W5.1
11 35.4 -119.32 Kern facility as reported in W5.1
SW2.1
CDP Page of 6765

(SW2.1) Please propose any mutually beneficial water-related projects you could collaborate on with specific CDP supplychain members.
Requesting memberWal Mart de Mexico
Category of projectPromote river basin collective action
Type of projectInvite customer to collaborate with other users in their river basins to reduce impact
MotivationSupporting watershed conservation initiatives with large-scale results in five countries (six watersheds) in Latin America, PepsiCo'saim is to have a positive impact on water and people that is amplified and long-lasting.
Estimated timeframe for achieving project4 to 5 years
Details of projectIn 2016, PepsiCo and The Nature Conservancy announced a new collaboration for water replenishment in Latin America with acommitment to invest $3 million in the next seven years and impact five watersheds in Mexico, Brazil, Guatemala and Colombia.Since then, the partnership has expanded to the Dominican Republic. PepsiCo is supporting Water Funds in these geographies,collaborative efforts that bring together a wide range of stakeholders and partners.
Projected outcomeBased on PepsiCo's operational footprint in these geographies, we have set Water Fund-specific targets on outcomes such asreplenishment and hectares of land restored. PepsiCo's support rolls up into the broader Water Funds' collective action efforts toimprove water security within the watersheds.
Requesting memberMetro AG
Category of projectCommunications
Type of projectJoint case studies or marketing campaign
MotivationRaise awareness about water issues for METRO's customers and employees.
Estimated timeframe for achieving projectOther, please specify (Annual campaign)
Details of projectPepsiCo has participated in METRO Cash & Carry's World Water Day-related activities, along with other global suppliers, drawingattention to the issue of global water scarcity.
Projected outcomeOne outcome of this partnership has been an increased awareness among employees and customers about water scarcity andresource challenges. The campaign has also led to support of water sustainability campaigns that customers have supportedthrough the purchase of specific products.
SW2.2
(SW2.2) Have any water projects been implemented due to CDP supply chain member engagement?No
SW3.1
(SW3.1) Provide any available water intensity values for your organization’s products or services across its operations.
CDP Page of 6766

Submit your response
In which language are you submitting your response?English
Please confirm how your response should be handled by CDP
Public or Non-Public Submission I am submitting to Are you ready to submit the additional Supply Chain Questions?
I am submitting my response Public InvestorsCustomers
Yes, submit Supply Chain Questions now
Please confirm belowI have read and accept the applicable Terms
CDP Page of 6767