Embed Size (px)
Citation preview

PENNSYLVANIA DEPARTMENT OF ENVIRONMENTAL PROTECTION
BUREAU OF WATERSHED CONSERVATION
GROWING GREENER GRANT
FINAL PROJECT REPORT
Date: November 30, 2002 Project Title: VILLANOVA STORMWATER BIOINFILTRATION TRAFFIC
ISLAND (Originally Bioretention) ME # 350470 Watershed: 3-G Darby River Period: 31 May 2001 – 30 November 2002 Sponsor: Villanova University,
Department of Civil and Environmental Engineering Institute for Environmental Engineering Research
Principal Investigator: Robert G. Traver, Ph.D., P.E., Associate Professor
Department of Civil and Environmental Engineering Villanova University 800 Lancaster Ave., Villanova, PA 19085 (610)-519-7899 [email protected] www.engineering.villanova.edu/cee/vusp (610)-519-6754 (FAX)
Amount of 319 Funds Awarded $ 59,112 Match Proposed $ 29,143 Match Delivered $ 50,553

TABLE OF CONTENTS
3 NARRATIVE 6 SUMMARY 7 DETAILED TECHNICAL REPORTS 15 ACKNOWLEDGEMENTS 16 BIBLIOGRAPHY A–1 Appendix A - BMP Power point presentation B-1 Appendix B - Accomplishment Work Sheets C-1 Appendix C- Construction Photographs D-1 Appendix D- Design Components E-1 Appendix E – Final Budget Summary and Invoice
2

VILLANOVA STORMWATER BIOINFILTRATION TRAFFIC ISLAND NARRATIVE
What was the project suppose to accomplish? Quoting from the project proposal, the purpose of the project was:
To create a bioretention Best Management Practice (BMP) “Traffic Island”, To reduce stormwater nonpoint source pollution to the headwaters of Darby Creek, To enhance infiltration of stormwater, To verify design principles of the Pennsylvania BMP Manual, To create another permanent demonstration site on the Villanova campus, To create a BMP research site for the future.
Figure 1 - Villanova Bioinfiltration Traffic Island BMP
What did we actually do – and how did it differ from our original plan? We set out to design, build, and study a bioretention Best Management Practice
(BMP) that would benefit the Commonwealth as a demonstration and research site, and create a measurable environmental benefit for the Darby River. These goals have been accomplished. Originally termed a Bioretention BMP, due to the high infiltration of the soils, it is more accurately categorized as a Bioinfiltration BMP. Besides the title of the site, the only differences from the original plan were in the design and construction of the site, not the accomplishments.
3

The bioinfiltration BMP was created by retrofitting an existing traffic island on Villanova’s Campus as shown above in Figure 1. The facility intercepts runoff from a highly impervious (50.2%) small drainage area (1.2 acres) that previously would be collected by inlets and delivered through culverts to a dry detention basin without any chance to cleanse or infiltrate the stormwater runoff. The BMP is designed to control smaller storms (1 – 1.5 inches) through capturing and infiltrating the runoff, thereby reducing downstream stormwater volumes, stream bank erosion, and nonpoint source pollution to the headwaters of the Darby Creek. The advantage of this type of facility is the capture and infiltration of more than 80% of the annual rainfall from, thus reducing stream bank erosion and maintaining baseflow. The success of this design supports the “new” Act 167 technical approach and the principles of the Pennsylvania BMP Manual.
Figure 2 - Villanova University BMP Research and Demonstration Park
The Bioinfiltration BMP has been incorporated in the Villanova University Stormwater Best Management Practice (BMP) Demonstration and Research Park (Fig.2). Developed to promote both research and public awareness of stormwater BMP’s, the site has already been part of many tours. The site has been instrumented to collect data for research, and is currently the focus of a Master’s Thesis. Initial funding for planning of the BMP Park was through a separate Growing Greener grant (Traver 2002).
Besides a change in title, there were no changes to the scope of work. Changes did occur to the design and construction methods employed which allowed some funds to be shifted to purchase better monitoring equipment, and to student salary. In addition, salary earmarked for Faculty was redirected to the graduate students, and the University increased its match by allocating faculty time to the project.
The Villanova Stormwater Bioinfiltration Traffic Island project has met or exceeded all expectations and commitments. The University exceeded its promised match by over 70%.
4

What were the reasons for our success?
The involvement of all parties in the design and construction was the primary reason the project was so successful. The final design incorporated ideas from the Villanova Facilities Management Office, the Contractor, PaDEP representatives, and comments from the many visitors to the site. By remaining flexible and remaining open to ideas, the finished project was a great improvement over the original design. It should be noted that design details were discussed at several American Society of Civil Engineers National Conferences, and many suggestions were used from the participants in these conferences.
What problems were encountered and how did we deal with them?
No significant problems were encountered during the design and construction of the site due to the flexibility as mentioned previously. Problems did develop during the monitoring and study part of the project. First, a drought delayed the start of hydraulic monitoring. Second, the manufacturer shipped the wrong frequency ultrasonic depth sensor. As the error could only be determined by examining the part numbers, it was not found for several months after shipping the instruments back to the factory multiple times for repair. This wasted several months of the study. It was corrected by the manufacturer, and Villanova shifted resources to the students in order to complete the study.
How does your work contributed to solution of original problems? What are your plans for disseminating results of your work?
This site, as part of the Villanova Demonstration and Research BMP Park provides a showcase of how to implement this new technology, and an opportunity to conduct research. As stated in the project report, well over 500 water resource professionals, township officials, and concerned citizens have toured the site. The Environmental and Water Resources Institute (part of the American Society of Civil Engineers) has selecting the site for visitation as part of their national conference in Philadelphia during June 2003. The site will also be part of the Pennsylvania Stormwater Symposium (October 2003). Power-point presentations have been available on the web for some time for this and other projects, and Dr. Traver has made presentations to many groups. Most recently he presented this project at the AWRA national convention (Nov 2002). As promised, the site was featured during several Best Management Practice Symposiums held on campus at no cost to the project. In addition, a signboard at the project discusses its purpose, construction, and benefits.
As a research site the potential is just beginning to be realized. The recent approval of a two year research partnership with PaDEP will dramatically aid the profession and the Commonwealth. This report will be made available through the Villanova Website, and will be updated as more studies are conducted on the site.
5
What else needs to be done? This site is intended to both demonstrate the technology and to enable long term research. While the mechanisms used by infiltration BMP’s are generally understood, much needs to be learned. Research into their effectiveness from a site and watershed viewpoint, design criteria, and maintenance needs to be studied on a long term basis. The first study on the site is underway in the form of a Masters thesis. Hopefully the recently formed Villanova Stormwater Urban Partnership will provide a funding mechanism for future studies. Further, the public and the profession have to be educated as to their function and value. Both this research and education are needed to meet the Phase II National Pollutant Discharge Elimination System (EPA 1999) goals.
How well did our spending align with the budget request?
Construction savings due to design changes and tight contractual control enabled the university to redirect some funds to increase the capability of the monitoring equipment and extend the hydraulic study due to the recent rainfall drought. The loss of data due to the initial malfunctioning of the equipment required an extension to the study which was supported by redirecting faculty funding to student salaries, and allocating faculty workload to the project as a match. The faculty workload match is reported in the revised project budget (Annex E), but is an underestimate. SUMMARY An existing traffic Island has been converted into a stormwater Bioinfiltration best management practice. Designed to infiltrate the first inch of runoff, this translates to well over 80 % and possible 90% of the annual rainfall as measured by the Chadds Ford Pennsylvania raingage. This infiltration BMP thereby effectively treats the non point source pollution present in the watershed runoff, recharges the runoff, thereby reducing downstream channel erosion. This site would exceed the “new” Pennsylvania Stormwater Management Act 167 Technical Requirements for Recharge, Water Quality, and Channel Protection. Developed as both a demonstration project and a site for future research, the site excels at both. To date over 500 water resource professionals, municipal officials and concerned citizens have toured the project. This site has been incorporated into Villanova’s BMP Stormwater Park, joining a stormwater wetland, and a porous concrete BMP. Current research underway shows great promise. While the basic function of bioinfiltration BMPs is understood, many questions on their design, maintenance, and how to best utilize them as part of a watershed plan remain. Many studies are expected from the site now and in the future. For more information, go to the project website at: www.engineering.villanova.edu/cee/vusp
6

DETAILED TECHNICAL REPORT
Design Focus
Design of Bioinfiltration BMP’s primarily focuses on water quality improvement, channel protection, and restoration of infiltration. While these devices do reduce the volume of runoff, they are not as effective at reducing major storms (25 - 100 Year Events) by themselves. The design criterion focuses on directing the runoff into the BMP, the volume of runoff, storage volume within the BMP (both basin and made soil), and infiltration rates for the made soil and the undisturbed soil underneath.
For this site, the volume of a watershed inch was chosen as the initial goal. This
would be considered a large infiltration volume for the site, but as this is both a research and demonstration site it was decided to maximize the site capacity. Using a graph of the capture rainfall from the Chadds Ford rain gage (Fig.3) a capture design of one inch of rainfall equates to over 80% of the annual rainfall. Capture design means that all storms of less then one inch and the first inch of all storms greater then one inch are captured, and in this case infiltrated. As some infiltration will occur on the contributing drainage area, the capture volume is probably closer to 85 or 90 % of the yearly runoff from this site.
Chadds Ford Daily Rainfall
0
20
40
60
80
100
0 0.5 1 1.5 2 2.5 3 3.5
Capture Rainfall
Perc
ent
0
10
20
30
40
50
Percent Capture
Ave Yearly Capture
1948-2001 - Ave Yearly 40.6"
Figure 3 - Chadds Ford Raingage Contributing Watershed
The contributing drainage area is approximately 1.2 Acres in size and 50%
impervious (Figure 4). The impervious area is made up of roads, parking and basketball courts. The pervious area is all grass. Runoff travels as overland flow, gutter flow, or through a culvert to the traffic island. See Appendix D for detailed information on the site.
7

Figure 5 - Site and Surrounding Area Before Construction
Figure 4 - Contributing Watershed
8

Bioinfiltration Traffic Island
Figure 6 - Bioinfiltration Traffic Island – Top View
Figure 7 - Bioinfiltration Traffic Island - Side View
9

An existing traffic island was retrofitted as shown above in Figures 6 and 7. The infiltration portion is a bed of porous “made” soil. A basin is left above the made soil to give the water time to infiltrate. The construction sequence was to first excavate the site. The soil was sifted and mixed with 50% sand to create a very sandy mixture (made soil), and then replaced. Appendix D contains detailed information on the soil properties of the site.
To “capture” the runoff, the existing drainage culvert was diverted into the site.
As shown in Figures 6 and 7, a hole was cut in the side of the adjacent inlet redirecting the flow into the inlet. A weir was constructed in the inlet to enable this redirection. Two curb cuts were made to capture runoff from the adjacent parking areas. One inlet was filled in with rock and sealed with asphalt during this process. During larger flows, the water in the culvert will jump the weir in the inlet, thus using the original culvert system. Overflows within the island will go over the curb and back into the original drainage path.
Planting of the traffic island is required to maintain infiltration, increase
evapotranspiration, to minimize erosion, and to create a good neighbor (Fig. 1). Plantings were designed by Chuck Leeds (chief horticulturist of Villanova’s Facility Management Office. As the soil is either extremely wet or dry, selection of the plants was based upon their survive ability. A listing of the plants is shown in Appendix D. Initially, mulch was used to minimize erosion of the surface of the traffic island. This was a one time application, and since then small rounded river rock has been used in eroding areas.
An as-built survey of the site confirmed the project did indeed meet the goal of capturing 1 inch of runoff. As shown below in Figure 8, the combination of void space in the bed, and storage above the bed resulted in a combined volume of one inch.
Figure 8 - Traffic Island Properties
10

Construction Costs
Considerable savings were realized from the original budget by the decision to make the porous soil instead of importing it, and by paying per hour for the project. The original budget incorporated the excavation and disposal of the original soil, and the cost of purchasing new soil to our specifications. By making the soil on site, this saved the purchase and disposal of the original soil, but added the cost of “making” the soil. The contractors estimate for the complete job was high, probably due to the experimental nature of the work. Bidding the job on a per hour basis was much more affordable. The original and actual budgets are shown below in Figure 9. It should also be noted that these costs would be lower if this project was installed at the time of construction of the parking areas. The excavation costs would be lower, curb cuts would not be included, and several inlets and pipes would not have been needed if the project had been built during the original construction.
Actual Budget +/-
OVERALL 30999 37200 6201Supervision 2200 2775 575Excavation 8912 9000 88Dumping 2400 2250 -150Make Soil 6248 8375 2127Sand 2755 5000 2245Emplacement 6933 6000 -933Pipe installation 450 1000 550Curb cuts 554 1500 946Observation Well 547 1300 753
Note + is a savings
Figure 9 - Actual and Original Construction Budgets.
Storm Event – January 2002
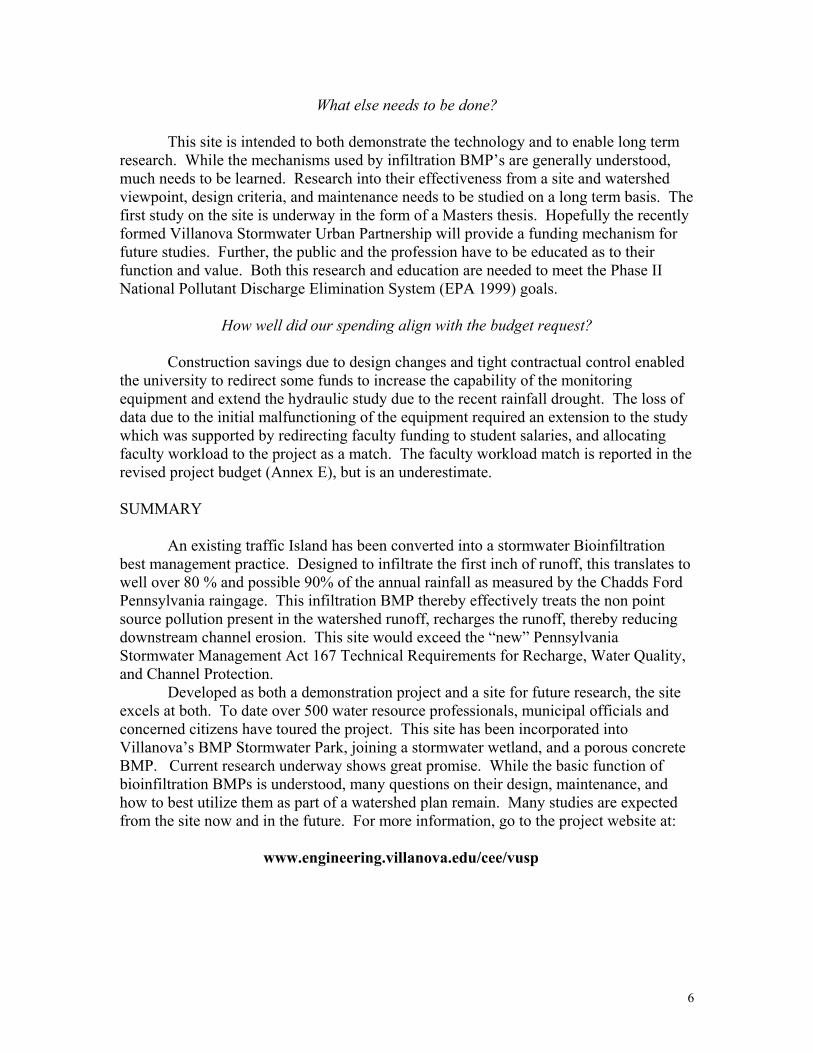
An early test to the system was the January 2002 snowmelt and rain event as
shown by the photographs below (Fig. 10). After a snow storm, a warm front came through bringing rain, melting the snow creating a fairly significant runoff event. While at this point no instrumentation was in place, it clearly was a fairly large event. The site functioned as expected, capturing and then infiltrating the runoff into the ground. Note that within 48 hours the pooled water is no longer visible.
11
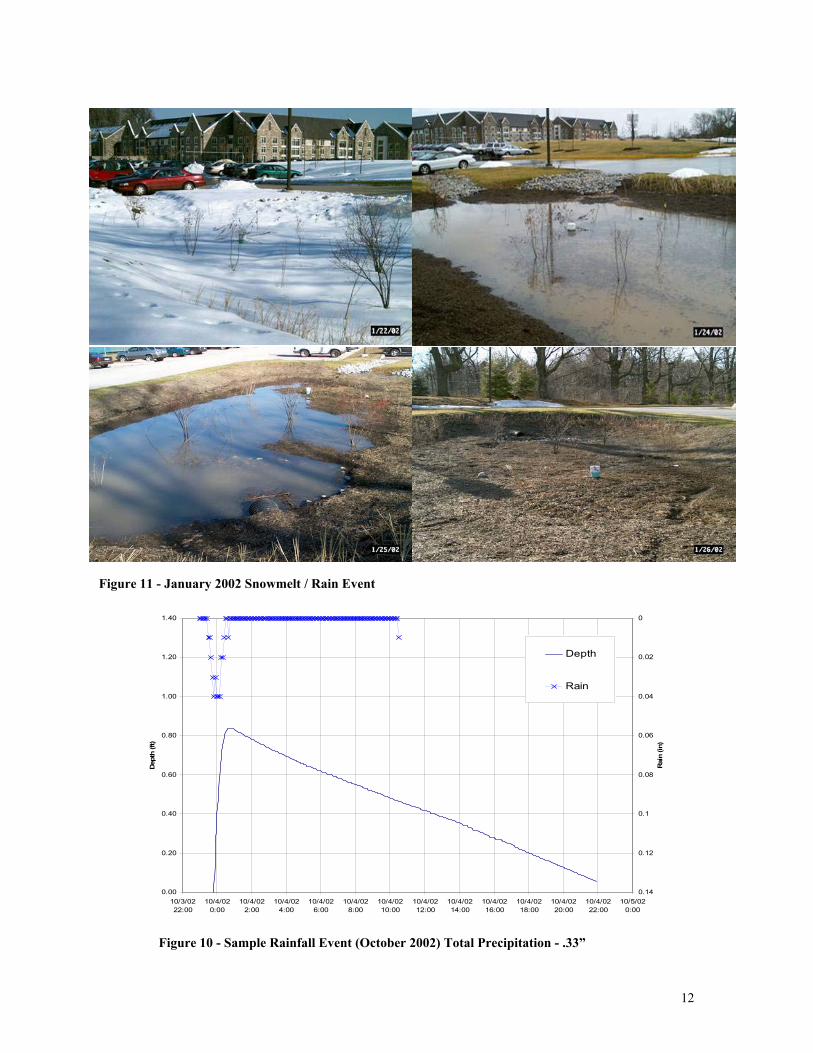
Figure 11 - January 2002 Snowmelt / Rain Event
0.00
0.20
0.40
0.60
0.80
1.00
1.20
1.40
10/3/0222:00
10/4/020:00
10/4/022:00
10/4/024:00
10/4/026:00
10/4/028:00
10/4/0210:00
10/4/0212:00
10/4/0214:00
10/4/0216:00
10/4/0218:00
10/4/0220:00
10/4/0222:00
10/5/020:00
Dept
h (ft
)
0
0.02
0.04
0.06
0.08
0.1
0.12
0.14
Rain
(in)
Depth
Rain
Figure 10 - Sample Rainfall Event (October 2002) Total Precipitation - .33”
12

Monitoring / Research Monitoring of infiltration BMP’s is much more difficult then that of stormwater
wetlands or detention basins. Entering inflow through the curb cuts is difficult to measure, and so is the infiltration leaving the site. The monitoring plan thus centered on collecting data that would allow the development of a hydrologic model for the site.
To accomplish this task, an ultrasonic level meter and a tipping bucket raingage
were installed. In addition two wells were drilled, one to the bottom of the made soil, and one to the side four feet below the made soil. Pressure transducers were added to record depth, with all four meters collecting data on a five minute (or less) basis for use in hydrologic modeling. Due to short battery life, a connection to include a transformer was added that would recharge the batteries every night when the area lighting turns on.
As shown by Figures 11 and 12 the data collection is extremely successful. The
ultrasonic level monitor clearly show the build up and infiltration of storm events. The rainfall is recorded across the top for both storm events. In the first case of a light storm all of the runoff infiltrates into the basin. Figure 12 shows a heavier storm where the water level exceeds the weir. This storm was close to a 2 year storm for the area, and some runoff bypassed the BMP. By taking the downward slopes, an infiltration rate can be determined. For all depths greater than 0.71 ft, the infiltration rate was 0.0082 cfs. Below that level, the infiltration rate changes with respect to depth and decreases as the depth decreases. This could be attributed to either the geometry of the basin or the decrease in the head, causing a smaller driving force into the soil. These values vary from storm to storm, clearly dependent on previous storm events. In all cases to date all water has infiltrated within two days. To date no water has been observed in these wells, meaning the system has not become saturated and the water is moving through the soil as unsaturated soil moisture. In the future, we hope to add a series of soil moisture meters and lysimeters.
0.0
0.2
0.4
0.6
0.8
1.0
1.2
1.4
1.6
1.8
2.0
9/26/026:00 AM
9/26/0212:00PM
9/26/026:00 PM
9/27/0212:00AM
9/27/026:00 AM
9/27/0212:00PM
9/27/026:00 PM
9/28/0212:00AM
9/28/026:00 AM
9/28/0212:00PM
9/28/026:00 PM
9/29/0212:00AM
9/29/026:00 AM
9/29/0212:00PM
Dep
th of P
ond mea
sured fro
m lo
wes
t point (ft)
0
0.05
0.1
0.15
0.2
0.25
0.3
0.35
0.4
0.45
0.5
Rain (in)
Depth of Pond
Elevation of top of Weir (1.22 ft)
Rain (in)
Elevation of Weir 1 21 ft
Figure 12 - Sample Rainfall Event (September 2002) – Total Rainfall – 3.00”
13

Modeling of the System
Figure 13 shows an early attempt to model the infiltration basin using modified puls routing and the HEC-HMS computer model (HEC 2000). The watershed and storm data were used to develop a model for the traffic island and surrounding drainage area. Using NRCS methods (HEC 2000), runoff from the watershed was routed into a reservoir. A storage-outflow table was imputed, with the weir and infiltration acting as the outflow for various water surface elevations. Using the real precipitation data, the model was run for the storm event. The total rainfall of 3.00 in. produced 1.96 in of runoff. Initial results reflect a gain of .51 inches of infiltration during the event, meaning the volume of runoff was greatly reduced. Figure 13 shows the actual depth versus the calculated depth over time for this event.
0
0.2
0.4
0.6
0.8
1
1.2
1.4
1.6
0 500 1000 1500 2000 2500 3000 3500 4000 4500
T im e (m in)
Leve
l (ft)
HM S Data O bserv ed
Figure 13 - Actual versus Calculated Depths for Storm Event
While these results look impressive, the results are not as good when applied to other rainfall events. We are finding that the infiltration rate changes as a function of previous rainfall. Currently Mr. Matt Prokop is studying this topic and the site is the focus of his Masters Thesis due out in May 2003.
Future Research
Villanova is committed to long term research on the site. Future research questions include performance, maintenance, and effectiveness of the site. Plans include the installation of several lysimeters to aid in water quality sampling, and moisture meters to track the level of moisture in the soil. Research on this site is expected to continue for a long period of time.
14

Summary - A Discussion of Act 167 Requirements
The role of infiltration BMP’s is definitely a hot topic of the water resource community, as evidenced by many efforts to study infiltration (ASCE 1999). The Maryland approach to stormwater Management (MDE 2000) focuses on five separate criteria’s to include infiltration, water quality, channel protection, and medium and large extreme events management. Infiltration – The infiltration achieved greatly exceeds the preconstruction infiltration of the site. Future studies will determine how large an impervious area this one site would compensate for. Based upon the current record of events captured, we have recently increased the weir height to further increase the islands capture ability. This site exceeds any criteria for infiltration. Water Quality – The advantage of this type of facility is through the capture and infiltration of more than 90% of the annual rainfall, there would be no surface runoff pollutant input to the headwaters from all the infiltrated storm events. The first flush (1”) is generally considered the dirtiest, and this is entirely captured by this design. The research question in the future is the effectiveness of the soil in removing the pollutants from any base flow contribution. This site exceeds any criteria for water quality treatment. Channel Protection – Again, as the great preponderance of the annual stormwater is infiltrated, stream channel erosion is greatly reduced. This site exceeds any criteria for channel protection for this site. Medium and Large Storm Flooding – As the capture is during the initial portion of the storm, this site by itself does not protect against large extreme events though it may reduce their magnitude thus reducing the added protection needed. Study of this topic is planned in the near future.
We feel that the demonstration and research value of this site is extraordinary, and will benefit the citizens of the Commonwealth of Pennsylvania for a long period of time. ACKNOWLEGMENTS
Funding for the Villanova Bioinfiltration Traffic Island was provided by the Pennsylvania Department of Environmental Protection (PaDEP) through the Growing Greener Grant program. This support does not imply endorsement of this project by EPA or PaDEP. The author wishes to thank his current and former graduate students, in particular Carter Hubard, Matt Prokop and Tyler Ladd and both the Facilities Management and Arboretum Staff at Villanova for their enthusiastic and extremely gracious support.
15

16
BIBLIOGRAPHY ASCE 1999. National Stormwater Best Management Practices Database, American Society of Civil Engineers, New York, NY EPA Office of Water 1999. Report To Congress On The Phase II Stormwater Regulations, United States Environmental Protection Agency, Washington, D.C. EPA 2002, 319 Non Point Source Pollution Success Stories Volume III. EPA Washington DC HEC 2000 – Hydrologic Modeling System Technical Manual, HEC Corps of Engineers, MDE 2000, 2000 Maryland Stormwater Design Manual, Baltimore, MD. Pennsylvania Association of Conservation Districts 1998. Pennsylvania Handbook of Best Management Practices for Developing Areas, Harrisburg PA Traver, R. G. 2002. Development of a BMP Research and Demonstration Park, Proceedings, 9th International Conference on Urban Drainage (ASCE).