Embed Size (px)
Citation preview
Impact on Local Government Finances and the Local Economy
Pennsylvania County Property Reassessment:

The Center for Rural Pennsylvania Board of Directors
Senator John R. Gordner, ChairmanRepresentative Tina Pickett, Vice Chairman
Senator John Wozniak, TreasurerDr. Nancy Falvo, Clarion University, Secretary
Representative Tim SeipDr. Livingston Alexander, University of Pittsburgh
Dr. Theodore R. Alter, Pennsylvania State UniversityDr. Stephan J. Goetz, Northeast Regional Center for Rural Development
William Sturges, Governor’s RepresentativeDan A. Surra, Governor’s Representative
This project was sponsored by a grant from the Center for Rural Pennsylvania, a legislative agency of the Pennsylvania General Assembly.
The Center for Rural Pennsylvania is a bipartisan, bicameral legislative agency that serves as a resource for rural policy within the Pennsylvania General Assembly. It was created in 1987 under Act 16, the Rural Revital-ization Act, to promote and sustain the vitality of Pennsylvania’s rural and small communities.
Information contained in this report does not necessarily reflect the views of individual board members or the Center for Rural Pennsylvania. For more information, contact the Center for Rural Pennsylvania, 625 Forster St., Room 902, Harrisburg, PA 17120, telephone (717) 787-9555, email: [email protected].
Pennsylvania County Property Reassessment:Impact on Local Government Finances and the Local Economy
By:Jeffrey A. Weber, Ph.D., Lauren Scott, Carol Andersen, Michele Dakouri, Mozella
McClendon, and Nick Years, East Stroudsburg University of Pennsylvania
November 2010
Executive SummaryCountywide property reassessment is a thorny issue for Pennsylvania local and state gov-
ernment officials, who have long sought to equitably administer local property taxes.To determine the impact of countywide property reassessments on local governments and
their residents, this study, which was conducted from February to December 2009, examined the relationships between the frequency of countywide reassessments and local tax revenues,
tax equity, personal income, unemployment rates, and median home values.While previous studies have examined reassessments in one particular
area, such as housing values, and within a specific year, this study examined the impact on local governments and the local economy across a 21-year time span. Additionally, this study compared the results between rural and urban counties to determine if reassessment had different impacts on these types of counties.
The research found that an increase in the years since the last countywide reassessment leads to a decrease in the amount of tax revenue generated per mill, and that the decrease was greater for rural counties than for urban counties. Specifically for rural counties, each year since the last county-wide reassessment, the amount of revenue generated per mill decreased by .9 percent. After five years without a reassessment, the revenue generating
capability for these rural counties may decrease by 4.46 percent. Previous research findings were confirmed by this study, in that a strong positive relation-
ship was found between the years since a county conducted reassessment and the Coefficient of Dispersion, which is a measure of equity of the property tax system. This means as the years since reassessment increase, the county property tax system becomes more inequitable and lacks uniformity across the taxing jurisdiction.
In terms of the local economy, this research found that as the years since reassessment increased, the county unemployment rate also increased. While this relationship was found in both rural and urban counties, the research showed it to be stronger in rural counties than in urban counties. Additionally, as the number of years since the last countywide reassessment increased, a county’s average personal income decreased. The relationship appears to apply only to rural counties.
The research also showed a strong relationship between the years since reassessment and county median housing values, which indicated that reassessment is definitely one of the fac-tors that influences housing values in a county. The relationship was further confirmed when assessing the difference in median housing values between counties that reassessed and those that did not during the 21-year period of the study.
Based on the results of the study, the researchers suggest that the Pennsylvania General As-sembly:
• Pass legislation that repeals the six existing property assessment laws and replaces them with a single, consolidated property assessment law that establishes a statewide uniform standard for conducting property reassessment. A single statute would simplify the prop-erty assessment system, thereby easing its administration and lowering its cost. It also would bring the property assessment system into compliance with the uniformity clause of the state Constitution and make the property assessment system more understand-able for businesses that operate across county lines. Currently, cross-county-line busi-nesses have to contend with multiple assessment practices, which may add to business costs.
• Pass legislation that requires all counties to conduct countywide property reassessment a minimum of every 4 years. As this study indicates, regular countywide reassessments would ease the residential property tax burden; ensure a more equitable tax system across each county; and bring the property assessment system into compliance with the unifor-mity clause of the state Constitution.
Table of ContentsIntroduction .............................. 5Goals and Objectives ............... 7 Methodology ............................ 7Results ...................................... 9Conclusions ............................ 14Policy Considerations ............ 14References .............................. 15Glossary ................................. 18
Pennsylvania County Property Reassessment 5
IntroductionCountywide property reassessment is a problem that has
long troubled Pennsylvania local and state government officials. Since the state’s beginnings as a colony, county and state officials have sought to equitably administer local property taxes. The property tax was one of the first taxes imposed by the Provincial Council in the newly es-tablished proprietor colony of Pennsylvania. Ever since, it has produced a continual litany of complaints, criticisms, and legislative reform efforts.
On January 30, 1683, William Penn, the Proprietor and Governor of “Pensilvania” and the 13 members of the Provincial Council met in Philadelphia and unanimously voted “that a Publick Tax upon Land ought to be Raised, to dray the Publick Charge,” (Minutes of the Provincial Council of Pennsylvania, Volume 1, 1852).
The tax rate for the first Pennsylvania property tax is not known, due to the lack of documentation. What is known is that it was a fixed rate on every pound of “clear value” on the real property. Initially, the Council appointed sever-al men to make a tax roll and assess the clear value of the land, and serve as collectors of the tax. Two weeks after the enactment of the first property tax, the first complaint was filed with the Provincial Council regarding the assess-ment of property. Within a few months, the record of the Provincial Council shows more than 100 complaints filed.
Now, more than 325 years later, Pennsylvania local gov-ernment officials are still wrestling with the assessment of property to effectively, efficiently and equitably adminis-ter the real property tax. Pennsylvania is one of nine states that decentralized the property tax assessment process to the local government level.1 Consequently, the average length of time since the last countywide reassessment is 10 years. Currently, Blair County has gone the longest without a reassessment at 49 years, with six other counties going longer than 30 years2 without reassessment. County officials have delayed reassessments because of the costs that are involved and the potential residential backlash. Often lost in the flurry of complaints and appeals follow-ing countywide reassessments are the potential benefits of reassessments.
The purpose of this study was to determine the impact of countywide property reassessments on local gov-ernments and their residents. This study examined the relationships between countywide reassessments and local tax revenues, tax equity, personal income, unemployment rates, and median home values.
While previous studies have examined the impact of reassessments on a particular area, such as housing values, and only within a specific year, this study examined the impact on local governments and the local economy across a 21-year span (Sjoquist and Walker, 1999; Down-ing, 2003; Strauss, 2000; and Owens, 2000). Additionally, throughout the study, the researchers compared the results between rural and urban counties to determine whether reassessment impacts these counties differently.
While it is well known that people do not like paying taxes in general, there is such strong vehemence towards property taxes that it has led the tax historian Glenn Fisch-er to call the property tax, “the worst tax.” 3 A continu-ous complaint concerning property taxes is the real and perceived inequity of assessing the value of the property, which serves as the base for the property tax (Strauss and Strauss, 2003).
The property tax is the only tax that is dependent on an estimate of the market value made by an assessor, who ap-plies a predetermined ratio to that value to generate the as-sessed value. As with any estimating process, errors arise due to a lack of training of the assessor; a lack of informa-tion of what is being assessed; and a lack of resources to conduct the reassessment (Eom, 2008). Errors within the assessment process produce assessment inequities within the county, where similar properties with the same market value have different assessed values, thereby producing a lack of uniformity in the taxing system. Previous research has shown that inequities in property taxes can occur due to errors made during the assessment process (Eom, 2008; Allen and Dare, 2002; Bell, 1984; and Geraci and Plourde, 1976).
While inequities and lack of uniformity may be attrib-uted to errors made during the assessment process, there is also an inequity and lack of uniformity that arises due to time. As more time passes from one reassessment to the next, county property tax inequities also increase (Eom, 2008). Pennsylvania is one of nine states where the timing of reassessment and the method of reassessment is made by each county.
Pennsylvania county commissioners recognize the dif-ficulty involved in assessing property value and the need for professional services. Since 1990, all county reassess-ments have, at least partially, been contracted out to firms that specialize in the assessment process. Despite all of the efforts of county commissioners to ensure a fair and
1 According to data provided by the International Association of Assessing Officers, the nine states that have decentralized real property as-sessment systems are: Colorado, Connecticut, Delaware, Hawaii, Maine, New Jersey, Pennsylvania, Rhode Island and Texas.2 Based on data obtained from the State Tax Equalization Board, and verified through county government web sites, the seven counties that have not reassessed in more than 30 years are Blair, Butler, Crawford, Forest, Huntingdon, Washington, and Westmoreland. 3 Fisher (1996) provides an historical view of the development of property taxes and the strong dislike towards them. Weber (2006) also compiled a Pennsylvania history of property taxes that documents the strong displeasure with property taxes.
6 The Center for Rural Pennsylvania
equitable process, anecdotally, reassessments appear to produce some turmoil.
When a countywide reassessment is conducted, resi-dents, properly or improperly, believe that their property taxes are going to rise, and/or perceive that their reas-sessed values are wrong (Fisher, 1996; and Weber, 2006). At best, this leads to a lengthy and costly appeals process. At worst, it results in protests and demonstrations.
In 2008, for example, Tioga County was embroiled in a controversial reassessment process that had occurred during 2007. Residents protested the reassessment and the number of appeals filed were so numerous that Tioga County commissioners voted unanimously to rescind the just-completed reassessment figures and return to the 2001 assessment figures (Robinson, 2008).
Since there is no state requirement for counties to con-duct regular countywide reassessments, it is not uncom-mon for decades to pass between reassessments. When a county does not regularly conduct countywide reassess-ments, inequities in property tax burdens develop and the overall tax base decreases, which, in turn, may place fiscal hardships on local governments.
Even so, county commissioners may be reluctant to order a countywide reassessment. Consequently, demands arise from municipalities, school districts, businesses, and private citizens for countywide reassessments. Some of these demands have generated court cases, which resulted in mandated countywide reassessments by Pennsylva-nia courts (Local Government Commission, 2009). For example, in Bedford County, the Bedford Area School District filed suit to compel the county commissioners to conduct a countywide property reassessment (Coughe-nour, 2007). By the end of January 2008, the Bedford County commissioners awarded a $1.9 million contract to Tyler Technologies to “perform a complete reappraisal of all 36,500 parcels of residential property in the county – the first revaluation to occur since 1957” (Tyler Technolo-gies, 2008).
Three separate studies on taxation at the state and local levels have been commissioned by Pennsylvania gover-nors during the past 40 years: in 1968 by Governor Shafer, in 1981 by Governor Thornburgh, and in 1987 by Gover-nor Casey. 4 Additionally, in conjunction with Governor Casey’s 1987 study, the Local Government Commission sponsored a Real Estate Assessment Task Force, which is-sued its report on October 1988 (Local Government Com-mission, 1988). All of these studies recognized the inequi-ties that result from not conducting regular reassessments; the difficulties involved in the reassessment process; and,
the possible benefits of regular reoccurring countywide reassessments and a uniform assessment standard.
In June 2009, the Pennsylvania House of Representa-tives passed a resolution that tasked the Legislative Bud-get and Finance Committee, in conjunction with the Local Government Commission and the State Tax Equalization Board, to conduct a study of Pennsylvania’s “fragmented system of property tax assessment” (Pennsylvania House Resolution No. 334, 2009). The resolution noted some reasons for the requested study as the “lack of uniformity” and the “vast inequities” occurring within the current property tax system.
Likewise, the County Commissioners Association of Pennsylvania supports the consolidation of existing as-sessment laws into a single statute and the establishment of minimum statewide standards for assessments and assessor training.5 Despite these calls for changes in the six different assessment laws, very little has changed over the years.
The research concerning reassessment in the past five years has focused on: assessment methods and formulas to ensure accuracy of the assessment process (Barber, 2008; and Gold, 2009); attempts to determine if there is a relationship between reassessment and local government budgets (Stine, 2005); local government costs associ-ated with assessments and appeals (Sjoquist and Walker, 1999); and regional economic development (Downing, 2003). Advances in technologies and the development of improved modeling of land valuation has led to improve-ments in the accuracy and uniformity of the assessment process, while at the same time decreasing the per parcel costs for assessments and the costs for appeals.
Reassessments as a policy have also helped local gov-ernment officials ensure that they are maximizing their budgets (Stine, 2005). Finally, another study has shown that counties that reassess have lower unemployment rates (Downing, 2003).
While this previous research has shown the impacts of reassessment, very little is based on Pennsylvania coun-ties, and none explore the differences between rural and urban counties. Additionally, the perception of the risk involved in countywide reassessments is one of the fac-tors in discouraging the action, and a way of mitigating the perception of risk is through an understanding of the necessity of reassessment for a property tax system to be efficient and effective.
The comprehensive nature of this study makes it unique and contributes to the understanding of countywide property reassessment. It also can serve as a practical
4 Multiple state government studies have made this recommendation: Final Long Range Report of The Governor’s Tax Study and Revision Commission, December 1968; Final Report of the Pennsylvania Tax Commission, March 1981; and, The Final Report and Recommenda-tions of the Pennsylvania Local Tax Reform Commission, October 30, 1987.5 County Commissioners Association of Pennsylvania, Resolution No. 2., 2008.
Pennsylvania County Property Reassessment 7
document for guiding changes to state assessment law and local government actions.
Goals and ObjectivesThis study, conducted from February to December
2009, had two goals: to determine the impact of county-wide property reassessments on local governments and their residents and the influence of a county being rural or urban; and to offer policy considerations.
To address the first goal, the researchers examined the relationship between the “Years Since the last county-wide Reassessment,” or YSR, and: (1) local governments’ property tax revenues, (2) the equity of the assessment, (3) county average median housing values, (4) county average personal incomes, and (5) county unemployment rates. This research also examined if the impact of countywide reassessments differs between rural and urban counties.
Previous research has stated that reassessments enable taxing authorities to maximize their revenue generating capacities and can lead to a more efficient property tax system (Bloom and Ladd, 1982; Ladd, 1991; and Stine, 2005). The previous studies were very limited in the num-ber of local taxing authorities examined and were limited to a single year.
This study analyzed 21 years (1986-2006) of data from 65 Pennsylvania counties. The study years were based on the most recent year of data available for all areas studied and the need to have at least 20 years worth of data to determine trends. Given the study’s longitudinal context, the researchers were required to control for inflation and revenue increases caused by tax rate increases to ensure that any observed relationship was based on the YSR. This was done to ensure that nothing else was contributing to any observed improvement.
Consequently, to control for the effects of inflation, which may have been the cause of an increase in local government property tax revenue, the researchers convert-ed all revenues to constant dollars. The base year chosen for this study was 2006 and the dollars were converted to that year.
To control for property tax rate increases, the research-ers converted all millage rates to equalized mills, based on the constant dollar value of the local government revenue. The millage rate was converted to equalized mills by multiplying each rate by the predetermined ratio for each county, as compiled by the State Tax Equalization Board for each of the years.6 Next, by dividing the revenue by the equalized mills, the researchers were able to determine the amount of revenue generated per equalized mill. The
researchers then calculated the percent change each year in the amount of revenue generated per equalized mill.
Again, this was done to determine if an increase in the number of years since a countywide reassessment would lead to a decrease in the amount of revenue achieved per mill with a property tax.
Previous research only examined a few municipalities in Pennsylvania, while this research examined 65 counties over a 21-year time frame (1986-2006) and made com-parisons between rural and urban counties.
To determine the influence of countywide property reas-sessment on the equity of the assessment, the researchers examined the YSR and a county’s Coefficient of Disper-sion (COD). COD is “a measure that determines the degree to which a property’s assessed value actually repre-sents the correct percentage of the property market value” (International Association of Assessing Officers, 2005). This relationship between the frequency of reassessment and the COD is already well established.
Previous research has shown a positive relationship between regular, reoccurring property reassessments and improved local economic development (Downing, 2003). This research focused on determining if the relationship holds true for measures of the local economy (housing values, personal income, and unemployment rate), across a longitudinal set of data and for Pennsylvania counties.
MethodologyThe researchers gathered and examined data from 65
counties in Pennsylvania. Philadelphia and Allegheny counties were excluded because of their unique govern-mental systems and property assessment laws.
The researchers divided counties into two types, rural and urban, using the Center for Rural Pennsylvania’s defi-nition of rural and urban counties: a county is rural when its population density is less than 274 people per square mile, and a county is urban when its population density is 274 or more people per square mile. This study included 48 rural counties and 17 urban counties.
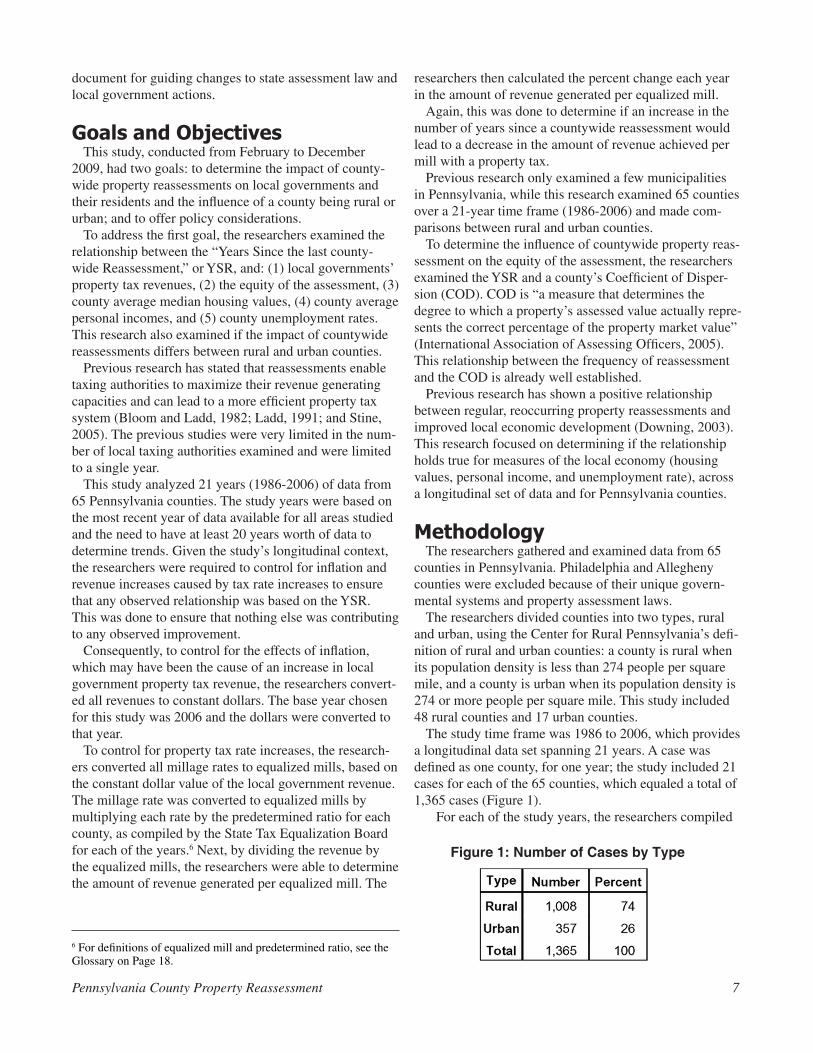
The study time frame was 1986 to 2006, which provides a longitudinal data set spanning 21 years. A case was defined as one county, for one year; the study included 21 cases for each of the 65 counties, which equaled a total of 1,365 cases (Figure 1).
For each of the study years, the researchers compiled
6 For definitions of equalized mill and predetermined ratio, see the Glossary on Page 18.
Figure 1: Number of Cases by Type
8 The Center for Rural Pennsylvania
the following data: years since the last countywide reas-sessment; county property tax revenue; school district property tax revenue; municipal property tax revenue; county property tax per equalized mill; average county housing values; average county personal income; and county unemployment rate.
Data SourcesThe study used secondary data from the Pennsylvania
Department of Community and Economic Development’s (DCED) Governor’s Center for Local Government Ser-vices, the Pennsylvania Department of Education (PDE), the Pennsylvania Department of Revenue, the State Tax Equalization Board, the U.S. Department of Labor’s Bureau of Labor Statistics and the U.S. Census Bureau. Following is a description of how the data were calculated and/or compiled.
Years Since Reassessment – The data were calculated using the reassessment dates for each county compiled by the State Tax Equalization Board. The first year the reassessment data were used by the county was assigned the value of “0.” Each year thereafter was increased by a value of “1” until the next reassessment. For example, Monroe County conducted its last reassessment in 1988, therefore 1989 has a value of “0,” 1990 a value of “1,” 1991 a value of “2,” etc. County Property Tax Revenue and Municipal Property Tax Revenue – The data were compiled from the mu-nicipal financial statistics section of DCED’s Governor’s Center for Local Government Services. The data were converted into constant dollars using the Northeastern Consumer Price Index data (adjusted) provided by the U.S. Department of Labor’s Bureau of Labor Statistics. Municipal property tax revenue was summed by county to provide a single municipal property tax revenue num-ber for each county and for each year.School District Property Tax Revenue – The data were compiled from the educational financial data provided by PDE. Similar to the municipal revenue data, the school district revenue data were converted into constant dollars and summed by county. Recognizing that some school districts’ boundaries cross over county’s bound-aries, this study used PDE’s listing of school districts by county. County Median Housing Value – The data were com-piled from U.S. Census Bureau’s databases for the years 1990, 2000, 2005, and 20067. The researchers construct-ed estimates for the years 1986–1989, 1991–1999, and
2001–2004. The researchers developed estimates using trend analysis based on the actual data points. Average County Personal Income – The data were from the Pennsylvania Department of Revenue’s Personal Income Tax Statistics. The researchers divided the total gross personal income by county by the total number of tax returns by county. For example, in 2005, Monroe County had a total personal income of $2,686,142,000 and there were 61,912 returns filed, making an average county personal income of about $43,390. Similar to the property tax revenue data, the average personal income data were converted into constant dollars.County Unemployment Rate – The data were compiled by the U.S. Department of Labor’s Bureau of Labor Statistics. The Coefficient of Dispersion – The data were compiled from county data collected by the State Tax Equaliza-tion Board.Equalized Mills – Using the county millage rates data collected by DCED’s Center for Local Government Services, the researchers multiplied each rate by the predetermined ratio for each county as compiled by the State Tax Equalization Board for each of the years. This is similar to the calculation performed by PDE to gener-ate equalized mill rates for school districts. Property Tax Revenue per Equalized Mill – This was calculated using the property tax revenue in constant dollars and divided by the equalized mills for the same year to determine the amount of revenue generated per mill for that year.
Data AnalysisThe researchers performed a series of correlation analy-
ses using YSR as the dependent variable for each correla-tion. Additionally, the data were grouped by variable and type of county (rural vs. urban). The researchers used two correlation techniques to increase the validity of the find-ings.
Based on the results of the correlation analysis, the researchers categorized the relationships as “strong,” “moderate,” “weak,” or “was not affected.” The definitions of each category were based on the correlation value and the level of significance. In other words, the categories de-scribe whether there was a relationship between the years since reassessment and the other variables and how strong or weak that relationship was.
The researchers also used “two by two” comparisons of means on correlations that were weak to further analyze any possible relationship.
Finally, a trend analysis of the YSR versus the revenue per mill data was completed to estimate the possible im-pact on actual property tax revenue.
7 For the years 1980, 1990, and 2000, data are from the U.S. Census Bureau, census demographic, and housing information; for the years 2005 and 2006, the U.S. Census Bureau’s American Community Survey.
Pennsylvania County Property Reassessment 9
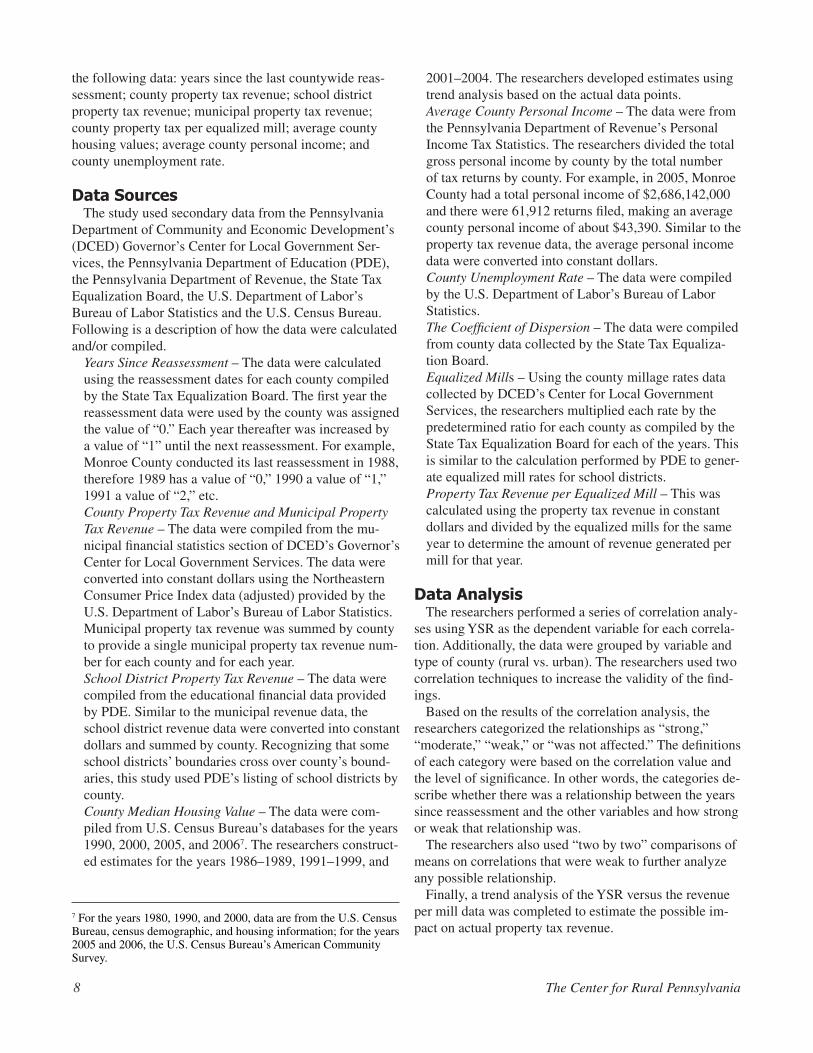
ResultsOverall, this study found that as the
YSR increased, there was a negative impact on local government property tax revenue, the county property tax system, and the county’s economy; and that the impact affects rural coun-ties more than urban counties.
Figure 2 illustrates the relationships found in this study and the differences in the relationships between rural and urban counties.
The following describes each of the relationships shown in Figure 2.
Countywide Property Reassessment and Local Government Property Tax Revenue
This research found that the longer a county waits to conduct a county-wide reassessment, the more inef-ficient the municipal tax systems become. For the purposes of this study, efficiency was defined by the amount of property tax revenue generated per mill. A property tax system was efficient if the amount of
tax revenue generated per mill was equal to the amount that was possible if all properties were assessed at their correct value. For example, if a prop-erty’s market value is $100,000 and the assessed value is 50 percent of the market value, the assessed value should be $50,000. The property tax levied on the property is considered efficient because it is actually gener-ating the revenue it should generate. Conversely, over the years, if the market value of the property increases
to $150,000, but, because the property is not reassessed, the assessed value remains at $50,000, the property tax levied on the property is inefficient because the amount of revenue being generated is less than what should be generated on the actual value of the property.
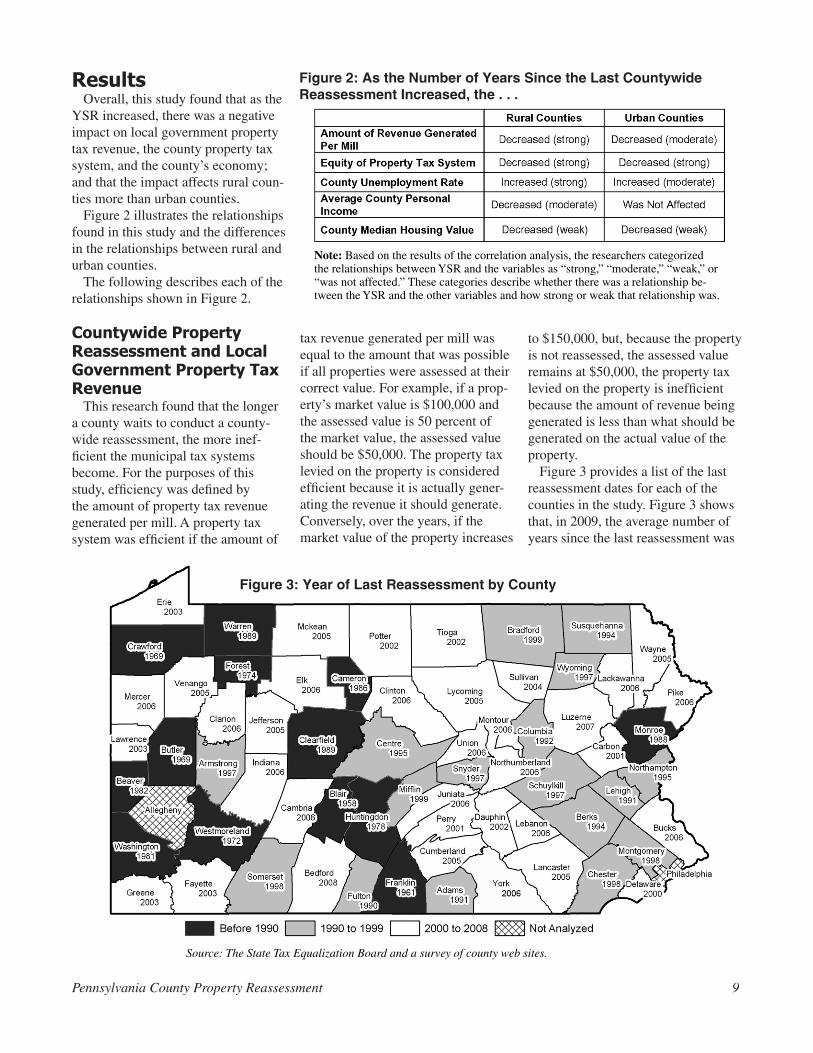
Figure 3 provides a list of the last reassessment dates for each of the counties in the study. Figure 3 shows that, in 2009, the average number of years since the last reassessment was
Figure 2: As the Number of Years Since the Last CountywideReassessment Increased, the . . .
Note: Based on the results of the correlation analysis, the researchers categorized the relationships between YSR and the variables as “strong,” “moderate,” “weak,” or “was not affected.” These categories describe whether there was a relationship be-tween the YSR and the other variables and how strong or weak that relationship was.
Source: The State Tax Equalization Board and a survey of county web sites.
Figure 3: Year of Last Reassessment by County
10 The Center for Rural Pennsylvania
13 years for rural counties and 9 years for urban coun-ties.
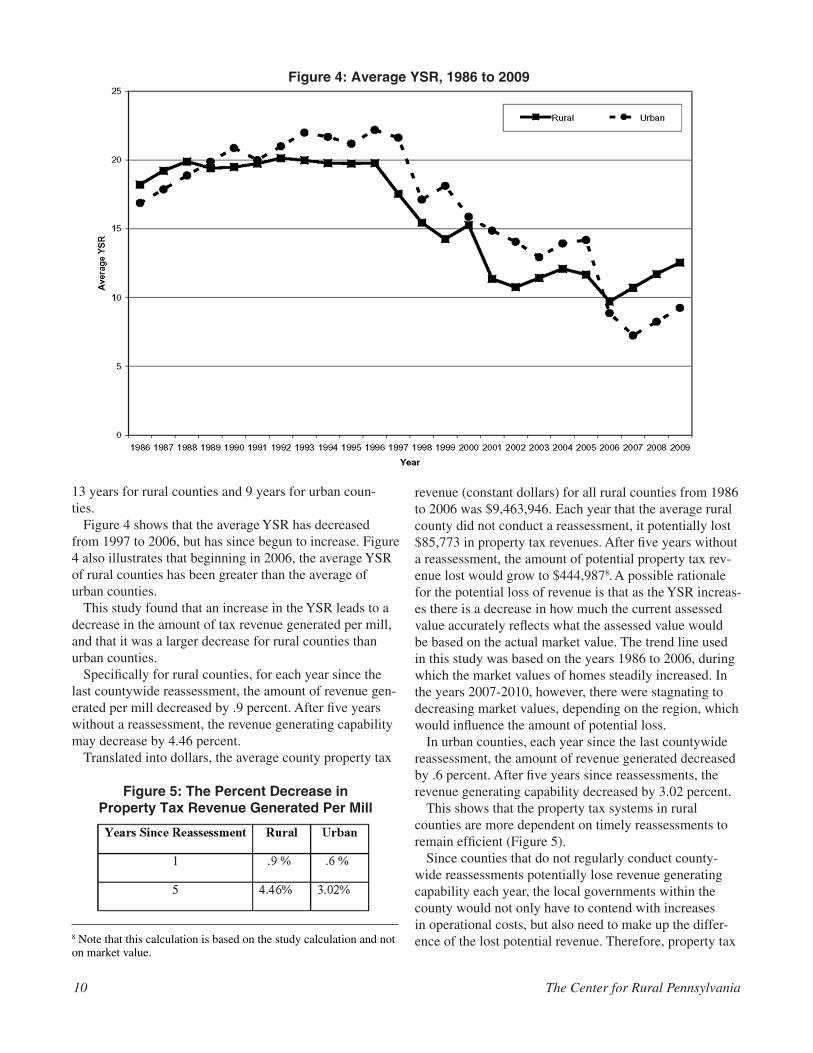
Figure 4 shows that the average YSR has decreased from 1997 to 2006, but has since begun to increase. Figure 4 also illustrates that beginning in 2006, the average YSR of rural counties has been greater than the average of urban counties.
This study found that an increase in the YSR leads to a decrease in the amount of tax revenue generated per mill, and that it was a larger decrease for rural counties than urban counties.
Specifically for rural counties, for each year since the last countywide reassessment, the amount of revenue gen-erated per mill decreased by .9 percent. After five years without a reassessment, the revenue generating capability may decrease by 4.46 percent.
Translated into dollars, the average county property tax
revenue (constant dollars) for all rural counties from 1986 to 2006 was $9,463,946. Each year that the average rural county did not conduct a reassessment, it potentially lost $85,773 in property tax revenues. After five years without a reassessment, the amount of potential property tax rev-enue lost would grow to $444,9878. A possible rationale for the potential loss of revenue is that as the YSR increas-es there is a decrease in how much the current assessed value accurately reflects what the assessed value would be based on the actual market value. The trend line used in this study was based on the years 1986 to 2006, during which the market values of homes steadily increased. In the years 2007-2010, however, there were stagnating to decreasing market values, depending on the region, which would influence the amount of potential loss.
In urban counties, each year since the last countywide reassessment, the amount of revenue generated decreased by .6 percent. After five years since reassessments, the revenue generating capability decreased by 3.02 percent.
This shows that the property tax systems in rural counties are more dependent on timely reassessments to remain efficient (Figure 5).
Since counties that do not regularly conduct county-wide reassessments potentially lose revenue generating capability each year, the local governments within the county would not only have to contend with increases in operational costs, but also need to make up the differ-ence of the lost potential revenue. Therefore, property tax
Figure 5: The Percent Decrease inProperty Tax Revenue Generated Per Mill
Figure 4: Average YSR, 1986 to 2009
8 Note that this calculation is based on the study calculation and not on market value.
Pennsylvania County Property Reassessment 11
rate increases would need to be made to cover increases in costs, and the inefficiency of the property tax system. This, in turn, would lead to higher property tax burdens on local residents. By conducting timely countywide reassessments, it would be possible to generate the same amount of tax revenue at a lower millage rate.
This finding confirms previous research (Stine, 2005) and provides an additional understanding of developing an approximation of how much tax revenue a local govern-ment is losing solely because of inefficiencies in the tax system. Furthermore, this finding shows that the lack of regular countywide reassessments has greater impacts on rural counties than urban counties.
Countywide Property Reassessmentand Local Government Property Tax System Equity
One of the primary concerns of administering a prop-erty tax system is maintaining the equity of the system. According to this study, equity means that the property as-sessment accurately reflects the market value, and is uni-form across all properties of the same market value. For example, if a property’s market value is $100,000 and the predetermined ratio for the county is 50 percent, then the assessed value should be $50,000. Likewise, all properties within the county whose market value is $100,000 should have the same $50,000 assessed value. Inequities arise
when similar properties are assessed at different levels due to inaccuracies in the assessment process, or from the lack of reassessment, and the assessed values do not keep pace with changes in the market value.
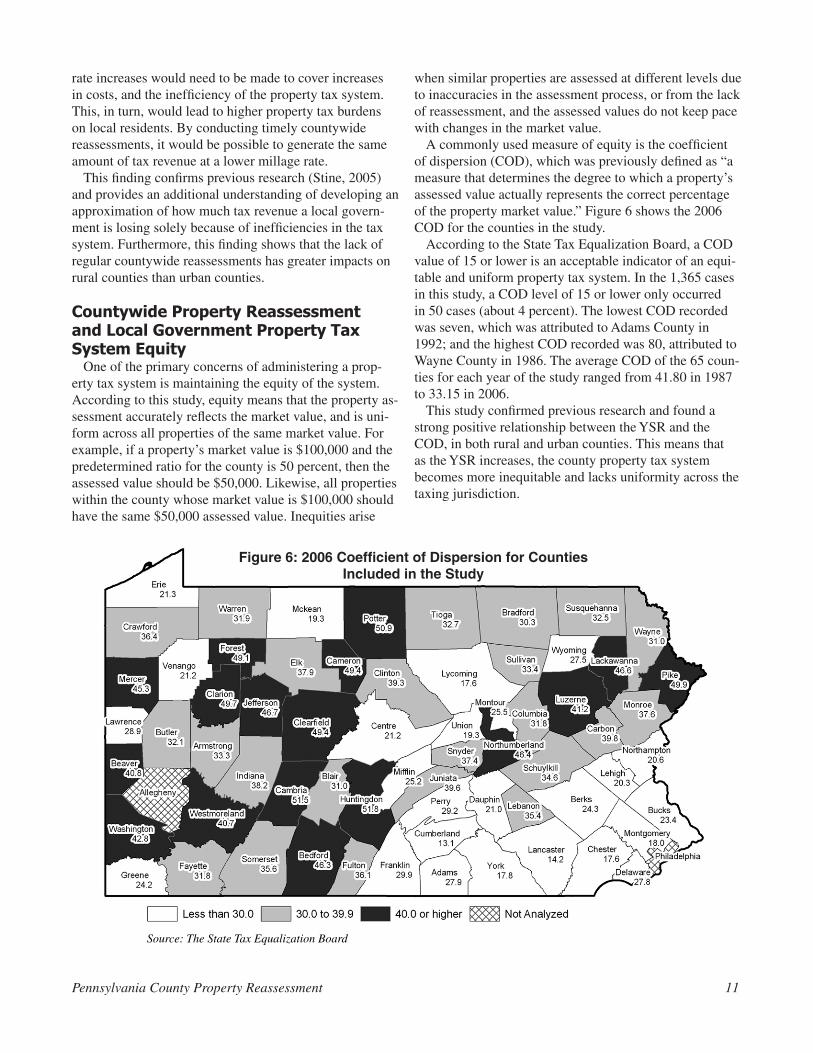
A commonly used measure of equity is the coefficient of dispersion (COD), which was previously defined as “a measure that determines the degree to which a property’s assessed value actually represents the correct percentage of the property market value.” Figure 6 shows the 2006 COD for the counties in the study.
According to the State Tax Equalization Board, a COD value of 15 or lower is an acceptable indicator of an equi-table and uniform property tax system. In the 1,365 cases in this study, a COD level of 15 or lower only occurred in 50 cases (about 4 percent). The lowest COD recorded was seven, which was attributed to Adams County in 1992; and the highest COD recorded was 80, attributed to Wayne County in 1986. The average COD of the 65 coun-ties for each year of the study ranged from 41.80 in 1987 to 33.15 in 2006.
This study confirmed previous research and found a strong positive relationship between the YSR and the COD, in both rural and urban counties. This means that as the YSR increases, the county property tax system becomes more inequitable and lacks uniformity across the taxing jurisdiction.
Source: The State Tax Equalization Board
Figure 6: 2006 Coefficient of Dispersion for CountiesIncluded in the Study
12 The Center for Rural Pennsylvania
Countywide Property Reassessment and Local Economic Conditions
This research found that the YSR has its strongest impact on a county’s unemployment rate, while the YSR has only a moderate to weak impact on a county’s average personal income and median housing value.
Countywide Property Reassessment and the County Unemployment Rate
This research found that as the YSR increased the county unemployment rate increased. While this rela-tionship was found in both rural and urban counties, the research showed it to be stronger in rural counties than in urban counties. The relationship of YSR to county unem-ployment is an interesting one in that the strength of the relationship was not expected and the reason for it being a stronger relationship in rural counties is not readily known. A possible reason may be that inequitable property assessments may discourage business growth or develop-ment. Other research has suggested such a relationship, but more research is needed to validate that finding.
Countywide Property Reassessment and County Average Personal Income
The research found that as the number of years since the last countywide reassessment increased, a county’s aver-age personal income decreased. The relationship appears to only apply to rural counties, as this research shows that urban counties did not have this relationship. Consequent-ly, it appears that within rural counties, reassessment has a positive influence on a county’s average personal income, possibly by lowering the county’s unemployment rate.
Countywide Property Reassessment and the County Median Housing Values
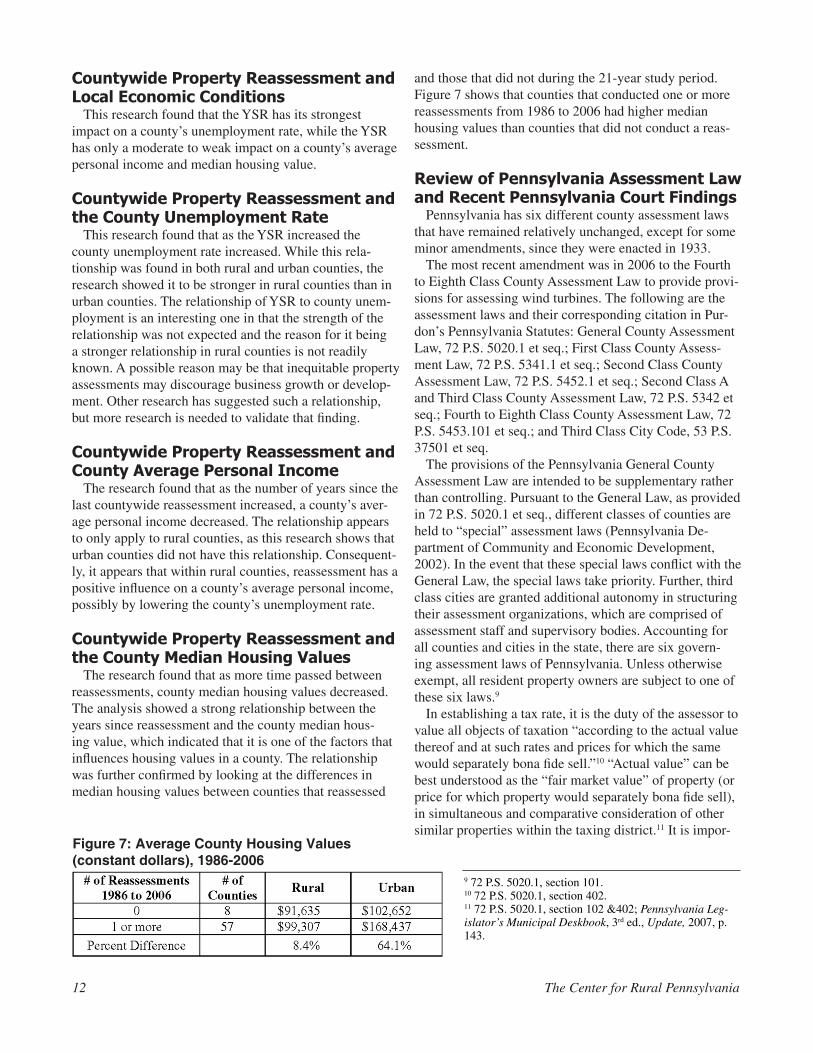
The research found that as more time passed between reassessments, county median housing values decreased. The analysis showed a strong relationship between the years since reassessment and the county median hous-ing value, which indicated that it is one of the factors that influences housing values in a county. The relationship was further confirmed by looking at the differences in median housing values between counties that reassessed
and those that did not during the 21-year study period. Figure 7 shows that counties that conducted one or more reassessments from 1986 to 2006 had higher median housing values than counties that did not conduct a reas-sessment.
Review of Pennsylvania Assessment Law and Recent Pennsylvania Court Findings
Pennsylvania has six different county assessment laws that have remained relatively unchanged, except for some minor amendments, since they were enacted in 1933.
The most recent amendment was in 2006 to the Fourth to Eighth Class County Assessment Law to provide provi-sions for assessing wind turbines. The following are the assessment laws and their corresponding citation in Pur-don’s Pennsylvania Statutes: General County Assessment Law, 72 P.S. 5020.1 et seq.; First Class County Assess-ment Law, 72 P.S. 5341.1 et seq.; Second Class County Assessment Law, 72 P.S. 5452.1 et seq.; Second Class A and Third Class County Assessment Law, 72 P.S. 5342 et seq.; Fourth to Eighth Class County Assessment Law, 72 P.S. 5453.101 et seq.; and Third Class City Code, 53 P.S. 37501 et seq.
The provisions of the Pennsylvania General County Assessment Law are intended to be supplementary rather than controlling. Pursuant to the General Law, as provided in 72 P.S. 5020.1 et seq., different classes of counties are held to “special” assessment laws (Pennsylvania De-partment of Community and Economic Development, 2002). In the event that these special laws conflict with the General Law, the special laws take priority. Further, third class cities are granted additional autonomy in structuring their assessment organizations, which are comprised of assessment staff and supervisory bodies. Accounting for all counties and cities in the state, there are six govern-ing assessment laws of Pennsylvania. Unless otherwise exempt, all resident property owners are subject to one of these six laws.9
In establishing a tax rate, it is the duty of the assessor to value all objects of taxation “according to the actual value thereof and at such rates and prices for which the same would separately bona fide sell.”10 “Actual value” can be best understood as the “fair market value” of property (or price for which property would separately bona fide sell), in simultaneous and comparative consideration of other similar properties within the taxing district.11 It is impor-
9 72 P.S. 5020.1, section 101.10 72 P.S. 5020.1, section 402. 11 72 P.S. 5020.1, section 102 &402; Pennsylvania Leg-islator’s Municipal Deskbook, 3rd ed., Update, 2007, p. 143.
Figure 7: Average County Housing Values(constant dollars), 1986-2006
Pennsylvania County Property Reassessment 13
tant to note that in arriving at such value, the price for which property may have sold is not determinative: again, fair market value is only a consideration.12
Another step in the process of ascertaining actual value is the choice of year upon which to base value.13 Counties are vested with the authority to choose between two ac-ceptable methods for establishing this year, each method having the potential to yield vastly different ratios.14 One method is to simply use the current-year market value.15 The second method, also known as the base-year system, establishes a base year as either (1) the year of the most recent countywide reappraisal, or (2) another designated prior year.16 Somewhat misleadingly, the value that results from this step is referred to as both “actual value” and “market value”.17 More accurately, it is market value for the purpose of assessment, rather than market value as it is commonly understood, which is the price in a competitive market a purchaser is willing to pay an owner.18 The mar-ket value for the purpose of assessment is not based on the current competitive market price, but on the market value of the base year. For example, Monroe County’s base year is 1988. Consequently, all market values for the purpose of assessment are derived from market values in 1988.
The base-year method has been widely criticized, as it places a considerable amount of discretionary power in county assessment authorities.19 It has been argued that counties that have been given this amount of control over the assessment process have been purposefully negligent in conducting regular countywide reassessment, if this neglect resulted in a more favorable tax ratio with respect to generated tax revenue.20
A final step in calculating a taxable rate is the applica-tion of a predetermined ratio to achieve “assessed value.” The established predetermined ratio is the ratio of as-sessed to actual value, and may not exceed 100 percent.21 In this way, the final assessed value is a percentage of the
property’s market value.22 The county enjoys significant discretion at this final stage of the assessment process and is able to set a county-specific predetermined ratio.23
As provided by Pennsylvania assessment law, taxpayers may appeal an assessment they believe to be non-uniform or discriminatory.24 Increasingly, courts are hearing as-sessment appeals brought by citizens. Courts are finding some assessments so inequitable that they invoke “equity jurisdiction” to resolve the offenses (Pennsylvania assess-ment law is otherwise deficient in providing satisfactory remedies). Some see court action of this magnitude as a precursor to a revision of Pennsylvania assessment law itself. Some such noteworthy court action was the case of Clifton v. Allegheny County, the result of which had suc-ceeded in bringing the state’s long-unopposed “base-year” assessment methodology onto the Pennsylvania Supreme Court’s docket.25
The debate was sensitive, as it succeeded in raising genuine constitutional questions. The particular liberty at stake in this case was the right to fair and equal taxa-tion. This liberty is guaranteed Pennsylvania state resi-dents in the Uniformity Clause, which states: “All taxes shall be uniform, upon the same class of subjects.”26 Furthermore, the right to equal taxation is guaranteed all Americans in the U.S. Constitution’s 14th Amendment, which mandates that all states provide “equal protection” when levying taxes.
As applied by all Pennsylvania counties in conducting property assessment, the base year system of taxation establishes a “base year” (or year from which the final tax ratio will be calculated) from the last year of county-wide reassessment.27 At the outset of the case, Allegheny County had last conducted countywide reassessment in 2002, and had therefore calculated all assessments since then on the 2002 value. In conducting the assessment this way, the base year methodology in Allegheny County did
12 Pennsylvania Legislator’s Municipal Deskbook, 3rd ed., Update, 2007, p. 142-45.13 72 P.S. 5020.1, section 102.14 Pennsylvania Legislator’s Municipal Deskbook, 3rd ed., Update, 2007, p. 143.15 Pennsylvania Legislator’s Municipal Deskbook, 3rd ed., Update, 2007, p. 143.16 Pennsylvania Legislator’s Municipal Deskbook, 3rd ed., Update, 2007, p. 143.17 Baldwin-Lima-Hamilton Corp., 412 Pa. 299, 194 A.2d 434 (1963).18 Baldwin-Lima-Hamilton Corp., 412 Pa. 299, 194 A.2d 434 (1963) and Pennsylvania Legislator’s Municipal Deskbook, 3rd ed., Update, 2007, p. 143.19 Baldwin-Lima-Hamilton Corp., 412 Pa. 299, 194 A.2d 434 (1963) and Pennsylvania Legislator’s Municipal Deskbook, 3rd ed., Update, 2007, p. 143.20 Baldwin-Lima-Hamilton Corp., 412 Pa. 299, 194 A.2d 434 (1963) and Pennsylvania Legislator’s Municipal Deskbook, 3rd ed., Update, 2007, p. 143.21 Pennsylvania Legislator’s Municipal Deskbook, 3rd ed., Update, 2007, p. 144.22 Pennsylvania Legislator’s Municipal Deskbook, 3rd ed., Update, 2007, p. 144.23 Pennsylvania Legislator’s Municipal Deskbook, 3rd ed., Update, 2007, p. 144.24 Pennsylvania Legislator’s Municipal Deskbook, 3rd ed., Update, 2007, p. 146.25 Clifton v. Allegheny County, 969 A.2d 1197 (Pa. Apr. 29, 2009).26 Pennsylvania Constitution, Article VIII, Section 1.27 72 P.S. 5020.1, Section 102.
14 The Center for Rural Pennsylvania
not account for nearly 7 years of market fluctuation.28
The plaintiff-homeowners in Clifton v. Allegheny County argued that, in failing to account for such differential rates of change, the base-year system yielded arbitrary, non-uniform values.29 Further, the plaintiffs argued that the base-year system was discriminatory in that the resulting non-uniform taxes had the effect of punishing property owners with depreciating properties, while offering what was equivalent to a “tax break” to owners of appreciating properties.30 Thus, the base-year system did not provide uniformity of taxation in accordance with the Uniformity Clause and was therefore, unconstitutional.31 Allegheny County argued that the base-year system for the calcula-tion of property taxes had been statutorily permissible since 1982 and therefore did not clearly violate the Con-stitution.32
The Pennsylvania Supreme Court resolved this ambigu-ity in Clifton v. Allegheny County by ruling in favor of the plaintiff-homeowners. The court held that while the base-year system itself was not unconstitutional, in Al-legheny County, it had been applied in an unconstitutional manner.33 The court went on to explain that while “some practical inequalities are obviously anticipated, [they are acceptable only] so long as the taxing scheme does not impose substantially unequal tax burdens.”34
What is considered a “substantially unequal tax burden” is determined largely by statistical indicators published once a year by the Pennsylvania State Tax Equalization Board. These indicators provide comparative data for the purpose of evaluating whether assessment values corre-spond with fair market values, both statewide and nation-wide. In this case, the Pennsylvania Supreme Court de-termined that Allegheny County’s assessed values did not sufficiently correspond to these indicators, and, as a result, placed an unequal burden on the plaintiff-homeowners.35
As Clifton v. Allegheny County and various other prec-edent cases illustrate, carrying out regular and reoccurring assessments is essential for Pennsylvania’s achievement of a uniform and equitable property tax system.
Regular and reoccurring assessments provide assessed values that better correspond to fair market values, which will reduce the glaring disparities in tax rates and bring the system closer to achieving the desired level of unifor-mity.
At the time of this study, the implications of this ruling
were not known. It is very likely, however, that the current provisions governing Pennsylvania tax assessment law will need to be revised to adhere to the court mandate requiring regular assessments.
ConclusionsThis study found that counties conducting countywide
reassessments on a regular, reoccurring schedule achieve multiple benefits for the county. Reassessments enable counties to derive more tax revenue per mill, thereby lowering tax rates and decreasing the overall residential tax burden. Additionally, countywide reassessments were shown to improve property taxation equity and uniformity across the county.
For the county residents, countywide reassessments are beneficial because they lead to improved local economic conditions, such as higher employment, higher housing values, and higher median incomes.
This study also showed that all the benefits of county-wide reassessment are more significant for rural counties than for urban counties.
Policy ConsiderationsThe study results add to the other state study find-
ings and to the numerous Pennsylvania court decisions rendered regarding the property tax assessment system. Across all of the studies and court decisions, similar considerations are consistently repeated. The researchers restate those considerations, which ask the Pennsylvania General Assembly to consider:
• Passing legislation that repeals all six existing prop-erty assessment laws and replaces them with a single, consolidated property assessment law that establishes a statewide uniform standard for the conduct of prop-erty reassessment. A single statute would simplify the property assessment system, thereby easing its admin-istration and lowering its cost. Additionally, it would bring the property assessment system into compliance with the uniformity clause of the state Constitution. Finally, it would make a more understandable system for businesses that operate across county lines.
• Passing legislation that requires all counties to con-duct countywide property reassessments a minimum of every 4 years. As shown in this study, regular countywide reassessments would ease the residen-tial property tax burden; ensure a more equitable tax system across each county; and bring the property as-sessment system into compliance with the uniformity clause of the Pennsylvania Constitution.
28 Clifton v. Allegheny County, 969 A.2d 1197 (Pa. Apr. 29, 2009).29 Clifton v. Allegheny County, 969 A.2d 1197 (Pa. Apr. 29, 2009).30 Clifton v. Allegheny County, 969 A.2d 1197 (Pa. Apr. 29, 2009).31 Clifton v. Allegheny County, 969 A.2d 1197 (Pa. Apr. 29, 2009).32 Clifton v. Allegheny County, 969 A.2d 1197 (Pa. Apr. 29, 2009).33 Clifton v. Allegheny County, 969 A.2d 1197 (Pa. Apr. 29, 2009).34 Clifton v. Allegheny County, 969 A.2d 1197 (Pa. Apr. 29, 2009).35 Clifton v. Allegheny County, 969 A.2d 1197 (Pa. Apr. 29, 2009).
Pennsylvania County Property Reassessment 15
ReferencesAllen, M. T., and W. H. Dare. (2002) “Identifying Determinants of Horizontal Property Tax Inequity: Evidence from
Florida.” Journal of Real Estate Research 24, No. 2: 153-164.
Allen, M. T. (2003) “Measuring Vertical Property Tax Inequity in Multifamily Property Markets.” Journal of Real Estate Research 25, No. 2: 171-184.
Barber, W. (2008) “Automated Valuation Models by Model-Building Practitioners: Combined OLS and Hybrid Model Development,” Journal of Property Tax Assessment and Administration, Vol. 5, Issue 2: Pages 51-66.
Beattie v. Allegheny County, Allegheny County (Supreme Court of PA, 2006).
Bell, E. J. (1984) “Administrative Inequity and Property Assessment: The Case for the Traditional Approach,” Property Tax Journal, 3, 2: Pages 123-131.
Bentick, B. L. (1979) “The Impact of Taxation and Valuation Practices on the Timing and Efficiency of Land Use.” Journal of Political Economy 87, No. 4: Pages 859-868.
Bloom, H. S. and H. F. Ladd. (1982) “Property Tax Revaluation and Tax Levy Growth.” Journal of Urban Economics, 11: Pages 73-84.
Bourassa, S. C. (1992) “Economic Effects of Taxes on Land: A Review.” American Journal of Economics and Sociol-ogy, 51, No. 1: Pages 109-115.
Buchanan, S. C. and B. A. Weber. (1982) “Growth and Residential Property Taxes: A Model for Estimating Direct and Indirect Population Impacts.” Land Economics 58, No. 3: Pages 324-337.
Clifton v. Allegheny County, Allegheny County: Assessment Office, No. GD05-028638 (Court of Common Pleas of Al-legheny County, Pa., 2007).
Clifton v. Allegheny County, Allegheny County: Assessment Office, No. J-133A-B-2008 (Supreme Court of Pa., 2008).
Coughenour, R. D. (2007) “Special Edition: Property Tax Reassessment.” Spotlight: News from Bedford Area School District.
Downing, R. (2003) “The Relationship Between Real Property Tax Assessments and Regional Economic Develop-ment.” Assessment Journal, Winter 2003: Pages 33-39.
Downingtown Area Sch. Dist v. Chester County Bd. Of Assessment Appeals, (Supreme Court of Pa., 2006).
Eom, T. H. (2008) “A Comprehensive Model of Determinants of Property Tax Assessment Quality: Evidence in New York State.” Public Budgeting and Finance, 28:1: Pages 58-81.
Fisher, G. (1996) The Worst Tax? A History of the Property Tax in America, Lawrence, KS: University of Kansas Press.
Geraci, V. J. and J. L. Plourde. (1976) “The Determinant of Uniform Property Tax Assessment.” Assessors Journal, 11: Pages 231-251.
Gold, A. (2007) “Understanding the Mann-Whitney Test.” Journal of Property Tax Assessment and Administration, Vol. 4, Issue 3: Pages 55-57.
Hamilton, B. W. (1976) “The Effects of Property Taxes and Local Public Spending on Property Values: A Theoretical Comment.” Journal of Political Economy, 84, No. 3: Pages 647-651.
Hartzok, A. (1997) “Pennsylvania’s Success with Local Property Tax Reform: The Split Rate Tax.” American Journal of Economics and Sociology, 56, No. 2: Pages 205-214.
House Joint Resolution 22, Recommendations to Provide a Mechanism for a Fair and Equitable Reassessment of All Real Property Within the State. 144th General Assembly. November 26, 2008.
(continued on next page)
16 The Center for Rural Pennsylvania
House Resolution 334, PN 2292, Directing the Legislative Budget and Finance Committee, in Conjunction with the Local Government Commission and the State Tax Equalization Board, to Request Assistance of the Assessor and County Commissioners Associations of Pennsylvania to Conduct a Study of the Commonwealth’s Fragmented Sys-tem of Property Tax Assessment. 145th General Assembly. June 24, 2009.
International Association of Assessing Officers. (2005) “Standard of Property Tax Policy.” Journal of Property Tax As-sessment and Administration, Vol. 2, No. 4: Pages 56-57.
Kelly, B. W. (1995) “Assessment Reform.” Issue Brief: Senate Policy Development and Research Office, 6 October 1995.
Kelly, B. W. (1996) “Assessment Reform.” Issue Brief: Senate Policy Development and Research Office, 12 September 1996.
Kelsey, T. W. (1996) Reassessment: What Property Owners Need to Know. University Park, Pa.: The Pennsylvania State University.
Ladd, H. F. (1991) “Property Tax Revaluation and Tax Levy Growth Revisited,” Journal of Urban Economics, 30: Pages 83-99.
Lutz, B. F. (2009) Fiscal Amenities, School Finance Reform and the Supply Side of the Tiebout Market. Washington D.C.: Board of Governors.
McGreevy, J. M. (1998) “Assessment Reform.” Senate Policy Development and Research Office, 1 September 1998.
McGreevy, J. M. (1999) “Assessment Reform.” Senate Policy Development and Research Office, 24 September 1999.
Mehta, S. and F. Giertz. (1996) “Measuring the Performance of the Property Tax Assessment Process.” National Tax Journal Vol. 49, No. 1: Pages 73-85.
Miller v. Board of Property Assessment, Appeals and Review of Allegheny County, (Common Pleas Court of PA, 2002).
Minutes of the Provincial Council of Pennsylvania, Volume 1, The Proceedings of the Council from March 10, 1683 to November 27, 1700. Philadelphia, PA: Jo. Stevens & Co. 1852: 70.
Pennsylvania Department of Community and Economic Development. (2002) Taxation Manual. Governor’s Center for Local Government Services, 8th Ed., Harrisburg, Pa.: Page 2.
Pennsylvania Department of Revenue, Pennsylvania Personal Income Statistics, Harrisburg, PA. Report for each year from 1986 to 2006.
Pennsylvania House Resolution No. 334, Session 2009 Printer’s No. 2292, June 24, 2009.
Pennsylvania Local Government Commission. (1988) Real Estate Assessment Task Force Final Report, October 1988.
Pennsylvania Local Government Commission. (2007) “Real Estate Assessment Process in Pennsylvania. An Overview,” in Pennsylvania Legislator’s Municipal Deskbook, Third Edition: Pages 141-148.
Peters, R. A. (2006) “Lessons for the Economic Reform Based on Pennsylvania’s Experiences with the Two Tiered Property Tax.” American Journal of Economics and Sociology 65, No. 3: Pages 701-731.
Robinson, B. G. (2008) “Tioga County Reassessment Rescinded.” Sun-Gazette, July 9, 2008.
Saylor v. Allegheny County, Allegheny County: Assessment Office, No. J-133A-B-2088 (Supreme Court of PA 2008).
Sjoquist, D. L. and M. B. Walker. (1999) “Economies of Scale in Property Tax Assessment.” National Tax Journal, Vol. 52: 2: Pages 207-220.
Stine, W. F. (2005) “Do Budget Maximizing Public Officials Increase the Probability of Property Reassessment?” Ap-plied Economics, 37: Pages 2395-2405.
References (continued from Page 15)
Pennsylvania County Property Reassessment 17
Strauss, R. (2000) “Distributional and Economic Effects of Pennsylvania’s Local Property Taxes,” Testimony at Equity Funding Hearing, Senate Education Committee, Room 8EB Capitol Building, Harrisburg, PA: March 22, 2000.
Strauss, R. (2004) “Residential Real Estate Assessment Fairness in Four Urban Areas” State Tax Notes, 31, 10 (March 8, 2004): Pages 815-820.
Strauss, R. and D. Strauss. (2003) “Residential Real Estate Assessment Fairness in Four Urban Areas.” Paper presented at the National Tax Association Annual Conference, Chicago, IL: November 14, 2003.
Strumpf, K. S. (1998) Infrequent Assessments Distort Property Taxes: Theory and Evidence. North Carolina: University of North Carolina.
Tyler Technologies. (2008) Press Release. Business Wire, January 30, 2008.
Weber, J. A. (1997) “Property Taxes and Assessment Reform.” Senate Policy Development and Research Office, 29 August 1997.
Weber, J. A. (2006) “The Pennsylvania Property Tax and its Endless Reform.” Paper presented to the Pennsylvania Political Science Association, State Capitol Building, Harrisburg, PA: May 2006.
18 The Center for Rural Pennsylvania
GlossaryAssessment: An official valuation of property for the purpose of levying a tax; or an assigned value.
Base year: The year upon which real property market values are based for the more recent countywide revision of assessment of real property or other prior year upon which market value of all real property of the county is based.
Bona fide sell: A good faith exchange resulting from a bargaining.
Coefficient of Dispersion (COD): A measure which determines the degree to which a property’s assessed value actu-ally represents the correct percentage of the property market value.
Common level ratio: The ratio of assessed value to current market value used generally in the county as last deter-mined by the State Tax Equalization Board.
Constant dollar: A dollar valued according to its purchasing power in an arbitrarily set year and then adjusted for price changes in other years so that real purchasing power can be compared by giving prices as they would presumably be in the base year.
Current year: The calendar year for which the tax is levied.
Decentralize: Distributes administrative powers or functions of a central authority over a less concentrated area.
Domicile: A fixed place of abode, which, in the intention of the taxpayer, is permanent rather than transitory.
Equalized mill: A standardized millage calculated by dividing a school district’s total taxes collected and remitted by its total market value as certified by the Pennsylvania State Tax Equalization Board.
Equity: The monetary value of a property or business beyond any amounts owed on it in mortgages, claims, liens, etc.
Established predetermined ratio: The ratio of assessed value to market value established by the board of county commissioners and uniformly applied in determining assessed value in any year.
Geographic breadth: An extent of geographical properties definite or full width.
Immunity: As a general matter, property owned by the commonwealth and its agencies is immune from taxation by a local subdivision in the absence of express statutory authority.
Local tax revenue: Local government counties, municipalities, and school districts income due to taxation.
Market value: The price a willing buyer would pay a willing seller for a property in its present condition with neither buyer nor seller under pressure to act.
Millage or mill: The tax rate, as for property, assessed in mills per dollar. One mill equals one dollar for every one thousand dollars of assessed value.
Real estate taxes: Revenue received from taxes assessed and levied upon real property, including taxes levied on new construction not appearing on the current real estate tax rolls.
Rural: The Center for Rural Pennsylvania defines rural based on population density. This is calculated by dividing the total population of a specific area by the total number of square land miles of that area. Counties, municipalities, or school districts are considered rural if the number of people per square mile is less than 274.
Tax equity: The quality, ideal of being just, impartial and fair of taxation.
Urban: The Center for Rural Pennsylvania defines urban based on population density. This is calculated by dividing the total population of a specific area by the total number of square land miles of that area. Counties, municipalities, or school districts are considered urban if the number of people per square mile is more than 274.


The Center for Rural Pennsylvania625 Forster St., Room 902Harrisburg, PA 17120Phone: (717) 787-9555Fax: (717) 772-3587www.rural.palegislature.us1P1110 – 450