Embed Size (px)
Citation preview
Penn State Student Health Assessment Spring2016
A summary of health behavior data
about Penn State University Park
undergraduate students.
2 | Penn State Student Health Assessment Spring 2016
About the Assessment
The American College Health Association-National
College Health Assessment II (ACHA-NCHA II) is a
national research survey organized by the American
College Health Association (ACHA) to assist college
health service providers, health educators, counsel -
ors, and administrators in collecting data about their
students’ habits, behaviors, and perceptions on the
most prevalent health topics.
This summary highlights results of the ACHA-NCHA II
Spring 2016 survey for Pennsylvania State University.
In March 2016, a random sample of 10,500 University
Park undergraduate students was contacted by email
and invited to complete the online survey. A total of
1,776 students completed surveys, with an overall
response proportion of 17%. When compared to the
overall University Park student population, females,
White students, and Asian students were over-rep -
resented among the survey respondents. As a result,
caution should be taken when interpreting these data
as they may not accurately reflect the health and
health behaviors of the University Park student
population as a whole.

3 | Penn State Student Health Assessment Spring 2016
DATA HIGHLIGHTS Health & Academic Performance Students were asked to select issues
affecting their academic performance
(i.e., received a lower grade on an exam
or course, received an incomplete or
dropped a course, or experienced
disruption in thesis, research or
practicum work) in the last 12 months.
Top 10 Issues that Affect Academics
Photo: Bill Zimmerman
Issues % of students
1. Stress 27%
3. Sleep difficulties 18%
2. Anxiety 20%
4. Cold/Flu/Sore Throat 15%
6. Participation in extracurricular 11% activites
7. Internet use/Computer games 9%
5. Depression 12%
8. Work 8%
10. Concern for a friend/family member 8%
9. Relationship difficulties 8%
27% Percentage of Penn
State students who say stress affected their
academic performance in the last 12 months.
18% Percentage of Penn State students who say sleep difficulties affected their academic performance in the last
12 months.

Penn State Student Health Assessment Spring 2016 | 4
Most Common Health Problems This chart lists the most common health Most Common Health Problems problems faced by Penn State students that were diagnosed or treated by a health professional in the last 12 months.
Quick Facts General Health 91% of students described their health as good, very good or excellent
Alcohol & Drug Use in the Past 30 Days Alcohol: 78%
Cigarettes: 9%
Marijuana: 21%
Nutrition 5% reported eating 5 or more servings of fruits and vegetables each day
Physical Activity 56% met the recommendations for aerobic physical activity
Sexual Behavior 79% of students reported having 0 to 2 sexual partners in the past 12 months
5% reported eating 5 or
more servings of fruits and vegetables each
day
91% Described their health
as good, very good or excellent
56% met the
recommendations for aerobic physical
activity
Issues % of Students
1. Sinus Infections 21%
2. Allergies 19%
3. Strep Throat 16%
4. Urinary Tract Infection 10%
Sleep and Stress 14% got enough sleep on 6 or more days in the past week to feel rested in the mornings
51% reported having a more than average or tremendous stress level in the past 12 months

SLEEP AND STRESS
42% Academics
29% Intimate Relationships
24% Career-related Issue
A total of 85% of students reported that, at some time within the last 12 months, they felt overwhelmed by all they had to do.
Reported overall level of stress experienced within the last 12 months
Top 5 Stressors in the Past 12 Months
25% Finances
26% Personal Appearances
5 | Penn State Student Health Assessment Spring 2016
4%
13%
39% 41%
4% 1%
5%
40%
46%
8%
0%
10%
20%
30%
40%
50%
No stress Less than average Average More than average Tremendous stress
Male Female

-
-
-
15% UHS/CAPS
30% Counselor/Psychologist
11% Other medical
provider
Number of days per week students felt tired, dragged out, or sleepy during the day
Only 1 in 3 students reported getting enough sleep to feel rested at least 5 of the last 7 days.
34% of students reported having more than a little problem with sleepiness during daytime activities.
MENTAL HEALTH 12% of men and 18% of women reported being diag nosed or treated for at least one mental health condition in the past 12 months.
Diagnosis of anxiety vs. feel ing overwhelming anxiety: 14% of students were diagnosed and/or treated
for anxiety in the past 12 months. 54% reported feeling overwhelming anxi ety in the past 12 months.
Diagnosis of depression vs. feeling so depressed it was difficult to function:
11% of students were diagnosed and/or treated for depression in the past 12 months. 30% reported feeling so depressed it was difficult to function.
WHERE STUDENTS WENT FOR MENTAL HEALTH SERVICES
11% Psychiatrist
3% Clergy
Penn State Student Health Assessment Spring 2016 | 6
11%
43% 39%
8%9%
37%
43%
12%
0%
10%
20%
30%
40%
50%
0 days 1-2 days 3-5 days 6-7 days
Male Female
7 | Penn State Student Health Assessment Spring 2016
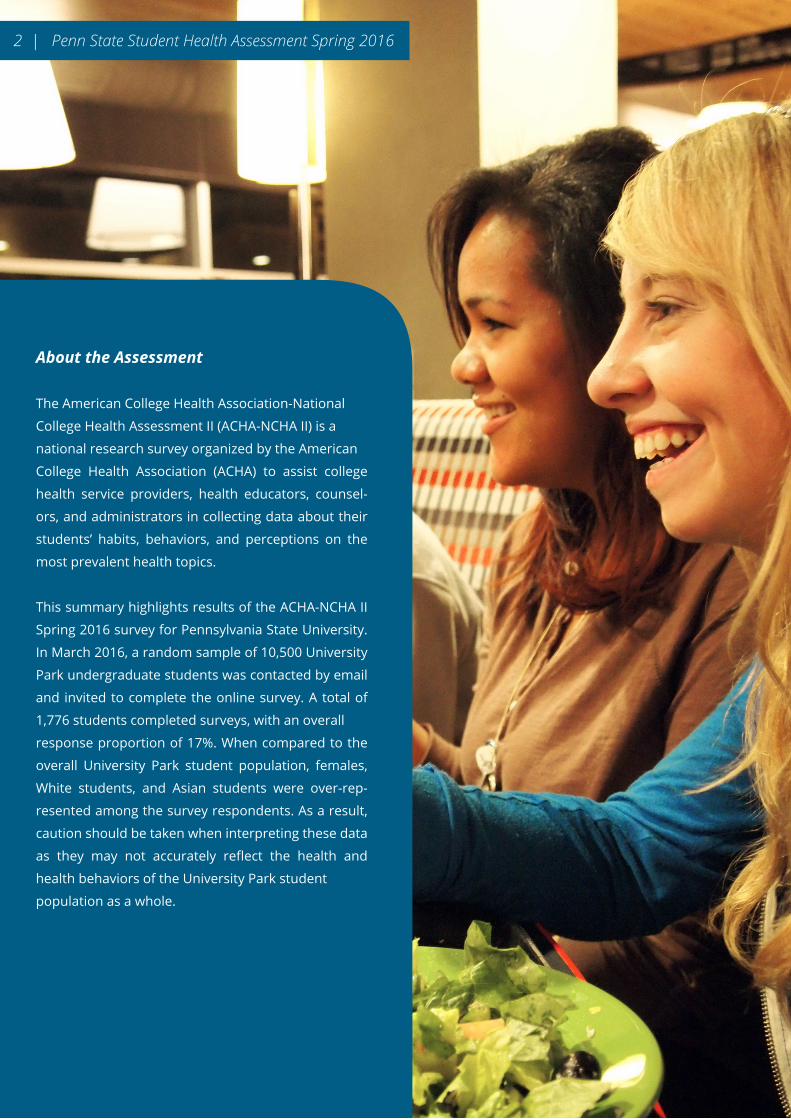
NUTRITION Nutrient Deficiencies Nearly 27% of Penn State students reported only eating breakfast 1-3 days out of the week and 9% reported never eating breakfast.
Only 5% of Penn State students reported eating 5 or more servings* of fruits and vegetables per day.
The majority of students (58%) reported eating 1-2 servings per day.
Fruit & Vegetable Intake Per Day *Serving is about 1 cup of either a fruit or a vegetable.
Male Female
70% 63%
57%60%
50%
40% 33%
30% 25%
20%
8% 6%10% 5% 4%
0% 0 servings 1-2 servings 3-4 servings 5+ servings
Healthy Choices 62% of Penn State students reported eating fast food (ex. Burger King, Dunkin Donuts, McDonalds, Panda Express) only 0-2 days out of the last 30 days.
47% of Penn State students said they choose whole grains more than 50% of the time or always when they consume grains.

Chart 6. Reported hours of leisure screen time per day
40%
PHYSICAL ACTIVITY
Penn State Student Health Assessment Spring 2016 | 8
56% 56% of Penn State students met the
guidelines for recommended physical activity each week.
The guidelines for physical activity, according to the
American College of Sports Medicine and the
American Heart Association:
>30 minutes of moderate-intensity aerobic exercise 5+ days/week.
>20 minutes of vigorous-intensity aerobic exercise 3+ days/week.
Any combination of the two.
Moderate Intensity Physical Activity Vigorous Intensity Physical Activity
32% 35%
33%
37%
29%
34%
0%
5%
10%
15%
20%
25%
30%
35%
0 days 1-2 days 3-7 days
Male Female
19%
52%
28%
19%
53%
28%
0%
10%
20%
30%
40%
50%
60%
0 days 1-4 days 5-7 days
Male Female
Hours of Leisure Screen Time per Day
1% 4% 8%
28% None
<1 hour 17% 1 hour
2 hours
3 hours
4 hours
5+ hours
19% 23%
Nearly 50% of students said they spend an aver-age of 4 or more hours per day on their com-puter, mobile device, or watching TV (NOT including time for work or schoolwork).

9 | Penn State Student Health Assessment Spring 2016
ALCOHOL USE AMONG STUDENTS
Alcohol Use in the Past 30 Days Male Female
60% 56%53%
50%
40%
30% 22%22%
17%20% 13%
9% 8%10% 1%0%
0% Never used Used, but not Used 1-9 days Used 10-29 Used all 30
in the last 30 days days days
ALCOHOL USEAMONG STUDENTS
Photo: Jennifer Struble
Penn State Student Health Assessment Spring 2016 | 10
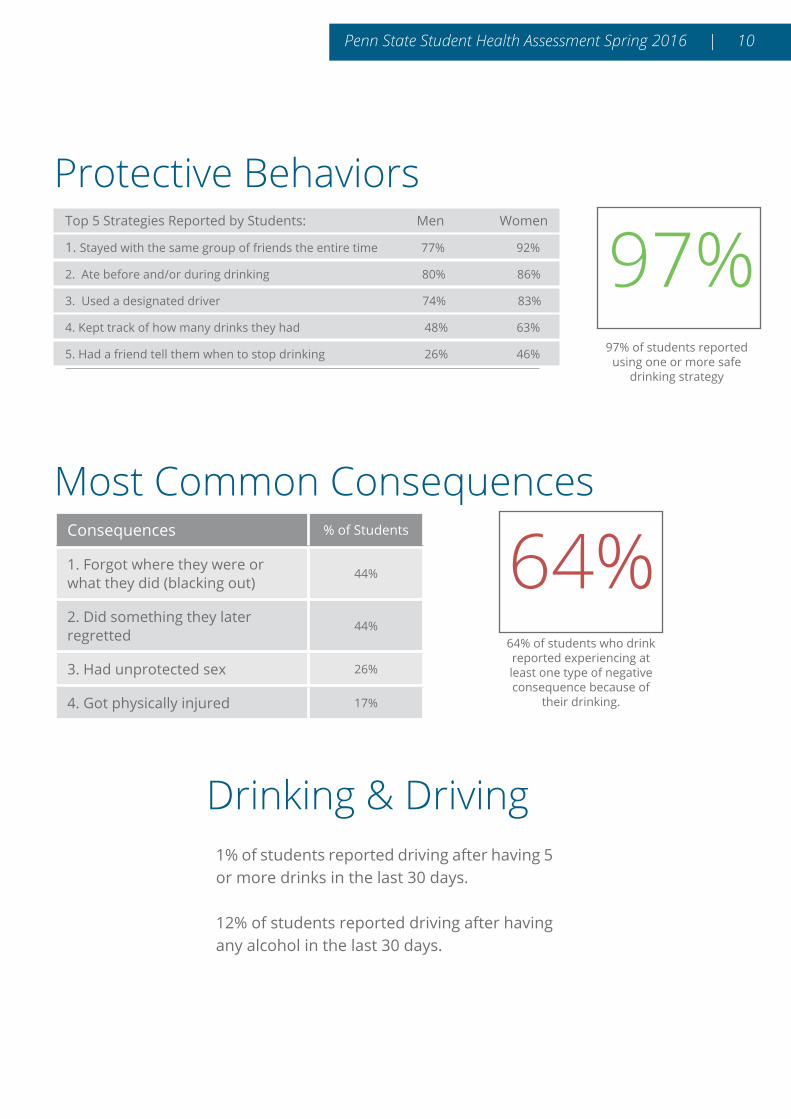
Protective Behaviors Top 5 Strategies Reported by Students: Men Women
1. Stayed with the same group of friends the entire time 77% 92%
2. Ate before and/or during drinking 80% 86%
3. Used a designated driver 74% 83%
4. Kept track of how many drinks they had 48% 63%
5. Had a friend tell them when to stop drinking 26% 46% 97% of students reported using one or more safe
drinking strategy
97%
Most Common Consequences Consequences % of Students
1. Forgot where they were or what they did (blacking out)
44%
2. Did something they later regretted
44%
3. Had unprotected sex 26%
4. Got physically injured 17%
64% of students who drink reported experiencing at least one type of negative consequence because of
their drinking.
Drinking & Driving 1% of students reported driving after having 5 or more drinks in the last 30 days.
12% of students reported driving after having any alcohol in the last 30 days.
64%

TOBACCO USE Cigarette use in the past 30 days Most students either never used or didn’t use cigarettes in the past 30 days.
Perceptions of other students’ cigarette use in the past 30 days Students overestimate how much other students smoke cigarettes.
11 | Penn State Student Health Assessment Spring 2016
70%
17% 10%
1% 2%
82%
11% 6%
0% 1% 0%
10% 20% 30% 40% 50% 60% 70% 80% 90%
Never used Used, but not in the last 30
days
Used 1-9 days Used 10-29 days
Used all 30 days
Male Female
9% 14%
52%
17%
7%8% 10%
50%
19% 13%
0%
10%
20%
30%
40%
50%
60%
Never used Used, but not in the last 30
days
Used 1-9 days Used 10-29 days
Used all 30 days
Male Female
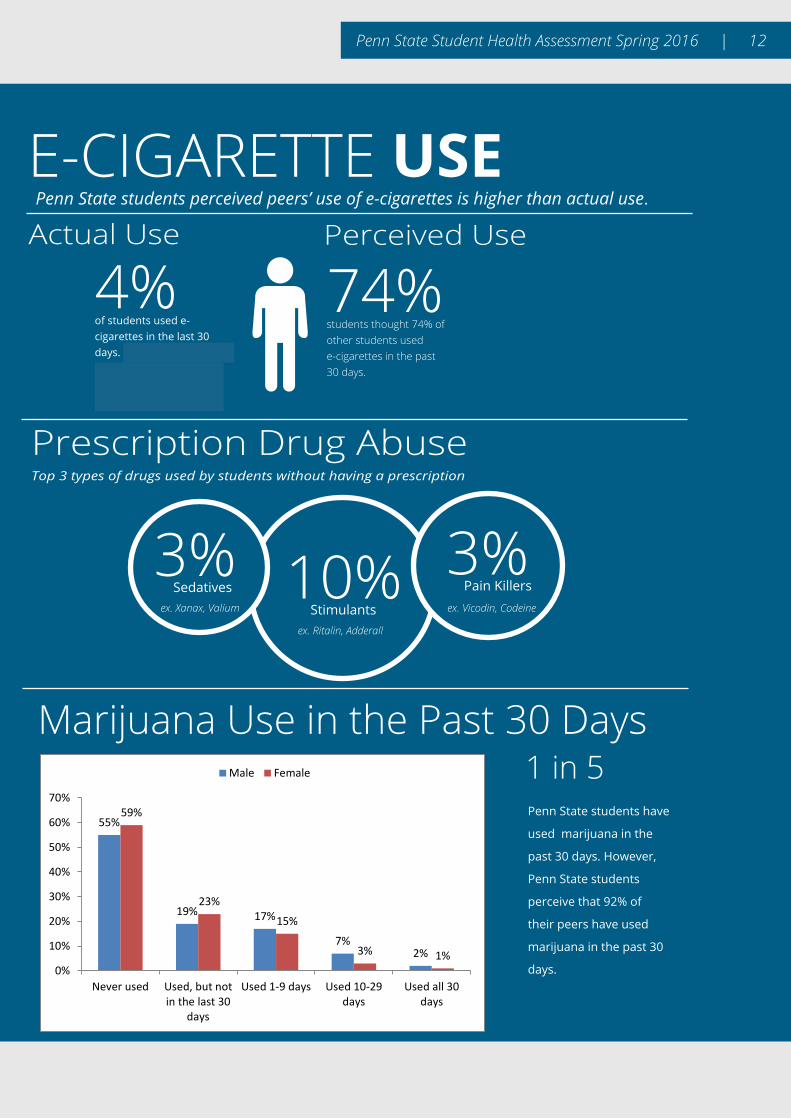
4% of students used e-cigarettes in the last 30 days. Penn State students perceived that 74% of students had used in the last 30 days.
1 in 5
74% students thought 74% of other students used e-cigarettes in the past 30 days.
E-CIGARETTE USE
3% Sedatives
Penn State students perceived peers’ use of e-cigarettes is higher than actual use.
Prescription Drug Abuse Top 3 types of drugs used by students without having a prescription
3% Pain Killers10%
Stimulants
Penn State students have
used marijuana in the
past 30 days. However,
Penn State students
perceive that 92% of
their peers have used
marijuana in the past 30
days.
Marijuana Use in the Past 30 Days
ex. Xanax, Valium
ex. Ritalin, Adderall
ex. Vicodin, Codeine
Actual Use Perceived Use
Penn State Student Health Assessment Spring 2016 | 12
55%
19% 17%
7% 2%
59%
23%
15%
3% 1% 0%
10%
20%
30%
40%
50%
60%
70%
Never used Used, but not in the last 30
days
Used 1-9 days Used 10-29 days
Used all 30 days
Male Female

University Health Services http://studentaffairs.psu.edu/health/
University Health Services
Student Health Center
University Park, PA 16802
The publication is available in alternative media on request. Penn State is an equal opportunity affirmative action employer, and is committed to providing employment opportunities to minorities, women, veterans, individuals with disabilities, and other protected groups. Nondiscrimination: http://guru.psu.edu/ policies/AD85.html U.Ed. STA 15-35