Embed Size (px)
Citation preview
Penetrating the Mucus BarrierThe Effect of Addition of Guluronate
Oligomers on the Mobility of Nanoparticles in
Porcine Small Intestinal Mucus
Solveig Lysfjord Sørensen
Biotechnology (5 year)
Supervisor: Kurt Ingar Draget, IBTCo-supervisor: Catherine Taylor Nordgård, IBT
Department of Biotechnology
Submission date: May 2015
Norwegian University of Science and Technology

i
Preface This master thesis was conducted at the Norwegian Biopolymer Laboratory (NOBIPOL), Institute of
Biotechnology at the Norwegian University of Science and Technology (NTNU) from September 2014
to May 2015. The thesis was written in collaboration with a research group led by Professor Kurt I.
Draget, which is part of the COMPACT project.
The work with this thesis has been both interesting and challenging. I have learned a lot about the
scientific working process, and I have become more experienced in working independently.
I would like to thank my supervisors for guidance and support throughout the work with the thesis. I
would also like to thank Morten Johnsen Dille for guidance and help in the laboratory. My fellow
students have been a valuable source for sharing both frustrations and successes. And last, but not
least, I would like to thank my family and friends for motivation and moral support, and especially
Halvor, without whom I could not have done this.
ii
Abstract Oral delivery is the easiest and most used method of drug delivery. However, the gastrointestinal
(GI) tract poses many hurdles for the drugs to overcome before they can reach their target. One of
them is the viscous, adhesive, and constantly replenishing mucus layer. Mucus layer effectively
hinders particles and microorganisms from passing through by several mechanisms: the steric,
interactive, and dynamic barriers. Nanoparticle drug delivery systems can be modified to affect the
solubility, stability, permeability or other properties of biopharmaceuticals, leading to improved
bioavailability and an enhanced, controlled or more rapid therapeutic effect. Modification of
nanoparticles in order to penetrate the mucus layer more efficiently is an attractive prospect to
increase the efficacy of the drug. PEGylation is a technique for enhancing particle transport and
mobility in mucus. Low molecular weight G-blocks have been shown to transiently weaken the
mucus layer, possibly allowing for more rapid diffusion of substances.
In addition, biosimilar mucus is a proposed model for porcine small intestinal mucus (PSIM). Caco-2
cells, a common cell line used in drug absorption studies, are not compatible with native mucus.
Biosimilar mucus could be an attractive alternative. It is necessary to assess the diffusion of large
particles in biosimilar mucus in comparison with porcine small intestinal mucus, to evaluate the
viability of the model.
In this study, the effect of PEGylation on nanoparticle mobility in PSIM and biosimilar mucus is
examined. The effects of added G-blocks on the mobility of various types of nanoparticles in both
PSIM and biosimilar mucus are studied. General nanoparticle mobility in biosimilar mucus and PSIM
is compared. Nanoparticle mobility was measured using multiple particle tracking (MPT).
There was no consistent effect of adding G-blocks to increase particle mobility in porcine small
intestinal mucus. This is in conflict with earlier reports. A possible explanation could be changes in
mucus structure caused by repeated thawing and freezing. Biosimilar mucus, as it is today, was
found to not be a suitable model for the transport of large entities like nanoparticles in porcine small
intestinal mucus, because of the large differences in particle mobility observed between the two
types of mucus. However, changes in the composition of biosimilar mucus could possibly produce a
more viable model.
iii
Sammendrag Oral levering er den enkleste og mest brukte metoden for levering av legemidler. Mage- og
tarmkanalen stiller imidlertid mange hindringer som legemidler må overvinne før når sitt virkested i
kroppen. En av dem er den viskøse, klebende og kontinuerlig nydannende slimlaget. Slimlaget i
tarmen hindrer effektivt partikler og mikroorganismer fra å passere gjennom ved flere mekanismer:
de steriske, interaktive og dynamiske barrierene. Medikamentleveringssystemer med nanopartikler
kan endres for å påvirke oppløseligheten, stabiliteten, permeabilitet og andre egenskaper til
legemidler, noe som fører til forbedret biotilgjengelighet og en mer effektiv, mer kontrollert eller
raskere terapeutisk effekt. Modifikasjon av nanopartikler for å mer effektivt kunne penetrere
slimlaget er et attraktivt prospekt for å øke effektiviteten av medikamenter. PEGylering er en teknikk
for å øke partikkeltransport og mobilitet i slim. G-blokker med lav molekylvekt har vist seg å
midlertidig svekke slimlaget, noe som muligens gjør at stoffer kan diffundere raskere gjennom
slimet.
I tillegg er biosimilar-slim en foreslått modell for tynntarmsslim fra gris (PSIM). Caco-2-celler, en
cellelinje som vanlig brukes i medikamentabsorpsjonsstudier, er ikke kompatible med naturlig slim.
Biosimilar-slim kan være et attraktivt alternativ. Det er nødvendig å vurdere diffusjonen av store
partikler i biosimilar-slim sammenlignet med PSIM, for å vurdere gyldigheten av modellen.
I denne studien undersøkes effekten av PEGylering på nanopartikkelmobilitet i PSIM og biosimilar-
slim. Effekten av tilsatte G-blokker på mobiliteten til ulike typer av nanopartikler i både PSIM og
biosimilar-slim er studert. Generell nanopartikkelmobilitet i biosimilar-slim og PSIM sammenlignes.
Mobiliteten av fluorescente nanopartikler ble målt ved bruk av multiple particle tracking (MPT).
Samlet sett viser resultatene ingen konsekvent effekt av tilsetningen av G-blokker med lav
molekylvekt på mobiliteten av nanopartikler i PSIM eller biosimilar-slim. En mulig forklaring kan
være at slimstrukturen har blitt endret på grunn av repetert tining og frysing av slimet. Biosimilar-
slim, slik det foreligger i dag, synes ikke å være en god modell for mobiliteten av større partikler, som
nanopartikler, i PSIM. Det er mulig at endringer i sammensetningen av biosimilar-slim kan gi en mer
gyldig modell.
iv
Abbreviations Abbreviation Meaning
BSA Bovine serum albumin CF Cystic fibrosis CLSM Confocal laser scanning microscope COMPACT Collaboration on the Optimization of Macromolecular Pharmaceutical Access
to Cellular Targets Da Dalton DPn Degree of polymerisation EDC 1-Ethyl-3-(3-dimethylaminopropyl)carbodiimide hydrochloride EDTA Ethylenediaminetetraacetic acid G α-L-Guluronic acid G-blocks α-L-Guluronate oligomers GI Gastrointestinal HBS HEPES buffered saline HEPES 4-(2-Hydroxyethyl)piperazine-1-ethanesulfonic acid M β-D-Mannuronic acid mPEGa Methoxy-polyethylene glycol-amine MPT Multiple particle tracking ms Milliseconds MSD Mean square displacement NDDS Nanoparticle drug delivery systems PC Phosphatidylcholine PEG Polyethylene glycol PG Porcine gastric PIM Porcine intestinal mucus PSIM Porcine small intestinal mucus Sulfo-NHS N-Hydroxysulfosuccinimide τ Time scale
v
Table of contents Preface ..................................................................................................................................................... i
Abstract ................................................................................................................................................... ii
Sammendrag .......................................................................................................................................... iii
Abbreviations ......................................................................................................................................... iv
1. Background ..................................................................................................................................... 1
1.1 The mucosal surfaces and drug delivery ................................................................................. 1
1.2 Mucus ...................................................................................................................................... 1
1.2.1 The composition and properties of mucus ......................................................................... 1
1.2.2 Different mucus models ...................................................................................................... 5
1.2.3 Biosimilar mucus ................................................................................................................. 6
1.3 Nanoparticles .......................................................................................................................... 8
1.3.1 Nanoparticle mobility in mucus ........................................................................................ 10
1.4 PEGylation ............................................................................................................................. 10
1.5 MUCOVA ............................................................................................................................... 11
1.6 Multiple particle tracking ...................................................................................................... 12
2. Aim ................................................................................................................................................ 15
3. Materials and methods ................................................................................................................. 16
3.1 Materials ............................................................................................................................... 16
3.2 PEGylation of FluoSpheres .................................................................................................... 16
3.3 Production of biosimilar mucus ............................................................................................ 16
3.4 Sample preparation .............................................................................................................. 17
3.5 Multiple particle tracking ...................................................................................................... 17
4. Results ........................................................................................................................................... 18
4.1 PEGylation of FluoSpheres .................................................................................................... 18
4.2 Examination of aminated and PEGylated nanoparticle mobility in biosimilar mucus and
PSIM .............................................................................................................................................. 18
4.3 Comparison of aminated and PEGylated nanoparticle mobility in biosimilar mucus and
PSIM with added G-blocks ................................................................................................................ 20
4.4 Comparison of same size aminated and PEGylated nanoparticle mobility in PSIM with
added G-blocks ................................................................................................................................. 24
4.5 Comparison of aminated and carboxylated nanoparticle mobility in PSIM with added G-
blocks .............................................................................................................................................. 26
4.6 Comparison of overall particle mobility in biosimilar mucus and PSIM ............................... 32
5. Discussion ...................................................................................................................................... 36
5.1 The effect of size and surface modification on particle mobility in PSIM ............................ 36
5.2 Comparison of biosimilar mucus and small intestinal mucus ............................................... 38
vi
5.3 The effect of added G-blocks to particle mobility in PSIM ................................................... 39
5.4 Evaluation of method ............................................................................................................ 41
6. Conclusion and future work .......................................................................................................... 43
References ............................................................................................................................................ 44
Appendix A: Protocol for PEGylation of carboxylate modified FluoSpheres ........................................... I
Appendix B: Method for production of biosimilar mucus (10 mL) ......................................................... II
Appendix C: Overview of the setup of all the experiments performed ................................................. III
Appendix D: Matlab script for MSD determination ................................................................................ V
Appendix E: Zeta potential measurements ......................................................................................... VIII
1
1. Background
1.1 The mucosal surfaces and drug delivery Drugs can be delivered by a variety of methods. Drug delivery by intravenous (IV) or intramuscular
(IM) therapy is effective and fast, but inconvenient because it requires trained personnel and
medical equipment. This problem especially applies to individuals receiving treatment that require
frequent doses of medicine. A much simpler alternative would be to administer the drug orally or via
the lungs, as this would enable the patient to take the medicine without trained personnel and
medical equipment. Oral delivery is the easiest and most used method of drug delivery. However,
the gastrointestinal (GI) tract poses many hurdles for the drugs to overcome before they can reach
their target. One of them is the viscous, adhesive, and constantly replenishing mucus layer.
The lungs and the GI tract are part of the mucosal surfaces of the body, as are the nose and the eye.
The mucosal surfaces are covered in mucus, which is a natural barrier that has evolved to hinder
viruses, bacteria and particulate matter from entering the body. The thickness of the mucus layer is
dependent on its location (Ensign et al., 2012). In the GI tract, the thickness has been reported as
50–600 μm in the stomach and 15–450 μm in intestine and colon (Norris et al. 1998, Khanvilkar et al.
2001). The thickest layers of gastrointestinal mucus are reported to be in the stomach and the colon
(Lichtenberger 1995). Mucosal delivery of drugs, particularly large hydrophobic molecules,
biologicals and delivery vehicles is hampered by drug entrapment in mucus followed by rapid
clearance (Lai et al. 2009a). If one could temporarily weaken the mucus barrier to allow the drugs
through, the problem with mucosal delivery of drugs would be circumvented. Permanently disabling
or weakening the mucus barrier is not desired, as this would leave the patient vulnerable to
infections. For example, Ensign et al. reports that “a 30 % depletion of mucus by pilocarpine in an ex
vivo rat intestinal model led to a 3-fold increase in E. coli translocation” (Ensign et al. 2012).
1.2 Mucus
1.2.1 The composition and properties of mucus Mucus is a water-based, complex and heterogeneous gel whose composition varies between both
species, individuals and tissue. The mucus barrier is comprised of a secreted mucus layer and
membrane-bound mucins on the surface of the cells, called the glycocalyx, which together form the
mucosal surface. The secreted mucus layer is a mucin-based gel, where the mucin fibres are cross-
linked and intertwined with each other. Mucins are the most important compounds for the gel
formation of mucus (Sellers et al. 1988), even though they make up only 5 % or less of the mucus
composition (Celli et al. 2005). The other 95 % are mostly water. The secreted and membrane-bound
mucins share some common features, but only the secreted mucins take part in gel formation
(Strous and Dekker 1992).
Mucins are a diverse family of glycoproteins in the MUC gene family, and so far, at least 21 MUC
genes have been described (HUGO Gene Nomenclature Committee). They have an overall high
molecular weight, which can range from 0.5 to 40 MDa (Lai et al. 2009a, Cu and Saltzman 2009,
Thornton and Sheehan 2004). Mucins have a protein backbone that can be “naked” and hydrophobic
in some regions, or be heavily glycosylated by oligosaccharides of varying size and grade of
branching in other regions (Ensign et al. 2012). The various types of mucins differ by the protein
backbone (Rose and Voynow 2006), but there are some similarities. One of these are the PTS
regions, which are regions with repeated residues of the amino acids proline, threonine and serine.
The PTS regions come in various lengths and amounts depending on the specific MUC gene the
mucin originated from, and some regions have been reported to be 5000 amino acids long (Cone
2
2009). In general, the PTS regions make up about 20 to 55 % of the total composition of amino acids
in the backbone (Van Klinken et al. 1995).
The threonine and serine amino acid residues in the protein backbone contain hydroxyl groups, on
which the glycan side chains are bound through O-glycosylation linkages. The glycans are hydrophilic
and contain about 1-20 monomers (Yang et al. 2012). Some common monomers in the glycans are
N-acetylgalactosamine, N-acetylglucosamine, fucose, galactose, sialic acid and mannose (Bansil and
Turner 2006, Thornton and Sheehan 2004). The glycosylation of the protein backbone gives the
mucins a negative charge on average because of the sulphate and carboxylate groups of the
monomers in the glycan side chains (Lichtenberger 1995). The carbohydrate side chains of the
mucins drastically increase their molecular weight, and can comprise as much as 80 % of the mucin
molecular weight (Kornfeld and Kornfeld 1976). The glycan side chains and the intra- and intermucin
repulsion caused by their negative charges also increase the persistence length of the mucins (Cone
2009, Shogren et al. 1989), which is a parameter quantifying the stiffness of a polymer. An increase
in persistence length corresponds to a less flexible and more rigid polymer structure.
The mucins are on average heavily glycosylated, but in between are hydrophobic regions with no
glycosylation, often termed as “naked” regions (Cone 2009, Lai et al. 2009a). The hydrophobic
regions contain many cysteine amino acid residues, about 10 % (Bansil and Turner 2006), and the
disulphide bonds formed between the cysteine contribute to the more globular shape of these
regions (Cone 2005, Lai et al. 2009b). Disulphide bonds can also crosslink different mucins together,
causing polymerisation of mucins (Cone 2009). The cysteine rich regions are often found at the
terminal ends of the mucin molecules, and large networks of mucins can therefore be formed by this
crosslinking (Sheehan et al. 2004). These networks are not permanent, as the many different
interactions between and within mucus components are constantly shifting. This alternating of
hydrophilic and negatively charged glycosylated regions and hydrophobic cysteine-rich regions along
the mucins gives rise to a heterogeneous charge profile, and many possible interaction sites with
other mucins or mucus components. Cu and Saltzman report that each mucin molecule intersects
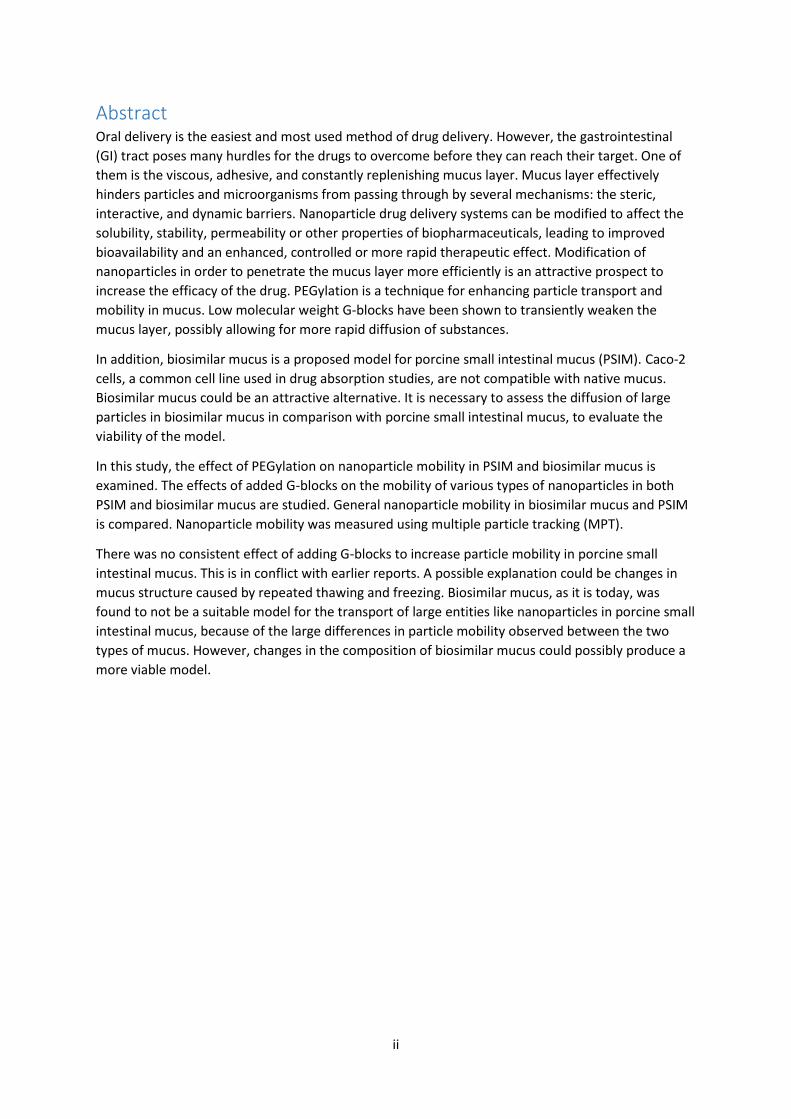
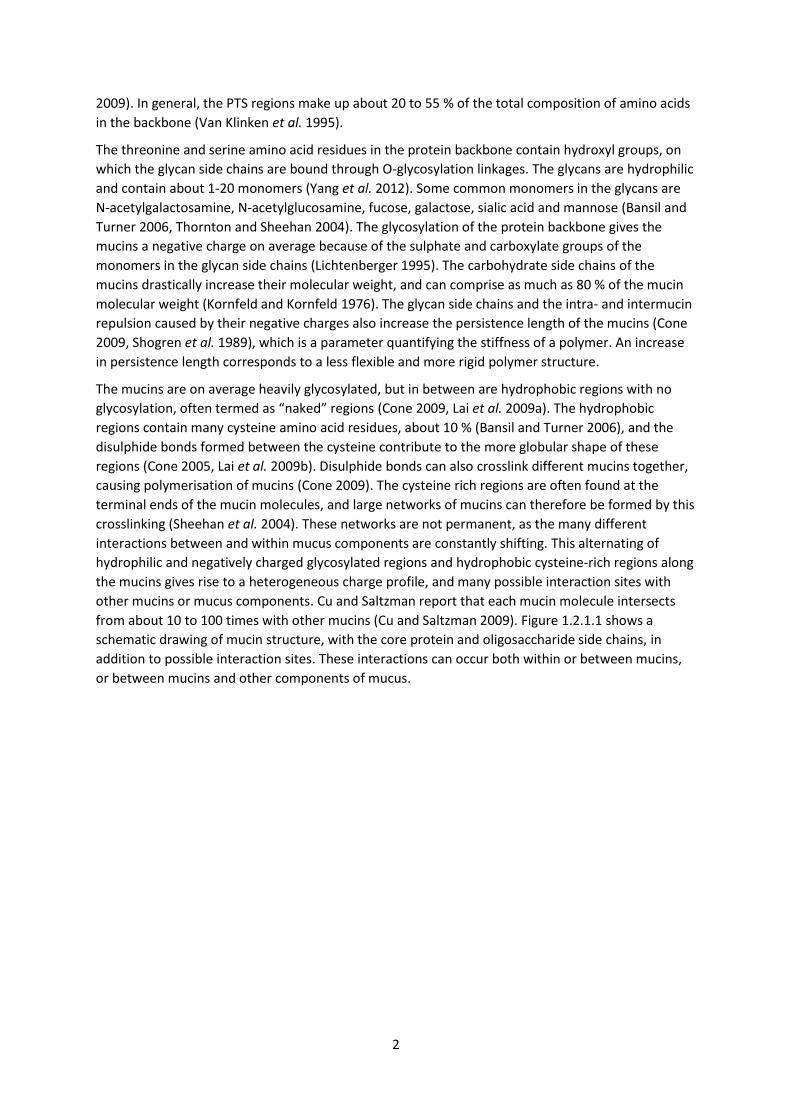
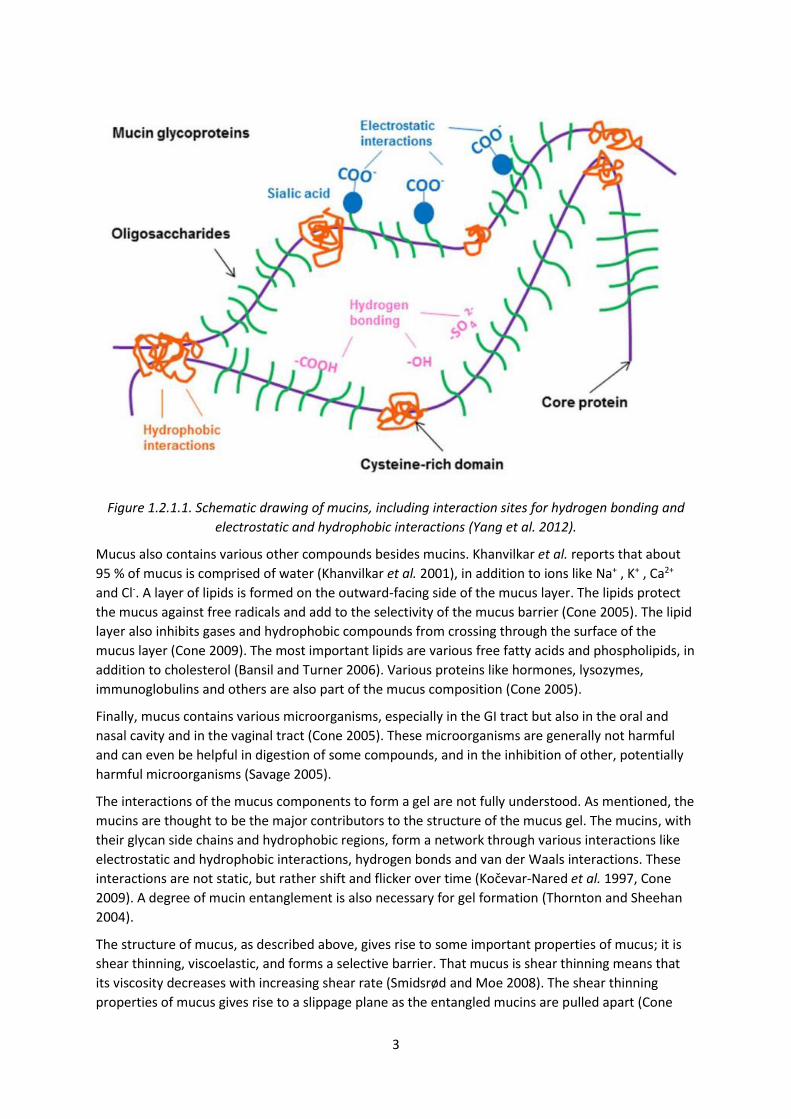
from about 10 to 100 times with other mucins (Cu and Saltzman 2009). Figure 1.2.1.1 shows a
schematic drawing of mucin structure, with the core protein and oligosaccharide side chains, in
addition to possible interaction sites. These interactions can occur both within or between mucins,
or between mucins and other components of mucus.
3
Figure 1.2.1.1. Schematic drawing of mucins, including interaction sites for hydrogen bonding and
electrostatic and hydrophobic interactions (Yang et al. 2012).
Mucus also contains various other compounds besides mucins. Khanvilkar et al. reports that about
95 % of mucus is comprised of water (Khanvilkar et al. 2001), in addition to ions like Na+ , K+ , Ca2+
and Cl-. A layer of lipids is formed on the outward-facing side of the mucus layer. The lipids protect
the mucus against free radicals and add to the selectivity of the mucus barrier (Cone 2005). The lipid
layer also inhibits gases and hydrophobic compounds from crossing through the surface of the
mucus layer (Cone 2009). The most important lipids are various free fatty acids and phospholipids, in
addition to cholesterol (Bansil and Turner 2006). Various proteins like hormones, lysozymes,
immunoglobulins and others are also part of the mucus composition (Cone 2005).
Finally, mucus contains various microorganisms, especially in the GI tract but also in the oral and
nasal cavity and in the vaginal tract (Cone 2005). These microorganisms are generally not harmful
and can even be helpful in digestion of some compounds, and in the inhibition of other, potentially
harmful microorganisms (Savage 2005).
The interactions of the mucus components to form a gel are not fully understood. As mentioned, the
mucins are thought to be the major contributors to the structure of the mucus gel. The mucins, with
their glycan side chains and hydrophobic regions, form a network through various interactions like
electrostatic and hydrophobic interactions, hydrogen bonds and van der Waals interactions. These
interactions are not static, but rather shift and flicker over time (Kočevar-Nared et al. 1997, Cone
2009). A degree of mucin entanglement is also necessary for gel formation (Thornton and Sheehan
2004).
The structure of mucus, as described above, gives rise to some important properties of mucus; it is
shear thinning, viscoelastic, and forms a selective barrier. That mucus is shear thinning means that
its viscosity decreases with increasing shear rate (Smidsrød and Moe 2008). The shear thinning
properties of mucus gives rise to a slippage plane as the entangled mucins are pulled apart (Cone
4
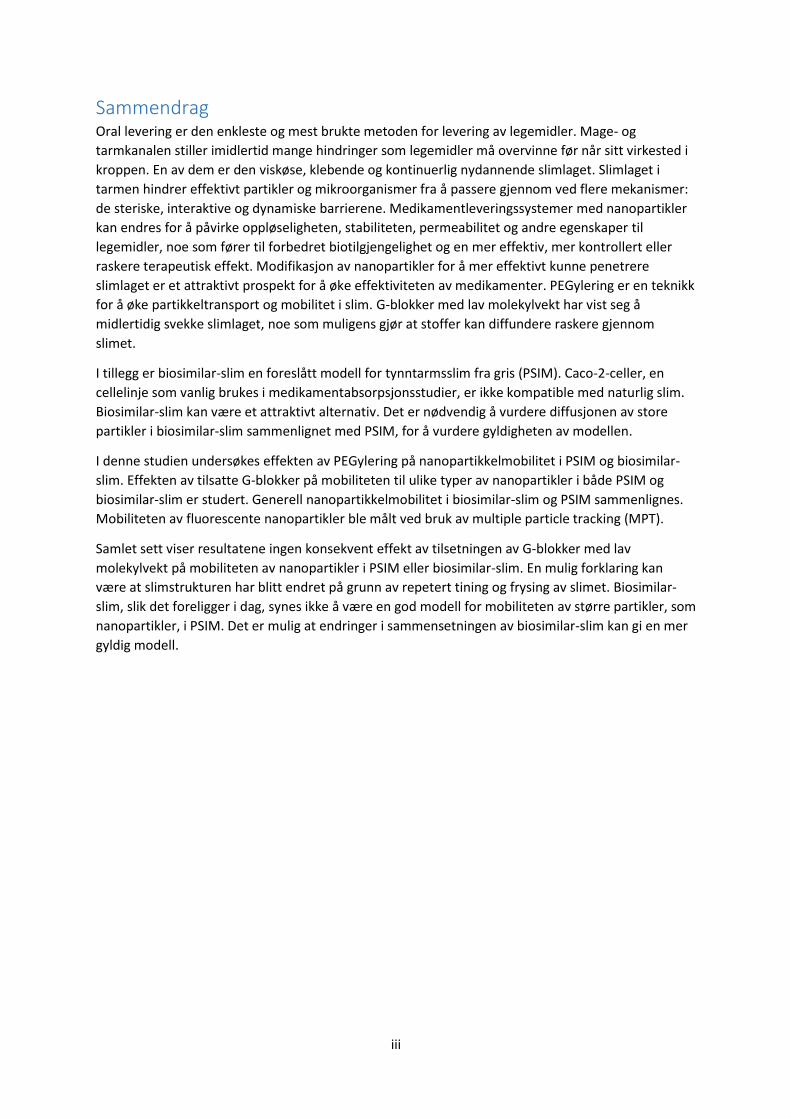
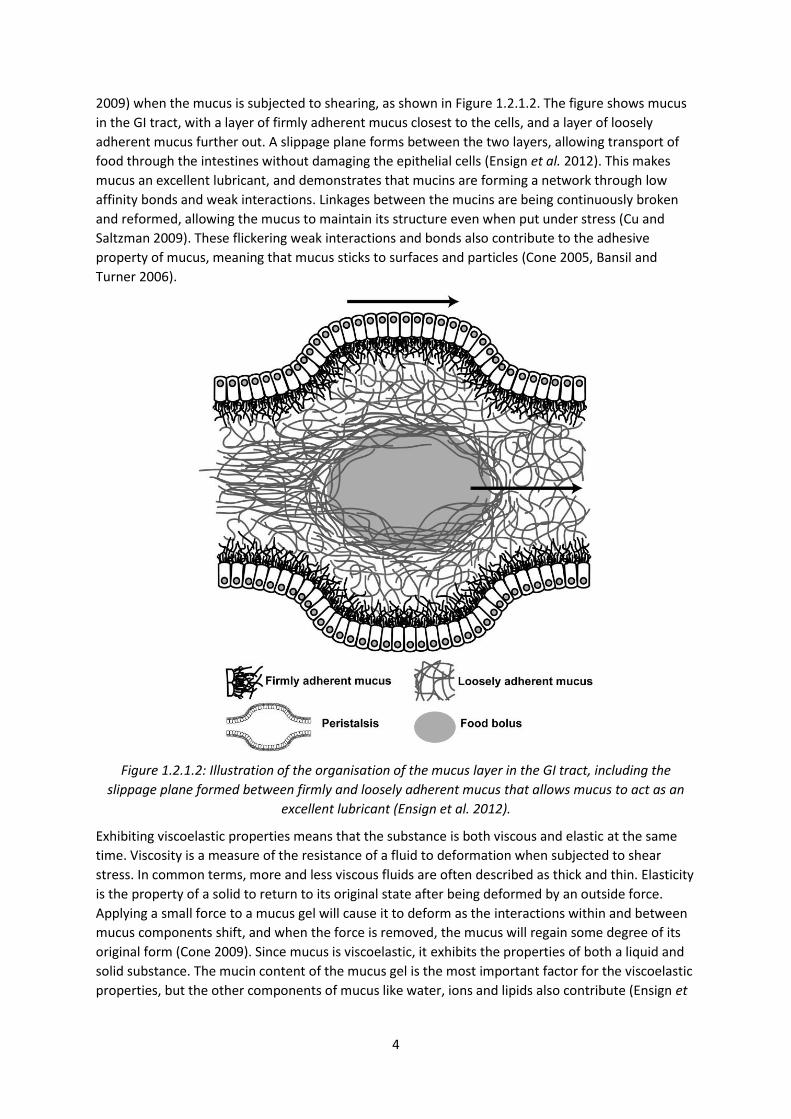
2009) when the mucus is subjected to shearing, as shown in Figure 1.2.1.2. The figure shows mucus
in the GI tract, with a layer of firmly adherent mucus closest to the cells, and a layer of loosely
adherent mucus further out. A slippage plane forms between the two layers, allowing transport of
food through the intestines without damaging the epithelial cells (Ensign et al. 2012). This makes
mucus an excellent lubricant, and demonstrates that mucins are forming a network through low
affinity bonds and weak interactions. Linkages between the mucins are being continuously broken
and reformed, allowing the mucus to maintain its structure even when put under stress (Cu and
Saltzman 2009). These flickering weak interactions and bonds also contribute to the adhesive
property of mucus, meaning that mucus sticks to surfaces and particles (Cone 2005, Bansil and
Turner 2006).
Figure 1.2.1.2: Illustration of the organisation of the mucus layer in the GI tract, including the
slippage plane formed between firmly and loosely adherent mucus that allows mucus to act as an
excellent lubricant (Ensign et al. 2012).
Exhibiting viscoelastic properties means that the substance is both viscous and elastic at the same
time. Viscosity is a measure of the resistance of a fluid to deformation when subjected to shear
stress. In common terms, more and less viscous fluids are often described as thick and thin. Elasticity
is the property of a solid to return to its original state after being deformed by an outside force.
Applying a small force to a mucus gel will cause it to deform as the interactions within and between
mucus components shift, and when the force is removed, the mucus will regain some degree of its
original form (Cone 2009). Since mucus is viscoelastic, it exhibits the properties of both a liquid and
solid substance. The mucin content of the mucus gel is the most important factor for the viscoelastic
properties, but the other components of mucus like water, ions and lipids also contribute (Ensign et
5
al. 2012). Viscoelastic properties are often measured and assessed by rheological methods, which
measure the deformation of a substance in response to an applied force.
Mucus effectively hinders particles and microorganisms from passing through by several
mechanisms: the steric, interactive and dynamic barriers (Sanders et al. 2009). Firstly, the mucins
interact with each other as mentioned above and form a matrix that physically stops particles from
moving through the mucus. This is the steric barrier. This barrier will obstruct particles that are
above a certain size, depending on the mucus pore size, while smaller particles can in theory move
through the pores. The pore size of mucus can vary between or within samples, as factors like the
degree of glycosylation, electrostatic repulsion or attraction, and the extent of hydrophobic
interactions and disulphide bonds can influence the structure of the mucins, and thereby the pore
size. Pore size can be used as a measure of the degree of steric hindrance and can span over a large
range. This is demonstrated by records of pore sizes in porcine tracheobronchial mucus measured to
vary between 80 and 1500 nm, using PEGylated nanoparticles and atomic force microscopy (Yang et
al. 2012).
Secondly, the mucins and other mucus components associate with the particle, forming multiple
non-covalent interactions and trapping the particle in place. Although each individual bond or
interaction may be weak, the number of interactions from the mucus to each particle adds up to a
significant force (Cone 2009). As mentioned, the mucins are capable of hydrogen bonding and
electrostatic interactions through the glycan side chains, and hydrophobic interactions through
naked regions exposing the core protein, in addition to van der Waals interactions (Khanvilkar et al.
2001, Woodley 2001). All of these possible interaction sites gives mucus the attribute of being able
to adhere to particles or microorganisms with a range of properties, like a hydrophobic surface or
positive or negative charges (Yang et al. 2012).
Thirdly, new mucus is constantly produced and secreted from specialized cells, and the rapid
turnover removes the trapped particles. This is the dynamic barrier, which hinders particles or
microorganisms from reaching the underlying cells to potentially enter the body, unless they are
able to rapidly penetrate the mucus layer. Most of the secreted mucus is digested and the
components are recycled, but some are lost for example in faeces (Kwon et al. 2013). The mucus
shedding and replenishment is especially high in the GI tract (Cone 2009), and an average human
produces about 10 litres of mucus every day (Ensign et al. 2012).
1.2.2 Different mucus models When conducting a drug absorption study different mucus models are available. This can pose a
challenge in trying to compare studies of particle or compound mobility in mucus, because of the
variety of mucus models being used. As mentioned, mucus layers can be found several places in the
body. It poses a barrier for the entry of drugs into the body through delivery methods like oral,
rectal, vaginal, nasal, or delivery to the lungs, as they are all part of the mucosal surfaces. Some of
the mucus models in use are pig gastric mucin (purified or unpurified), and several types of artificial
mucus, which are often reconstituted pig gastric mucus. Natural mucus is frequently used, like pig
gastric or intestinal mucus, horse respiratory mucus, human cervicovaginal mucus, human airway
mucus, and also natural mucus from diseased individuals like cystic fibrosis mucus or sputum. In
addition, there are several in vitro models involving different cell lines, and in vivo models with rats
or mice (Groo and Lagarce 2014).
Porcine gastric or intestinal mucins and mucus are often used for absorption studies simulating oral
administration because of their resemblance to the mucus found in humans, for example regarding
viscoelastic properties, structure and molecular weight (Sellers et al. 1991, Kararli 1995, Lai et al.
6
2009b). Some of the gene sequences for mucins in pigs have also been found to resemble human
mucin genes (Celli et al. 2005). Porcine gastric and intestinal mucus can be obtained from pig
intestines from for example slaughterhouses, which can be a cumbersome process and pose some
difficulties. Native mucus is naturally heterogeneous and its composition can vary between
individuals and between secretion sites, which can be challenging when comparing results from
different studies or even from the same study. For example, Sanders et al. reported mucin
concentrations that varied from 10 to 47 mg/mL between six samples of natural mucus (Sanders et
al. 2000). To diminish the individual differences somewhat, mucus from different batches can be
mixed. Native gastric and intestinal mucus can also contain various debris like remnants of food and
other substances (Groo and Lagarce 2014).
The Caco-2 cell line is often used in studies for drug uptake in the intestine because they are similar
to the enterocytes found there. However, there are some difficulties regarding the use of the Caco-2
cell line with mucus. In order to represent the uptake of drugs in human intestines accurately, a
mucus layer must be present, but Caco-2 cells are not compatible with native mucus, as it breaks the
single-cell layer (Boegh et al. 2013, Boegh et al. 2014).
Commercial porcine mucin has been used to prepare mucin solutions as a substitute for native
mucus, since native mucus can be very diverse and difficult to obtain. Such solutions are more
stable, but the results are not necessarily comparable to native mucus, since native mucus contains
many other substances, like lipids, salts and other proteins, in addition to mucin (Cone 2009). In
addition, the structure of Sigma mucin differs from the mucin found in native mucus. The Sigma
mucin is “obtained by digestion of hog stomach with pepsin, followed by precipitation and other
steps (Sigma-Aldrich 2011).” The structure of the Sigma mucin has possibly been altered and
fragmented by the processes it went through during the isolation, particularly the digestion with
pepsin. The extraction process causes disruption of the disulfide bridges between and within the
mucin molecules, which results in a weaker gel (Groo and Lagarce 2014). In a study, the diffusion
percentage of drugs in native porcine intestinal mucus and purified porcine gastric mucin was found
to be significantly different, with the drugs being more hindered by the native mucus. This was
attributed to the fact that a mucin-only gel does not accurately reflect the complexity and
composition of native mucus (Larhed et al. 1997). However, since the two types of mucin that were
compared (intestinal mucus and gastric mucin) are from different sites and therefore inherently
different, that could be another explanation. Consequently, researchers have directed their focus
towards reconstituted mucus, and several types have been made. Some common features are
mixing porcine mucin with bovine serum albumin (BSA), buffers, and/or lipids in order to achieve an
artificial mucus that is comparable with natural mucus, but without some of its flaws like the high
degree of heterogeneity (Groo and Lagarce 2014).
1.2.3 Biosimilar mucus As described above, a mucus model for drug absorption studies that was compatible with Caco-2
cells was lacking. Biosimilar mucus was developed to serve as a biocompatible model for porcine
intestinal mucus (PIM), and mimic its rheological properties. Boegh et al. prepared and analysed a
mixture with inspiration from Larhed et al., who had determined that the main constituents of
intestinal mucus was mucin, linoleic acid, cholesterol, phosphatidylcholine (PC) and albumin (BSA)
(Larhed et al. 1998). Their analysis found that the initial mixture was not successful in reproducing
the rheological properties of porcine intestinal mucus, as the mucus mixture displayed liquid-like
properties in contrast to the solid-like properties displayed by PIM (Boegh et al. 2013). They
modified the initial mucus by increasing the mucin content and adding polyacrylic acid (PAA) to
obtain shear thinning and solid-like properties comparable to those of porcine intestinal mucus.
7
PAA is not a part of the natural composition of native mucus, but was needed for the biosimilar
mucus to resemble the viscoelastic properties of native mucus. When testing the biocompatibility of
the mixture they found that the high content of linoleic acid was toxic to the cells, and thus had to
be reduced (Boegh et al. 2014).
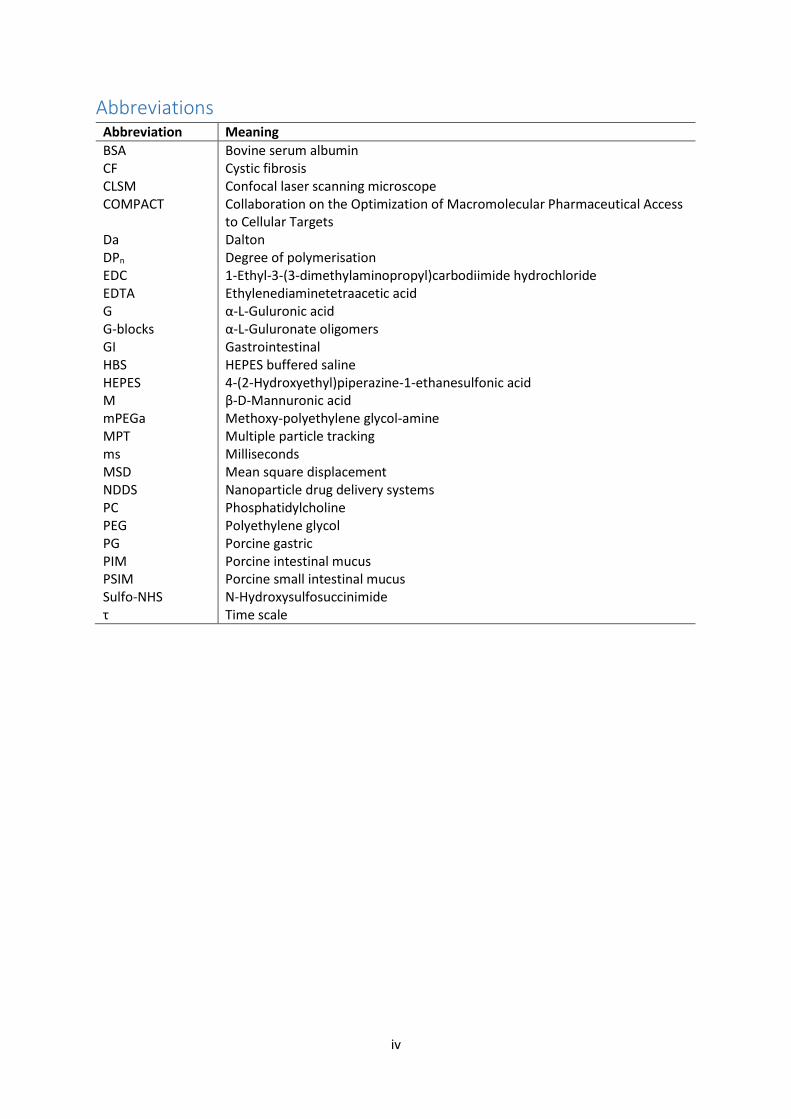
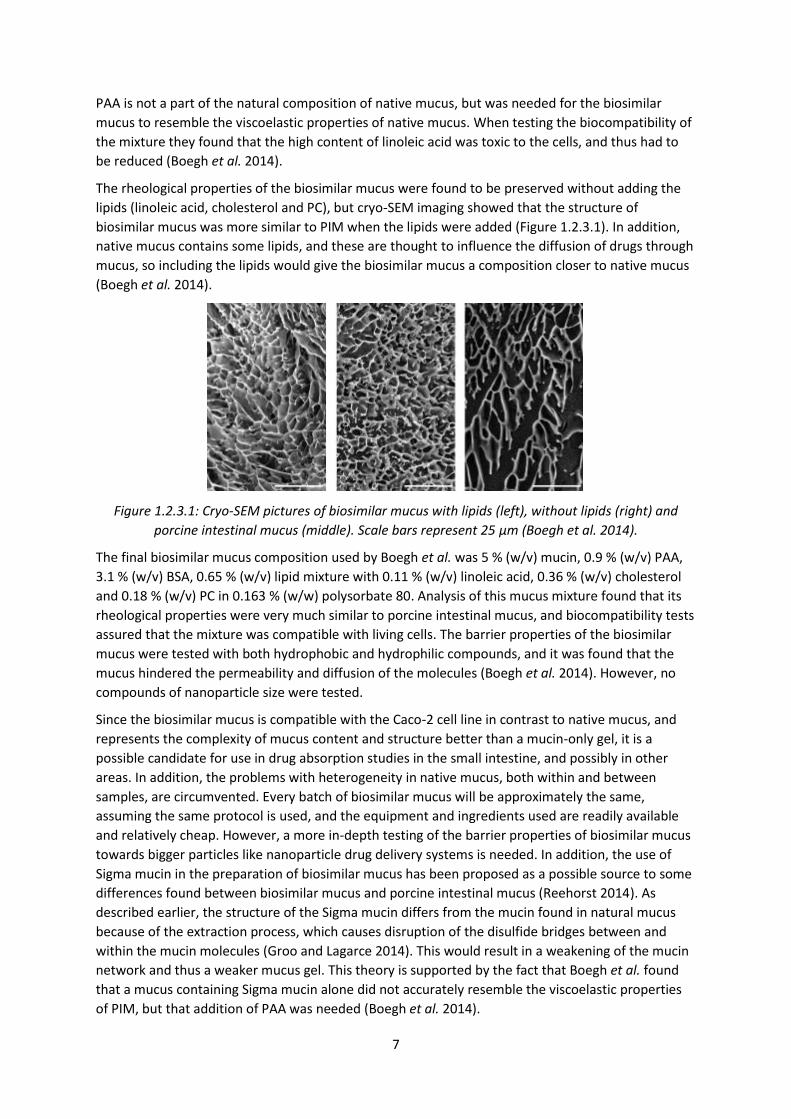
The rheological properties of the biosimilar mucus were found to be preserved without adding the
lipids (linoleic acid, cholesterol and PC), but cryo-SEM imaging showed that the structure of
biosimilar mucus was more similar to PIM when the lipids were added (Figure 1.2.3.1). In addition,
native mucus contains some lipids, and these are thought to influence the diffusion of drugs through
mucus, so including the lipids would give the biosimilar mucus a composition closer to native mucus
(Boegh et al. 2014).
Figure 1.2.3.1: Cryo-SEM pictures of biosimilar mucus with lipids (left), without lipids (right) and
porcine intestinal mucus (middle). Scale bars represent 25 μm (Boegh et al. 2014).
The final biosimilar mucus composition used by Boegh et al. was 5 % (w/v) mucin, 0.9 % (w/v) PAA,
3.1 % (w/v) BSA, 0.65 % (w/v) lipid mixture with 0.11 % (w/v) linoleic acid, 0.36 % (w/v) cholesterol
and 0.18 % (w/v) PC in 0.163 % (w/w) polysorbate 80. Analysis of this mucus mixture found that its
rheological properties were very much similar to porcine intestinal mucus, and biocompatibility tests
assured that the mixture was compatible with living cells. The barrier properties of the biosimilar
mucus were tested with both hydrophobic and hydrophilic compounds, and it was found that the
mucus hindered the permeability and diffusion of the molecules (Boegh et al. 2014). However, no
compounds of nanoparticle size were tested.
Since the biosimilar mucus is compatible with the Caco-2 cell line in contrast to native mucus, and
represents the complexity of mucus content and structure better than a mucin-only gel, it is a
possible candidate for use in drug absorption studies in the small intestine, and possibly in other
areas. In addition, the problems with heterogeneity in native mucus, both within and between
samples, are circumvented. Every batch of biosimilar mucus will be approximately the same,
assuming the same protocol is used, and the equipment and ingredients used are readily available
and relatively cheap. However, a more in-depth testing of the barrier properties of biosimilar mucus
towards bigger particles like nanoparticle drug delivery systems is needed. In addition, the use of
Sigma mucin in the preparation of biosimilar mucus has been proposed as a possible source to some
differences found between biosimilar mucus and porcine intestinal mucus (Reehorst 2014). As
described earlier, the structure of the Sigma mucin differs from the mucin found in natural mucus
because of the extraction process, which causes disruption of the disulfide bridges between and
within the mucin molecules (Groo and Lagarce 2014). This would result in a weakening of the mucin
network and thus a weaker mucus gel. This theory is supported by the fact that Boegh et al. found
that a mucus containing Sigma mucin alone did not accurately resemble the viscoelastic properties
of PIM, but that addition of PAA was needed (Boegh et al. 2014).

8
1.3 Nanoparticles Nanoparticles are particles whose size are measured in nanometres (nm, 10-9 to 10-7 meters).
Nanoparticles and nanotechnology have many exciting uses, but this thesis will be focused on the
use of nanoparticles as drug delivery systems. Nanoparticles for medical applications are defined as
follows:
Nanoparticles for pharmaceutical purposes are defined as solid colloidal particles
ranging in size from 1 nm to 1000 nm. They consist of macromolecular materials and
can be used therapeutically as drug carriers, in which the active principle (drug or
biologically active material) is dissolved, entrapped or encapsulated, or to which the
active principle is adsorbed or attached. (Petros and DeSimone 2010).
Nanoparticle drug delivery systems (NDDS) have been on the market for about 20 years, and there
are many different types (Grazú et al. 2012). In the US, there are at least 15 pharmaceuticals using
nanotechnology that have been approved since 1990 (Bamrungsap et al. 2012). Nanoparticles can
resemble macromolecular compounds like large proteins in size, and can use cellular mechanisms
intended for these compounds to move around the body. A variety of nanoparticles can be
engineered, depending on the desired properties of the finished NDDS. Some important effects of
nanoparticle engineering can be increased bioavailability, stability and solubility, improved
pharmacokinetics, increased circulation life, reduced toxicity and decreased adverse effects
(Bamrungsap et al. 2012, Lee et al. 2015).
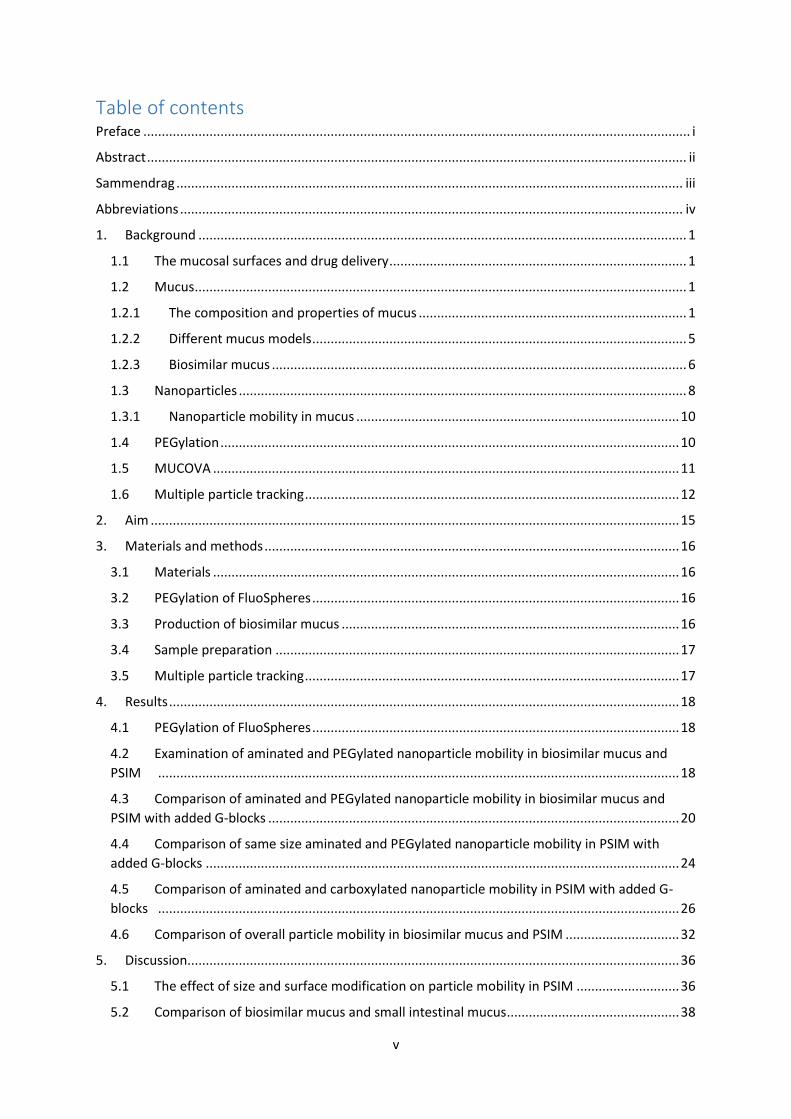
Drugs can be encapsulated in, dispersed in, adsorbed or conjugated to nanoparticles. Liposomes or
polymers filled with, or bonded to the desired drug are some examples. See Figure 1.3.1 for an
overview of different types of nanoparticles for drug delivery. NDDS can be modified to affect
solubility, stability, permeability, or other properties, leading to improved bioavailability and an
enhanced, controlled or more rapid therapeutic effect. The modification can for example be done
with coatings or attachment of ligands. Attachment of ligands like antibodies or use of magnets can
be methods of targeting drug delivery to specific sites (Bamrungsap et al. 2012).

9
Figure 1.3.1: An overview of some of the different types of nanoparticles for drug delivery. Included in
the figure are nanocrystals, liposomes, polymeric micelles, protein-based nanoparticles, dendrimers,
carbon nanotubes and polymer–drug conjugates (Bamrungsap et al. 2012).
NDDS are especially interesting for the formulation and delivery of biologicals/biopharmaceuticals,
which are macromolecular drugs like proteins, nucleic acids or other polymers. The pharmaceutical
industry has seen a shift from traditional small molecule drugs towards the development of
biologicals for a range of diseases in the last decades, for example in cancer treatment. However,
biologicals often have problems with stability and circulation life in the body, since they are easily
broken down and metabolised. This is particularly relevant for oral administration, which is often
desired for convenience, but which poses many challenges in the form of a harsh environment and
extensive metabolism. As mentioned, NDDS can be used for example to increase the stability or
circulation life of biologicals in the body, or target them to a specific organ or cell type. Using
nanotechnology in targeting drugs for cancer treatment has been especially focused on (Lee et al.
2015). By encapsulating the biopharmaceutical in a NDDS it could be protected from degradation
and ideally pass through the GI tract unharmed (Wong 2010, Ensign et al. 2012).
10
The targeting of the drugs to their site of action and the increased bioavailability can open up
possibilities for administering lower doses of drugs at a time because of decreased loss of drugs and
increased efficiency (Bamrungsap et al. 2012). Lower doses of drugs are generally desired because of
decreased costs and reduced side effects (Orive et al. 2004, Laroui et al. 2012). Cost-effectivity is
particularly applicable in the case of biologicals because these are generally more expensive to
produce than traditional small molecule drugs.
1.3.1 Nanoparticle mobility in mucus As explained, nanoparticle drug delivery systems can be modified to enhance their properties in
order to deliver drugs like biopharmaceuticals to the body. However, with oral administration, the
nanoparticle would still need to pass through the mucus layer of the small intestine in order to enter
the circulation and get the biological to its site of action (assuming the site of action is not the GI
tract itself). If the nanoparticle fails to interact with the mucus layer at all, it would travel through
the intestine and be removed from the body in the faeces. This is often the fate of orally
administered nanoparticles (Lai et al. 2009a). Alternatively, the nanoparticle could interact with the
mucus layer and become trapped, followed by removal from the body as the mucus layer is
constantly shed and replenished. Only penetration and diffusion through the mucus layer will enable
the nanoparticle to enter the body (Florence 1997, Ponchel and Irache 1998). Engineering
nanoparticles specifically to be able to diffuse quickly through the mucus layer is therefore a highly
relevant subject (Ensign et al. 2012). Important properties that will influence the mobility of
nanoparticles in mucus are the size and surface modification (electric charges, hydrophilic or
hydrophobic surfaces), and eventual ligands (Norris and Sinko 1997).
Because of the composition and structure of mucus and especially the mucins, the mucus layer is
well adapted to trap particles with varying surfaces (Cu and Saltzman 2009). Nanoparticles with
positive charges are likely to be attracted to the negatively charged groups in the oligosaccharide
side chains of the mucins, for example the carboxylate and sulphate groups. Negatively charged
particles would interact with positively charged parts of the mucins, for example amino acid residues
carrying a positive charge. Nanoparticles with surfaces containing hydrogen atoms bound to an
electronegative atom (O, N) could interact with nearby molecules through hydrogen bonding.
Nanoparticles with hydrophobic surfaces would be attracted to the naked and hydrophobic parts of
the mucin molecules.
Nanoparticles of larger size will have the ability to carry more drug molecules, and often show a
more suitable drug-release kinetic profile where the drug is released over a longer time scale
compared to smaller drug-carrying nanoparticles. However, large nanoparticles risk becoming
trapped in the mucus layer because of the pore size formed by the interacting mucin molecules.
Thus, even a nanoparticle engineered to have a surface chemistry that allows it to avoid
mucoadhesion in order to achieve rapid diffusion through mucus, could be hindered and expelled
from the body because of an overly large size (Lai et al. 2009a).
1.4 PEGylation PEGylation is the technique of covalently attaching polyethylene glycol (PEG), a hydrophilic polymer,
to the surface of another molecule or particle with the intention of changing its physical and/or
chemical properties. PEGylation is especially attractive to pharmaceutical companies, and it is used
as a method in drug delivery, especially with large hydrophobic molecules. The outcome of
PEGylation can vary with the original molecule, the method used, and the density and length of the
PEG molecules. The results can be, among others, increased water solubility, increased stability,
increased circulation time and prolonged lifetime in the body (McDonnell et al. 2013, Lee et al.
2015). PEGylation can also change or mask the charge or hydrophobic sites of the original substance,
11
since PEG is a neutral and hydrophilic polymer. However, PEGylation of a drug-carrying nanoparticle
can mask eventual targeting peptides on the nanoparticle’s surface, meant to interact for example
with ligands on the cell membrane of the target cell, and this could cause a reduced uptake to the
cell and therefore a reduced efficiency of the therapy. Likewise, PEGylation can also cause reduced
biological activity of the drug, since it cannot easily interact with other molecules. An example could
be a PEGylated drug whose mechanism of action involves an enzymatic reaction, but the coating
with PEG hinders the drug from interacting with the enzyme. Heterogeneity is also a problem
because a drug treated with PEGylation can have a number of different binding sites for PEG, and
the result is a mixture of heterogeneous PEGylated substances that will behave dissimilarly
(McDonnell et al. 2013). Other drawbacks that have been proposed and discussed are the
immunogenicity of PEG, hypersensitivity to PEG in patients and possible formation of anti-PEG
antibodies. Zhang et al. highlights the need for further research and more data to expand the
knowledge of possible negative effects of the increasing use of PEGylation in the pharmaceutical
industry (Zhang et al. 2014).
PEGylation of nanoparticles has been proposed as a method of avoiding mucus entrapment, and
may also cause the nanoparticles to be more stable in mucus. Lai et al. found that covering
nanoparticles of varying size with a PEG resulted in an increase of mobility in undiluted mucus (Lai et
al. 2009a). They also studied the effects of variations in the coating density of nanoparticles and
different molecular weight of the PEG molecules. They found that a high-density coverage of low
molecular weight PEG (2-5 kDa) was optimal for the transport of the PEGylated particles through
mucus. A lower density coverage with PEG led to a dramatic decrease in mobility compared with
particles with a high-density coverage, and the same result was found for well-coated particles with
10 kDa PEG molecules (Lai et al. 2009a). Another study found that particles with a neutral charge,
like PEG, had higher mobility than charged particles in CF sputum (Dawson et al. 2003). Some
microorganisms have evolved to present an overall neutral but highly hydrophilic surface by coating
themselves with proteins, and this reduces their interaction with the components of mucus and
increases their permeability and mobility in mucus (Cone 1999).
Stability is particularly an issue for drug delivery in the GI tract, with its the harsh environment and
varying pH. Liposomes have been demonstrated to be unstable in the GI tract (Chia-Ming and
Weiner 1987, Rowland and Woodley 1980). Studies with PEGylation of lipoplexes (liposomes
carrying DNA) have found that the PEGylated lipoplexes did not have interactions with mucus
components, and that they had increased gene transfection activity compared to the untreated
lipoplexes (Sanders et al. 2002, Sanders et al. 2003). Yoncheva et al. showed that PEGylation of
polylactide nanoparticles increased their stability in gastric fluid (Yoncheva et al. 2005).
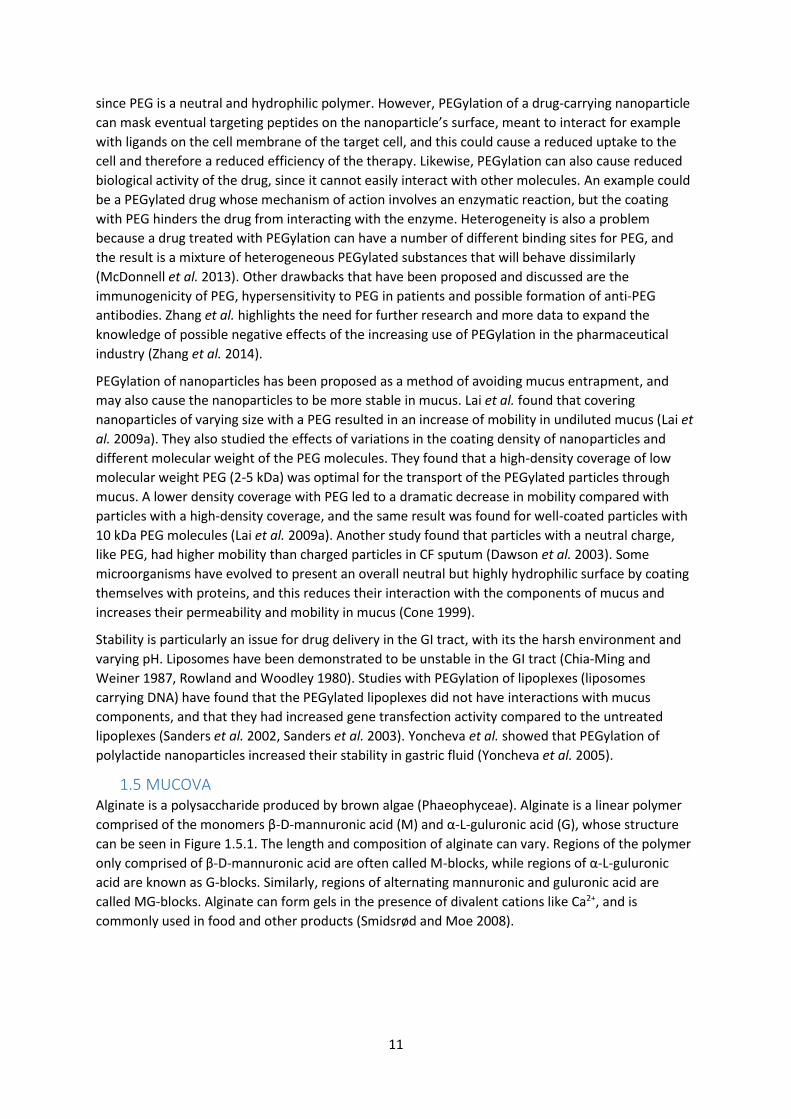
1.5 MUCOVA Alginate is a polysaccharide produced by brown algae (Phaeophyceae). Alginate is a linear polymer
comprised of the monomers β-D-mannuronic acid (M) and α-L-guluronic acid (G), whose structure
can be seen in Figure 1.5.1. The length and composition of alginate can vary. Regions of the polymer
only comprised of β-D-mannuronic acid are often called M-blocks, while regions of α-L-guluronic
acid are known as G-blocks. Similarly, regions of alternating mannuronic and guluronic acid are
called MG-blocks. Alginate can form gels in the presence of divalent cations like Ca2+, and is
commonly used in food and other products (Smidsrød and Moe 2008).
12
Figure 1.5.1: The structure of alginate. A: alginate monomers, β-D-mannuronate and α-L-guluronate,
often abbreviated to M and G, respectively. B: chain conformation. C: block distribution, with M-
blocks, G-blocks and MG-blocks (Draget and Taylor 2011).
MUCOVA is a G-block technology for mucosal drug delivery for large molecules and delivery vehicles,
developed by Nordgård and Draget. MUCOVA consists of G-blocks, which are short oligomers of L-
guluronic acid. The G-blocks do not alter the nanoparticle. Instead, they transiently modify the
mucus barrier by decreasing the interactions between the mucins within the mucus network,
causing an expansion of the pore size.
There are in vitro and ex vivo data demonstrating that G-blocks improve nanoparticle mobility in
mucus and cellular uptake of nanoparticles (Nordgård et al. 2014). Adding low molecular weight G-
blocks to porcine gastric mucin gels, PSIM and human cystic fibrosis sputum has been shown to
weaken the structure of the mucus (Draget 2011, Draget and Taylor 2011, Nordgård and Draget
2011, Nordgård et al. 2014, Taylor et al. 2007). The G-blocks are thought to interact with the mucus
through electrostatic interactions, as they have a negative charge and would be attracted to the
positively charged regions of the mucin molecules (Nordgård and Draget 2011). This could mask
these regions and hinder them from interactions with other mucus components, for example other
mucins, thus reducing the crosslinks in the mucus network.
MUCOVA is one of the contributions to the innovative medicines initiative COMPACT project
(Collaboration on the Optimization of Macromolecular Pharmaceutical Access to Cellular Targets)
which has the aim of enabling successful delivery of biopharmaceuticals and includes work packages
focused on mucosal delivery in the lung and gastrointestinal tract.
1.6 Multiple particle tracking Multiple particle tracking (MPT) is a technique using video microscopy to track the motions of
multiple individual nanoparticles over time. In this case, the videos will be obtained using confocal
laser scanning microscopy (CLSM), which is a method of acquiring images or videos of high quality.
The unique feature of CLSM compared to conventional laser microscopy is its depth selectivity, in
other words, its ability to focus the image on a certain depth in the studied sample (Pawley 2006).
CLSM is commonly used in biological application, in which case the sample or particular parts of the
sample are often fluorescent (Fellers and Davidson 2007). In this case, the sample is fluorescent
nanoparticles mixed with mucus. Fluorescent nanoparticles are excited by a light beam
corresponding to the specific wavelength absorbed by the particles. The electrons in the
13
nanoparticles absorb the light by changing conformation and entering a temporary excited state.
When the electrons fall back to their lower energy state, the excess energy is released as light with
specific wavelengths. This emission of light is detected and used to determine the position of the
particles.
In a confocal laser scanning microscope used with a fluorescent sample, an excitation laser beam
with a selected wavelength is ran through a filter and focused with a lens into a small area of the
sample. This excites the fluorescent parts of the sample, which produces fluorescent light that
passes back through the lens together with some scattered light from the laser. A filter lets the light
with fluorescent wavelength pass through, while blocking the scattered light of the original
wavelength. A pinhole aperture in front of the detector only allows the in-focus light rays from the
selected depth to pass through, and not the out-of-focus light from the other depths. This light is
then detected by a photodetection device. The detector is connected to a computer, which can be
used to visualise, process, analyse, and capture images or videos of the sample (Fellers and Davidson
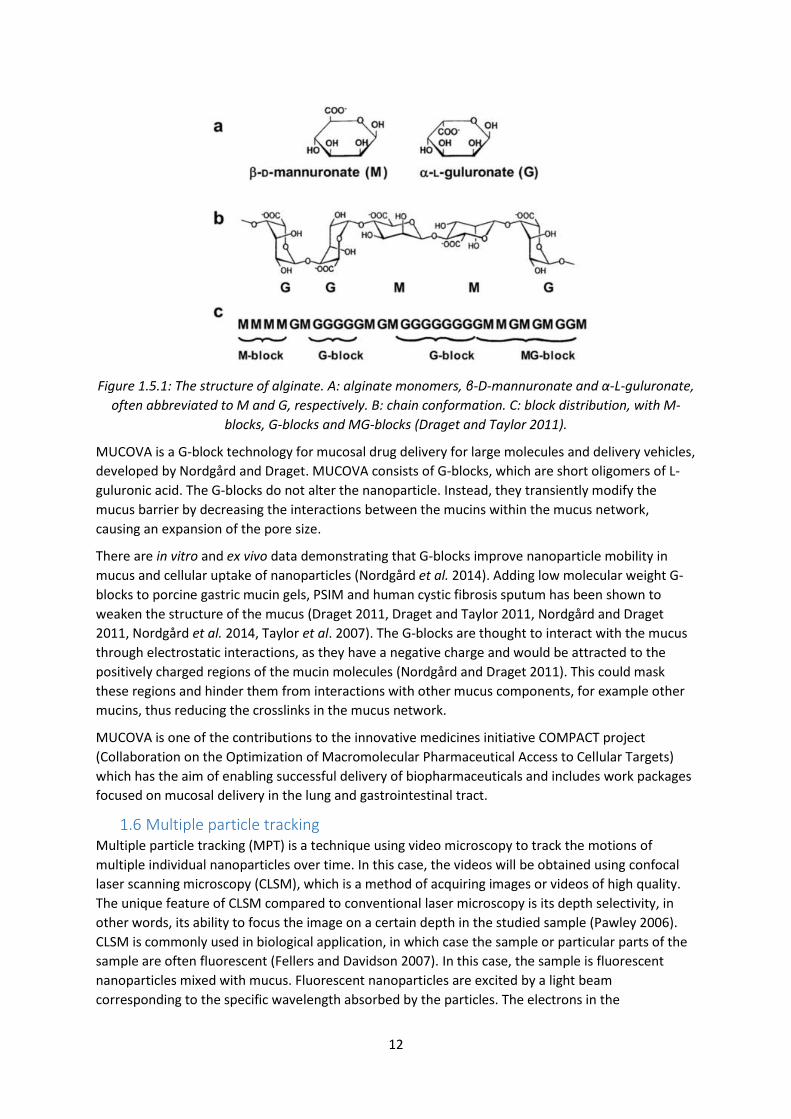
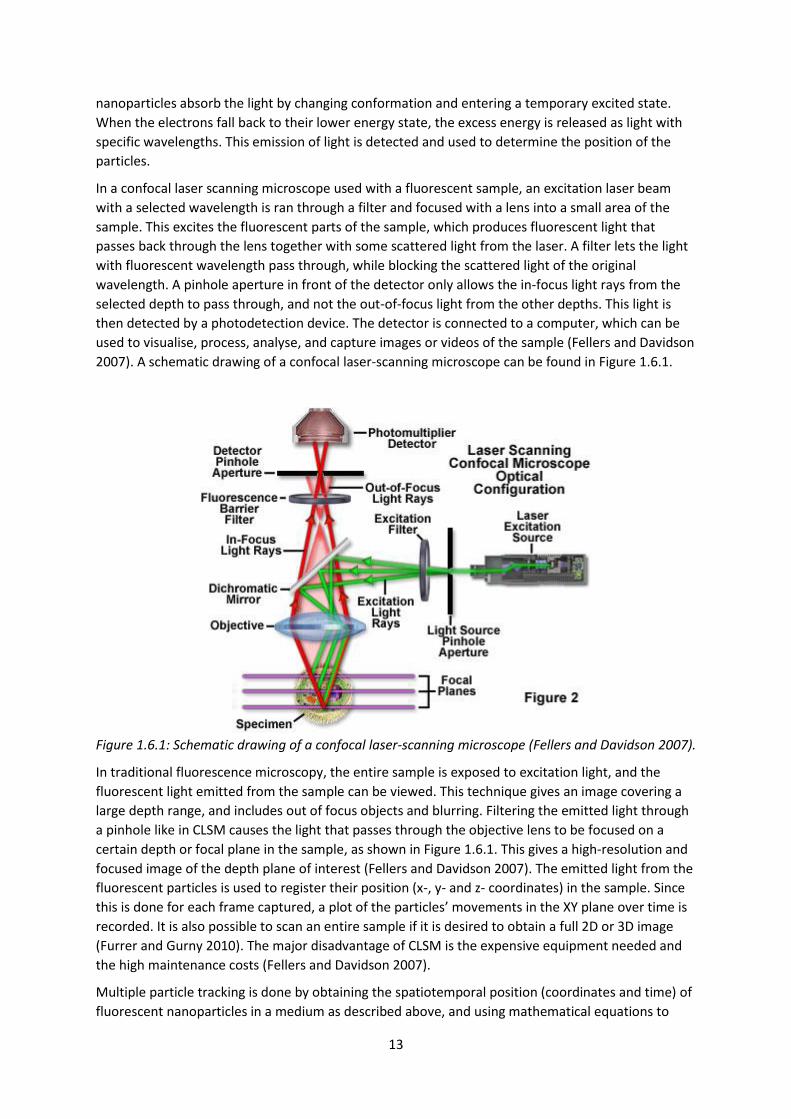
2007). A schematic drawing of a confocal laser-scanning microscope can be found in Figure 1.6.1.
Figure 1.6.1: Schematic drawing of a confocal laser-scanning microscope (Fellers and Davidson 2007).
In traditional fluorescence microscopy, the entire sample is exposed to excitation light, and the
fluorescent light emitted from the sample can be viewed. This technique gives an image covering a
large depth range, and includes out of focus objects and blurring. Filtering the emitted light through
a pinhole like in CLSM causes the light that passes through the objective lens to be focused on a
certain depth or focal plane in the sample, as shown in Figure 1.6.1. This gives a high-resolution and
focused image of the depth plane of interest (Fellers and Davidson 2007). The emitted light from the
fluorescent particles is used to register their position (x-, y- and z- coordinates) in the sample. Since
this is done for each frame captured, a plot of the particles’ movements in the XY plane over time is
recorded. It is also possible to scan an entire sample if it is desired to obtain a full 2D or 3D image
(Furrer and Gurny 2010). The major disadvantage of CLSM is the expensive equipment needed and
the high maintenance costs (Fellers and Davidson 2007).
Multiple particle tracking is done by obtaining the spatiotemporal position (coordinates and time) of
fluorescent nanoparticles in a medium as described above, and using mathematical equations to

14
convert the position data into parameters describing the mobility of the nanoparticles in the
medium. When comparing the results of unmodified and modified nanoparticles, one can
investigate whether there are significant changes to the mobility of the modified particles (Draget
and Nordgård 2014).
MPT makes use of the concept of time scale. In this case, the videos that were captured using CLSM
were 6.8 seconds long and contained 100 frames. The time between each frame would then be 68
milliseconds (ms). The first few values of time scale would be 68 ms, 136 ms, 204 ms, 272 ms and so
on. The change in nanoparticle position, or displacement values, are recorded for each time scale.
The time scale can be described as the period in which a particle is allowed to move before the
displacement from an initial point is determined. Thus, a movie of 100 frames would result in 99
displacement values. For each value of time scale, the mean-square displacement (MSD) value can
be calculated using the x and y positional data as shown in Eq. (1). MSD (τ) gives information about
the distance each particle has travelled from their initial position over time (Suh et al. 2005, Selvaggi
et al. 2010).
𝑀𝑆𝐷(𝜏) = ⟨∆𝑥2 + ∆𝑦2⟩ (1)
Δx2 and Δy2 is the difference between two consecutive sets of x and y positional data, and τ is the
time scale. While the initial MSD values at shorter time scales are calculated by taking the means of
a generally large number of displacement values, the MSD values at larger time scales are calculated
by taking the mean of fewer and fewer displacement values. The last MSD value at the longest time
scale consists of just one displacement value. Thus, the MSD values at larger time scales are less
statistically accurate (Saxton and Jacobson 1997, Suh et al. 2005).
15
2. Aim The aim of the project is to investigate whether G-blocks can improve mucomobility of PEGylated
nanoparticles. It has been shown that G-blocks improve mucomobility of nanoparticles, and that
PEGylation is effective as a method of avoiding mucus entrapment. It would be very interesting to
look into what effect the combination of these two methods could have on the mobility of
nanoparticles in mucus.

16
3. Materials and methods Multiple particle tracking (MPT) was used to track the motion of fluorescent nanoparticles of
different sizes (100 and 200 nm) and with varying surface modification (aminated, carboxylated or
PEGylated) in ex vivo porcine small intestinal mucus (PSIM) and biosimilar mucus with and without
G-blocks.
3.1 Materials 100 and 200 nm yellow-green fluorescent carboxylated and aminated nanoparticles (FluoSpheres, 2
% solids) were bought from Invitrogen (Oregon, USA). 1-ethyl-3-(3-
dimethylaminopropyl)carbodiimide hydrochloride (EDC) was obtained from Fluka. N-
hydroxysulfosuccinimide (Sulfo-NHS), L-α-phosphatidylcholine (PC), linoleic acid, cholesterol,
ethylenediaminetetraacetic acid (HEPES), polysorbate tween 80, Sigma mucin type II and bovine
albumin were obtained from Sigma-Aldrich Co. (St. Louis, USA). Polyacrylic acid (PAA) was bought
from Recklitt & Colman Products (Kingston upon Hull, UK). 2 kDa methoxy-polyethylene glycol-amine
(mPEGa) was bought from Creative PEGWorks (Chapel Hill, North Carolina, USA). CaCl2, MgSO4 and
NaCl was bought from Merck (Dermstadt, Germany). G-blocks DPn 12 was produced by acid
hydrolysis of an alginate sample as described by Reehorst (Reehorst 2014). The porcine small
intestinal mucus (PSIM) was scraped from the small intestines of recently slaughtered pigs (from
Gilde’s slaughterhouse in Steinkjer), frozen and stored in beakers at -20 °C. Lab-Tek ® Chambered
#1.0 Borosilicate Coverglass system, commonly known as 8-well plates, were bought from Thermo
Fisher Scientific Inc. (NY, USA).
3.2 PEGylation of FluoSpheres Yellow-green fluorescent carboxylated nanoparticles (FluoSpheres, 200 nm) were PEGylated with a
high density of low molecular weight PEG (2kDa) according to protocol (Suh et al. 2007), found in
Appendix A. A mixture of 2 kDa methoxy-polyethylene glycol-amine (mPEGa, 10 mg), 1-ethyl-3-(3-
dimethylaminopropyl)carbodiimide hydrochloride (EDC, 4 mg), and N-hydroxysulfosuccinimide
(Sulfo-NHS, 1.13 mg) were dissolved in HBS buffer (0.5 mL, pH 8, 10 mM HEPES, 150 mM NaCl, 3.4
mM EDTA, 0.005 m% Tween 20). FluoSpheres (0.5 mL) were added to the solution and the mixture
was left to stir at 200 rpm overnight. The PEGylated nanoparticles were then extracted by
centrifugation, and diluted with HBS buffer to a final concentration of 2 %. The bead sizes and zeta
potential of a 1:100 diluted PEGylated FluoSphere solution in HEPES buffer (pH 7.3) was measured to
assess the effectiveness of the PEGylation reaction using a Zetasizer Nano-ZS (Malvern).
3.3 Production of biosimilar mucus Biosimilar mucus was produced according to protocol (Boegh et al. 2013), found in Appendix B.
100 mL 10 mM isotonic HEPES buffer was produced containing 1.3 mM CaCl2, 1 mM MgSO4 and 137
mM NaCl. 100 mL 10 mM non-isotonic HEPES buffer was produced containing 1.3 mM CaCl2 and 1
mM MgSO4.
Lipid solution: 0.0121 g linoleic acid, 0.0396 g cholesterol and 0.033 g phosphatidylcholine (PC) was
weighed out and mixed in an Eppendorf tube. 0.03586 g polysorbate tween 80 was weighed out and
added to the tube, along with two small magnets. 750 µL of isotonic HEPES buffer (10 mM) was
added. The tube was left on vigorous magnetic stirring until the solution was homogenous.
Polymer solution: 0.09 g polyacrylic acid (PAA) was added to 9.168 mL of non-isotonic HEPES buffer
(10 mM) and stirred until dissolved. 0.5 g Sigma mucin type II was added and stirred until dissolved.
150 µL 5 mM NaOH was added and the mixture was stirred until visually homogenous.
17
0.682 mL of the homogenous lipid solution was added, and the mixture was stirred. 0.31 g bovine
albumin was added and the mixture was stirred until homogenous. The pH was adjusted from 4.1 to
7.4 with 1 M NaOH and a pH-meter. The biosimilar mucus was made in two batches, and while the
first, smaller batch was stored cold (ca 3.5 °C), the second, larger batch was frozen (-20 °C) for later
use.
3.4 Sample preparation Approximately 200 mg of the desired mucus (PSIM/biosimilar mucus) was weighed out in chambers
on an 8-well plate. The PSIM or biosimilar mucus used in preparation of one set of samples came
from the same batch. This was to minimize uncertainty caused by individual differences in mucus
composition.
FluoSpheres were added to mucus to a final concentration of nanoparticles of 0.0025 %. This was
done by diluting the desired particles (2 % solids) 1:40 in G-block solutions or physiological saline
(control). The control is added saline to balance out the ionic strength of the G-blocks. G-block
solutions were prepared with concentration 21 mg/mL, 2.1 mg/mL and 0.21 mg/mL by dissolving G-
blocks of DPn 12 in MQ water. This would give a final concentration of G-block in the prepared
mucus sample of respectively 1.0 mg/mL, 0.1 mg/mL and 0.01 mg/mL. 10 µL of the diluted particles
were added to the mucus, and stirred with a pipette tip. The 8-well plate was covered with parafilm
and lid and stored cool (3 °C) over night, and videos were acquired on Leica SP5 the following day.
3.5 Multiple particle tracking Movement of the fluorescent particles was tracked by MPT. The instrument used was a confocal
laser-scanning microscope (CLSM) Leica SP5 from Leica microsystems (Mannheim, Germany). The
settings used were 63x1.2 wet objective, Argon laser (20 %), 488 nm laser, detection 520-550 nm.
Acquisition mode xyt, with 68 ms between frames and 100 frames total per video. The Leica
instrument takes a series of 100 quick images (frames) in 6.8 seconds, forming a short video. The
videos were loaded up in the program ImageJ with the plugin SpeckleTracker. This program detects
and tracks the trajectory of the individual particles over time. The x- and y-coordinate positions of
the individual FluoSpheres were determined for each frame. The coordinate data was converted into
mean square displacement (MSD) values using Matlab. The Matlab script used was developed by
Astrid Bjørkøy at the department of physics (NTNU) and is given in Appendix D. The MSD (τ) values
were calculated as shown in Eq. (1) below.
𝑀𝑆𝐷(𝜏) = ⟨∆𝑥2 + ∆𝑦2⟩ (1)
Δx2 and Δy2 is the difference between two consecutive sets of x and y positional data, and τ is the
time scale. Graphs of MSD values with respects to time scale (τ) were drawn.
18
4. Results
4.1 PEGylation of FluoSpheres The zeta potential of a 1:100 diluted PEGylated FluoSphere solution in HEPES buffer (pH 7.3) was
measured to assess the effectiveness of the PEGylation reaction. The zeta potential was measured to
be about -10 mV, which indicates a successful reaction. Other studies have recorded similar zeta
potentials of PEGylated particles, for example Yang et al. reports a zeta potential of about −9.6 mV
(Yang et al. 2012). For comparison, the zeta potential of untreated carboxylated particles is about -
43 mV (Nordgård et al. 2014). More detailed results of zeta potential and bead size of the PEGylated
particles can be found in Appendix E.
4.2 Examination of aminated and PEGylated nanoparticle mobility in biosimilar
mucus and PSIM Movement of the fluorescent particles were tracked by MPT as previously explained. During practice
with the confocal microscope both porcine small intestinal mucus (PSIM) and biosimilar mucus were
used to prepare samples, and when the data was analysed a significant difference in particle
mobility between the two types of mucus was found. This influenced the first experiments to be
focused on doing a comparison between particle mobility in biosimilar mucus and PSIM.
The mobility of fluorescent 100 nm aminated and 200 nm PEGylated particles in both biosimilar and
PSIM were tracked, the data was analysed and graphs of mean square displacement (MSD) of the
particles with respect to the time scale were produced, and are shown below in Figure 4.2.1. These
particles were chosen for their differences in mucomobility, as 100 nm aminated particles are known
to be largely immobile and 200 nm PEGylated particles are known to be largely mobile.
19
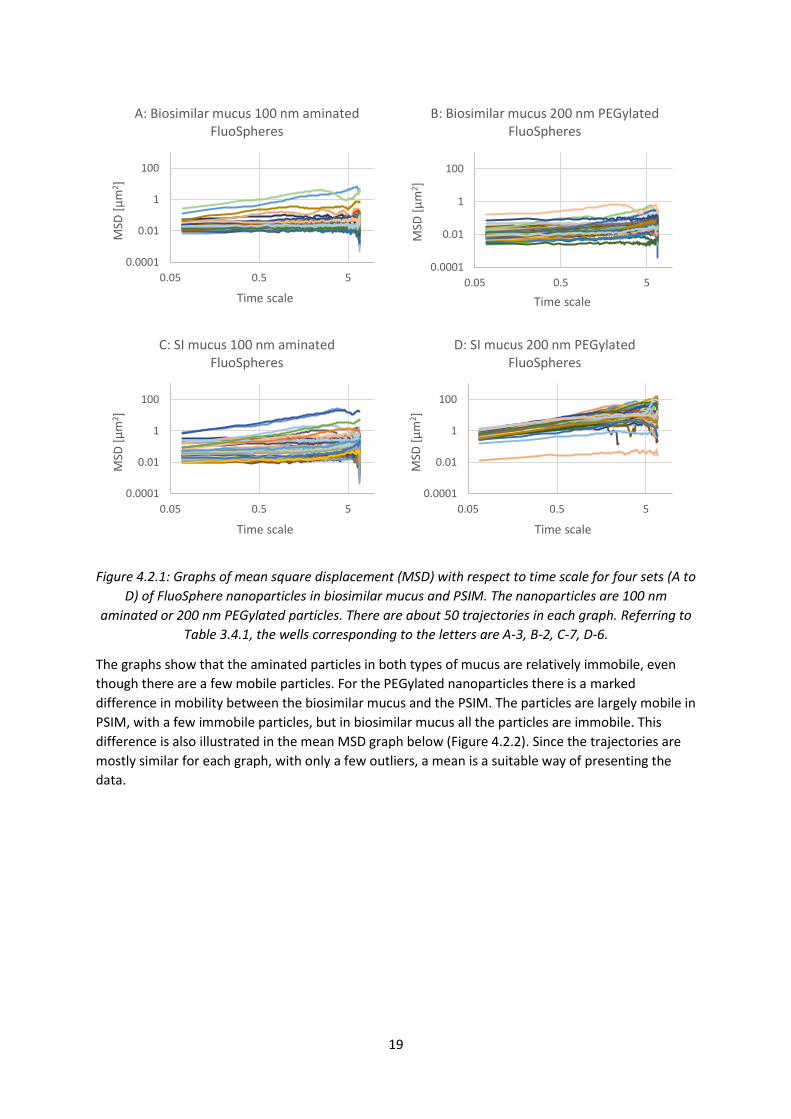
Figure 4.2.1: Graphs of mean square displacement (MSD) with respect to time scale for four sets (A to
D) of FluoSphere nanoparticles in biosimilar mucus and PSIM. The nanoparticles are 100 nm
aminated or 200 nm PEGylated particles. There are about 50 trajectories in each graph. Referring to
Table 3.4.1, the wells corresponding to the letters are A-3, B-2, C-7, D-6.
The graphs show that the aminated particles in both types of mucus are relatively immobile, even
though there are a few mobile particles. For the PEGylated nanoparticles there is a marked
difference in mobility between the biosimilar mucus and the PSIM. The particles are largely mobile in
PSIM, with a few immobile particles, but in biosimilar mucus all the particles are immobile. This
difference is also illustrated in the mean MSD graph below (Figure 4.2.2). Since the trajectories are
mostly similar for each graph, with only a few outliers, a mean is a suitable way of presenting the
data.
0.0001
0.01
1
100
0.05 0.5 5
MSD
[µ
m2 ]
Time scale
A: Biosimilar mucus 100 nm aminated FluoSpheres
0.0001
0.01
1
100
0.05 0.5 5
MSD
[µ
m2 ]
Time scale
B: Biosimilar mucus 200 nm PEGylated FluoSpheres
0.0001
0.01
1
100
0.05 0.5 5
MSD
[µ
m2]
Time scale
C: SI mucus 100 nm aminated FluoSpheres
0.0001
0.01
1
100
0.05 0.5 5
MSD
[µ
m2]
Time scale
D: SI mucus 200 nm PEGylated FluoSpheres

20
Figure 4.2.2: Graph of mean MSD values of all the trajectories for the graphs A to D in Figure 4.2.1.
The nanoparticles are 100 nm aminated or 200 nm PEGylated particles in PSIM or biosimilar mucus.
Figure 4.2.2 above highlights the differences observed between particle mobility in biosimilar mucus
and PSIM. The 100 nm aminated nanoparticles are immobile in both types of mucus. As can be seen
from the figure, the difference between the aminated particles in the two types of mucus are small,
but the difference between the PEGylated particles is large. In the biosimilar mucus the PEGylated
particles are immobile, while in the PSIM the PEGylated particles are mobile.
4.3 Comparison of aminated and PEGylated nanoparticle mobility in biosimilar
mucus and PSIM with added G-blocks The results from the first experiment caused an interest to look deeper into particle mobility in both
PSIM and biosimilar mucus, this time with the addition of G-blocks in different concentrations. The
particles used were still 100 nm aminated and 200 nm PEGylated particles. In addition, this
experiment would allow investigation of G-block effect on PEGylated particles and G-block effect in
biosimilar mucus.
0.0001
0.001
0.01
0.1
1
10
100
1000
0.05 0.5 5
MSD
[µ
m2]
Time scale
Mean MSD
Biosimilar mucus 100 nm amine
Biosimilar mucus 200 nm PEG
SI mucus 100 nm amine
SI mucus 200 nm PEG
21
0.0001
0.01
1
100
0.05 0.5 5
MSD
[µ
m2 ]
Time scale
A: Biosimilar mucus 100 nm aminated FluoSpheres control
0.0001
0.01
1
100
0.05 0.5 5
MSD
[µ
m2 ]
Time scale
B: Biosimilar mucus 200 nm PEGylated FluoSpheres control
0.0001
0.01
1
100
0.05 0.5 5
MSD
[µ
m2]
Time scale
C: Biosimilar mucus 100 nm aminated FluoSpheres 0.01 mg/mL G-block
0.0001
0.01
1
100
0.05 0.5 5
MSD
[µ
m2]
Time scale
D: Biosimilar mucus 200 nm PEGylated FluoSpheres 0.01 mg/mL Gblock
0.0001
0.01
1
100
0.05 0.5 5
MSD
[µ
m2]
Time scale
E: Biosimilar mucus 100 nm aminated FluoSpheres 0.1 mg/mL G-block
0.0001
0.01
1
100
0.05 0.5 5
MSD
[µ
m2]
Time scale
F: Biosimilar mucus 200 nm PEGylated FluoSpheres 0.1 mg/mL Gblock
0.0001
0.01
1
100
0.05 0.5 5
MSD
[µ
m2]
Time scale
G: Biosimilar mucus 100 nm aminated FluoSpheres 1.0 mg/mL G-block
0.0001
0.01
1
100
0.05 0.5 5
MSD
[µ
m2]
Time scale
H: Biosimilar mucus 200 nm PEGylated FluoSpheres 1.0 mg/mL Gblock
22
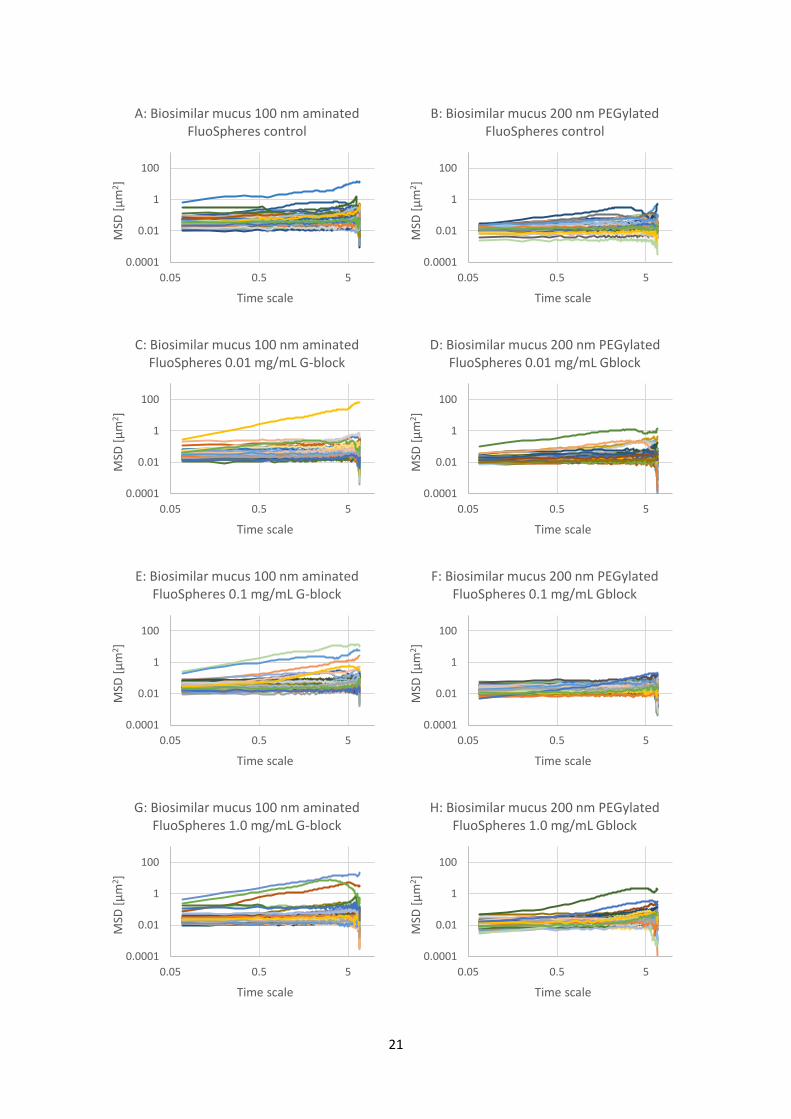
Figure 4.3.1: Graphs of mean square displacement (MSD) with respect to time scale for eight sets (A
to H) of FluoSphere nanoparticles in biosimilar mucus. The nanoparticles are 100 nm aminated or 200
nm PEGylated particles with added G-block in three different concentrations (0.01, 0.1 and 1.0
mg/mL) and a control with physiological saline. There are about 60 trajectories in each graph.
Referring to Table 3.4.1, the wells corresponding to the letters are A-8, B-4, C-7, D-3, E-6, F-2, G-5, H-
1.
The results from the experiment with the biosimilar mucus is shown in Figure 4.3.1. The results show
that all the particles, regardless of surface modification or addition of G-blocks, are largely immobile.
There are a few exceptions, especially with the 100 nm aminated particles, where a few of the sixty
measured particles are more mobile than the rest. An overview of the data is shown in Figure 4.3.2,
with mean MSD trajectories for each graph from Figure 4.3.1. As mentioned earlier, since almost all
the trajectories are in the same area for each graph, a mean is a suitable way of presenting the data.
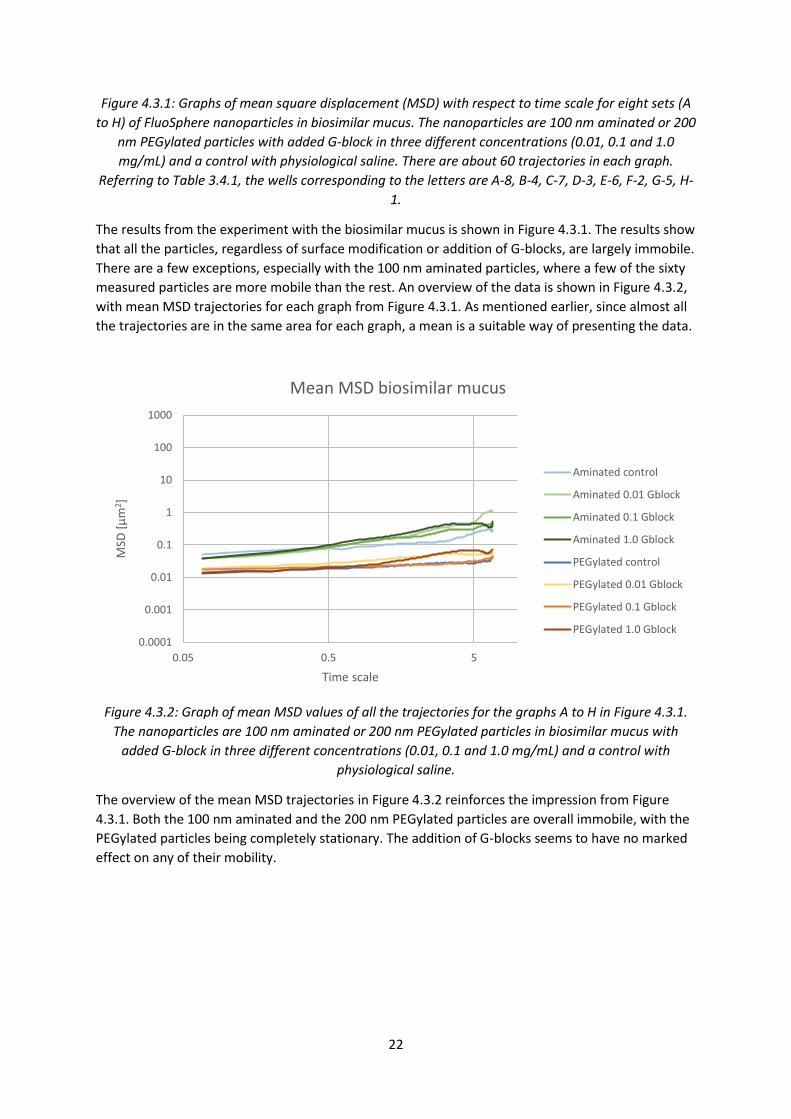
Figure 4.3.2: Graph of mean MSD values of all the trajectories for the graphs A to H in Figure 4.3.1.
The nanoparticles are 100 nm aminated or 200 nm PEGylated particles in biosimilar mucus with
added G-block in three different concentrations (0.01, 0.1 and 1.0 mg/mL) and a control with
physiological saline.
The overview of the mean MSD trajectories in Figure 4.3.2 reinforces the impression from Figure
4.3.1. Both the 100 nm aminated and the 200 nm PEGylated particles are overall immobile, with the
PEGylated particles being completely stationary. The addition of G-blocks seems to have no marked
effect on any of their mobility.
0.0001
0.001
0.01
0.1
1
10
100
1000
0.05 0.5 5
MSD
[µ
m2 ]
Time scale
Mean MSD biosimilar mucus
Aminated control
Aminated 0.01 Gblock
Aminated 0.1 Gblock
Aminated 1.0 Gblock
PEGylated control
PEGylated 0.01 Gblock
PEGylated 0.1 Gblock
PEGylated 1.0 Gblock
23
0.0001
0.01
1
100
0.05 0.5 5
MSD
[µ
m2 ]
Time scale
A: SI mucus 100 nm aminated FluoSpheres control
0.0001
0.01
1
100
0.05 0.5 5
MSD
[µ
m2 ]
Time scale
B: SI mucus 200 nm PEGylated FluoSpheres control
0.0001
0.01
1
100
0.05 0.5 5
MSD
[µ
m2]
Time scale
C: SI mucus 100 nm aminated FluoSpheres 0.01 mg/mL Gblock
0.0001
0.01
1
100
0.05 0.5 5
MSD
[µ
m2]
Time scale
D: SI mucus 200 nm PEGylated FluoSpheres 0.01 mg/mL Gblock
0.0001
0.01
1
100
0.05 0.5 5
MSD
[µ
m2]
Time scale
E: SI mucus 100 nm aminated FluoSpheres 0.1 mg/mL Gblock
0.0001
0.01
1
100
0.05 0.5 5
MSD
[µ
m2]
Time scale
F: SI mucus 200 nm PEGylated FluoSpheres 0.1 mg/mL Gblock
0.0001
0.01
1
100
0.05 0.5 5
MSD
[µ
m2]
Time scale
G: SI mucus 100 nm aminated FluoSpheres 1.0 mg/mL Gblock
0.0001
0.01
1
100
0.05 0.5 5
MSD
[µ
m2]
Time scale
H: SI mucus 200 nm PEGylated FluoSpheres 1.0 mg/mL Gblock
24
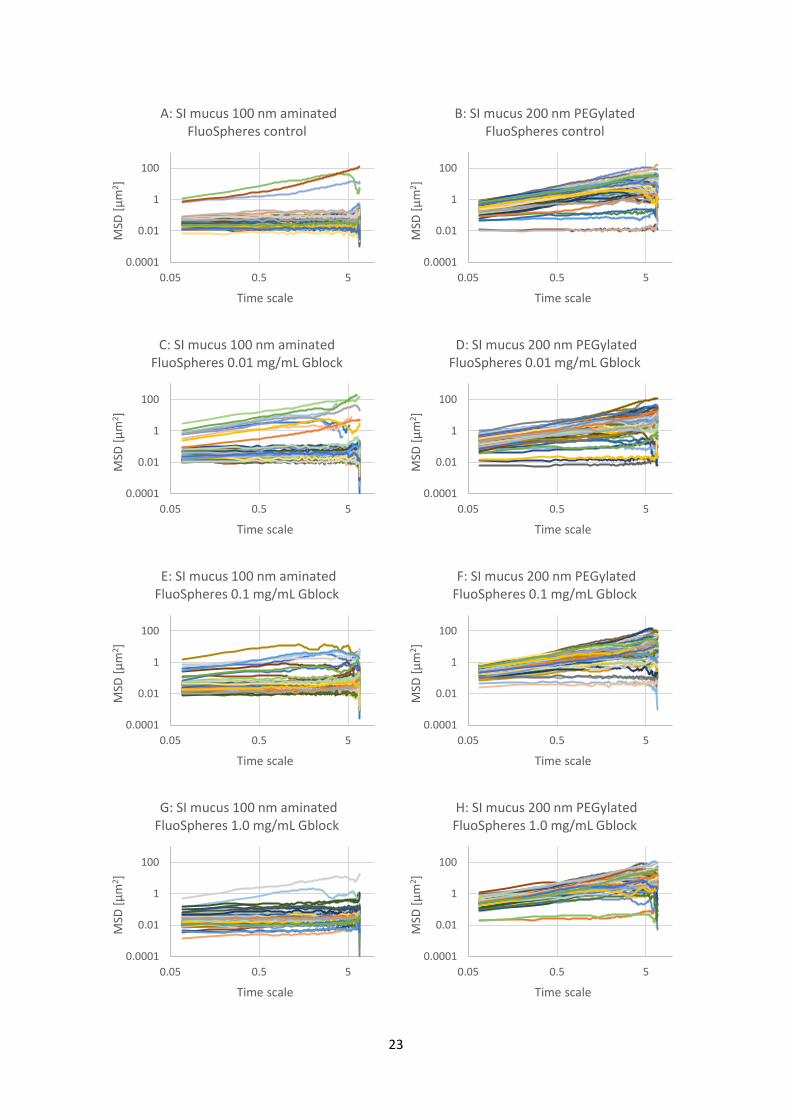
Figure 4.3.3: Graphs of mean square displacement (MSD) with respect to time scale for eight sets (A
to H) of FluoSphere nanoparticles in PSIM. The nanoparticles are 100 nm aminated or 200 nm
PEGylated particles with added G-block in three different concentrations (0.01, 0.1 and 1.0 mg/mL)
and a control with physiological saline. There are about 60 trajectories in each graph. Referring to
Table 3.4.1, and the wells corresponding to the letters are A-8, B-4, C-7, D-3, E-6, F-2, G-5, H-1.
The results from the experiment with the PSIM are shown in Figure 4.3.3. The results show that the
100 nm aminated particles are largely immobile, with a varying but relatively small fraction of mobile
particles. The opposite is true for the 200 nm PEGylated particles, where the particles are mainly
mobile with a few immobile exceptions. An overview of the data is shown in Figure 4.3.4, with mean
MSD trajectories for each graph from Figure 4.3.3.
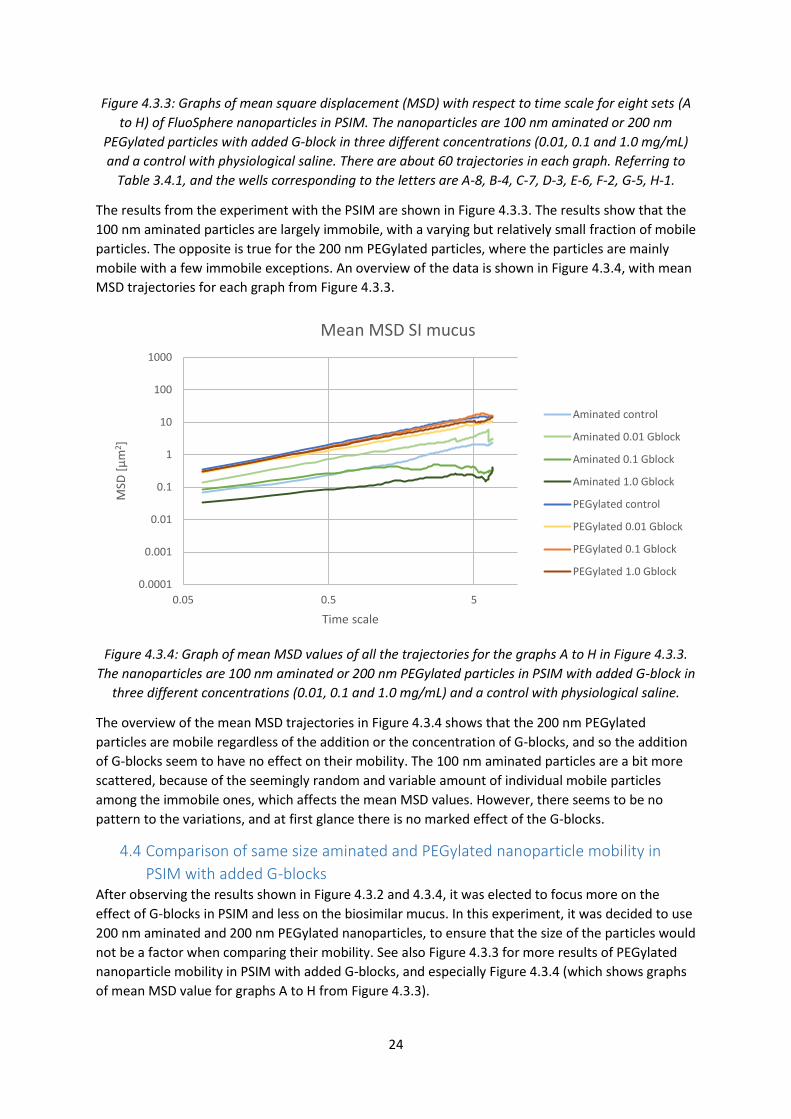
Figure 4.3.4: Graph of mean MSD values of all the trajectories for the graphs A to H in Figure 4.3.3.
The nanoparticles are 100 nm aminated or 200 nm PEGylated particles in PSIM with added G-block in
three different concentrations (0.01, 0.1 and 1.0 mg/mL) and a control with physiological saline.
The overview of the mean MSD trajectories in Figure 4.3.4 shows that the 200 nm PEGylated
particles are mobile regardless of the addition or the concentration of G-blocks, and so the addition
of G-blocks seem to have no effect on their mobility. The 100 nm aminated particles are a bit more
scattered, because of the seemingly random and variable amount of individual mobile particles
among the immobile ones, which affects the mean MSD values. However, there seems to be no
pattern to the variations, and at first glance there is no marked effect of the G-blocks.
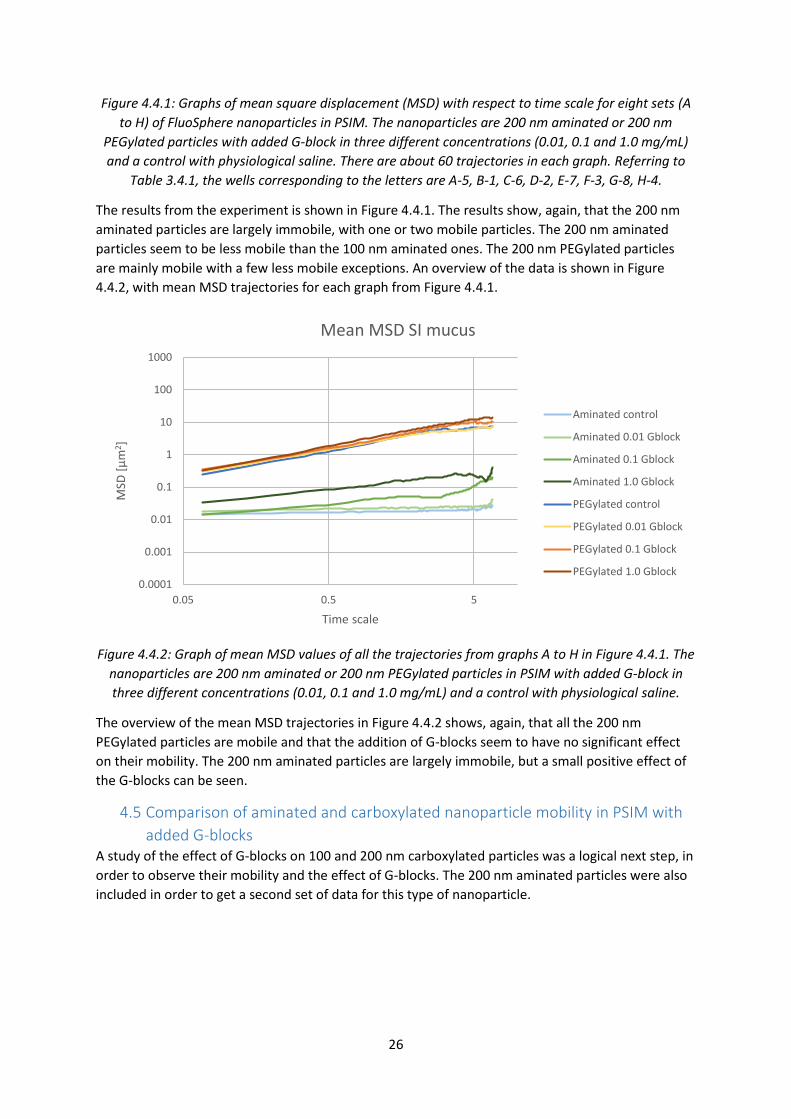
4.4 Comparison of same size aminated and PEGylated nanoparticle mobility in
PSIM with added G-blocks After observing the results shown in Figure 4.3.2 and 4.3.4, it was elected to focus more on the
effect of G-blocks in PSIM and less on the biosimilar mucus. In this experiment, it was decided to use
200 nm aminated and 200 nm PEGylated nanoparticles, to ensure that the size of the particles would
not be a factor when comparing their mobility. See also Figure 4.3.3 for more results of PEGylated
nanoparticle mobility in PSIM with added G-blocks, and especially Figure 4.3.4 (which shows graphs
of mean MSD value for graphs A to H from Figure 4.3.3).
0.0001
0.001
0.01
0.1
1
10
100
1000
0.05 0.5 5
MSD
[µ
m2]
Time scale
Mean MSD SI mucus
Aminated control
Aminated 0.01 Gblock
Aminated 0.1 Gblock
Aminated 1.0 Gblock
PEGylated control
PEGylated 0.01 Gblock
PEGylated 0.1 Gblock
PEGylated 1.0 Gblock
25
0.0001
0.01
1
100
0.05 0.5 5
MSD
[µ
m2 ]
Time scale
A: SI mucus 200 nm aminated FluoSpheres control
0.0001
0.01
1
100
0.05 0.5 5
MSD
[µ
m2 ]
Time scale
B: SI mucus 200 nm PEGylated FluoSpheres control
0.0001
0.01
1
100
0.05 0.5 5
MSD
[µ
m2]
Time scale
C: SI mucus 200 nm aminated FluoSpheres 0.01 mg/mL Gblock
0.0001
0.01
1
100
0.05 0.5 5
MSD
[µ
m2]
Time scale
D: SI mucus 200 nm PEGylated FluoSpheres 0.01 mg/mL Gblock
0.0001
0.01
1
100
0.05 0.5 5
MSD
[µ
m2]
Time scale
E: SI mucus 200 nm aminated FluoSpheres 0.1 mg/mL Gblock
0.0001
0.01
1
100
0.05 0.5 5
MSD
[µ
m2]
Time scale
F: SI mucus 200 nm PEGylated FluoSpheres 0.1 mg/mL Gblock
0.0001
0.01
1
100
0.05 0.5 5
MSD
[µ
m2]
Time scale
G: SI mucus 200 nm aminated FluoSpheres 1.0 mg/mL Gblock
0.0001
0.01
1
100
0.05 0.5 5
MSD
[µ
m2]
Time scale
H: SI mucus 200 nm PEGylated FluoSpheres 1.0 mg/mL Gblock
26
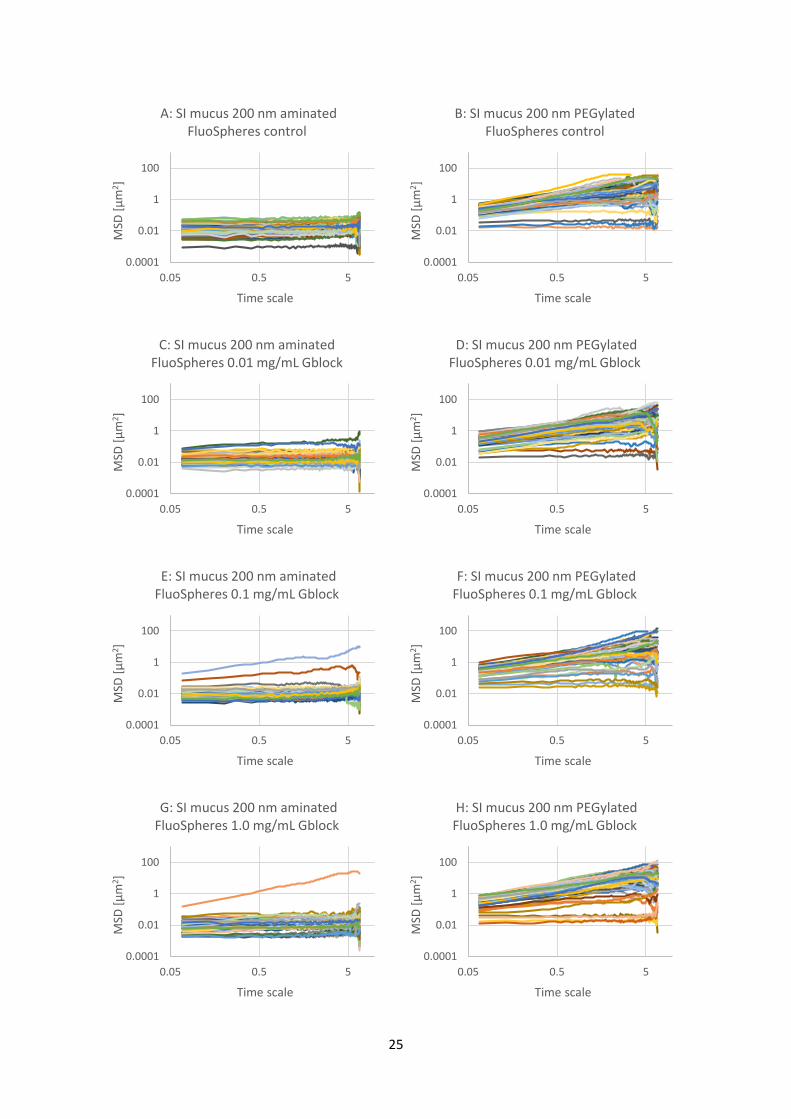
Figure 4.4.1: Graphs of mean square displacement (MSD) with respect to time scale for eight sets (A
to H) of FluoSphere nanoparticles in PSIM. The nanoparticles are 200 nm aminated or 200 nm
PEGylated particles with added G-block in three different concentrations (0.01, 0.1 and 1.0 mg/mL)
and a control with physiological saline. There are about 60 trajectories in each graph. Referring to
Table 3.4.1, the wells corresponding to the letters are A-5, B-1, C-6, D-2, E-7, F-3, G-8, H-4.
The results from the experiment is shown in Figure 4.4.1. The results show, again, that the 200 nm
aminated particles are largely immobile, with one or two mobile particles. The 200 nm aminated
particles seem to be less mobile than the 100 nm aminated ones. The 200 nm PEGylated particles
are mainly mobile with a few less mobile exceptions. An overview of the data is shown in Figure
4.4.2, with mean MSD trajectories for each graph from Figure 4.4.1.
Figure 4.4.2: Graph of mean MSD values of all the trajectories from graphs A to H in Figure 4.4.1. The
nanoparticles are 200 nm aminated or 200 nm PEGylated particles in PSIM with added G-block in
three different concentrations (0.01, 0.1 and 1.0 mg/mL) and a control with physiological saline.
The overview of the mean MSD trajectories in Figure 4.4.2 shows, again, that all the 200 nm
PEGylated particles are mobile and that the addition of G-blocks seem to have no significant effect
on their mobility. The 200 nm aminated particles are largely immobile, but a small positive effect of
the G-blocks can be seen.
4.5 Comparison of aminated and carboxylated nanoparticle mobility in PSIM with
added G-blocks A study of the effect of G-blocks on 100 and 200 nm carboxylated particles was a logical next step, in
order to observe their mobility and the effect of G-blocks. The 200 nm aminated particles were also
included in order to get a second set of data for this type of nanoparticle.
0.0001
0.001
0.01
0.1
1
10
100
1000
0.05 0.5 5
MSD
[µ
m2]
Time scale
Mean MSD SI mucus
Aminated control
Aminated 0.01 Gblock
Aminated 0.1 Gblock
Aminated 1.0 Gblock
PEGylated control
PEGylated 0.01 Gblock
PEGylated 0.1 Gblock
PEGylated 1.0 Gblock
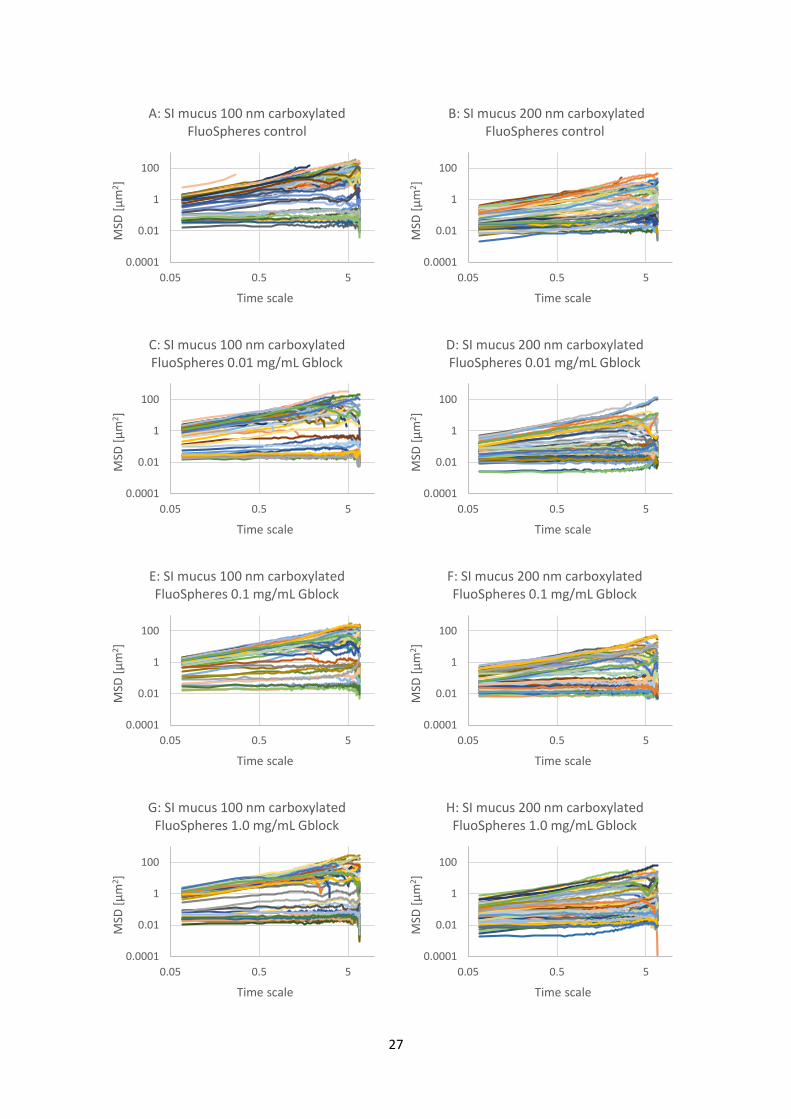
27
0.0001
0.01
1
100
0.05 0.5 5
MSD
[µ
m2 ]
Time scale
A: SI mucus 100 nm carboxylated FluoSpheres control
0.0001
0.01
1
100
0.05 0.5 5
MSD
[µ
m2 ]
Time scale
B: SI mucus 200 nm carboxylated FluoSpheres control
0.0001
0.01
1
100
0.05 0.5 5
MSD
[µ
m2]
Time scale
C: SI mucus 100 nm carboxylated FluoSpheres 0.01 mg/mL Gblock
0.0001
0.01
1
100
0.05 0.5 5
MSD
[µ
m2]
Time scale
D: SI mucus 200 nm carboxylated FluoSpheres 0.01 mg/mL Gblock
0.0001
0.01
1
100
0.05 0.5 5
MSD
[µ
m2]
Time scale
E: SI mucus 100 nm carboxylated FluoSpheres 0.1 mg/mL Gblock
0.0001
0.01
1
100
0.05 0.5 5
MSD
[µ
m2]
Time scale
F: SI mucus 200 nm carboxylated FluoSpheres 0.1 mg/mL Gblock
0.0001
0.01
1
100
0.05 0.5 5
MSD
[µ
m2]
Time scale
G: SI mucus 100 nm carboxylated FluoSpheres 1.0 mg/mL Gblock
0.0001
0.01
1
100
0.05 0.5 5
MSD
[µ
m2]
Time scale
H: SI mucus 200 nm carboxylated FluoSpheres 1.0 mg/mL Gblock
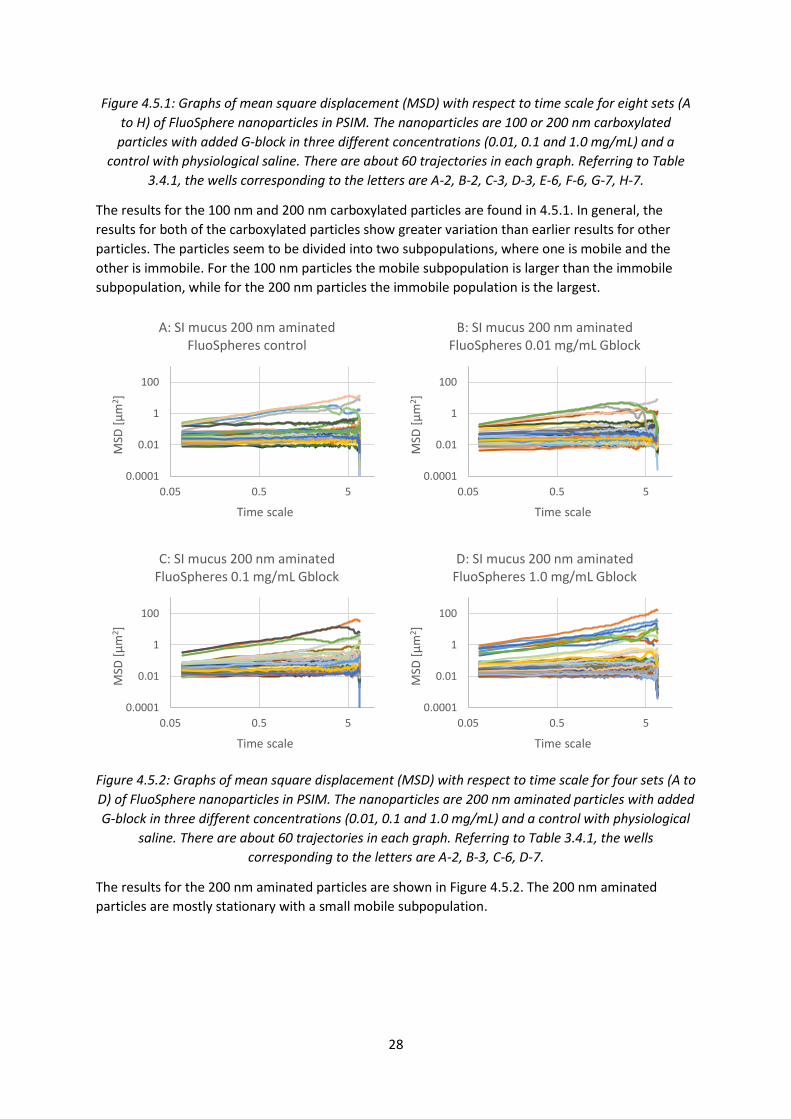
28
Figure 4.5.1: Graphs of mean square displacement (MSD) with respect to time scale for eight sets (A
to H) of FluoSphere nanoparticles in PSIM. The nanoparticles are 100 or 200 nm carboxylated
particles with added G-block in three different concentrations (0.01, 0.1 and 1.0 mg/mL) and a
control with physiological saline. There are about 60 trajectories in each graph. Referring to Table
3.4.1, the wells corresponding to the letters are A-2, B-2, C-3, D-3, E-6, F-6, G-7, H-7.
The results for the 100 nm and 200 nm carboxylated particles are found in 4.5.1. In general, the
results for both of the carboxylated particles show greater variation than earlier results for other
particles. The particles seem to be divided into two subpopulations, where one is mobile and the
other is immobile. For the 100 nm particles the mobile subpopulation is larger than the immobile
subpopulation, while for the 200 nm particles the immobile population is the largest.
Figure 4.5.2: Graphs of mean square displacement (MSD) with respect to time scale for four sets (A to
D) of FluoSphere nanoparticles in PSIM. The nanoparticles are 200 nm aminated particles with added
G-block in three different concentrations (0.01, 0.1 and 1.0 mg/mL) and a control with physiological
saline. There are about 60 trajectories in each graph. Referring to Table 3.4.1, the wells
corresponding to the letters are A-2, B-3, C-6, D-7.
The results for the 200 nm aminated particles are shown in Figure 4.5.2. The 200 nm aminated
particles are mostly stationary with a small mobile subpopulation.
0.0001
0.01
1
100
0.05 0.5 5
MSD
[µ
m2 ]
Time scale
A: SI mucus 200 nm aminated FluoSpheres control
0.0001
0.01
1
100
0.05 0.5 5
MSD
[µ
m2 ]
Time scale
B: SI mucus 200 nm aminated FluoSpheres 0.01 mg/mL Gblock
0.0001
0.01
1
100
0.05 0.5 5
MSD
[µ
m2]
Time scale
C: SI mucus 200 nm aminated FluoSpheres 0.1 mg/mL Gblock
0.0001
0.01
1
100
0.05 0.5 5
MSD
[µ
m2]
Time scale
D: SI mucus 200 nm aminated FluoSpheres 1.0 mg/mL Gblock
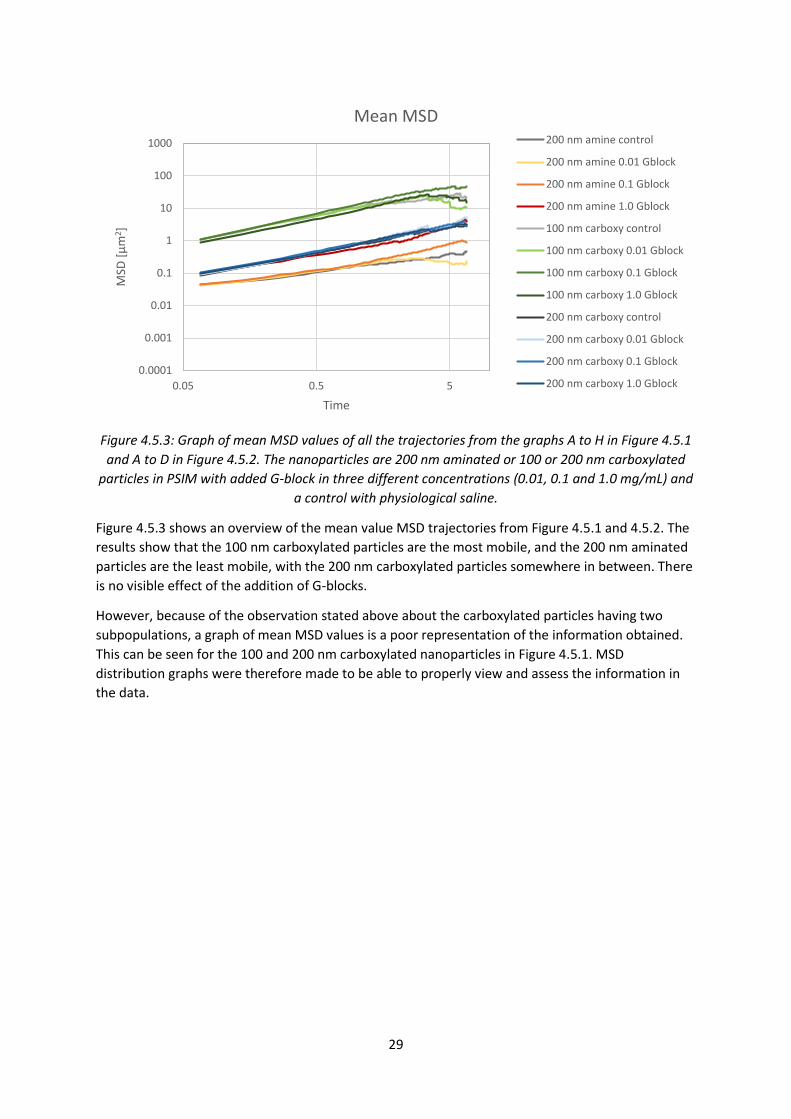
29
Figure 4.5.3: Graph of mean MSD values of all the trajectories from the graphs A to H in Figure 4.5.1
and A to D in Figure 4.5.2. The nanoparticles are 200 nm aminated or 100 or 200 nm carboxylated
particles in PSIM with added G-block in three different concentrations (0.01, 0.1 and 1.0 mg/mL) and
a control with physiological saline.
Figure 4.5.3 shows an overview of the mean value MSD trajectories from Figure 4.5.1 and 4.5.2. The
results show that the 100 nm carboxylated particles are the most mobile, and the 200 nm aminated
particles are the least mobile, with the 200 nm carboxylated particles somewhere in between. There
is no visible effect of the addition of G-blocks.
However, because of the observation stated above about the carboxylated particles having two
subpopulations, a graph of mean MSD values is a poor representation of the information obtained.
This can be seen for the 100 and 200 nm carboxylated nanoparticles in Figure 4.5.1. MSD
distribution graphs were therefore made to be able to properly view and assess the information in
the data.
0.0001
0.001
0.01
0.1
1
10
100
1000
0.05 0.5 5
MSD
[µ
m2]
Time
Mean MSD200 nm amine control
200 nm amine 0.01 Gblock
200 nm amine 0.1 Gblock
200 nm amine 1.0 Gblock
100 nm carboxy control
100 nm carboxy 0.01 Gblock
100 nm carboxy 0.1 Gblock
100 nm carboxy 1.0 Gblock
200 nm carboxy control
200 nm carboxy 0.01 Gblock
200 nm carboxy 0.1 Gblock
200 nm carboxy 1.0 Gblock
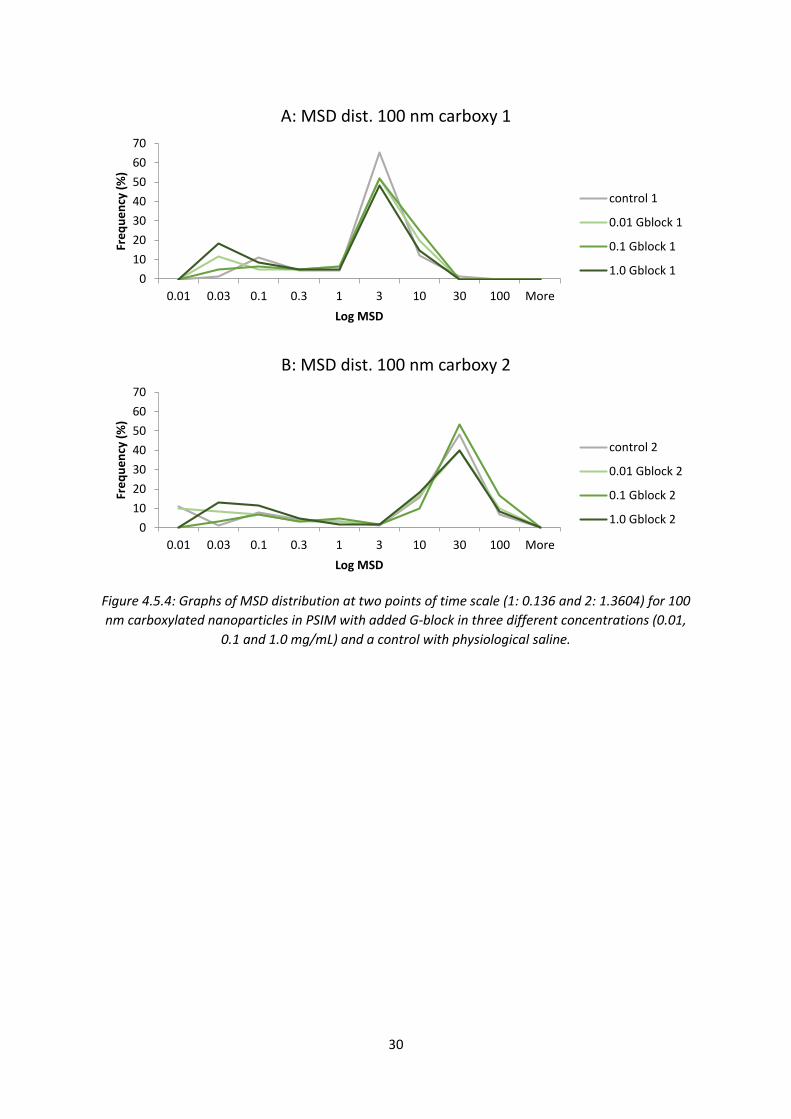
30
Figure 4.5.4: Graphs of MSD distribution at two points of time scale (1: 0.136 and 2: 1.3604) for 100
nm carboxylated nanoparticles in PSIM with added G-block in three different concentrations (0.01,
0.1 and 1.0 mg/mL) and a control with physiological saline.
0
10
20
30
40
50
60
70
0.01 0.03 0.1 0.3 1 3 10 30 100 More
Fre
qu
en
cy (
%)
Log MSD
A: MSD dist. 100 nm carboxy 1
control 1
0.01 Gblock 1
0.1 Gblock 1
1.0 Gblock 1
0
10
20
30
40
50
60
70
0.01 0.03 0.1 0.3 1 3 10 30 100 More
Fre
qu
en
cy (
%)
Log MSD
B: MSD dist. 100 nm carboxy 2
control 2
0.01 Gblock 2
0.1 Gblock 2
1.0 Gblock 2

31
Figure 4.5.5: Graphs of MSD distribution at two points of time scale (1: 0.136 and 2: 1.3604) for 200
nm carboxylated nanoparticles in PSIM with added G-block in three different concentrations (0.01,
0.1 and 1.0 mg/mL) and a control with physiological saline.
0
10
20
30
40
50
60
70
0.01 0.03 0.1 0.3 1 3 10 30 100 More
Fre
qu
en
cy (
%)
Log MSD
A: MSD dist. 200 nm carboxy 1
control 1
0.01 Gblock 1
0.1 Gblock 1
1.0 Gblock 1
0
10
20
30
40
50
60
70
0.01 0.03 0.1 0.3 1 3 10 30 100 More
Fre
qu
en
cy (
%)
Log MSD
B: MSD dist. 200 nm carboxy 2
control 2
0.01 Gblock 2
0.1 Gblock 2
1.0 Gblock 2
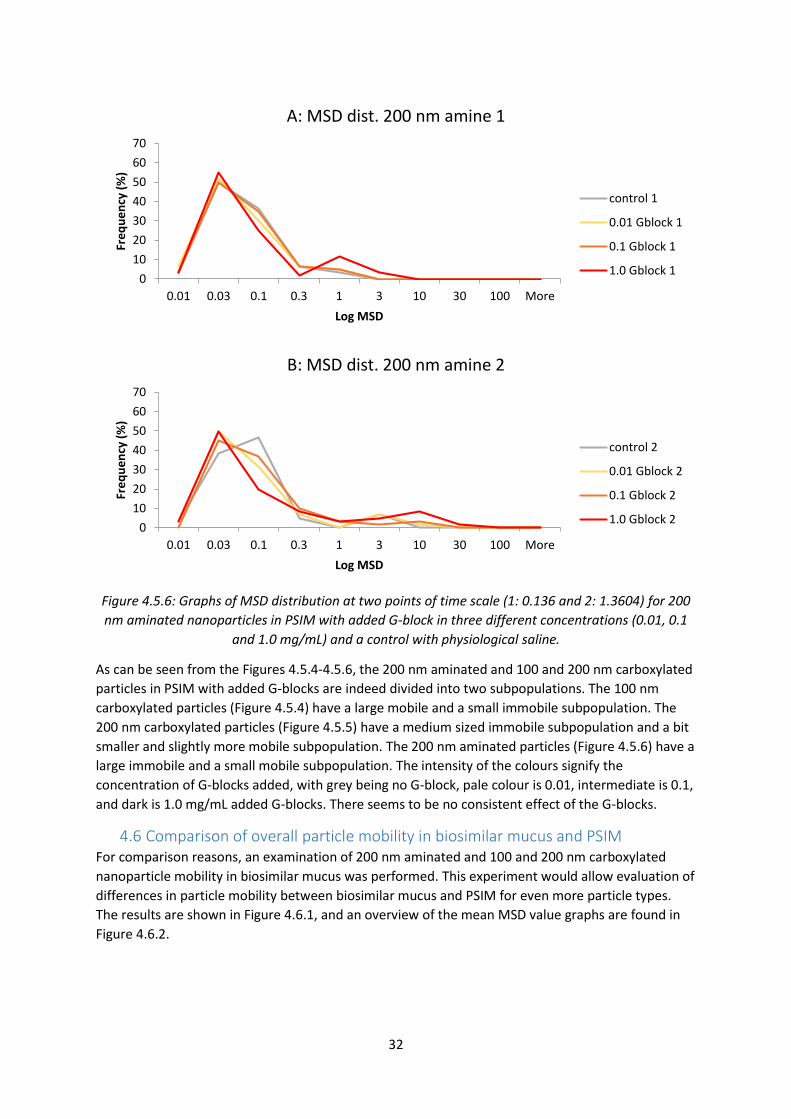
32
Figure 4.5.6: Graphs of MSD distribution at two points of time scale (1: 0.136 and 2: 1.3604) for 200
nm aminated nanoparticles in PSIM with added G-block in three different concentrations (0.01, 0.1
and 1.0 mg/mL) and a control with physiological saline.
As can be seen from the Figures 4.5.4-4.5.6, the 200 nm aminated and 100 and 200 nm carboxylated
particles in PSIM with added G-blocks are indeed divided into two subpopulations. The 100 nm
carboxylated particles (Figure 4.5.4) have a large mobile and a small immobile subpopulation. The
200 nm carboxylated particles (Figure 4.5.5) have a medium sized immobile subpopulation and a bit
smaller and slightly more mobile subpopulation. The 200 nm aminated particles (Figure 4.5.6) have a
large immobile and a small mobile subpopulation. The intensity of the colours signify the
concentration of G-blocks added, with grey being no G-block, pale colour is 0.01, intermediate is 0.1,
and dark is 1.0 mg/mL added G-blocks. There seems to be no consistent effect of the G-blocks.
4.6 Comparison of overall particle mobility in biosimilar mucus and PSIM For comparison reasons, an examination of 200 nm aminated and 100 and 200 nm carboxylated
nanoparticle mobility in biosimilar mucus was performed. This experiment would allow evaluation of
differences in particle mobility between biosimilar mucus and PSIM for even more particle types.
The results are shown in Figure 4.6.1, and an overview of the mean MSD value graphs are found in
Figure 4.6.2.
0
10
20
30
40
50
60
70
0.01 0.03 0.1 0.3 1 3 10 30 100 More
Fre
qu
en
cy (
%)
Log MSD
A: MSD dist. 200 nm amine 1
control 1
0.01 Gblock 1
0.1 Gblock 1
1.0 Gblock 1
0
10
20
30
40
50
60
70
0.01 0.03 0.1 0.3 1 3 10 30 100 More
Fre
qu
en
cy (
%)
Log MSD
B: MSD dist. 200 nm amine 2
control 2
0.01 Gblock 2
0.1 Gblock 2
1.0 Gblock 2
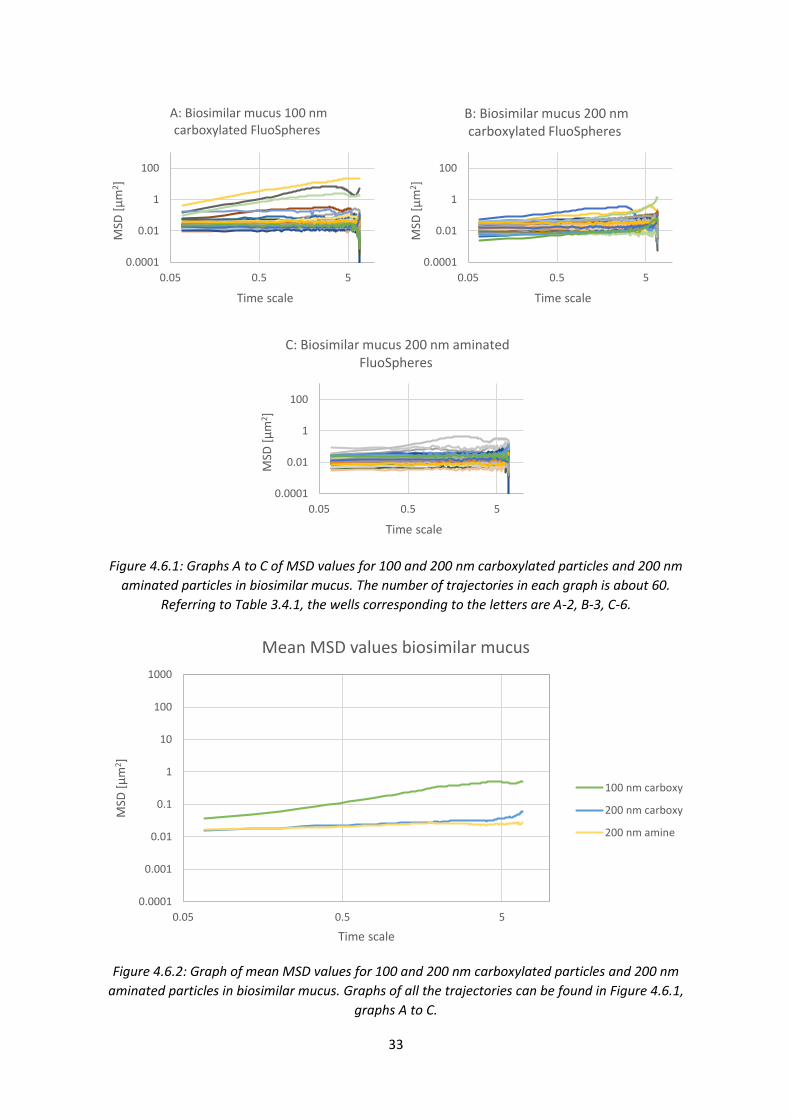
33
Figure 4.6.1: Graphs A to C of MSD values for 100 and 200 nm carboxylated particles and 200 nm
aminated particles in biosimilar mucus. The number of trajectories in each graph is about 60.
Referring to Table 3.4.1, the wells corresponding to the letters are A-2, B-3, C-6.
Figure 4.6.2: Graph of mean MSD values for 100 and 200 nm carboxylated particles and 200 nm
aminated particles in biosimilar mucus. Graphs of all the trajectories can be found in Figure 4.6.1,
graphs A to C.
0.0001
0.01
1
100
0.05 0.5 5
MSD
[µ
m2 ]
Time scale
A: Biosimilar mucus 100 nm carboxylated FluoSpheres
0.0001
0.01
1
100
0.05 0.5 5
MSD
[µ
m2 ]
Time scale
B: Biosimilar mucus 200 nm carboxylated FluoSpheres
0.0001
0.01
1
100
0.05 0.5 5
MSD
[µ
m2]
Time scale
C: Biosimilar mucus 200 nm aminated FluoSpheres
0.0001
0.001
0.01
0.1
1
10
100
1000
0.05 0.5 5
MSD
[µ
m2 ]
Time scale
Mean MSD values biosimilar mucus
100 nm carboxy
200 nm carboxy
200 nm amine
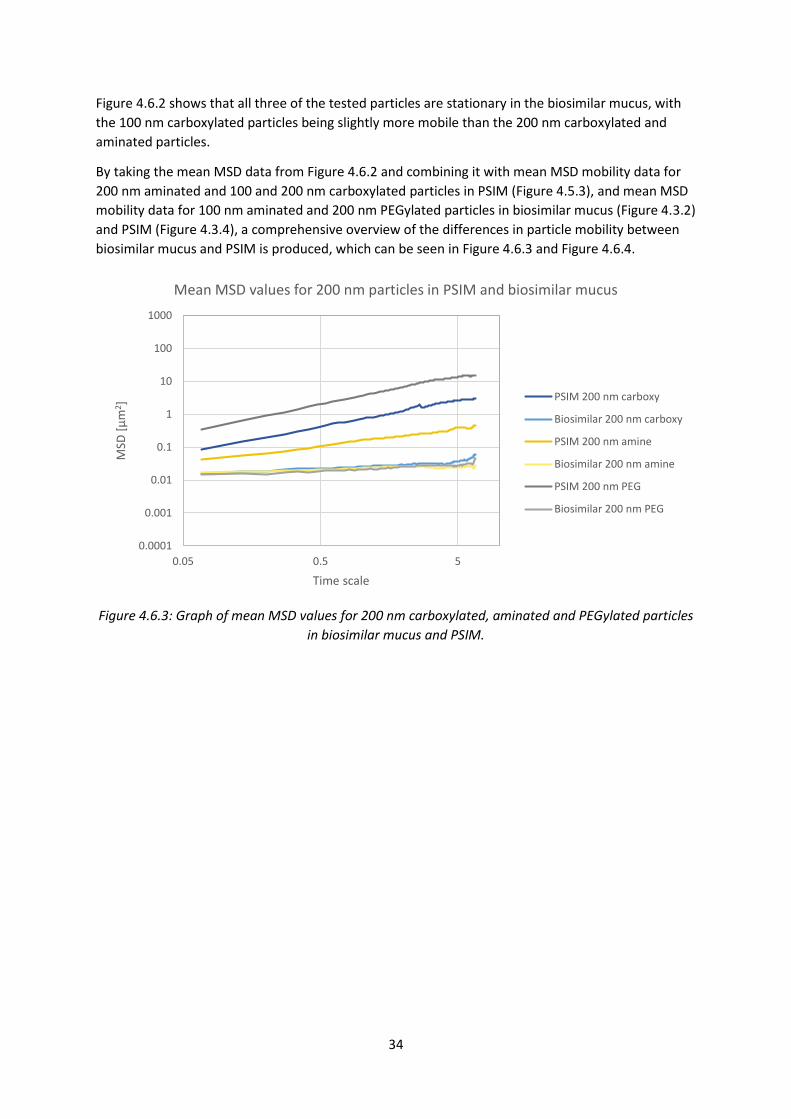
34
Figure 4.6.2 shows that all three of the tested particles are stationary in the biosimilar mucus, with
the 100 nm carboxylated particles being slightly more mobile than the 200 nm carboxylated and
aminated particles.
By taking the mean MSD data from Figure 4.6.2 and combining it with mean MSD mobility data for
200 nm aminated and 100 and 200 nm carboxylated particles in PSIM (Figure 4.5.3), and mean MSD
mobility data for 100 nm aminated and 200 nm PEGylated particles in biosimilar mucus (Figure 4.3.2)
and PSIM (Figure 4.3.4), a comprehensive overview of the differences in particle mobility between
biosimilar mucus and PSIM is produced, which can be seen in Figure 4.6.3 and Figure 4.6.4.
Figure 4.6.3: Graph of mean MSD values for 200 nm carboxylated, aminated and PEGylated particles
in biosimilar mucus and PSIM.
0.0001
0.001
0.01
0.1
1
10
100
1000
0.05 0.5 5
MSD
[µ
m2 ]
Time scale
Mean MSD values for 200 nm particles in PSIM and biosimilar mucus
PSIM 200 nm carboxy
Biosimilar 200 nm carboxy
PSIM 200 nm amine
Biosimilar 200 nm amine
PSIM 200 nm PEG
Biosimilar 200 nm PEG
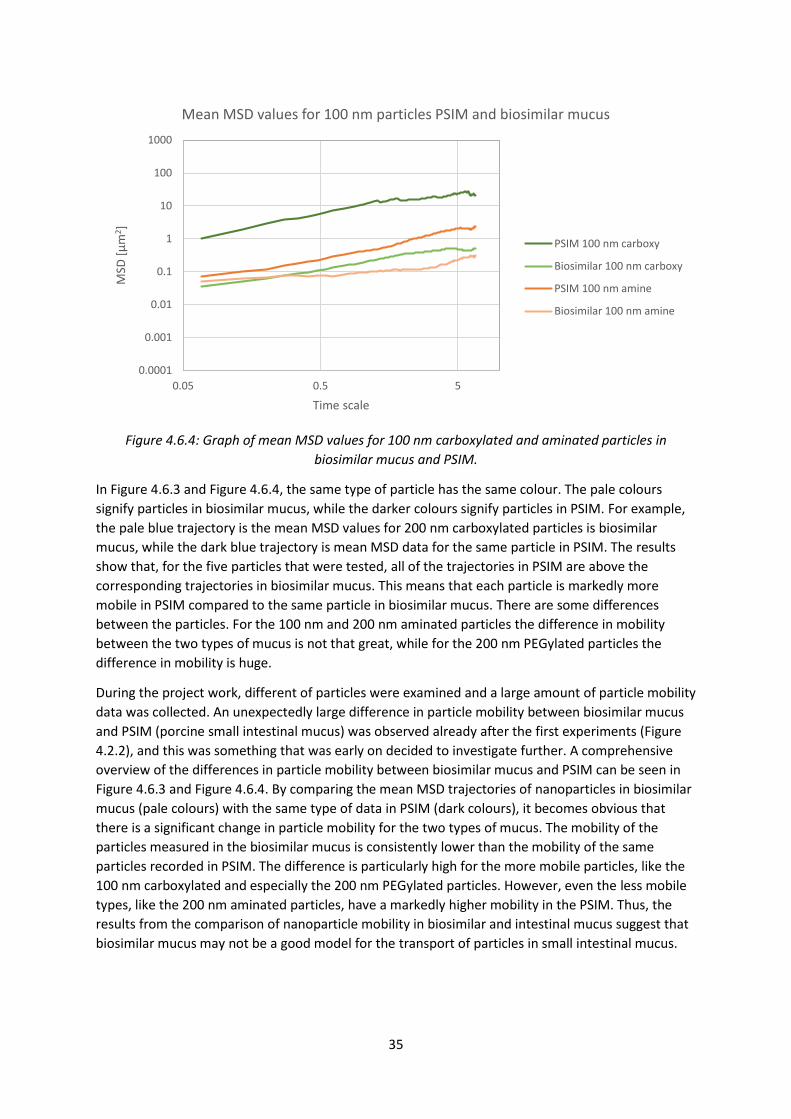
35
Figure 4.6.4: Graph of mean MSD values for 100 nm carboxylated and aminated particles in
biosimilar mucus and PSIM.
In Figure 4.6.3 and Figure 4.6.4, the same type of particle has the same colour. The pale colours
signify particles in biosimilar mucus, while the darker colours signify particles in PSIM. For example,
the pale blue trajectory is the mean MSD values for 200 nm carboxylated particles is biosimilar
mucus, while the dark blue trajectory is mean MSD data for the same particle in PSIM. The results
show that, for the five particles that were tested, all of the trajectories in PSIM are above the
corresponding trajectories in biosimilar mucus. This means that each particle is markedly more
mobile in PSIM compared to the same particle in biosimilar mucus. There are some differences
between the particles. For the 100 nm and 200 nm aminated particles the difference in mobility
between the two types of mucus is not that great, while for the 200 nm PEGylated particles the
difference in mobility is huge.
During the project work, different of particles were examined and a large amount of particle mobility
data was collected. An unexpectedly large difference in particle mobility between biosimilar mucus
and PSIM (porcine small intestinal mucus) was observed already after the first experiments (Figure
4.2.2), and this was something that was early on decided to investigate further. A comprehensive
overview of the differences in particle mobility between biosimilar mucus and PSIM can be seen in
Figure 4.6.3 and Figure 4.6.4. By comparing the mean MSD trajectories of nanoparticles in biosimilar
mucus (pale colours) with the same type of data in PSIM (dark colours), it becomes obvious that
there is a significant change in particle mobility for the two types of mucus. The mobility of the
particles measured in the biosimilar mucus is consistently lower than the mobility of the same
particles recorded in PSIM. The difference is particularly high for the more mobile particles, like the
100 nm carboxylated and especially the 200 nm PEGylated particles. However, even the less mobile
types, like the 200 nm aminated particles, have a markedly higher mobility in the PSIM. Thus, the
results from the comparison of nanoparticle mobility in biosimilar and intestinal mucus suggest that
biosimilar mucus may not be a good model for the transport of particles in small intestinal mucus.
0.0001
0.001
0.01
0.1
1
10
100
1000
0.05 0.5 5
MSD
[µ
m2 ]
Time scale
Mean MSD values for 100 nm particles PSIM and biosimilar mucus
PSIM 100 nm carboxy
Biosimilar 100 nm carboxy
PSIM 100 nm amine
Biosimilar 100 nm amine
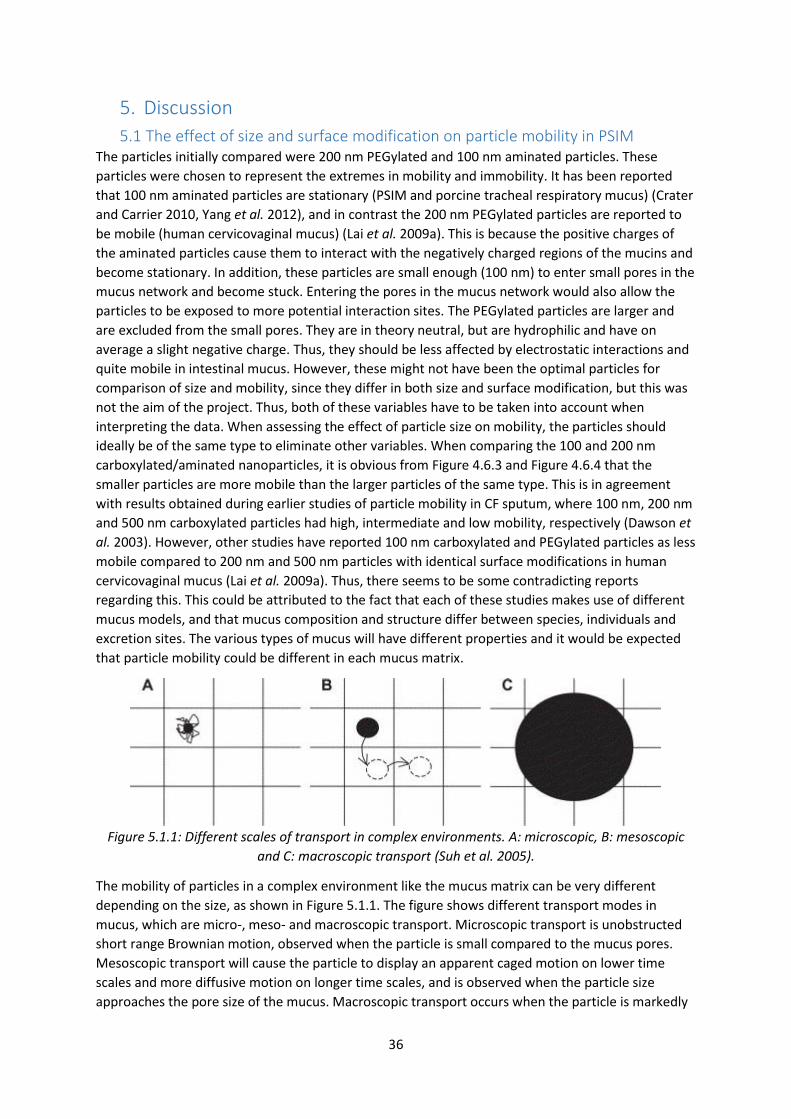
36
5. Discussion
5.1 The effect of size and surface modification on particle mobility in PSIM The particles initially compared were 200 nm PEGylated and 100 nm aminated particles. These
particles were chosen to represent the extremes in mobility and immobility. It has been reported
that 100 nm aminated particles are stationary (PSIM and porcine tracheal respiratory mucus) (Crater
and Carrier 2010, Yang et al. 2012), and in contrast the 200 nm PEGylated particles are reported to
be mobile (human cervicovaginal mucus) (Lai et al. 2009a). This is because the positive charges of
the aminated particles cause them to interact with the negatively charged regions of the mucins and
become stationary. In addition, these particles are small enough (100 nm) to enter small pores in the
mucus network and become stuck. Entering the pores in the mucus network would also allow the
particles to be exposed to more potential interaction sites. The PEGylated particles are larger and
are excluded from the small pores. They are in theory neutral, but are hydrophilic and have on
average a slight negative charge. Thus, they should be less affected by electrostatic interactions and
quite mobile in intestinal mucus. However, these might not have been the optimal particles for
comparison of size and mobility, since they differ in both size and surface modification, but this was
not the aim of the project. Thus, both of these variables have to be taken into account when
interpreting the data. When assessing the effect of particle size on mobility, the particles should
ideally be of the same type to eliminate other variables. When comparing the 100 and 200 nm
carboxylated/aminated nanoparticles, it is obvious from Figure 4.6.3 and Figure 4.6.4 that the
smaller particles are more mobile than the larger particles of the same type. This is in agreement
with results obtained during earlier studies of particle mobility in CF sputum, where 100 nm, 200 nm
and 500 nm carboxylated particles had high, intermediate and low mobility, respectively (Dawson et
al. 2003). However, other studies have reported 100 nm carboxylated and PEGylated particles as less
mobile compared to 200 nm and 500 nm particles with identical surface modifications in human
cervicovaginal mucus (Lai et al. 2009a). Thus, there seems to be some contradicting reports
regarding this. This could be attributed to the fact that each of these studies makes use of different
mucus models, and that mucus composition and structure differ between species, individuals and
excretion sites. The various types of mucus will have different properties and it would be expected
that particle mobility could be different in each mucus matrix.
Figure 5.1.1: Different scales of transport in complex environments. A: microscopic, B: mesoscopic
and C: macroscopic transport (Suh et al. 2005).
The mobility of particles in a complex environment like the mucus matrix can be very different
depending on the size, as shown in Figure 5.1.1. The figure shows different transport modes in
mucus, which are micro-, meso- and macroscopic transport. Microscopic transport is unobstructed
short range Brownian motion, observed when the particle is small compared to the mucus pores.
Mesoscopic transport will cause the particle to display an apparent caged motion on lower time
scales and more diffusive motion on longer time scales, and is observed when the particle size
approaches the pore size of the mucus. Macroscopic transport occurs when the particle is markedly

37
larger than the pore size, and the particles will display a more homogeneous diffusion (Suh et al.
2005). A particle of any size can undergo all of these transport modes in mucus, as mucus pore size is
heterogeneous. The mobility of particles undergoing macroscopic transport will be observed as
being slower than the mobility of particles undergoing microscopic transport, because of the varying
degrees of steric hindrance. However, this view only focuses on size and disregards the effect of
particle-mucus interactions (Suh et al. 2005). In general, the particles that were examined during the
project have varying mobility within the same type of particles in the same type of mucus medium.
This is a behaviour commonly seen when particles are submerged in a heterogeneous medium
(Crater and Carrier 2010). A heterogeneous medium such as native mucus will have large differences
in pore sizes. Particles will move slowly through smaller pores and more quickly through larger
pores, causing the heterogeneity in particle velocity seen in the results (Dawson et al. 2003). A more
uniform distribution of particle velocities could be caused by a more homogeneous medium, as this
would cause the particles to follow a limited number of paths. These few paths would be where the
pore sizes are big enough for the particles to move through and the particles would thus show less
diversity of movement (Dawson et al. 2003). While the results with PSIM show some heterogeneity
in particle mobility, the results with biosimilar mucus are much less diverse. A possible explanation
could be that the pore sizes in biosimilar mucus are on average smaller than in PSIM, and this is
discussed in greater detail in section 5.2. However, this interpretation assumes no interaction
between the particle and the mucus, and mucus-particle interactions could give a different result.
To compare the effect of surface modification on particle mobility, one would use same size
nanoparticles of different types. The aminated particles have a positive charge, the carboxylated
particles have a negative charge, and the PEGylated particles have an almost neutral, slightly
negative charge and a hydrophilic surface. From Figure 4.6.3 and 4.6.4 it is clear that the
carboxylated particles are more mobile than the aminated particles, for both the 100 nm and 200
nm sized particles. The difference in mobility seems to be larger for the smaller particles. This could
be explained by the larger particles having a larger surface area. They might therefore be more
affected by surface interactions compared to the smaller particles, who have a smaller surface area.
This would cause the larger particles to be less mobile compared to the smaller particles. The 200
nm particles would then have a smaller relative difference in mobility between the carboxylated and
aminated particles.
The positive charges of the amine groups on the aminated particles will interact with the negatively
charged parts of the mucin network through electrostatic interactions, while the carboxylated
particles will interact with the positively charged parts of the mucin network, for example positively
charged amino acids. The observed results could be partly explained by the overall higher frequency
of negative charges on the mucin molecules in comparison with positive charges. Thus, the aminated
particles will be more hindered by electrostatic attraction to the mucins in comparison with the
carboxylated particles, while the PEGylated particles will have little electrostatic interactions. All
three types of particles, both aminated, carboxylated and PEGylated, contain hydrogen atoms bound
to an electronegative atom (O, N) and can interact with nearby molecules through hydrogen
bonding. The amount of electrostatic interactions and, to a substantially lesser degree, hydrogen
bonding will be pH dependent, as the pH will affect the protonated or deprotonated status of the
carboxyl and amino groups. All of the particles also have a hydrophobic core because of the
polystyrene material, and could in theory undergo hydrophobic interactions with other molecules.
The degree of hydrophobic interaction will be dependent on how dense the surface coating of the
particles are. Considering the high degree of surface coating for the particles in question, it is
reasonable to assume that hydrophobic interactions will not be the dominant type of interaction.
Especially the PEGylated particles will likely not undergo hydrophobic interactions because of the
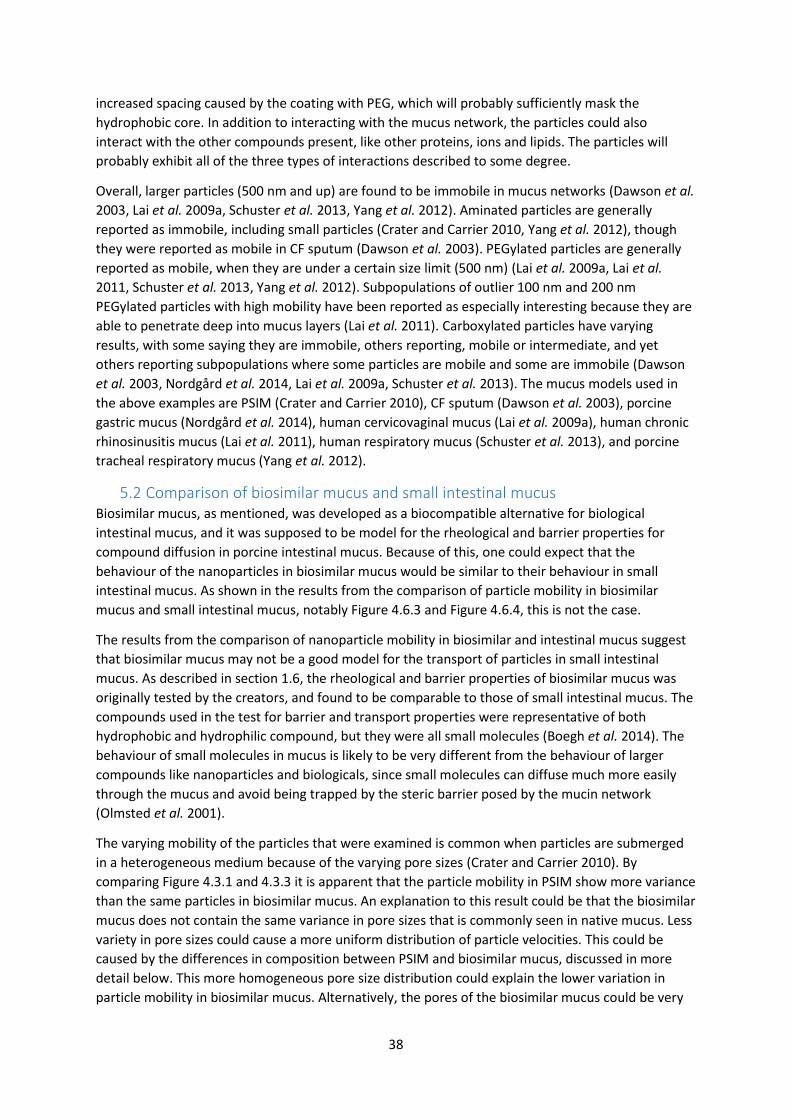
38
increased spacing caused by the coating with PEG, which will probably sufficiently mask the
hydrophobic core. In addition to interacting with the mucus network, the particles could also
interact with the other compounds present, like other proteins, ions and lipids. The particles will
probably exhibit all of the three types of interactions described to some degree.
Overall, larger particles (500 nm and up) are found to be immobile in mucus networks (Dawson et al.
2003, Lai et al. 2009a, Schuster et al. 2013, Yang et al. 2012). Aminated particles are generally
reported as immobile, including small particles (Crater and Carrier 2010, Yang et al. 2012), though
they were reported as mobile in CF sputum (Dawson et al. 2003). PEGylated particles are generally
reported as mobile, when they are under a certain size limit (500 nm) (Lai et al. 2009a, Lai et al.
2011, Schuster et al. 2013, Yang et al. 2012). Subpopulations of outlier 100 nm and 200 nm
PEGylated particles with high mobility have been reported as especially interesting because they are
able to penetrate deep into mucus layers (Lai et al. 2011). Carboxylated particles have varying
results, with some saying they are immobile, others reporting, mobile or intermediate, and yet
others reporting subpopulations where some particles are mobile and some are immobile (Dawson
et al. 2003, Nordgård et al. 2014, Lai et al. 2009a, Schuster et al. 2013). The mucus models used in
the above examples are PSIM (Crater and Carrier 2010), CF sputum (Dawson et al. 2003), porcine
gastric mucus (Nordgård et al. 2014), human cervicovaginal mucus (Lai et al. 2009a), human chronic
rhinosinusitis mucus (Lai et al. 2011), human respiratory mucus (Schuster et al. 2013), and porcine
tracheal respiratory mucus (Yang et al. 2012).
5.2 Comparison of biosimilar mucus and small intestinal mucus Biosimilar mucus, as mentioned, was developed as a biocompatible alternative for biological
intestinal mucus, and it was supposed to be model for the rheological and barrier properties for
compound diffusion in porcine intestinal mucus. Because of this, one could expect that the
behaviour of the nanoparticles in biosimilar mucus would be similar to their behaviour in small
intestinal mucus. As shown in the results from the comparison of particle mobility in biosimilar
mucus and small intestinal mucus, notably Figure 4.6.3 and Figure 4.6.4, this is not the case.
The results from the comparison of nanoparticle mobility in biosimilar and intestinal mucus suggest
that biosimilar mucus may not be a good model for the transport of particles in small intestinal
mucus. As described in section 1.6, the rheological and barrier properties of biosimilar mucus was
originally tested by the creators, and found to be comparable to those of small intestinal mucus. The
compounds used in the test for barrier and transport properties were representative of both
hydrophobic and hydrophilic compound, but they were all small molecules (Boegh et al. 2014). The
behaviour of small molecules in mucus is likely to be very different from the behaviour of larger
compounds like nanoparticles and biologicals, since small molecules can diffuse much more easily
through the mucus and avoid being trapped by the steric barrier posed by the mucin network
(Olmsted et al. 2001).
The varying mobility of the particles that were examined is common when particles are submerged
in a heterogeneous medium because of the varying pore sizes (Crater and Carrier 2010). By
comparing Figure 4.3.1 and 4.3.3 it is apparent that the particle mobility in PSIM show more variance
than the same particles in biosimilar mucus. An explanation to this result could be that the biosimilar
mucus does not contain the same variance in pore sizes that is commonly seen in native mucus. Less
variety in pore sizes could cause a more uniform distribution of particle velocities. This could be
caused by the differences in composition between PSIM and biosimilar mucus, discussed in more
detail below. This more homogeneous pore size distribution could explain the lower variation in
particle mobility in biosimilar mucus. Alternatively, the pores of the biosimilar mucus could be very
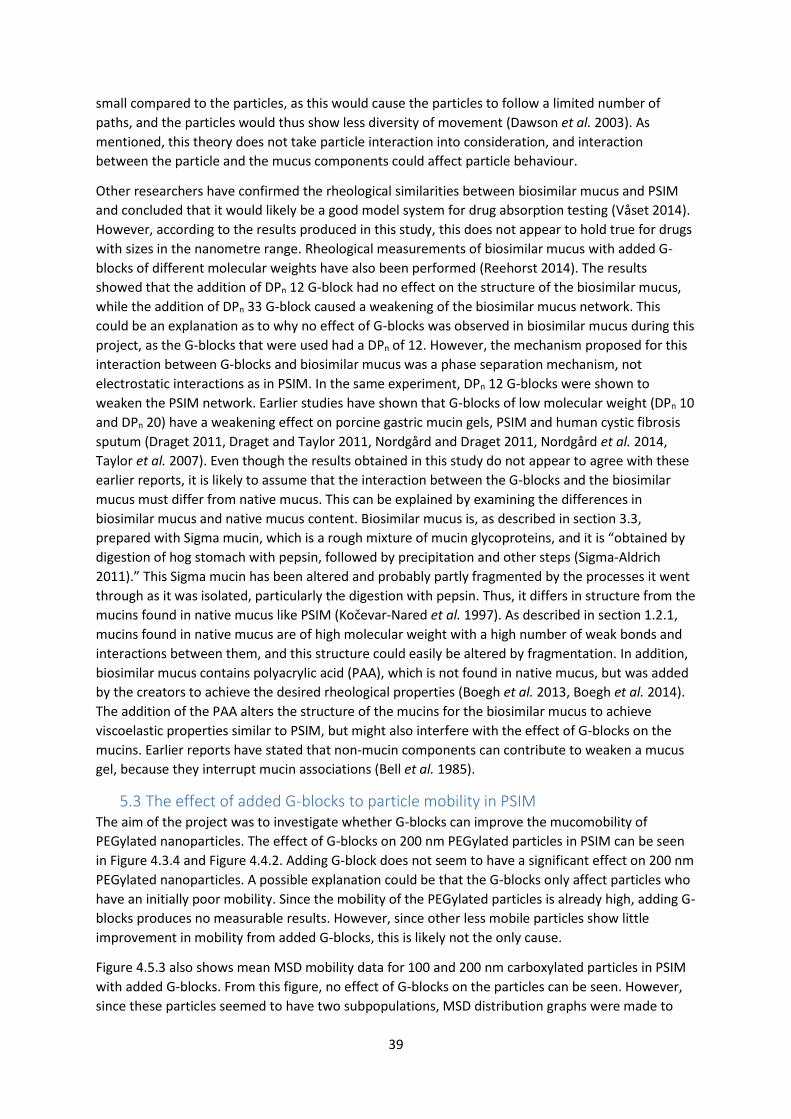
39
small compared to the particles, as this would cause the particles to follow a limited number of
paths, and the particles would thus show less diversity of movement (Dawson et al. 2003). As
mentioned, this theory does not take particle interaction into consideration, and interaction
between the particle and the mucus components could affect particle behaviour.
Other researchers have confirmed the rheological similarities between biosimilar mucus and PSIM
and concluded that it would likely be a good model system for drug absorption testing (Våset 2014).
However, according to the results produced in this study, this does not appear to hold true for drugs
with sizes in the nanometre range. Rheological measurements of biosimilar mucus with added G-
blocks of different molecular weights have also been performed (Reehorst 2014). The results
showed that the addition of DPn 12 G-block had no effect on the structure of the biosimilar mucus,
while the addition of DPn 33 G-block caused a weakening of the biosimilar mucus network. This
could be an explanation as to why no effect of G-blocks was observed in biosimilar mucus during this
project, as the G-blocks that were used had a DPn of 12. However, the mechanism proposed for this
interaction between G-blocks and biosimilar mucus was a phase separation mechanism, not
electrostatic interactions as in PSIM. In the same experiment, DPn 12 G-blocks were shown to
weaken the PSIM network. Earlier studies have shown that G-blocks of low molecular weight (DPn 10
and DPn 20) have a weakening effect on porcine gastric mucin gels, PSIM and human cystic fibrosis
sputum (Draget 2011, Draget and Taylor 2011, Nordgård and Draget 2011, Nordgård et al. 2014,
Taylor et al. 2007). Even though the results obtained in this study do not appear to agree with these
earlier reports, it is likely to assume that the interaction between the G-blocks and the biosimilar
mucus must differ from native mucus. This can be explained by examining the differences in
biosimilar mucus and native mucus content. Biosimilar mucus is, as described in section 3.3,
prepared with Sigma mucin, which is a rough mixture of mucin glycoproteins, and it is “obtained by
digestion of hog stomach with pepsin, followed by precipitation and other steps (Sigma-Aldrich
2011).” This Sigma mucin has been altered and probably partly fragmented by the processes it went
through as it was isolated, particularly the digestion with pepsin. Thus, it differs in structure from the
mucins found in native mucus like PSIM (Kočevar-Nared et al. 1997). As described in section 1.2.1,
mucins found in native mucus are of high molecular weight with a high number of weak bonds and
interactions between them, and this structure could easily be altered by fragmentation. In addition,
biosimilar mucus contains polyacrylic acid (PAA), which is not found in native mucus, but was added
by the creators to achieve the desired rheological properties (Boegh et al. 2013, Boegh et al. 2014).
The addition of the PAA alters the structure of the mucins for the biosimilar mucus to achieve
viscoelastic properties similar to PSIM, but might also interfere with the effect of G-blocks on the
mucins. Earlier reports have stated that non-mucin components can contribute to weaken a mucus
gel, because they interrupt mucin associations (Bell et al. 1985).
5.3 The effect of added G-blocks to particle mobility in PSIM The aim of the project was to investigate whether G-blocks can improve the mucomobility of
PEGylated nanoparticles. The effect of G-blocks on 200 nm PEGylated particles in PSIM can be seen
in Figure 4.3.4 and Figure 4.4.2. Adding G-block does not seem to have a significant effect on 200 nm
PEGylated nanoparticles. A possible explanation could be that the G-blocks only affect particles who
have an initially poor mobility. Since the mobility of the PEGylated particles is already high, adding G-
blocks produces no measurable results. However, since other less mobile particles show little
improvement in mobility from added G-blocks, this is likely not the only cause.
Figure 4.5.3 also shows mean MSD mobility data for 100 and 200 nm carboxylated particles in PSIM
with added G-blocks. From this figure, no effect of G-blocks on the particles can be seen. However,
since these particles seemed to have two subpopulations, MSD distribution graphs were made to

40
better evaluate the information in the data, and these can be seen in Figures 4.5.4-4.5.5. These
figures are somewhat hard to analyse, but there does not appear to be any consistent effect of the
added G-blocks.
Figure 4.3.4 and Figure 4.4.2 also show the effect of G-block on 100 nm and 200 nm aminated
particles, respectively. While the 100 nm aminated particles in Figure 4.3.4 show no definite pattern
with increasing G-block concentration, the 200 nm aminated particles in Figure 4.4.2 seem to be
more mobile with increasing G-block concentration. Figure 4.5.3 also shows the effect of G-block on
200 nm aminated particles, but in this case only the highest concentration of G-blocks had an
increased mobility in comparison with the control sample. The corresponding MSD distribution
graph (Figure 4.5.6) shows that the highest concentration of G-blocks have caused an increase in the
mobile subpopulation of the 200 nm aminated particles and a decrease in the amount of slightly
mobile particles, while the size of the completely stationary subpopulation is unchanged. This
suggests that the G-blocks cannot affect the mobility of particles who are tightly bound to the mucus
network. It is also possible that adding G-blocks to mucus can affect the pores of various sizes in
different ways. One study hypothesised that the addition of DPn 12 and DPn 33 G-blocks to a PG
mucin gel caused both an opening of the smaller pores in the mucin network, but also a decrease in
the larger pores. It was theorised that this was due to G-block-mucin interactions (Reehorst 2014).
However, as previously discussed, mucin gels and native mucus are inherently different, so this
information might not be comparable. The mucin gel used in this study was not prepared with Sigma
mucin and would not have the same problems with degraded Sigma mucin molecules, but natural
mucus still exhibit a higher complexity in components and structure compared to a mucin-only gel.
Earlier studies have shown that G-blocks of low molecular weight (DPn 10 and DPn 20) have a
weakening effect on porcine gastric mucin gels, PSIM and human cystic fibrosis sputum (Draget
2011, Draget and Taylor 2011, Nordgård and Draget 2011, Nordgård et al. 2014, Taylor et al. 2007).
Another study showed that G-blocks with DPn 12 weakened the PSIM network (Reehorst 2014). As
mentioned in section 1.5, the mechanism for G-block interaction with mucus has been suggested to
be by electrostatic interaction. The positively charged regions of the mucin molecules, caused by
positive amino acids, is a potential interaction site for the negatively charged G-blocks, in addition to
being a site for intermucin and intramucin interaction (Nordgård and Draget 2011). Adding G-blocks
was expected to change these interactions by interfering with the mucin structure by electrostatic
interactions and reducing the crosslinks between mucins and other mucus components, thereby
weakening the mucus gel structure and causing an increased particle mobility. All of the particles,
both aminated, carboxylated and PEGylated will, as described, probably exhibit both hydrogen
bonding, and hydrophobic and electrostatic interactions. Adding G-blocks could also be theorised to
possibly hide potential particle-mucin binding sites, again leading to higher mobility. This would be
expected to influence the negatively charged particles to a larger degree, since the G-blocks have a
negative charge and would be attracted to the positively charged regions of the mucin molecules,
hindering these regions from interacting with the negative particles.
In contrast to earlier studies, the results obtained here do not show any consistent effect of adding
G-blocks to improve the mucomobility of nanoparticles. One possible explanation is that the PSIM
used in this study was somehow different from the native mucus used in the earlier studies. The
PSIM used in the preparation of the samples came from the same batch, which was originally
obtained about 18 months earlier. The PSIM was frozen at -20 °C in a number of beakers. The
beakers with PSIM were in use by other students or researchers and it is likely that some of them
have been thawed and refrozen numerous times. It is possible that repeated freezing have affected
the structure and properties of the native mucus. Previous research on the effect of freezing on
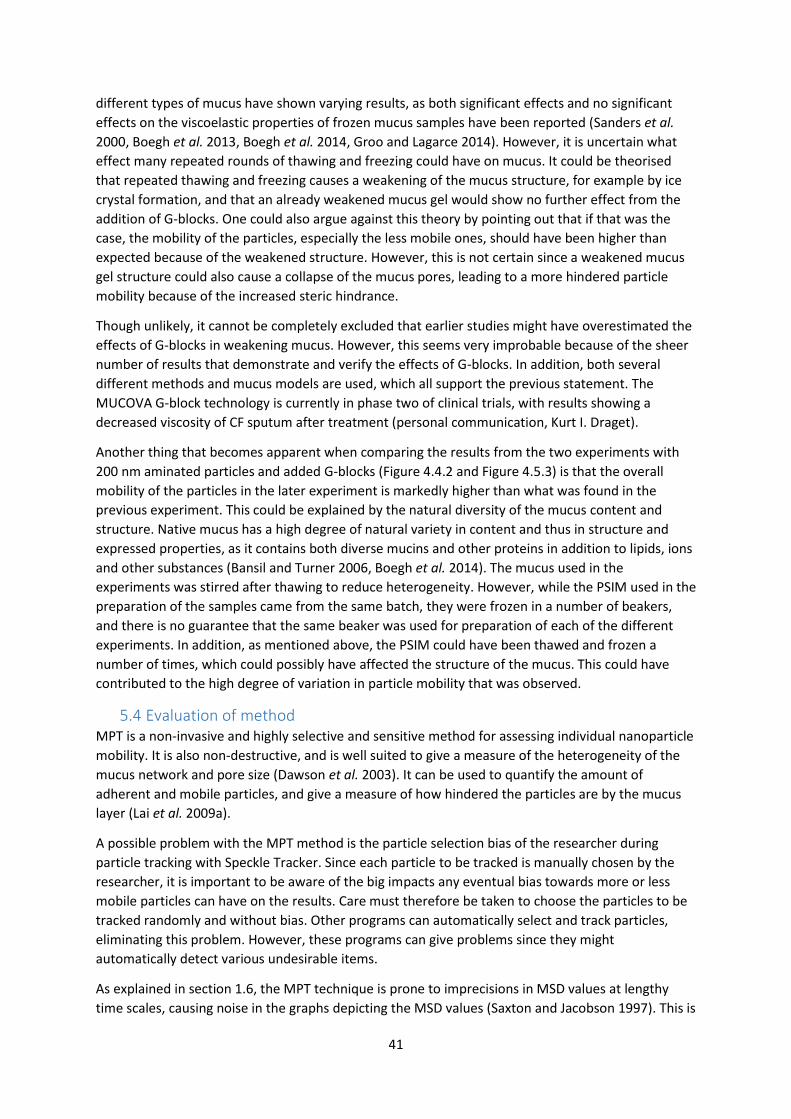
41
different types of mucus have shown varying results, as both significant effects and no significant
effects on the viscoelastic properties of frozen mucus samples have been reported (Sanders et al.
2000, Boegh et al. 2013, Boegh et al. 2014, Groo and Lagarce 2014). However, it is uncertain what
effect many repeated rounds of thawing and freezing could have on mucus. It could be theorised
that repeated thawing and freezing causes a weakening of the mucus structure, for example by ice
crystal formation, and that an already weakened mucus gel would show no further effect from the
addition of G-blocks. One could also argue against this theory by pointing out that if that was the
case, the mobility of the particles, especially the less mobile ones, should have been higher than
expected because of the weakened structure. However, this is not certain since a weakened mucus
gel structure could also cause a collapse of the mucus pores, leading to a more hindered particle
mobility because of the increased steric hindrance.
Though unlikely, it cannot be completely excluded that earlier studies might have overestimated the
effects of G-blocks in weakening mucus. However, this seems very improbable because of the sheer
number of results that demonstrate and verify the effects of G-blocks. In addition, both several
different methods and mucus models are used, which all support the previous statement. The
MUCOVA G-block technology is currently in phase two of clinical trials, with results showing a
decreased viscosity of CF sputum after treatment (personal communication, Kurt I. Draget).
Another thing that becomes apparent when comparing the results from the two experiments with
200 nm aminated particles and added G-blocks (Figure 4.4.2 and Figure 4.5.3) is that the overall
mobility of the particles in the later experiment is markedly higher than what was found in the
previous experiment. This could be explained by the natural diversity of the mucus content and
structure. Native mucus has a high degree of natural variety in content and thus in structure and
expressed properties, as it contains both diverse mucins and other proteins in addition to lipids, ions
and other substances (Bansil and Turner 2006, Boegh et al. 2014). The mucus used in the
experiments was stirred after thawing to reduce heterogeneity. However, while the PSIM used in the
preparation of the samples came from the same batch, they were frozen in a number of beakers,
and there is no guarantee that the same beaker was used for preparation of each of the different
experiments. In addition, as mentioned above, the PSIM could have been thawed and frozen a
number of times, which could possibly have affected the structure of the mucus. This could have
contributed to the high degree of variation in particle mobility that was observed.
5.4 Evaluation of method MPT is a non-invasive and highly selective and sensitive method for assessing individual nanoparticle
mobility. It is also non-destructive, and is well suited to give a measure of the heterogeneity of the
mucus network and pore size (Dawson et al. 2003). It can be used to quantify the amount of
adherent and mobile particles, and give a measure of how hindered the particles are by the mucus
layer (Lai et al. 2009a).
A possible problem with the MPT method is the particle selection bias of the researcher during
particle tracking with Speckle Tracker. Since each particle to be tracked is manually chosen by the
researcher, it is important to be aware of the big impacts any eventual bias towards more or less
mobile particles can have on the results. Care must therefore be taken to choose the particles to be
tracked randomly and without bias. Other programs can automatically select and track particles,
eliminating this problem. However, these programs can give problems since they might
automatically detect various undesirable items.
As explained in section 1.6, the MPT technique is prone to imprecisions in MSD values at lengthy
time scales, causing noise in the graphs depicting the MSD values (Saxton and Jacobson 1997). This is
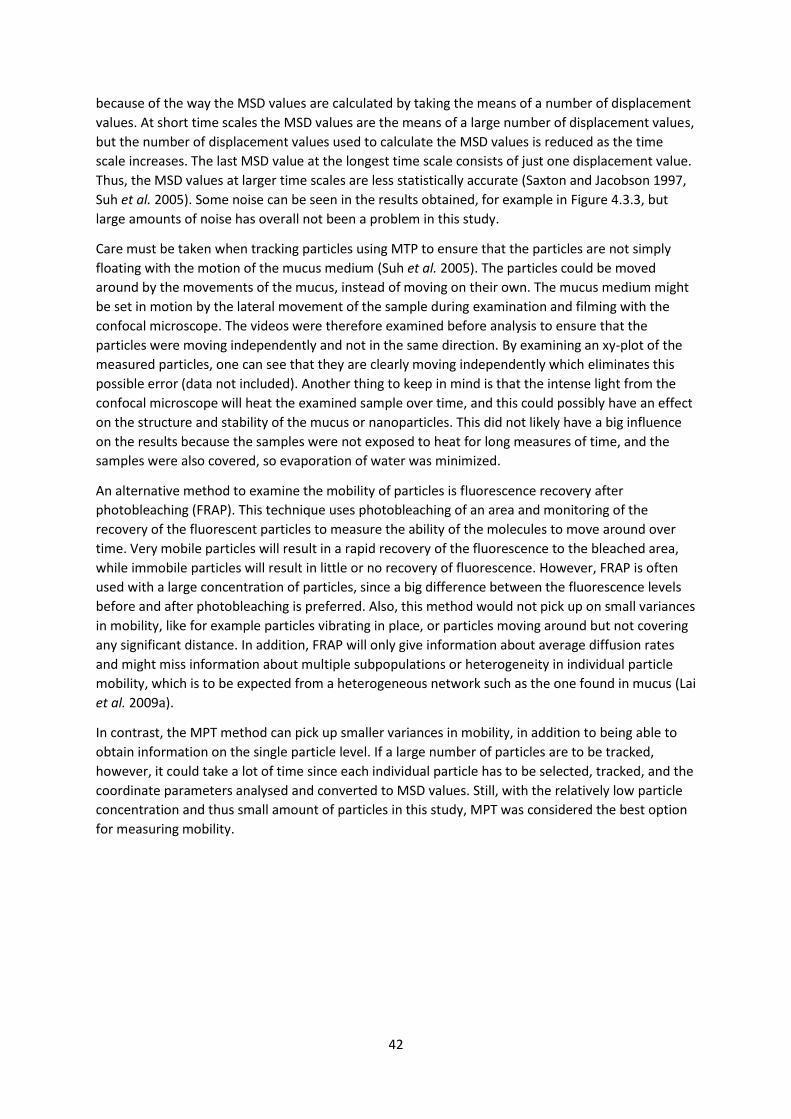
42
because of the way the MSD values are calculated by taking the means of a number of displacement
values. At short time scales the MSD values are the means of a large number of displacement values,
but the number of displacement values used to calculate the MSD values is reduced as the time
scale increases. The last MSD value at the longest time scale consists of just one displacement value.
Thus, the MSD values at larger time scales are less statistically accurate (Saxton and Jacobson 1997,
Suh et al. 2005). Some noise can be seen in the results obtained, for example in Figure 4.3.3, but
large amounts of noise has overall not been a problem in this study.
Care must be taken when tracking particles using MTP to ensure that the particles are not simply
floating with the motion of the mucus medium (Suh et al. 2005). The particles could be moved
around by the movements of the mucus, instead of moving on their own. The mucus medium might
be set in motion by the lateral movement of the sample during examination and filming with the
confocal microscope. The videos were therefore examined before analysis to ensure that the
particles were moving independently and not in the same direction. By examining an xy-plot of the
measured particles, one can see that they are clearly moving independently which eliminates this
possible error (data not included). Another thing to keep in mind is that the intense light from the
confocal microscope will heat the examined sample over time, and this could possibly have an effect
on the structure and stability of the mucus or nanoparticles. This did not likely have a big influence
on the results because the samples were not exposed to heat for long measures of time, and the
samples were also covered, so evaporation of water was minimized.
An alternative method to examine the mobility of particles is fluorescence recovery after
photobleaching (FRAP). This technique uses photobleaching of an area and monitoring of the
recovery of the fluorescent particles to measure the ability of the molecules to move around over
time. Very mobile particles will result in a rapid recovery of the fluorescence to the bleached area,
while immobile particles will result in little or no recovery of fluorescence. However, FRAP is often
used with a large concentration of particles, since a big difference between the fluorescence levels
before and after photobleaching is preferred. Also, this method would not pick up on small variances
in mobility, like for example particles vibrating in place, or particles moving around but not covering
any significant distance. In addition, FRAP will only give information about average diffusion rates
and might miss information about multiple subpopulations or heterogeneity in individual particle
mobility, which is to be expected from a heterogeneous network such as the one found in mucus (Lai
et al. 2009a).
In contrast, the MPT method can pick up smaller variances in mobility, in addition to being able to
obtain information on the single particle level. If a large number of particles are to be tracked,
however, it could take a lot of time since each individual particle has to be selected, tracked, and the
coordinate parameters analysed and converted to MSD values. Still, with the relatively low particle
concentration and thus small amount of particles in this study, MPT was considered the best option
for measuring mobility.
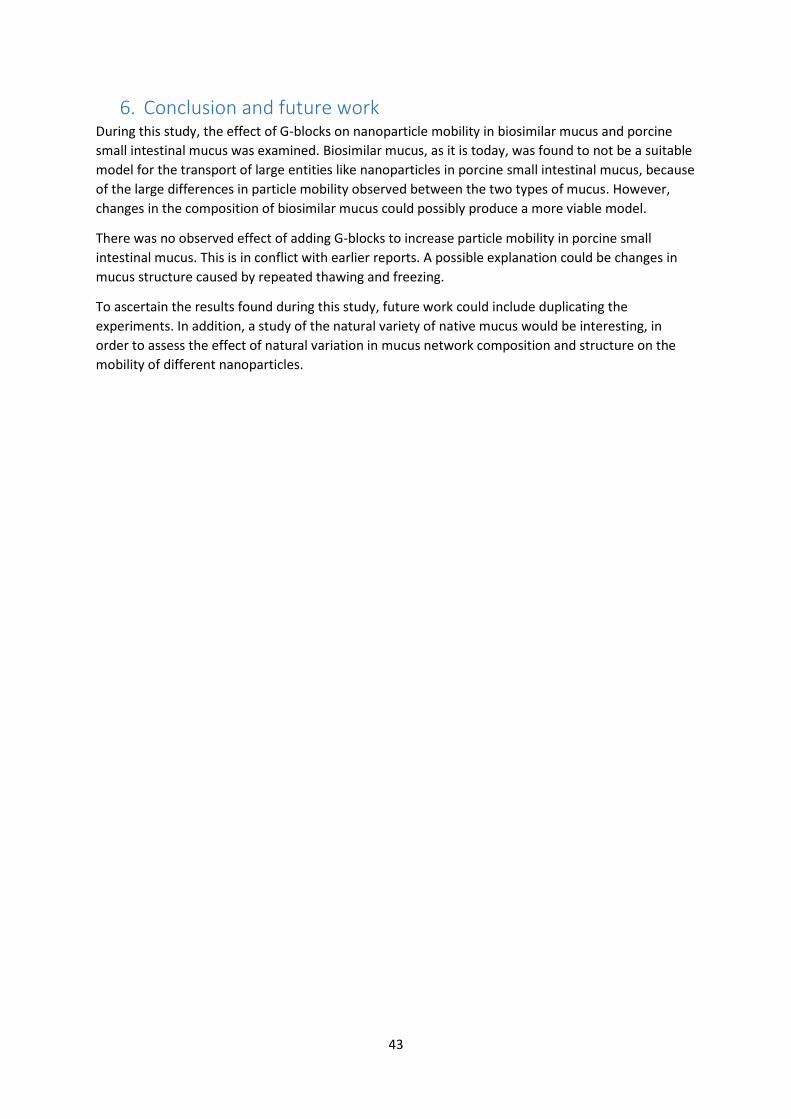
43
6. Conclusion and future work During this study, the effect of G-blocks on nanoparticle mobility in biosimilar mucus and porcine
small intestinal mucus was examined. Biosimilar mucus, as it is today, was found to not be a suitable
model for the transport of large entities like nanoparticles in porcine small intestinal mucus, because
of the large differences in particle mobility observed between the two types of mucus. However,
changes in the composition of biosimilar mucus could possibly produce a more viable model.
There was no observed effect of adding G-blocks to increase particle mobility in porcine small
intestinal mucus. This is in conflict with earlier reports. A possible explanation could be changes in
mucus structure caused by repeated thawing and freezing.
To ascertain the results found during this study, future work could include duplicating the
experiments. In addition, a study of the natural variety of native mucus would be interesting, in
order to assess the effect of natural variation in mucus network composition and structure on the
mobility of different nanoparticles.
44
References Bamrungsap, S.; Zhao, Z.; Chen, T.; Wang, L.; Li, C.; Fu, T.; Tan, W., Nanotechnology in
therapeutics: A focus on nanoparticles as a drug delivery system. Nanomedicine 2012, Vol. 7,
Issue 8, Pages 1253-1271.
Bansil, R.; Turner, B. S., Mucin structure, aggregation, physiological functions and biomedical
applications. Current Opinion in Colloid & Interface Science 2006, Vol. 11, Issues 2-3, Pages 164-
170.
Bell, A. E.; Sellers, L. A.; Allen, A.; Cunliffe, W. J.; Morris, E. R.; Ross-Murphy, S. B., Properties of
gastric and duodenal mucus: effect of proteolysis, disulfide reduction, bile, acid, ethanol, and
hypertonicity on mucus gel structure. Gastroenterology 1985, Vol. 88, Issue 1, Pages 269-280.
Boegh, M.; Baldursdóttir, S. G.; Nielsen, M. H.; Müllertz, A.; Nielsen, H. M., Development and
Rheological Profiling of Biosimilar Mucus. Annual Transactions of the Nordic Rheology Society
2013, Vol. 21, Pages 233-240.
Boegh, M.; Baldursdóttir, S. G.; Müllertz, A.; Nielsen, H. M., Property profiling of biosimilar mucus
in a novel mucus-containing in vitro model for assessment of intestinal drug absorption.
European Journal of Pharmaceutics and Biopharmaceutics. 2014, Vol. 87, Issue 2, Pages 227–
235.
Celli, J.; Gregor, B.; Turner, B.; Afdhal, N. H.; Bansil, R.; Erramilli, S., Viscoelastic properties and
dynamics of porcine gastric mucin. Biomacromolecules 2005, Vol. 6, Issue 3, Pages 1329-1333.
Chia-Ming, C.; Weiner, N., Gastrointestinal uptake of liposomes. I. In vitro and in situ studies.
International journal of pharmaceutics 1987, Vol. 37, Issues 1-2, Pages 75-85.
Cone, R. A., In: Mucosal Immunology, Second Edition, edited by Mestecky, Lamm, Strober,
Bienenstock, and McGhee. Academic Press, San Diego 1999. Pages 43-66.
Cone, R. A., Chapter 4: Mucus. In: Mucosal Immunology, Third Edition, edited by Mestecky,
Lamm, Strober, Bienenstock, and McGhee. Academic Press, London 2005. Pages 49-72.
Cone, R. A., Barrier properties of mucus. Advanced Drug Delivery Reviews 2009, Vol. 61, Issue 2,
Pages 75–85.
Crater, J. S.; Carrier, R. L., Barrier Properties of Gastrointestinal Mucus to Nanoparticle Transport.
Macromolecular Bioscience 2010, Vol. 10, Issue 12, Pages 1473–1483.
Cu, Y.; Saltzman, W. M., Mathematical modeling of molecular diffusion through mucus.
Advanced drug delivery reviews 2009, Vol. 61, Issue 2, Pages 101-114.
Dawson, M.; Wirtz, D.; Hanes, J., Enhanced viscoelasticity of human cystic fibrotic sputum
correlates with increasing microheterogeneity in particle transport. Journal of Biological
Chemistry 2003, Vol. 278, Issue 50, Pages 50393-50401.
Draget, K. I., Oligomers: Just background noise or as functional elements in structured
biopolymer systems? Food Hydrocolloids 2011, Vol. 25, Issue 8, Pages 1963-1965.
Draget, K. I.; Nordgård, C. T., MUCOVA: Drug delivery for large molecules and delivery vehicles.
NTNU, Technology Transfer Office (TTO) 2014.

45
Draget, K. I.; Taylor, C., Chemical, physical and biological properties of alginates and their
biomedical implications. Food Hydrocolloids 2011, Vol. 25, Issue 2, Pages 251-256.
Ensign, L. M.; Cone, R.; Hanes, J., Oral drug delivery with polymeric nanoparticles: The
gastrointestinal mucus barriers. Advanced Drug Delivery Reviews 2012, Vol. 64, Issue 6, Pages
557–570.
Fellers, T. J.; Davidson, M. W., Introduction to Confocal Microscopy. Olympus Fluoview Resource
Center, National High Magnetic Field Laboratory 2007. Available at
http://www.olympusconfocal.com/theory/confocalintro.html [accessed 09/05 2015].
Florence, A. T., The oral absorption of micro-and nanoparticulates: neither exceptional nor
unusual. Pharmaceutical Research 1997, Vol. 14, Issue 3, Pages 259-266.
Furrer, P.; Gurny, R., Recent advances in confocal microscopy for studying drug delivery to the
eye: Concepts and pharmaceutical applications. European Journal of Pharmaceutics and
Biopharmaceutics 2010, Vol. 74, Issue 1, Pages 33-40.
Grazu, V.; Moros, M.; Sánchez-Espinel, C., Nanocarriers as Nanomedicines: Design Concepts and
Recent Advances. Frontiers of Nanoscience 2012, Vol. 4, Pages 337-440.
Groo, A.-C.; Lagarce, F., Mucus models to evaluate nanomedicines for diffusion. Drug Discovery
Today 2014, Vol. 19, Issue 8, Pages 1097–1108.
HUGO Gene Nomenclature Committee, Gene Family: Mucins (MUC). European Bioinformatics
Institute. Available at http://www.genenames.org/cgi-bin/genefamilies/set/648 [accessed 11/05
2015].
Kararli, T. T., Comparison of the gastrointestinal anatomy, physiology, and biochemistry of
humans and commonly used laboratory animals. Biopharmaceutics and drug disposition 1995,
Vol. 16, Issue 5, Pages 351-380.
Khanvilkar, K.; Donovan, M. D.; Flanagan, D. R., Drug transfer through mucus. Advanced Drug
Delivery Reviews 2001, Vol. 48, Issues 2–3, Pages 173–193.
Kočevar-Nared, J.; Kristl, J.; Šmid-Korbar, J., Comparative rheological investigation of crude
gastric mucin and natural gastric mucus. Biomaterials 1997, Vol. 18, Issue 9, Pages 677–681.
Kornfeld, R.; Kornfeld, S., Comparative aspects of glycoprotein structure. Annual review of
biochemistry 1976, Vol. 45, Issue 1, Pages 217-238.
Kwon, K. C.; Verma, D.; Singh, N. D.; Herzog, R.; Daniell, H., Oral delivery of human
biopharmaceuticals, autoantigens and vaccine antigens bioencapsulated in plant cells. Advanced
drug delivery reviews 2013, Vol. 65, Issue 6, Pages 782-799.
Lai, S. K.; Wang, Y.-Y.; Hanes, J., Mucus-penetrating nanoparticles for drug and gene delivery to
mucosal tissues. Advanced Drug Delivery Reviews 2009 (a), Vol. 61, Pages 158-171.
Lai, S. K.; Wang, Y.-Y.; Wirtz, D.; Hanes, J., Micro-and macrorheology of mucus. Advanced drug
delivery reviews 2009 (b), Vol. 61, Issue 2, Pages 86-100.
Lai, S. K.; Suk, J. S.; Pace, A., Wang, Y.-Y.; Yang, M.; Mert, O.; Chen, J.; Kim, J.; Hanes, J., Drug
carrier nanoparticles that penetrate human chronic rhinosinusitis mucus. Biomaterials 2011, Vol.
32, Issue 26, Pages 6285–6290.
46
Larhed, A.W.; Artursson, P.; Gråsjö, J.; Björk, E., Diffusion of drugs in native and purified
gastrointestinal mucus. Journal of Pharmaceutical Sciences 1997, Vol. 86, Issue 6, Pages 660–
665.
Larhed, A. W.; Artursson, P.; Björk, E., The Influence of Intestinal Mucus Components on the
Diffusion of Drugs. Pharmaceutical Research 1998, Vol. 15, Issue 1, Pages 66-71.
Laroui, H.; Sitaraman, S. V.; Merlin, D., Chapter six – Gastrointestinal Delivery of Anti-
inflammatory Nanoparticles. In: Methods in Enzymology Vol. 509, edited by Düzgüneş. Academic
Press 2012, Pages 101–125.
Lee, B. K.; Yun, Y. H.; Park, K., Smart nanoparticles for drug delivery: Boundaries and
opportunities. Chemical Engineering Science 2015, Vol. 125, Pages 158–164.
Lichtenberger, L. M., The hydrophobic barrier properties of gastrointestinal mucus. Annual
review of physiology 1995, Vol. 57, Issue 1, Pages 565-583.
McDonnell, T.; Ioannou, Y; Rahman, A., PEGylated drugs in rheumatology—why develop them
and do they work? Rheumatology 2013, Vol. 53, Issue 3, Pages 391-396.
Nordgård, C. T.; Draget, K. I., Oligosaccharides As Modulators of Rheology in Complex Mucous
Systems. Biomacromolecules 2011, Vol. 12, Issue 8, Pages 3084-3090.
Nordgård, C. T.; Nonstad, U.; Olderøy, M. Ø.; Espevik, T.; Draget, K. I., Alterations in Mucus
Barrier Function and Matrix Structure Induced by Guluronate Oligomers. Biomacromolecules
2014, Vol. 15, Pages 2294-2300.
Norris, D. A.; Sinko, P. J., Effect of size, surface charge, and hydrophobicity on the translocation of
polystyrene microspheres through gastrointestinal mucin. Journal of applied polymer science
1997, Vol. 63, Issue 11, Pages 1481-1492.
Norris, D. A.; Puri, N.; Sinko, P. J.,The effect of physical barriers and properties on the oral
absorption of particulates. Advanced drug delivery reviews 1998, Vol. 34, Issue 2, Pages 135-154.
Olmsted, S. S.; Padgett, J. L.; Yudin, A. I.; Whaley, K. J.; Moench, T. R.; Cone, R. A., Diffusion of
macromolecules and virus-like particles in human cervical mucus. Biophysical journal 2001, Vol.
81, Issue 4, Pages 1930-1937.
Orive, G.; Gascon, A. R.; Hernández, R. M.; Domınguez-Gil, A.; Pedraz, J. L., Techniques: new
approaches to the delivery of biopharmaceuticals. Trends in Pharmacological Sciences 2004, Vol.
25, Issue 7, Pages 382-387.
Pawley, J. B., Handbook of Biological Confocal Microscopy, Third Edition. Springer Science +
Business Media, New York 2006.
Petros, R. A.; DeSimone, J. M., + Nature Reviews Drug Discovery 2010, Vol. 9.
Ponchel, G.; Irache, J. M., Specific and non-specific bioadhesive particulate systems for oral
delivery to the gastrointestinal tract. Advanced drug delivery reviews 1998, Vol. 34, Issues 2-3,
Pages 191-219.
Reehorst, C. M., The mucin-alginate interplay: Investigating the rheological impact of alginates
and their influence on particle mobility. 2014.
47
Rose, M. C.; Voynow, J. A., Respiratory tract mucin genes and mucin glycoproteins in health and
disease. Physiological reviews 2006, Vol. 86, Issue 1, Pages 245-278.
Rowland, R. N.; Woodley, J. F., The stability of liposomes in vitro to pH, bile salts and pancreatic
lipase. Biochimica et Biophysica Acta (BBA)-Lipids and Lipid Metabolism 1980, Vol. 620, Issue 3,
Pages 400-409.
Sanders, N. N.; De Smedt, S. C.; Van Rompaey, E.; Simoens, P.; De Baets, F.; Demeester, J., Cystic
Fibrosis Sputum: a barrier to the transport of nanospheres. American Journal of Respiratory and
Critical Care Medicine 2000, Vol. 162, Issue 5, Pages 1905-1911.
Sanders, N. N.; De Smedt, S. C.; Cheng, S. H.; Demeester, J., Pegylated GL67 lipoplexes retain
their gene transfection activity after exposure to components of CF mucus. Gene Therapy 2002,
Vol. 9, Issue 6, Pages 363-371.
Sanders, N. N.; De Smedt, S. C.; Demeester, J., Mobility and stability of gene complexes in
biogels. Journal of Controlled Release 2003, Vol. 87, Issues 1–3, Pages 117–129.
Sanders, N.; Rudolph, C.; Braeckmans, K.; De Smedt, S. C.; Demeester, J., Extracellular barriers in
respiratory gene therapy. Advanced drug delivery reviews 2009, Vol. 61, Issue 2, Pages 115-127.
Savage, D. C., Chapter 2 - Mucosal Microbiota. In: Mucosal Immunology, Third Edition, edited by
Mestecky, Lamm, Strober, Bienenstock, and McGhee. Academic Press, London 2005. Pages 19-
33.
Saxton, M. J.; Jacobson, K., Single-particle tracking: Applications to membrane dynamics. Annual
Review of Biophysics and Biomolecular Structure 1997, Vol. 26, Pages 373-399.
Schuster, B. S.; Suk, J. S.; Woodworth, G. F.; Hanes, J., Nanoparticle diffusion in respiratory mucus
from humans without lung disease. Biomaterials 2013, Vol. 34, Issue 13, Pages 3439-3446.
Sellers, L. A.; Allen, A.; Morris, E. R.; Ross-Murphy, S. B., Mucus glycoprotein gels. Role of
glycoprotein polymeric structure and carbohydrate side-chains in gel-formation. Carbohydrate
research, 1988, Vol. 178, Issue 1, Pages 93-110.
Sellers, L. A.; Allen, A.; Morris, E. R.; Ross-Murphy, S. B., The rheology of pig small intestinal and
colonic mucus: weakening of gel structure by non-mucin components. Biochimica et Biophysica
Acta (BBA)-General Subjects 1991, Vol. 1115, Issue 2, Pages 174-179.
Selvaggi, L.; Salemme, M.; Vaccaro, C.; Pesce, G.; Rusciano, G.; Sasso, A.; Campanella, C.;
Carotenuto, R., Multiple-particle-tracking to investigate viscoelastic properties in living cells.
Methods 2010, Vol. 51, Issue 1, Pages 20-26.
Sheehan, J. K.; Kirkham, S.; Howard, M.; Woodman, P.; Kutay, S.; Brazeau, C.; Buckley, J.;
Thornton, D. J., Identification of molecular intermediates in the assembly pathway of the
MUC5AC mucin. Journal of Biological Chemistry 2004, Vol. 279, Issue 15, Pages 15698-15705.
Shogren, R.; Gerken, T. A.; Jentoft, N., Role of glycosylation on the conformation and chain
dimensions of O-linked glycoproteins: light-scattering studies of ovine submaxillary mucin.
Biochemistry 1989, Vol. 28, Issue 13, Pages 5525-5536.
Sigma-Aldrich, Mucin from porcine stomach - M2378: FAQ. Available at http://sigma-
aldrich.custhelp.com/app/answers/list/p/7,984 [accessed 03/05 2015]
48
Smidsrød, O.; Moe, S. T., Biopolymer chemistry. Tapir Academic Press, Trondheim 2008.
Strous, G. J.; Dekker, J., Mucin-type glycoproteins. Critical reviews in biochemistry and molecular
biology 1992, Vol. 27, Issues 1-2, Pages 57-92.
Suh, J.; Dawson, M.; Hanes, J., Real-time multiple-particle tracking: applications to drug and gene
delivery. Advanced Drug Delivery Reviews 2005, Vol. 57, Issue 10, Page 1551.
Suh, J., Choy, K.-L., Lai, S. K., Suk, J. S., Tang, B. C., Prabhu, S., & Hanes, J., PEGylation of
nanoparticles improves their cytoplasmic transport. International Journal of Nanomedicine 2007,
Vol. 2, Issue 4, Pages 735–741.
Taylor, C.; Draget, K. I.; Smidsrød, O. A., Use of oligouronates for treating mucus hyperviscosity.
Google Patents 2007.
Thornton, D. J.; Sheehan, J. K., From mucins to mucus: toward a more coherent understanding of
this essential barrier. Proceedings of the American Thoracic Society 2004, Vol. 1, Issue 1, Pages
54-61.
Van Klinken, B. J.; Dekker, J.; Buller, H. A.; Einerhand, A. W., Mucin gene structure and
expression: protection vs. adhesion. American Journal of Physiology-Gastrointestinal and Liver
Physiology 1995, Vol. 269, Issue 5, Pages G613-G627.
Våset, F. S., Biosimilar Mucus as a Model System for Small Intestinal Mucus. 2014.
Wong, T. W., Design of oral insulin delivery systems. Journal of drug targeting 2010, Vol. 18, Issue
2, Pages 79-92.
Woodley, J., Bioadhesion: New possibilities for drug administration? Clinical Pharmacokinetics
2001, Vol. 40, Issue 2, Pages 77-84.
Yang, X.; Forier, K.; Steukers, L.; Van Vlierberghe, S.; Dubruel, P.; Braeckmans, K.; Glorieux, S.;
Nauwynck, H. J., Immobilization of Pseudorabies Virus in Porcine Tracheal Respiratory Mucus
Revealed by Single Particle Tracking. PLoS ONE 2012, Vol. 7, Issue 12.
Yoncheva, K.; Gómez, S.; Campanero, M. A.; Gamazo, C.; Irache, J. M., Bioadhesive properties of
pegylated nanoparticles. Expert opinion on drug delivery, 2005, Vol. 2, Issue 2, Pages 205-218.
Zhang, F.; Liu, M.; Wan, H., Discussion about Several Potential Drawbacks of PEGylated
Therapeutic Proteins. Biological and Pharmaceutical Bulletin 2014, Vol. 37, No. 3, Pages 335-339.
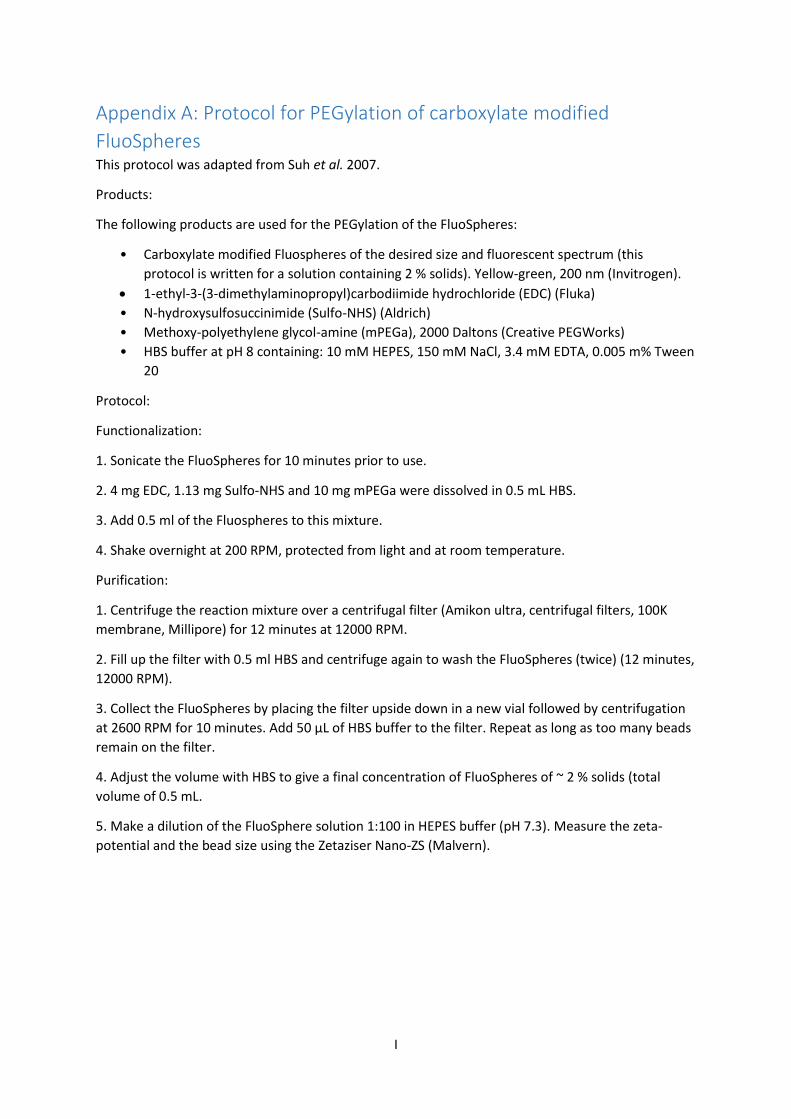
I
Appendix A: Protocol for PEGylation of carboxylate modified
FluoSpheres This protocol was adapted from Suh et al. 2007.
Products:
The following products are used for the PEGylation of the FluoSpheres:
• Carboxylate modified Fluospheres of the desired size and fluorescent spectrum (this
protocol is written for a solution containing 2 % solids). Yellow-green, 200 nm (Invitrogen).
1-ethyl-3-(3-dimethylaminopropyl)carbodiimide hydrochloride (EDC) (Fluka)
• N-hydroxysulfosuccinimide (Sulfo-NHS) (Aldrich)
• Methoxy-polyethylene glycol-amine (mPEGa), 2000 Daltons (Creative PEGWorks)
• HBS buffer at pH 8 containing: 10 mM HEPES, 150 mM NaCl, 3.4 mM EDTA, 0.005 m% Tween
20
Protocol:
Functionalization:
1. Sonicate the FluoSpheres for 10 minutes prior to use.
2. 4 mg EDC, 1.13 mg Sulfo-NHS and 10 mg mPEGa were dissolved in 0.5 mL HBS.
3. Add 0.5 ml of the Fluospheres to this mixture.
4. Shake overnight at 200 RPM, protected from light and at room temperature.
Purification:
1. Centrifuge the reaction mixture over a centrifugal filter (Amikon ultra, centrifugal filters, 100K
membrane, Millipore) for 12 minutes at 12000 RPM.
2. Fill up the filter with 0.5 ml HBS and centrifuge again to wash the FluoSpheres (twice) (12 minutes,
12000 RPM).
3. Collect the FluoSpheres by placing the filter upside down in a new vial followed by centrifugation
at 2600 RPM for 10 minutes. Add 50 µL of HBS buffer to the filter. Repeat as long as too many beads
remain on the filter.
4. Adjust the volume with HBS to give a final concentration of FluoSpheres of ~ 2 % solids (total
volume of 0.5 mL.
5. Make a dilution of the FluoSphere solution 1:100 in HEPES buffer (pH 7.3). Measure the zeta-
potential and the bead size using the Zetaziser Nano-ZS (Malvern).
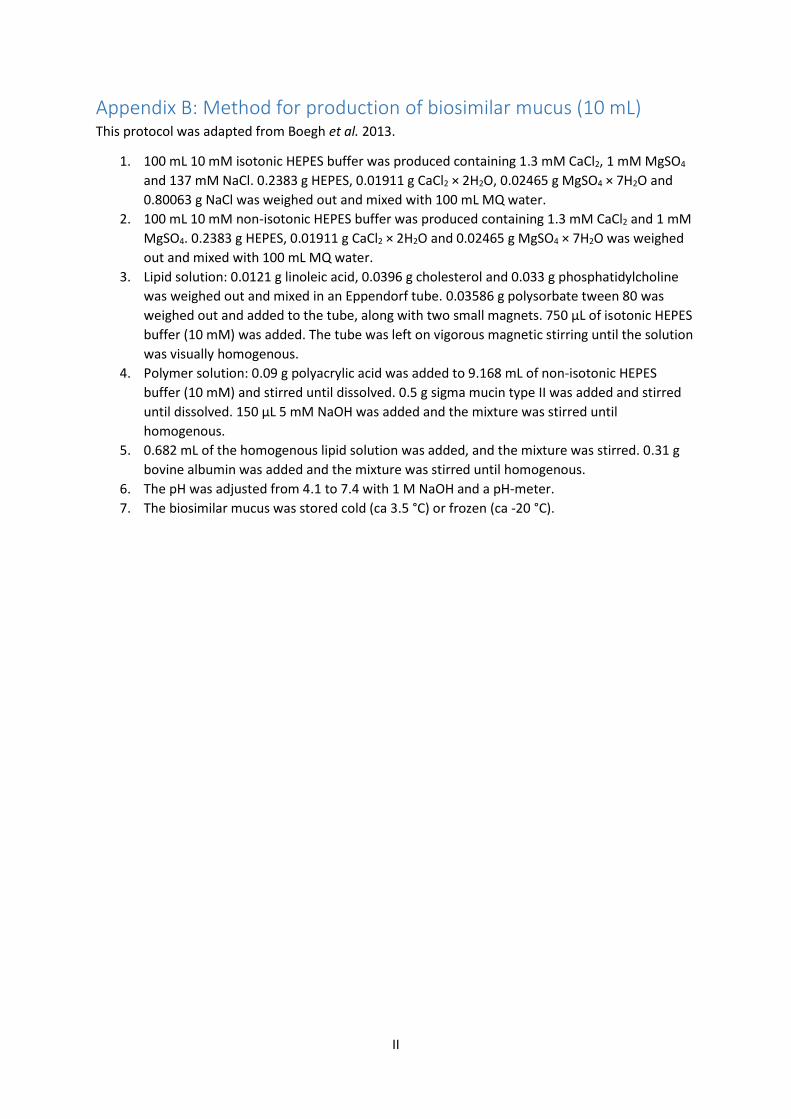
II
Appendix B: Method for production of biosimilar mucus (10 mL) This protocol was adapted from Boegh et al. 2013.
1. 100 mL 10 mM isotonic HEPES buffer was produced containing 1.3 mM CaCl2, 1 mM MgSO4
and 137 mM NaCl. 0.2383 g HEPES, 0.01911 g CaCl2 × 2H2O, 0.02465 g MgSO4 × 7H2O and
0.80063 g NaCl was weighed out and mixed with 100 mL MQ water.
2. 100 mL 10 mM non-isotonic HEPES buffer was produced containing 1.3 mM CaCl2 and 1 mM
MgSO4. 0.2383 g HEPES, 0.01911 g CaCl2 × 2H2O and 0.02465 g MgSO4 × 7H2O was weighed
out and mixed with 100 mL MQ water.
3. Lipid solution: 0.0121 g linoleic acid, 0.0396 g cholesterol and 0.033 g phosphatidylcholine
was weighed out and mixed in an Eppendorf tube. 0.03586 g polysorbate tween 80 was
weighed out and added to the tube, along with two small magnets. 750 µL of isotonic HEPES
buffer (10 mM) was added. The tube was left on vigorous magnetic stirring until the solution
was visually homogenous.
4. Polymer solution: 0.09 g polyacrylic acid was added to 9.168 mL of non-isotonic HEPES
buffer (10 mM) and stirred until dissolved. 0.5 g sigma mucin type II was added and stirred
until dissolved. 150 µL 5 mM NaOH was added and the mixture was stirred until
homogenous.
5. 0.682 mL of the homogenous lipid solution was added, and the mixture was stirred. 0.31 g
bovine albumin was added and the mixture was stirred until homogenous.
6. The pH was adjusted from 4.1 to 7.4 with 1 M NaOH and a pH-meter.
7. The biosimilar mucus was stored cold (ca 3.5 °C) or frozen (ca -20 °C).
III
Appendix C: Overview of the setup of all the experiments performed An overview of all the performed experiments with information about type of nanoparticle, type of
mucus, and whether the particles were diluted in G-block solutions or in physiological saline (NaCl),
can be found in Table C.1.
Table C.1: An overview of all the performed experiments. The numbers 1 to 8 refer to the wells on
an 8-well plate, in which the experiments were prepared.
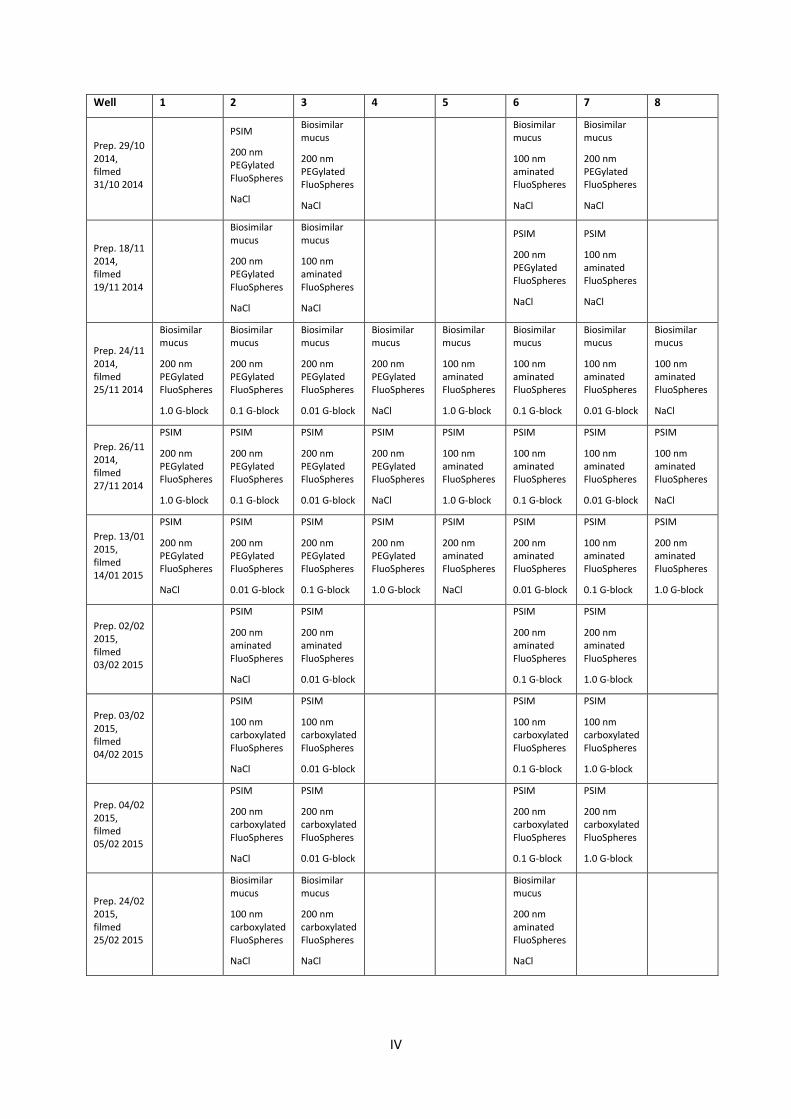
IV
Well 1 2 3 4 5 6 7 8
Prep. 29/10 2014, filmed 31/10 2014
PSIM
200 nm PEGylated FluoSpheres
NaCl
Biosimilar mucus
200 nm PEGylated FluoSpheres
NaCl
Biosimilar mucus
100 nm aminated FluoSpheres
NaCl
Biosimilar mucus
200 nm PEGylated FluoSpheres
NaCl
Prep. 18/11 2014, filmed 19/11 2014
Biosimilar mucus
200 nm PEGylated FluoSpheres
NaCl
Biosimilar mucus
100 nm aminated FluoSpheres
NaCl
PSIM
200 nm PEGylated FluoSpheres
NaCl
PSIM
100 nm aminated FluoSpheres
NaCl
Prep. 24/11 2014, filmed 25/11 2014
Biosimilar mucus
200 nm PEGylated FluoSpheres
1.0 G-block
Biosimilar mucus
200 nm PEGylated FluoSpheres
0.1 G-block
Biosimilar mucus
200 nm PEGylated FluoSpheres
0.01 G-block
Biosimilar mucus
200 nm PEGylated FluoSpheres
NaCl
Biosimilar mucus
100 nm aminated FluoSpheres
1.0 G-block
Biosimilar mucus
100 nm aminated FluoSpheres
0.1 G-block
Biosimilar mucus
100 nm aminated FluoSpheres
0.01 G-block
Biosimilar mucus
100 nm aminated FluoSpheres
NaCl
Prep. 26/11 2014, filmed 27/11 2014
PSIM
200 nm PEGylated FluoSpheres
1.0 G-block
PSIM
200 nm PEGylated FluoSpheres
0.1 G-block
PSIM
200 nm PEGylated FluoSpheres
0.01 G-block
PSIM
200 nm PEGylated FluoSpheres
NaCl
PSIM
100 nm aminated FluoSpheres
1.0 G-block
PSIM
100 nm aminated FluoSpheres
0.1 G-block
PSIM
100 nm aminated FluoSpheres
0.01 G-block
PSIM
100 nm aminated FluoSpheres
NaCl
Prep. 13/01 2015, filmed 14/01 2015
PSIM
200 nm PEGylated FluoSpheres
NaCl
PSIM
200 nm PEGylated FluoSpheres
0.01 G-block
PSIM
200 nm PEGylated FluoSpheres
0.1 G-block
PSIM
200 nm PEGylated FluoSpheres
1.0 G-block
PSIM
200 nm aminated FluoSpheres
NaCl
PSIM
200 nm aminated FluoSpheres
0.01 G-block
PSIM
100 nm aminated FluoSpheres
0.1 G-block
PSIM
200 nm aminated FluoSpheres
1.0 G-block
Prep. 02/02 2015, filmed 03/02 2015
PSIM
200 nm aminated FluoSpheres
NaCl
PSIM
200 nm aminated FluoSpheres
0.01 G-block
PSIM
200 nm aminated FluoSpheres
0.1 G-block
PSIM
200 nm aminated FluoSpheres
1.0 G-block
Prep. 03/02 2015, filmed 04/02 2015
PSIM
100 nm carboxylated FluoSpheres
NaCl
PSIM
100 nm carboxylated FluoSpheres
0.01 G-block
PSIM
100 nm carboxylated FluoSpheres
0.1 G-block
PSIM
100 nm carboxylated FluoSpheres
1.0 G-block
Prep. 04/02 2015, filmed 05/02 2015
PSIM
200 nm carboxylated FluoSpheres
NaCl
PSIM
200 nm carboxylated FluoSpheres
0.01 G-block
PSIM
200 nm carboxylated FluoSpheres
0.1 G-block
PSIM
200 nm carboxylated FluoSpheres
1.0 G-block
Prep. 24/02 2015, filmed 25/02 2015
Biosimilar mucus
100 nm carboxylated FluoSpheres
NaCl
Biosimilar mucus
200 nm carboxylated FluoSpheres
NaCl
Biosimilar mucus
200 nm aminated FluoSpheres
NaCl
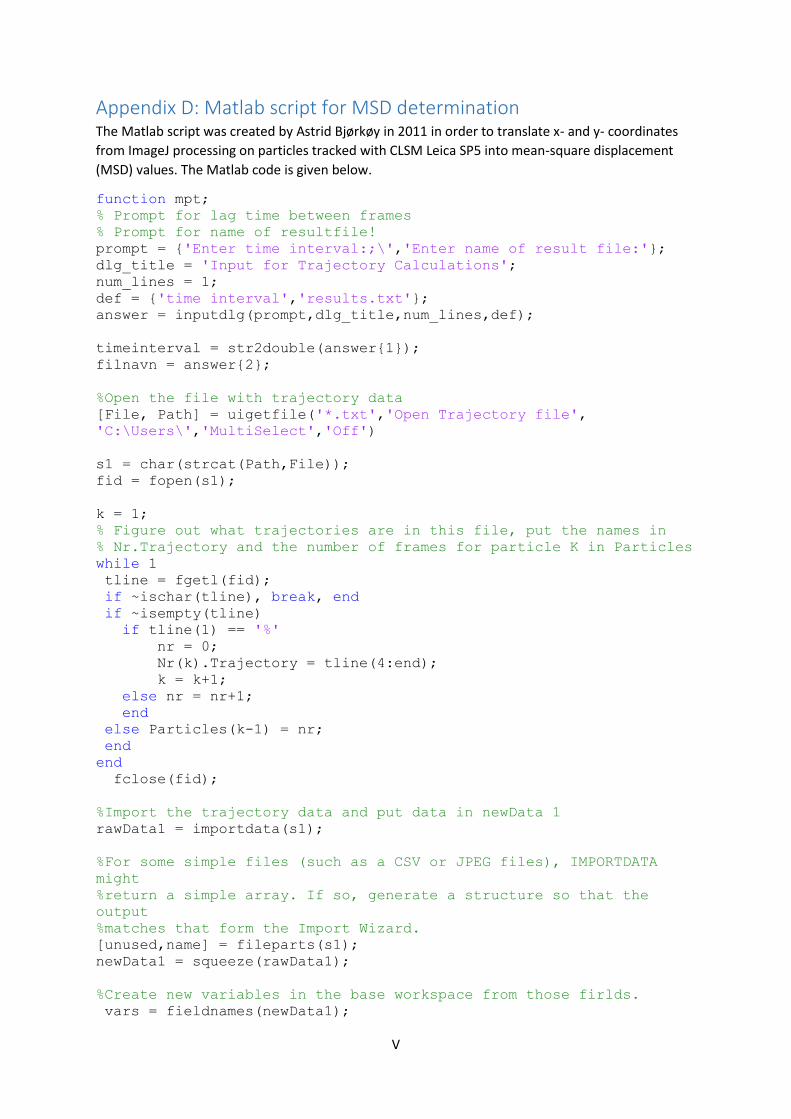
V
Appendix D: Matlab script for MSD determination The Matlab script was created by Astrid Bjørkøy in 2011 in order to translate x- and y- coordinates
from ImageJ processing on particles tracked with CLSM Leica SP5 into mean-square displacement
(MSD) values. The Matlab code is given below.
function mpt;
% Prompt for lag time between frames
% Prompt for name of resultfile!
prompt = {'Enter time interval:;\','Enter name of result file:'};
dlg_title = 'Input for Trajectory Calculations';
num_lines = 1;
def = {'time interval','results.txt'};
answer = inputdlg(prompt,dlg_title,num_lines,def);
timeinterval = str2double(answer{1});
filnavn = answer{2};
%Open the file with trajectory data
[File, Path] = uigetfile('*.txt','Open Trajectory file',
'C:\Users\','MultiSelect','Off')
s1 = char(strcat(Path,File));
fid = fopen(s1);
k = 1;
% Figure out what trajectories are in this file, put the names in
% Nr.Trajectory and the number of frames for particle K in Particles
while 1
tline = fgetl(fid);
if ~ischar(tline), break, end
if ~isempty(tline)
if tline(1) == '%'
nr = 0;
Nr(k).Trajectory = tline(4:end);
k = k+1;
else nr = nr+1;
end
else Particles(k-1) = nr;
end
end
fclose(fid);
%Import the trajectory data and put data in newData 1
rawData1 = importdata(s1);
%For some simple files (such as a CSV or JPEG files), IMPORTDATA
might
%return a simple array. If so, generate a structure so that the
output
%matches that form the Import Wizard.
[unused,name] = fileparts(s1);
newData1 = squeeze(rawData1);
%Create new variables in the base workspace from those firlds.
vars = fieldnames(newData1);
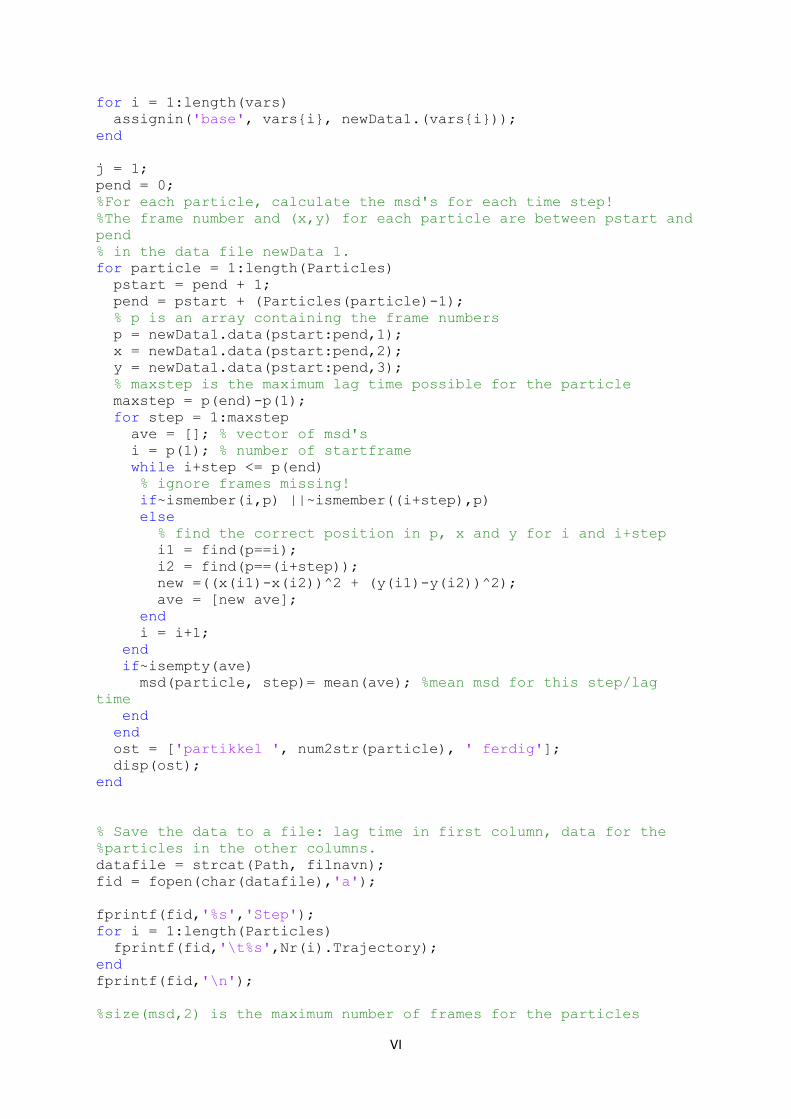
VI
for i = 1:length(vars)
assignin('base', vars{i}, newData1.(vars{i}));
end
j = 1;
pend = 0;
%For each particle, calculate the msd's for each time step!
%The frame number and (x,y) for each particle are between pstart and
pend
% in the data file newData 1.
for particle = 1:length(Particles)
pstart = pend + 1;
pend = pstart + (Particles(particle)-1);
% p is an array containing the frame numbers
p = newData1.data(pstart:pend,1);
x = newData1.data(pstart:pend,2);
y = newData1.data(pstart:pend,3);
% maxstep is the maximum lag time possible for the particle
maxstep = p(end)-p(1);
for step = 1:maxstep
ave = []; % vector of msd's
i = p(1); % number of startframe
while i+step <= p(end)
% ignore frames missing!
if~ismember(i,p) ||~ismember((i+step),p)
else
% find the correct position in p, x and y for i and i+step
i1 = find(p==i);
i2 = find(p==(i+step));
new =((x(i1)-x(i2))^2 + (y(i1)-y(i2))^2);
ave = [new ave];
end
i = i+1;
end
if~isempty(ave)
msd(particle, step)= mean(ave); %mean msd for this step/lag
time
end
end
ost = ['partikkel ', num2str(particle), ' ferdig'];
disp(ost);
end
% Save the data to a file: lag time in first column, data for the
%particles in the other columns.
datafile = strcat(Path, filnavn);
fid = fopen(char(datafile),'a');
fprintf(fid,'%s','Step');
for i = 1:length(Particles)
fprintf(fid,'\t%s',Nr(i).Trajectory);
end
fprintf(fid,'\n');
%size(msd,2) is the maximum number of frames for the particles
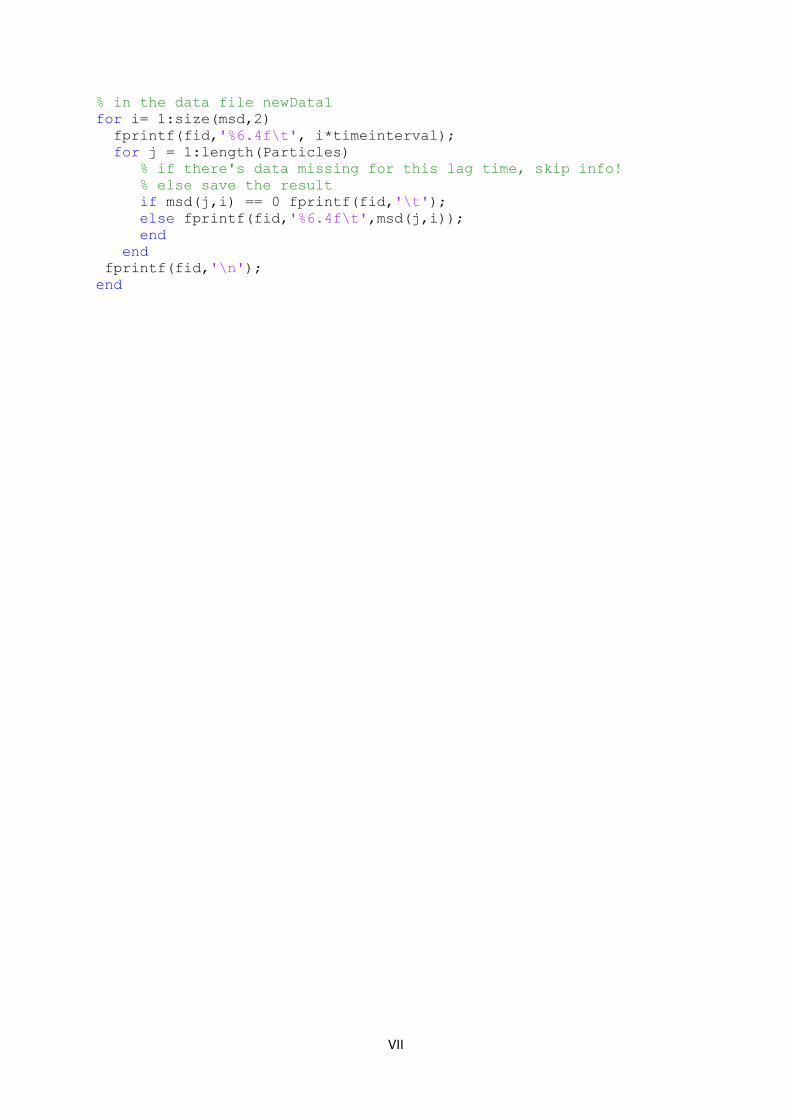
VII
% in the data file newData1
for i= 1:size(msd,2)
fprintf(fid,'%6.4f\t', i*timeinterval);
for j = 1:length(Particles)
% if there's data missing for this lag time, skip info!
% else save the result
if msd(j,i) == 0 fprintf(fid,'\t');
else fprintf(fid,'%6.4f\t',msd(j,i));
end
end
fprintf(fid,'\n');
end
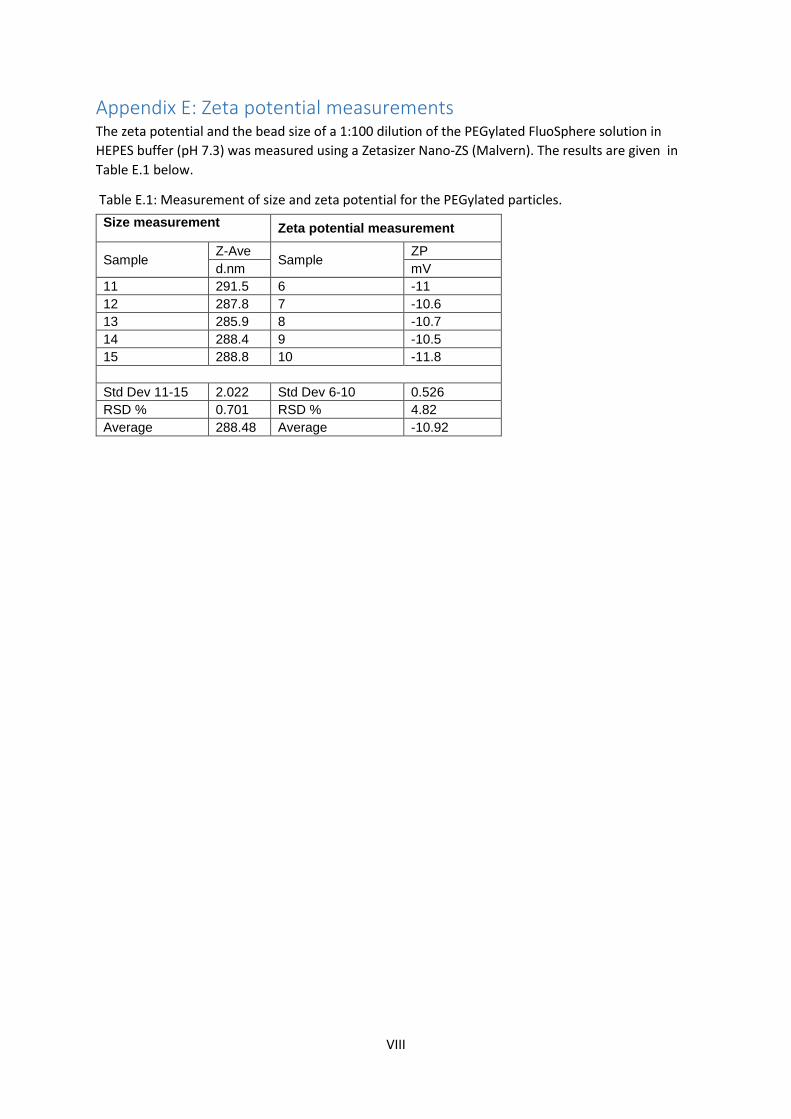
VIII
Appendix E: Zeta potential measurements The zeta potential and the bead size of a 1:100 dilution of the PEGylated FluoSphere solution in
HEPES buffer (pH 7.3) was measured using a Zetasizer Nano-ZS (Malvern). The results are given in
Table E.1 below.
Table E.1: Measurement of size and zeta potential for the PEGylated particles.
Size measurement Zeta potential measurement
Sample Z-Ave
Sample ZP
d.nm mV
11 291.5 6 -11
12 287.8 7 -10.6
13 285.9 8 -10.7
14 288.4 9 -10.5
15 288.8 10 -11.8
Std Dev 11-15 2.022 Std Dev 6-10 0.526
RSD % 0.701 RSD % 4.82
Average 288.48 Average -10.92