Embed Size (px)
Citation preview

Pender County SchoolsPage 1 Oct 3, 2011 thru Oct 31, 2011 Spreadsheet - Portion Values Jan 18, 2012
ES Lunch Base
Portion Plan Cals Cholst Sodm Fiber Iron Calcm Vit-A Vit-A Vit-C Protn Carb T-Fat S-Fat Tr-Fat¹Size Qty (kcal) (mg) (mg) (g) (mg) (mg) (IU) (RE) (mg) (g) (g) (g) (g) (g)
Mon - 10/03/2011ES Lunch BaseCORN DOG, Turkey AP B 2.0SALAD Cobb AP B 2.0ROLL, DINNER AP WBEANS, Green Frozen 3/8cHam w/AM WP 2.0APPLESAUCE, Sour 1/2cBANANA, Fresh Regular 1/2 cupORANGES, 138 Quarters1/2 cupAPPLES, 163ct Whole 3/8cSide Salad 1/2 cupCARROTS, Fresh Baby 3/8c
TOMATO, Fresh Cherry 3/8cCUCUMBER, Slices 3/8cWG CHIX Patty, SSBEEF Burger CHZAM AP B 2.5SANDWICH, PB&J D Deck WheatDRES_Ranch, Lite, 1/8 cupDRES_Italian, Lite 1/8 cupCOND_Mayo, LiteCOND_Ketchup 1/4 cupCOND_Mustard, Yellow 1/8 cupMILK, 1% White 8ozMILK, Skim, Chocolate
Total1 Each1 Each1 each3/8 Cup1 Each1/2 Cup1 EACH1 each1 each1 Cup3/8 Cup, 10 ea3/8 Cup3/8 Cup1 Each1 Each1 Each1/8 cup1/8 cup1 Tbsp1/4 cup1/8 cup1 Each1 Each
4001752020
35020
15011010010010050
1550
1006025
2001510
16050
160240
2701637723
340729063561820
107
44132980110029356322
10390
305000
46000000
00
25530
100500
125
74061896
1401135
52101
1044
21
875919691290353130765157108125
1.001.231.081.582.002.232.633.202.590.831.64
0.460.404.882.196.700.000.000.000.580.000.000.00
2.702.201.010.352.030.000.260.130.130.300.50
0.160.124.103.863.320.000.000.000.320.000.070.00
80.0119.449.922.1
172.10.05.1
53.46.5
16.618.1
9.17.9
127.5174.2146.5
0.00.00.06.10.0
306.2250.0
01028
0345304
124865
30058
8047819
45741
123252
0000
4360
480500
0206
03261
2508
605
1741564
1134
25500000
2020
145100
0.05.750.0
2.150.0
14.988.79
70.964.967.611.47
6.861.811.480.0
0.150.00.00.0
0.590.00.01.2
10.018.472.440.78
18.970.01.1
1.250.280.830.36
0.460.335.39
23.9220.18
1.00.00.0
0.510.0
8.269.0
27.05.4
13.043.08
33.6318.6523.0715.6714.883.494.67
2.291.2246.5
30.54103.97
1.01.911.0
17.780.0
12.2313.0
14.07.651.791.14
15.330.0
0.330.160.180.0
0.07
0.00.09
18.4512.0134.7310.02.383.5
0.090.0
2.380.0
4.003.540.420.556.470.000.110.010.030.000.01
0.000.013.085.157.601.500.001.000.010.001.550.00
0.000.000.00
*0.000.000.000.000.000.000.000.00
0.000.000.000.000.000.000.000.000.000.000.000.00
Weighted Daily Average% of Calories
642 45 1572 7.72 4.01 437.6 2880 609 33.09 23.6514.7%
82.8851.7%
23.3132.7%
6.218.7%
*0.00*0.0%
*N/A* - denotes a nutrient that is either missing o r incomplete for an individual ingredient* - denotes combined nutrient totals with either mi ssing or incomplete nutrient data¹ - denotes optional nutrient values
NOTICE: The data contained within this report and the NUTRIKIDS® Menu Planning and Nutritional Analys is software should not be used for and does not pro vide menu planning for a child with a medical condition or food allergy. Ingredi ents and menu items are subject to change or substi tution without notice. Please consult a medical pr ofessional for assistance in planning for or treating medical conditions.

Pender County SchoolsPage 2 Oct 3, 2011 thru Oct 31, 2011 Spreadsheet - Portion Values Jan 18, 2012
ES Lunch Base
Portion Plan Cals Cholst Sodm Fiber Iron Calcm Vit-A Vit-A Vit-C Protn Carb T-Fat S-Fat Tr-Fat¹Size Qty (kcal) (mg) (mg) (g) (mg) (mg) (IU) (RE) (mg) (g) (g) (g) (g) (g)
Tue - 10/04/2011ES Lunch BaseCHICKEN 8ct Rotis. SC B 2.0SALAD Cobb AP B 2.0ROLL, DINNER AP WBEANS, BAKED AP 3/8cHam w/AM WP 2.0PEACHES, Diced w/ Juice 3/8cBANANA, Fresh Regular 1/2 cupORANGES, 138 Quarters1/2 cupAPPLES, 163ct Whole 3/8cSide Salad 1/2 cupCARROTS, Fresh Baby 3/8c
TOMATO, Fresh Cherry 3/8cCUCUMBER, Slices 3/8cWG CHIX Patty, SSFRANK, TURKEY 8-1 B 2.0SANDWICH, PB&J D Deck WheatDRES_Ranch, Lite, 1/8 cupDRES_Italian, Lite 1/8 cupCOND_Mayo, LiteCOND_Ketchup 1/4 cupCOND_Mustard, Yellow 1/8 cupMILK, 1% White 8ozMILK, Skim, Chocolate
Total1 Each1 Each1 each3/8 cup1 Each3/8 Cup1 EACH1 each1 each1 Cup3/8 Cup, 10 ea3/8 Cup3/8 Cup1 Each1 Each1 Each1/8 cup1/8 cup1 Tbsp1/4 cup1/8 cup1 Each1 Each
40020020
22035015
10011010010010050
1550
1004520
2001510
15050
240160
14416377
119340399063561820
107
44129280110029356322
10390
685000
46000000
00
25500
100500
125
31561896
4681135
4101
1044
21
875981691290353130765157108125
0.001.231.084.252.000.002.633.202.590.831.64
0.460.404.881.076.700.000.000.000.580.000.000.00
0.922.201.011.532.030.000.260.130.130.300.50
0.160.124.102.773.320.000.000.000.320.000.070.00
11.4119.449.934.0
172.10.05.1
53.46.5
16.618.1
9.17.9
127.5150.0146.5
0.00.00.06.10.0
306.2250.0
401028
00
30423565
30058
8047819
45741
123348
0000
4360
480500
12206
00
61478
605
1741564
1134
25700000
2020
145100
0.05.750.00.00.0
0.948.79
70.964.967.611.47
6.861.811.480.0
0.150.00.00.0
0.590.00.01.2
21.9618.472.445.1
18.970.01.1
1.250.280.830.36
0.460.335.39
11.8120.18
1.00.00.0
0.510.0
8.269.0
0.05.4
13.0424.6633.639.38
23.0715.6714.883.494.67
2.291.2246.5
27.22103.97
1.01.911.0
17.780.0
12.2313.0
5.637.651.790.85
15.330.0
0.330.160.180.0
0.07
0.00.09
18.4514.1534.7310.02.383.5
0.090.0
2.380.0
1.553.540.420.006.470.000.110.010.030.000.01
0.000.013.084.547.601.500.001.000.010.001.550.00
*0.000.000.000.000.000.000.000.000.000.000.00
0.000.000.000.000.000.000.000.000.000.000.000.00
Weighted Daily Average% of Calories
672 64 1649 8.99 4.50 441.5 2171 509 25.57 32.3519.3%
87.9952.4%
20.2727.2%
4.846.5%
*0.00*0.0%
*N/A* - denotes a nutrient that is either missing o r incomplete for an individual ingredient* - denotes combined nutrient totals with either mi ssing or incomplete nutrient data¹ - denotes optional nutrient values
NOTICE: The data contained within this report and the NUTRIKIDS® Menu Planning and Nutritional Analys is software should not be used for and does not pro vide menu planning for a child with a medical condition or food allergy. Ingredi ents and menu items are subject to change or substi tution without notice. Please consult a medical pr ofessional for assistance in planning for or treating medical conditions.

Pender County SchoolsPage 3 Oct 3, 2011 thru Oct 31, 2011 Spreadsheet - Portion Values Jan 18, 2012
ES Lunch Base
Portion Plan Cals Cholst Sodm Fiber Iron Calcm Vit-A Vit-A Vit-C Protn Carb T-Fat S-Fat Tr-Fat¹Size Qty (kcal) (mg) (mg) (g) (mg) (mg) (IU) (RE) (mg) (g) (g) (g) (g) (g)
Wed - 10/05/2011ES Lunch BaseRIBLET, Pork BBQ SS B 2.0SALAD Cobb AP B 2.0ROLL, DINNER AP WCARROTS, Sliced cooked 3/8cHam w/AM WP 2.0FRUIT COCKTAIL, w/Juice 3/8cBANANA, Fresh Regular 1/2 cupORANGES, 138 Quarters1/2 cupAPPLES, 163ct Whole 3/8cSide Salad 1/2 cupCARROTS, Fresh Baby 3/8c
TOMATO, Fresh Cherry 3/8cCUCUMBER, Slices 3/8cWG CHIX Patty, SSBEEF Burger CHZAM AP B 2.5SANDWICH, PB&J D Deck WheatDRES_Ranch, Lite, 1/8 cupDRES_Italian, Lite 1/8 cupCOND_Mayo, LiteCOND_Ketchup 1/4 cupCOND_Mustard, Yellow 1/8 cupMILK, 1% White 8ozMILK, Skim, Chocolate
Total1 Each1 Each1 each3/8 Cup1 Each3/8 Cup1 EACH1 each1 each1 Cup3/8 Cup, 10 ea3/8 Cup3/8 Cup1 Each1 Each1 Each1/8 cup1/8 cup1 Tbsp1/4 cup1/8 cup1 Each1 Each
4001502020
25015
10011010010010050
1550
1256525
2001510
15050
160240
2821637734
340379063561820
107
44132980110029356322
10390
455000
46000000
00
25530
100500
125
62461896
2071135
8101
1044
21
875919691290353130765157108125
1.571.231.082.192.000.822.633.202.590.831.64
0.460.404.882.196.700.000.000.000.580.000.000.00
2.772.201.010.352.030.000.260.130.130.300.50
0.160.124.103.863.320.000.000.000.320.000.070.00
110.4119.449.923.2
172.10.05.1
53.46.5
16.618.1
9.17.9
127.5174.2146.5
0.00.00.06.10.0
306.2250.0
2001028
011274
30416465
30058
8047819
45741
123252
0000
4360
480500
40206
01184
61338
605
1741564
1134
25500000
2020
145100
2.45.750.0
1.520.0
1.978.79
70.964.967.611.47
6.861.811.480.0
0.150.00.00.0
0.590.00.01.2
16.8518.472.440.38
18.970.01.1
1.250.280.830.36
0.460.335.39
23.9220.18
1.00.00.0
0.510.0
8.269.0
32.235.4
13.045.12
33.639.85
23.0715.6714.883.494.67
2.291.2246.5
30.54103.97
1.01.911.0
17.780.0
12.2313.0
11.217.651.791.48
15.330.0
0.330.160.180.0
0.07
0.00.09
18.4512.0134.7310.02.383.5
0.090.0
2.380.0
3.563.540.420.606.470.000.110.010.030.000.01
0.000.013.085.157.601.500.001.000.010.001.550.00
0.000.000.00
*0.000.000.000.000.000.000.000.00
0.000.000.000.000.000.000.000.000.000.000.000.00
Weighted Daily Average% of Calories
639 50 1504 7.52 4.06 447.0 9268 1247 28.01 25.5416.0%
81.5651.1%
22.4231.6%
5.878.3%
*0.00*0.0%
*N/A* - denotes a nutrient that is either missing o r incomplete for an individual ingredient* - denotes combined nutrient totals with either mi ssing or incomplete nutrient data¹ - denotes optional nutrient values
NOTICE: The data contained within this report and the NUTRIKIDS® Menu Planning and Nutritional Analys is software should not be used for and does not pro vide menu planning for a child with a medical condition or food allergy. Ingredi ents and menu items are subject to change or substi tution without notice. Please consult a medical pr ofessional for assistance in planning for or treating medical conditions.

Pender County SchoolsPage 4 Oct 3, 2011 thru Oct 31, 2011 Spreadsheet - Portion Values Jan 18, 2012
ES Lunch Base
Portion Plan Cals Cholst Sodm Fiber Iron Calcm Vit-A Vit-A Vit-C Protn Carb T-Fat S-Fat Tr-Fat¹Size Qty (kcal) (mg) (mg) (g) (mg) (mg) (IU) (RE) (mg) (g) (g) (g) (g) (g)
Thu - 10/06/2011ES Lunch BaseTACO, BEEF SC, SOFT SHELLSALAD Cobb AP B 2.0ROLL, DINNER AP WBEANS, Refried AP 3/8cHam w/AM WP 2.0PEARS, Diced w/Juice 3/8cBANANA, Fresh Regular 1/2 cupORANGES, 138 Quarters1/2 cupAPPLES, 163ct Whole 3/8cSide Salad 1/2 cupCARROTS, Fresh Baby 3/8c
TOMATO, Fresh Cherry 3/8cCUCUMBER, Slices 3/8cWG CHIX Patty, SSFRANK, TURKEY 8-1 B 2.0SANDWICH, PB&J D Deck WheatDRES_Ranch, Lite, 1/8 cupDRES_Italian, Lite 1/8 cupCOND_Mayo, LiteCOND_Ketchup 1/4 cupCOND_Mustard, Yellow 1/8 cupMILK, 1% White 8ozMILK, Skim, Chocolate
Total1 Each1 Each1 each3/8 cup1 Each3/8 cup1 EACH1 each1 each1 Cup3/8 Cup, 10 ea3/8 Cup3/8 Cup1 Each1 Each1 Each1/8 cup1/8 cup1 Tbsp1/4 cup1/8 cup1 Each1 Each
4002001515
20015
10011010010010050
1550659015
2001510
10050
160240
32916377
113340579063561820
107
44129280110029356322
10390
765000
46000000
00
25500
100500
125
39661896
3401135
5101
1044
21
875981691290353130765157108125
0.501.231.087.282.001.592.633.202.590.831.64
0.460.404.881.076.700.000.000.000.580.000.000.00
2.422.201.011.462.030.280.260.130.130.300.50
0.160.124.102.773.320.000.000.000.320.000.070.00
221.5119.449.932.4
172.15.05.1
53.46.5
16.618.1
9.17.9
127.5150.0146.5
0.00.00.06.10.0
306.2250.0
3001028
00
3040
6530058
8047819
45741
123348
0000
4360
480500
60206
00
6108
605
1741564
1134
25700000
2020
145100
0.05.750.0
1.940.0
0.698.79
70.964.967.611.47
6.861.811.480.0
0.150.00.00.0
0.590.00.01.2
23.4218.472.446.47
18.970.191.1
1.250.280.830.36
0.460.335.39
11.8120.18
1.00.00.0
0.510.0
8.269.0
14.05.4
13.0418.6133.6315.0523.0715.6714.883.494.67
2.291.2246.5
27.22103.97
1.01.911.0
17.780.0
12.2313.0
19.467.651.791.62
15.330.030.330.160.180.0
0.07
0.00.09
18.4514.1534.7310.02.383.5
0.090.0
2.380.0
8.533.540.420.006.470.000.110.010.030.000.01
0.000.013.084.547.601.500.001.000.010.001.550.00
0.550.000.000.000.000.000.000.000.000.000.00
0.000.000.000.000.000.000.000.000.000.000.000.00
Weighted Daily Average% of Calories
653 70 1327 8.53 4.03 499.1 2207 490 26.44 31.1119.1%
73.0144.7%
25.3134.9%
7.9010.9%
0.280.4%
*N/A* - denotes a nutrient that is either missing o r incomplete for an individual ingredient* - denotes combined nutrient totals with either mi ssing or incomplete nutrient data¹ - denotes optional nutrient values
NOTICE: The data contained within this report and the NUTRIKIDS® Menu Planning and Nutritional Analys is software should not be used for and does not pro vide menu planning for a child with a medical condition or food allergy. Ingredi ents and menu items are subject to change or substi tution without notice. Please consult a medical pr ofessional for assistance in planning for or treating medical conditions.

Pender County SchoolsPage 5 Oct 3, 2011 thru Oct 31, 2011 Spreadsheet - Portion Values Jan 18, 2012
ES Lunch Base
Portion Plan Cals Cholst Sodm Fiber Iron Calcm Vit-A Vit-A Vit-C Protn Carb T-Fat S-Fat Tr-Fat¹Size Qty (kcal) (mg) (mg) (g) (mg) (mg) (IU) (RE) (mg) (g) (g) (g) (g) (g)
Fri - 10/07/2011ES Lunch BasePIZZA AP 50/50 Smart Chz WdgSALAD Cobb AP B 2.0ROLL, DINNER AP WCORN, Frozen 3/8cHam w/AM WP 2.0PINEAPPLE, Chunks w/Juice 3/8cBANANA, Fresh Regular 1/2 cupORANGES, 138 Quarters1/2 cupAPPLES, 163ct Whole 3/8cSide Salad 1/2 cupCARROTS, Fresh Baby 3/8c
TOMATO, Fresh Cherry 3/8cCUCUMBER, Slices 3/8cWG CHIX Patty, SSBEEF Burger CHZAM AP B 2.5SANDWICH, PB&J D Deck WheatDRES_Ranch, Lite, 1/8 cupDRES_Italian, Lite 1/8 cupCOND_Mayo, LiteCOND_Ketchup 1/4 cupCOND_Mustard, Yellow 1/8 cupMILK, 1% White 8ozMILK, Skim, Chocolate
Total1 Each1 Each1 each3/8 Cup1 Each3/8 Cup1 EACH1 each1 each1 Cup3/8 Cup, 10 ea3/8 Cup3/8 Cup1 Each1 Each1 Each1/8 cup1/8 cup1 Tbsp1/4 cup1/8 cup1 Each1 Each
4002501010
35010
15011010010010050
1550606010
2001510
10050
160240
3101637759
340329063561820
107
44132980110029356322
10390
155000
46000000
00
25530
100500
125
67061896
1651135
5101
1044
21
875919691290353130765157108125
2.001.231.081.502.000.452.633.202.590.831.64
0.460.404.882.196.700.000.000.000.580.000.000.00
2.702.201.010.292.030.330.260.130.130.300.50
0.160.124.103.863.320.000.000.000.320.000.070.00
300.0119.449.91.9
172.19.15.1
53.46.5
16.618.1
9.17.9
127.5174.2146.5
0.00.00.06.10.0
306.2250.0
5001028
01803044565
30058
8047819
45741
123252
0000
4360
480500
100206
0256198
605
1741564
1134
25500000
2020
145100
0.05.750.0
2.180.0
4.098.79
70.964.967.611.47
6.861.811.480.0
0.150.00.00.0
0.590.00.01.2
15.018.472.441.59
18.970.451.1
1.250.280.830.36
0.460.335.39
23.9220.18
1.00.00.0
0.510.0
8.269.0
38.05.4
13.0411.6733.637.72
23.0715.6714.883.494.67
2.291.2246.5
30.54103.97
1.01.911.0
17.780.0
12.2313.0
11.07.651.791.53
15.330.0
0.330.160.180.0
0.07
0.00.09
18.4512.0134.7310.02.383.5
0.090.0
2.380.0
4.003.540.420.606.470.000.110.010.030.000.01
0.000.013.085.157.601.500.001.000.010.001.550.00
0.000.000.00
*0.000.000.000.000.000.000.000.00
0.000.000.000.000.000.000.000.000.000.000.000.00
Weighted Daily Average% of Calories
636 36 1397 6.86 3.88 548.1 2485 536 28.65 27.1617.1%
85.7253.9%
20.6229.2%
6.158.7%
*0.00*0.0%
*N/A* - denotes a nutrient that is either missing o r incomplete for an individual ingredient* - denotes combined nutrient totals with either mi ssing or incomplete nutrient data¹ - denotes optional nutrient values
NOTICE: The data contained within this report and the NUTRIKIDS® Menu Planning and Nutritional Analys is software should not be used for and does not pro vide menu planning for a child with a medical condition or food allergy. Ingredi ents and menu items are subject to change or substi tution without notice. Please consult a medical pr ofessional for assistance in planning for or treating medical conditions.

Pender County SchoolsPage 6 Oct 3, 2011 thru Oct 31, 2011 Spreadsheet - Portion Values Jan 18, 2012
ES Lunch Base
Portion Plan Cals Cholst Sodm Fiber Iron Calcm Vit-A Vit-A Vit-C Protn Carb T-Fat S-Fat Tr-Fat¹Size Qty (kcal) (mg) (mg) (g) (mg) (mg) (IU) (RE) (mg) (g) (g) (g) (g) (g)
Mon - 10/10/2011ES Lunch BaseFISH, Nugget (4) AP B 2.0
SALAD Chix Brd Chef AP B 2.0ROLL, DINNER AP WCARROTS, Sliced cooked 3/8cTurkey w/AM, Sub B 2.0APPLESAUCE, Canned 3/8cBANANA, Fresh Regular 1/2 cupORANGES, 138 Quarters1/2 cupAPPLES, 163ct Whole 3/8cSide Salad 1/2 cupCARROTS, Fresh Baby 3/8c
TOMATO, Fresh Cherry 3/8cCUCUMBER, Slices 3/8cWG CHIX Patty, SSBEEF Burger CHZAM AP B 2.5SANDWICH, PB&J D Deck WheatDRES_Ranch, Lite, 1/8 cupDRES_Italian, Lite 1/8 cupCOND_Mayo, LiteCOND_Ketchup 1/4 cupCOND_Mustard, Yellow 1/8 cupCOND PC Sauce, Tartar 12gHeinzMILK, 1% White 8ozMILK, Skim, Chocolate
Total4 Each,@ 1oz1 Each1 each3/8 Cup1 Each3/8 Cup1 EACH1 each1 each1 Cup3/8 Cup, 10 ea3/8 Cup3/8 Cup1 Each1 Each1 Each1/8 cup1/8 cup1 Tbsp1/4 cup1/8 cuppacket1 Each1 Each
400175
2525
25015
10011010010010050
1550
1006025
2001510
16050
100160240
260
2627734
308429063561820
107
4413298011002935632260
10390
30
3500
29000000
00
25530
1005005
125
360
47096
2071151
17101
1044
21
875919691290353130765157100108125
1.00
2.801.082.191.101.672.633.202.590.831.64
0.460.404.882.196.700.000.000.000.580.000.000.000.00
0.72
1.631.010.352.400.000.260.130.130.300.50
0.160.124.103.863.320.000.000.000.320.000.000.070.00
200.0
245.049.923.2
179.20.05.1
53.46.5
16.618.1
9.17.9
127.5174.2146.5
0.00.00.06.10.00.0
306.2250.0
0
11910
11274312
065
30058
8047819
45741
123252
0000
43600
480500
0
2380
11846208
605
1741564
1134
25500000
20200
145100
0.0
6.480.0
1.520.00.0
8.7970.964.967.611.47
6.861.811.480.0
0.150.00.00.0
0.590.00.00.01.2
18.0
8.02.440.38
16.890.01.1
1.250.280.830.36
0.460.335.39
23.9220.18
1.00.00.0
0.510.00.0
8.269.0
17.0
13.2513.045.12
31.2910.8823.0715.6714.883.494.67
2.291.2246.5
30.54103.97
1.01.911.0
17.780.01.0
12.2313.0
13.0
15.541.791.48
13.260.0
0.330.160.180.0
0.07
0.00.09
18.4512.0134.7310.02.383.5
0.090.06.0
2.380.0
2.50
5.500.420.606.070.000.110.010.030.000.01
0.000.013.085.157.601.500.001.000.010.000.001.550.00
0.00
0.000.00
*0.00*0.030.000.000.000.000.000.00
0.000.000.000.000.000.000.000.000.000.000.000.000.00
Weighted Daily Average% of Calories
641 45 1408 7.36 3.06 493.4 9175 1232 26.66 26.0016.2%
75.2147.0%
24.6434.6%
5.537.8%
*0.00*0.0%
*N/A* - denotes a nutrient that is either missing o r incomplete for an individual ingredient* - denotes combined nutrient totals with either mi ssing or incomplete nutrient data¹ - denotes optional nutrient values
NOTICE: The data contained within this report and the NUTRIKIDS® Menu Planning and Nutritional Analys is software should not be used for and does not pro vide menu planning for a child with a medical condition or food allergy. Ingredi ents and menu items are subject to change or substi tution without notice. Please consult a medical pr ofessional for assistance in planning for or treating medical conditions.

Pender County SchoolsPage 7 Oct 3, 2011 thru Oct 31, 2011 Spreadsheet - Portion Values Jan 18, 2012
ES Lunch Base
Portion Plan Cals Cholst Sodm Fiber Iron Calcm Vit-A Vit-A Vit-C Protn Carb T-Fat S-Fat Tr-Fat¹Size Qty (kcal) (mg) (mg) (g) (mg) (mg) (IU) (RE) (mg) (g) (g) (g) (g) (g)
Tue - 10/11/2011ES Lunch BasePP MAC & CHEESE SC B 2.0SALAD Chix Brd Chef AP B 2.0ROLL, DINNER AP WBEANS, Green Frozen 3/8cTurkey w/AM, Sub B 2.0PEACHES, Diced w/ Juice 3/8cBANANA, Fresh Regular 1/2 cupORANGES, 138 Quarters1/2 cupAPPLES, 163ct Whole 3/8cSide Salad 1/2 cupCARROTS, Fresh Baby 3/8c
TOMATO, Fresh Cherry 3/8cCUCUMBER, Slices 3/8cWG CHIX Patty, SSFRANK, TURKEY 8-1 B 2.0SANDWICH, PB&J D Deck WheatDRES_Ranch, Lite, 1/8 cupDRES_Italian, Lite 1/8 cupCOND_Mayo, LiteCOND_Ketchup 1/4 cupCOND_Mustard, Yellow 1/8 cupMILK, 1% White 8ozMILK, Skim, Chocolate
Total1 Cup1 Each1 each3/8 Cup1 Each3/8 Cup1 EACH1 each1 each1 Cup3/8 Cup, 10 ea3/8 Cup3/8 Cup1 Each1 Each1 Each1/8 cup1/8 cup1 Tbsp1/4 cup1/8 cup1 Each1 Each
4001002525
30025
10011010010010050
1550
1507525
2001510
15050
240160
5302627723
308399063561820
107
44129280110029356322
10390
643500
29000000
00
25500
100500
125
47247096
1401151
4101
1044
21
875981691290353130765157108125
2.742.801.081.581.100.002.633.202.590.831.64
0.460.404.881.076.700.000.000.000.580.000.000.00
2.991.631.010.352.400.000.260.130.130.300.50
0.160.124.102.773.320.000.000.000.320.000.070.00
533.2245.049.922.1
179.20.05.1
53.46.5
16.618.1
9.17.9
127.5150.0146.5
0.00.00.06.10.0
306.2250.0
9641191
034531223565
30058
8047819
45741
123348
0000
4360
480500
209238
03262478
605
1741564
1134
25700000
2020
145100
1.526.480.0
2.150.0
0.948.79
70.964.967.611.47
6.861.811.480.0
0.150.00.00.0
0.590.00.01.2
25.738.0
2.440.78
16.890.01.1
1.250.280.830.36
0.460.335.39
11.8120.18
1.00.00.0
0.510.0
8.269.0
51.7313.2513.043.08
31.299.38
23.0715.6714.883.494.67
2.291.2246.5
27.22103.97
1.01.911.0
17.780.0
12.2313.0
23.7215.541.791.14
13.260.0
0.330.160.180.0
0.07
0.00.09
18.4514.1534.7310.02.383.5
0.090.0
2.380.0
12.465.500.420.556.070.000.110.010.030.000.01
0.000.013.084.547.601.500.001.000.010.001.550.00
0.000.000.00
*0.00*0.030.000.000.000.000.000.00
0.000.000.000.000.000.000.000.000.000.000.000.00
Weighted Daily Average% of Calories
709 53 1478 7.50 4.05 574.7 2723 593 27.87 24.4713.8%
85.7048.3%
27.2734.6%
8.5110.8%
*0.00*0.0%
*N/A* - denotes a nutrient that is either missing o r incomplete for an individual ingredient* - denotes combined nutrient totals with either mi ssing or incomplete nutrient data¹ - denotes optional nutrient values
NOTICE: The data contained within this report and the NUTRIKIDS® Menu Planning and Nutritional Analys is software should not be used for and does not pro vide menu planning for a child with a medical condition or food allergy. Ingredi ents and menu items are subject to change or substi tution without notice. Please consult a medical pr ofessional for assistance in planning for or treating medical conditions.

Pender County SchoolsPage 8 Oct 3, 2011 thru Oct 31, 2011 Spreadsheet - Portion Values Jan 18, 2012
ES Lunch Base
Portion Plan Cals Cholst Sodm Fiber Iron Calcm Vit-A Vit-A Vit-C Protn Carb T-Fat S-Fat Tr-Fat¹Size Qty (kcal) (mg) (mg) (g) (mg) (mg) (IU) (RE) (mg) (g) (g) (g) (g) (g)
Wed - 10/12/2011ES Lunch BaseCHIX Nugget, (5) AP B 2SALAD Chix Brd Chef AP B 2.0ROLL, DINNER AP WPOTATO, Mashed 1/2cGRAVY, BrownTurkey w/AM, Sub B 2.0ORANGE, Mandarin w/Lt syr 3/8cBANANA, Fresh Regular 1/2 cupORANGES, 138 Quarters1/2 cupAPPLES, 163ct Whole 3/8cSide Salad 1/2 cupCARROTS, Fresh Baby 3/8c
TOMATO, Fresh Cherry 3/8cCUCUMBER, Slices 3/8cWG CHIX Patty, SSBEEF Burger CHZAM AP B 2.5SANDWICH, PB&J D Deck WheatDRES_Ranch, Lite, 1/8 cupDRES_Italian, Lite 1/8 cupCOND_Mayo, LiteCOND_Ketchup 1/4 cupCOND_Mustard, Yellow 1/8 cupDRES_Honey Mustard, GalMILK, 1% White 8ozMILK, Skim, Chocolate
Total5 Each1 Each1 each1/2 Cup1/4 cup1 Each3/8 Cup1 EACH1 each1 each1 Cup3/8 Cup, 10 ea3/8 Cup3/8 Cup1 Each1 Each1 Each1/8 cup1/8 cup1 Tbsp1/4 cup1/8 cup1/8 cup1 Each1 Each
4002502525
39020015
10011010010010050
1550653015
1251510
1755075
160240
200262770
27308469063561820
107
44132980110029356322
13010390
4835000
29000000
00
25530
100500
10125
514470967
2881151
7101
1044
21
875919691290353130765157220108125
0.002.801.080.000.231.100.662.633.202.590.831.64
0.460.404.882.196.700.000.000.000.580.000.000.000.00
1.251.631.010.000.122.400.470.260.130.130.300.50
0.160.124.103.863.320.000.000.000.320.000.000.070.00
17.4245.049.96.84.0
179.213.25.1
53.46.5
16.618.1
9.17.9
127.5174.2146.5
0.00.00.06.10.00.0
306.2250.0
871191
000
31265865
30058
8047819
45741
123252
0000
43600
480500
17238
000
62132
8605
1741564
1134
25500000
20200
145100
1.056.480.00.00.00.0
15.798.79
70.964.967.611.47
6.861.811.480.0
0.150.00.00.0
0.590.00.00.01.2
14.828.0
2.440.0
0.6816.890.661.1
1.250.280.830.36
0.460.335.39
23.9220.18
1.00.00.0
0.510.00.0
8.269.0
10.4613.2513.04
0.03.8
31.2911.1923.0715.6714.883.494.67
2.291.2246.5
30.54103.97
1.01.911.0
17.780.04.0
12.2313.0
11.3315.541.790.0
0.9713.26
0.00.330.160.180.0
0.07
0.00.09
18.4512.0134.7310.02.383.5
0.090.0
13.02.380.0
2.185.500.420.000.286.070.000.110.010.030.000.01
0.000.013.085.157.601.500.001.000.010.002.001.550.00
0.000.000.000.00
*0.00*0.030.000.000.000.000.000.00
0.000.000.000.000.000.000.000.000.000.000.000.000.00
Weighted Daily Average% of Calories
555 54 1419 4.67 2.77 386.5 2335 537 30.20 24.7117.8%
65.1046.9%
21.2734.5%
4.817.8%
*0.00*0.0%
*N/A* - denotes a nutrient that is either missing o r incomplete for an individual ingredient* - denotes combined nutrient totals with either mi ssing or incomplete nutrient data¹ - denotes optional nutrient values
NOTICE: The data contained within this report and the NUTRIKIDS® Menu Planning and Nutritional Analys is software should not be used for and does not pro vide menu planning for a child with a medical condition or food allergy. Ingredi ents and menu items are subject to change or substi tution without notice. Please consult a medical pr ofessional for assistance in planning for or treating medical conditions.

Pender County SchoolsPage 9 Oct 3, 2011 thru Oct 31, 2011 Spreadsheet - Portion Values Jan 18, 2012
ES Lunch Base
Portion Plan Cals Cholst Sodm Fiber Iron Calcm Vit-A Vit-A Vit-C Protn Carb T-Fat S-Fat Tr-Fat¹Size Qty (kcal) (mg) (mg) (g) (mg) (mg) (IU) (RE) (mg) (g) (g) (g) (g) (g)
Thu - 10/13/2011ES Lunch BasePORK, Asian BBQ 3.0SALAD Chix Brd Chef AP B 2.0ROLL, DINNER AP WNice Rice 1/2cTurkey w/AM, Sub B 2.0PEARS, Diced w/Juice 3/8cBANANA, Fresh Regular 1/2 cupORANGES, 138 Quarters1/2 cupAPPLES, 163ct Whole 3/8cSide Salad 1/2 cupCARROTS, Fresh Baby 3/8c
TOMATO, Fresh Cherry 3/8cCUCUMBER, Slices 3/8cWG CHIX Patty, SSFRANK, TURKEY 8-1 B 2.0SANDWICH, PB&J D Deck WheatDRES_Ranch, Lite, 1/8 cupDRES_Italian, Lite 1/8 cupCOND_Mayo, LiteCOND_Ketchup 1/4 cupCOND_Mustard, Yellow 1/8 cupMILK, 1% White 8ozMILK, Skim, Chocolate
Total3 ozw1 Each1 each1/2 Cup1 Each3/8 cup1 EACH1 each1 each1 Cup3/8 Cup, 10 ea3/8 Cup3/8 Cup1 Each1 Each1 Each1/8 cup1/8 cup1 Tbsp1/4 cup1/8 cup1 Each1 Each
4001002525
30030
10011010010010050
1550
1408025
2001510
10050
160240
27826277
212308579063561820
107
44129280110029356322
10390
82350
4629000000
00
25500
100500
125
44047096
1031151
5101
1044
21
875981691290353130765157108125
0.532.801.083.541.101.592.633.202.590.831.64
0.460.404.881.076.700.000.000.000.580.000.000.00
1.011.631.010.972.400.280.260.130.130.300.50
0.160.124.102.773.320.000.000.000.320.000.070.00
20.8245.049.933.0
179.25.05.1
53.46.5
16.618.1
9.17.9
127.5150.0146.5
0.00.00.06.10.0
306.2250.0
171191
0618312
065
30058
8047819
45741
123348
0000
4360
480500
4238
0676208
605
1741564
1134
25700000
2020
145100
0.886.480.0
0.490.0
0.698.79
70.964.967.611.47
6.861.811.480.0
0.150.00.00.0
0.590.00.01.2
25.698.0
2.446.1
16.890.191.1
1.250.280.830.36
0.460.335.39
11.8120.18
1.00.00.0
0.510.0
8.269.0
15.113.2513.0441.0431.2915.0523.0715.6714.883.494.67
2.291.2246.5
27.22103.97
1.01.911.0
17.780.0
12.2313.0
12.2315.541.792.56
13.260.030.330.160.180.0
0.07
0.00.09
18.4514.1534.7310.02.383.5
0.090.0
2.380.0
4.495.500.420.656.070.000.110.010.030.000.01
0.000.013.084.547.601.500.001.000.010.001.550.00
*0.000.000.00
*0.00*0.030.000.000.000.000.000.00
0.000.000.000.000.000.000.000.000.000.000.000.00
Weighted Daily Average% of Calories
778 91 1355 8.65 4.00 444.9 2587 524 26.53 28.8014.8%
103.9353.4%
24.8728.8%
6.347.3%
*0.00*0.0%
*N/A* - denotes a nutrient that is either missing o r incomplete for an individual ingredient* - denotes combined nutrient totals with either mi ssing or incomplete nutrient data¹ - denotes optional nutrient values
NOTICE: The data contained within this report and the NUTRIKIDS® Menu Planning and Nutritional Analys is software should not be used for and does not pro vide menu planning for a child with a medical condition or food allergy. Ingredi ents and menu items are subject to change or substi tution without notice. Please consult a medical pr ofessional for assistance in planning for or treating medical conditions.

Pender County SchoolsPage 10 Oct 3, 2011 thru Oct 31, 2011 Spreadsheet - Portion Values Jan 18, 2012
ES Lunch Base
Portion Plan Cals Cholst Sodm Fiber Iron Calcm Vit-A Vit-A Vit-C Protn Carb T-Fat S-Fat Tr-Fat¹Size Qty (kcal) (mg) (mg) (g) (mg) (mg) (IU) (RE) (mg) (g) (g) (g) (g) (g)
Fri - 10/14/2011ES Lunch BasePP Pen In/Out SS B 2.0SALAD Chix Brd Chef AP B 2.0ROLL, DINNER AP WCORN, Frozen 3/8cTurkey w/AM, Sub B 2.0PINEAPPLE, Chunks w/Juice 3/8cBANANA, Fresh Regular 1/2 cupORANGES, 138 Quarters1/2 cupAPPLES, 163ct Whole 3/8cSide Salad 1/2 cupCARROTS, Fresh Baby 3/8c
TOMATO, Fresh Cherry 3/8cCUCUMBER, Slices 3/8cWG CHIX Patty, SSBEEF Burger CHZAM AP B 2.5SANDWICH, PB&J D Deck WheatDRES_Ranch, Lite, 1/8 cupDRES_Italian, Lite 1/8 cupCOND_Mayo, LiteCOND_Ketchup 1/4 cupCOND_Mustard, Yellow 1/8 cupMILK, 1% White 8ozMILK, Skim, Chocolate
Total3/4 cup1 Each1 each3/8 Cup1 Each3/8 Cup1 EACH1 each1 each1 Cup3/8 Cup, 10 ea3/8 Cup3/8 Cup1 Each1 Each1 Each1/8 cup1/8 cup1 Tbsp1/4 cup1/8 cup1 Each1 Each
4001302525
35020
15011010010010050
1550
1406025
2001510
10050
160240
3902627759
308329063561820
107
44132980110029356322
10390
253500
29000000
00
25530
100500
125
92647096
1651151
5101
1044
21
875919691290353130765157108125
3.802.801.081.501.100.452.633.202.590.831.64
0.460.404.882.196.700.000.000.000.580.000.000.00
3.881.631.010.292.400.330.260.130.130.300.50
0.160.124.103.863.320.000.000.000.320.000.070.00
347.8245.049.91.9
179.29.15.1
53.46.5
16.618.1
9.17.9
127.5174.2146.5
0.00.00.06.10.0
306.2250.0
6821191
01803124565
30058
8047819
45741
123252
0000
4360
480500
121238
0256298
605
1741564
1134
25500000
2020
145100
6.026.480.0
2.180.0
4.098.79
70.964.967.611.47
6.861.811.480.0
0.150.00.00.0
0.590.00.01.2
23.98.0
2.441.59
16.890.451.1
1.250.280.830.36
0.460.335.39
23.9220.18
1.00.00.0
0.510.0
8.269.0
48.6813.2513.0411.6731.297.72
23.0715.6714.883.494.67
2.291.2246.5
30.54103.97
1.01.911.0
17.780.0
12.2313.0
9.4715.541.791.53
13.260.0
0.330.160.180.0
0.07
0.00.09
18.4512.0134.7310.02.383.5
0.090.0
2.380.0
4.975.500.420.606.070.000.110.010.030.000.01
0.000.013.085.157.601.500.001.000.010.001.550.00
0.000.000.00
*0.00*0.030.000.000.000.000.000.00
0.000.000.000.000.000.000.000.000.000.000.000.00
Weighted Daily Average% of Calories
709 41 1526 8.26 4.55 523.5 2476 529 31.17 27.8915.7%
92.9052.4%
22.9429.1%
6.588.4%
*0.00*0.0%
*N/A* - denotes a nutrient that is either missing o r incomplete for an individual ingredient* - denotes combined nutrient totals with either mi ssing or incomplete nutrient data¹ - denotes optional nutrient values
NOTICE: The data contained within this report and the NUTRIKIDS® Menu Planning and Nutritional Analys is software should not be used for and does not pro vide menu planning for a child with a medical condition or food allergy. Ingredi ents and menu items are subject to change or substi tution without notice. Please consult a medical pr ofessional for assistance in planning for or treating medical conditions.

Pender County SchoolsPage 11 Oct 3, 2011 thru Oct 31, 2011 Spreadsheet - Portion Values Jan 18, 2012
ES Lunch Base
Portion Plan Cals Cholst Sodm Fiber Iron Calcm Vit-A Vit-A Vit-C Protn Carb T-Fat S-Fat Tr-Fat¹Size Qty (kcal) (mg) (mg) (g) (mg) (mg) (IU) (RE) (mg) (g) (g) (g) (g) (g)
Mon - 10/17/2011ES Lunch BasePASTA, PennepBar: SAUCE, Alfredo APLIMA BEANS: canned,cooked-M/MSALAD Ham Pizza AP B 2.0ROLL, DINNER AP WCARROTS, Sliced cooked 3/8cHam w/AM, Sub B 2.0APPLESAUCE, Sour 1/2cBANANA, Fresh Regular 1/2 cupORANGES, 138 Quarters1/2 cupAPPLES, 163ct Whole 3/8cSide Salad 1/2 cupCARROTS, Fresh Baby 3/8c
TOMATO, Fresh Cherry 3/8cCUCUMBER, Slices 3/8cWG CHIX Patty, SSBEEF Burger CHZAM AP B 2.5SANDWICH, PB&J D Deck WheatDRES_Ranch, Lite, 1/8 cupDRES_Italian, Lite 1/8 cupCOND_Mayo, LiteCOND_Ketchup 1/4 cupCOND_Mustard, Yellow 1/8 cupMILK, 1% White 8ozMILK, Skim, Chocolate
Total3/4 Cup1/4 cup1/2 CUP1 Each1 each3/8 Cup1 Each1/2 Cup1 EACH1 each1 each1/2 Cup3/8 Cup, 10 ea3/8 Cup3/8 Cup1 Each1 Each1 Each1/8 cup1/8 cup1 Tbsp1/4 cup1/8 cup1 Each1 Each
4007575752525
25025
16011010010010050
1550
1608530
2001510
16050
160240
1656694
1747734
308729063569
20
107
44132980110029356322
10390
010
4500
50000000
00
25530
100500
125
458233564696
2071078
521015
44
21
875919691290353130765157108125
1.570.054.830.961.082.191.102.232.633.202.590.421.64
0.460.404.882.196.700.000.000.000.580.000.000.00
1.420.010.391.391.010.352.700.000.260.130.130.150.50
0.160.124.103.863.320.000.000.000.320.000.070.00
4.238.437.6
120.749.923.2
163.20.05.1
53.46.58.3
18.1
9.17.9
127.5174.2146.5
0.00.00.06.10.0
306.2250.0
070
200979
011274
3121248
6530058
4027819
45741
123252
0000
4360
480500
01440
1960
118462
2508
605
871564
1134
25500000
2020
145100
0.00.0
9.775.750.0
1.520.0
14.988.79
70.964.963.811.47
6.861.811.480.0
0.150.00.00.0
0.590.00.01.2
5.51.515.42
19.282.440.38
20.130.01.1
1.250.280.420.36
0.460.335.39
23.9220.18
1.00.00.0
0.510.0
8.269.0
32.246.1
17.756.68
13.045.12
31.2918.6523.0715.6714.881.754.67
2.291.2246.5
30.54103.97
1.01.911.0
17.780.0
12.2313.0
0.793.980.398.171.791.48
12.460.0
0.330.160.180.0
0.07
0.00.09
18.4512.0134.7310.02.383.5
0.090.0
2.380.0
0.001.790.093.790.420.606.060.000.110.010.030.000.01
0.000.013.085.157.601.500.001.000.010.001.550.00
0.000.500.000.000.00
*0.00*0.030.000.000.000.000.000.00
0.000.000.000.000.000.000.000.000.000.000.000.00
Weighted Daily Average% of Calories
688 40 1646 9.36 4.01 446.4 9653 1326 33.71 24.2414.1%
92.8954.0%
22.1929.0%
5.717.5%
*0.10*0.1%
*N/A* - denotes a nutrient that is either missing o r incomplete for an individual ingredient* - denotes combined nutrient totals with either mi ssing or incomplete nutrient data¹ - denotes optional nutrient values
NOTICE: The data contained within this report and the NUTRIKIDS® Menu Planning and Nutritional Analys is software should not be used for and does not pro vide menu planning for a child with a medical condition or food allergy. Ingredi ents and menu items are subject to change or substi tution without notice. Please consult a medical pr ofessional for assistance in planning for or treating medical conditions.

Pender County SchoolsPage 12 Oct 3, 2011 thru Oct 31, 2011 Spreadsheet - Portion Values Jan 18, 2012
ES Lunch Base
Portion Plan Cals Cholst Sodm Fiber Iron Calcm Vit-A Vit-A Vit-C Protn Carb T-Fat S-Fat Tr-Fat¹Size Qty (kcal) (mg) (mg) (g) (mg) (mg) (IU) (RE) (mg) (g) (g) (g) (g) (g)
Tue - 10/18/2011ES Lunch BaseOrange ChickenSALAD Ham Pizza AP B 2.0ROLL, DINNER AP WBEANS, Green Frozen 3/8cHam w/AM, Sub B 2.0PEACHES, Diced w/ Juice 3/8cBANANA, Fresh Regular 1/2 cupORANGES, 138 Quarters1/2 cupAPPLES, 163ct Whole 3/8cSide Salad 1/2 cupCARROTS, Fresh Baby 3/8c
TOMATO, Fresh Cherry 3/8cCUCUMBER, Slices 3/8cWG CHIX Patty, SSFRANK, TURKEY 8-1 B 2.0SANDWICH, PB&J D Deck WheatDRES_Ranch, Lite, 1/8 cupDRES_Italian, Lite 1/8 cupCOND_Mayo, LiteCOND_Ketchup 1/4 cupCOND_Mustard, Yellow 1/8 cupMILK, 1% White 8ozMILK, Skim, Chocolate
Total5 ea1 Each1 each3/8 Cup1 Each3/8 Cup1 EACH1 each1 each1 Cup3/8 Cup, 10 ea3/8 Cup3/8 Cup1 Each1 Each1 Each1/8 cup1/8 cup1 Tbsp1/4 cup1/8 cup1 Each1 Each
4001502525
30025
12511010010010050
1550
1156025
2001510
15050
240160
4251747723
308399063561820
107
44129280110029356322
10390
484500
50000000
00
25500
100500
125
54564696
1401078
4101
1044
21
875981691290353130765157108125
0.000.961.081.581.100.002.633.202.590.831.64
0.460.404.881.076.700.000.000.000.580.000.000.00
1.251.391.010.352.700.000.260.130.130.300.50
0.160.124.102.773.320.000.000.000.320.000.070.00
18.6120.749.922.1
163.20.05.1
53.46.5
16.618.1
9.17.9
127.5150.0146.5
0.00.00.06.10.0
306.2250.0
87979
034531223565
30058
8047819
45741
123348
0000
4360
480500
17196
03262478
605
1741564
1134
25700000
2020
145100
4.655.750.0
2.150.0
0.948.79
70.964.967.611.47
6.861.811.480.0
0.150.00.00.0
0.590.00.01.2
14.9419.282.440.78
20.130.01.1
1.250.280.830.36
0.460.335.39
11.8120.18
1.00.00.0
0.510.0
8.269.0
65.966.68
13.043.08
31.299.38
23.0715.6714.883.494.67
2.291.2246.5
27.22103.97
1.01.911.0
17.780.0
12.2313.0
11.338.171.791.14
12.460.0
0.330.160.180.0
0.07
0.00.09
18.4514.1534.7310.02.383.5
0.090.0
2.380.0
2.183.790.420.556.060.000.110.010.030.000.01
0.000.013.084.547.601.500.001.000.010.001.550.00
0.000.000.00
*0.00*0.030.000.000.000.000.000.00
0.000.000.000.000.000.000.000.000.000.000.000.00
Weighted Daily Average% of Calories
683 53 1458 6.23 3.31 422.8 2492 543 29.11 23.6313.8%
92.5954.2%
22.9430.2%
5.677.5%
*0.00*0.0%
*N/A* - denotes a nutrient that is either missing o r incomplete for an individual ingredient* - denotes combined nutrient totals with either mi ssing or incomplete nutrient data¹ - denotes optional nutrient values
NOTICE: The data contained within this report and the NUTRIKIDS® Menu Planning and Nutritional Analys is software should not be used for and does not pro vide menu planning for a child with a medical condition or food allergy. Ingredi ents and menu items are subject to change or substi tution without notice. Please consult a medical pr ofessional for assistance in planning for or treating medical conditions.

Pender County SchoolsPage 13 Oct 3, 2011 thru Oct 31, 2011 Spreadsheet - Portion Values Jan 18, 2012
ES Lunch Base
Portion Plan Cals Cholst Sodm Fiber Iron Calcm Vit-A Vit-A Vit-C Protn Carb T-Fat S-Fat Tr-Fat¹Size Qty (kcal) (mg) (mg) (g) (mg) (mg) (IU) (RE) (mg) (g) (g) (g) (g) (g)
Wed - 10/19/2011ES Lunch BaseMELT, Chz AM B 2.0SOUP, TomatoSALAD Ham Pizza AP B 2.0ROLL, DINNER AP WPEAS, Green Cooked 3/8cHam w/AM, Sub B 2.0FRUIT COCKTAIL, w/Juice 3/8cBANANA, Fresh Regular 1/2 cupORANGES, 138 Quarters1/2 cupAPPLES, 163ct Whole 3/8cSide Salad 1/2 cupCARROTS, Fresh Baby 3/8c
TOMATO, Fresh Cherry 3/8cCUCUMBER, Slices 3/8cWG CHIX Patty, SSBEEF Burger CHZAM AP B 2.5SANDWICH, PB&J D Deck WheatDRES_Ranch, Lite, 1/8 cupDRES_Italian, Lite 1/8 cupCOND_Mayo, LiteCOND_Ketchup 1/4 cupCOND_Mustard, Yellow 1/8 cupDRES_Honey Mustard, GalMILK, 1% White 8ozMILK, Skim, Chocolate
Total1 each1/2 Cup1 Each1 each3/8 Cup1 Each3/8 Cup1 EACH1 each1 each1 Cup3/8 Cup, 10 ea3/8 Cup3/8 Cup1 Each1 Each1 Each1/8 cup1/8 cup1 Tbsp1/4 cup1/8 cup1/8 cup1 Each1 Each
4002002002020
30015
10011010010010050
1550757020
1251510
1755075
160240
3351011747768
308379063561820
107
44132980110029356322
13010390
510
4500
50000000
00
25530
100500
10125
125281264696
2461078
8101
1044
21
875919691290353130765157220108125
1.202.250.961.083.941.100.822.633.202.590.831.64
0.460.404.882.196.700.000.000.000.580.000.000.000.00
2.600.401.391.011.092.700.000.260.130.130.300.50
0.160.124.103.863.320.000.000.000.320.000.000.070.00
379.24.1
120.749.917.2
163.20.05.1
53.46.5
16.618.1
9.17.9
127.5174.2146.5
0.00.00.06.10.00.0
306.2250.0
607449979
0157031216465
30058
8047819
45741
123252
0000
43600
480500
12190
1960
6162338
605
1741564
1134
25500000
20200
145100
0.05.395.750.07.10.0
1.978.79
70.964.967.611.47
6.861.811.480.0
0.150.00.00.0
0.590.00.00.01.2
13.942.25
19.282.443.69
20.130.01.1
1.250.280.830.36
0.460.335.39
23.9220.18
1.00.00.0
0.510.00.0
8.269.0
27.3321.336.68
13.0410.2231.299.85
23.0715.6714.883.494.67
2.291.2246.5
30.54103.97
1.01.911.0
17.780.04.0
12.2313.0
19.871.128.171.791.48
12.460.0
0.330.160.180.0
0.07
0.00.09
18.4512.0134.7310.02.383.5
0.090.0
13.02.380.0
10.480.563.790.420.686.060.000.110.010.030.000.01
0.000.013.085.157.601.500.001.000.010.002.001.550.00
0.000.000.000.00
*0.00*0.030.000.000.000.000.000.00
0.000.000.000.000.000.000.000.000.000.000.000.000.00
Weighted Daily Average% of Calories
728 56 2285 9.56 4.62 580.2 3865 654 34.03 29.1516.0%
93.1951.2%
26.8033.1%
9.8712.2%
*0.00*0.0%
*N/A* - denotes a nutrient that is either missing o r incomplete for an individual ingredient* - denotes combined nutrient totals with either mi ssing or incomplete nutrient data¹ - denotes optional nutrient values
NOTICE: The data contained within this report and the NUTRIKIDS® Menu Planning and Nutritional Analys is software should not be used for and does not pro vide menu planning for a child with a medical condition or food allergy. Ingredi ents and menu items are subject to change or substi tution without notice. Please consult a medical pr ofessional for assistance in planning for or treating medical conditions.

Pender County SchoolsPage 14 Oct 3, 2011 thru Oct 31, 2011 Spreadsheet - Portion Values Jan 18, 2012
ES Lunch Base
Portion Plan Cals Cholst Sodm Fiber Iron Calcm Vit-A Vit-A Vit-C Protn Carb T-Fat S-Fat Tr-Fat¹Size Qty (kcal) (mg) (mg) (g) (mg) (mg) (IU) (RE) (mg) (g) (g) (g) (g) (g)
Thu - 10/20/2011ES Lunch BasePORK, BBQ Braised SC 3.0SALAD Ham Pizza AP B 2.0ROLL, DINNER AP WSALAD, Cole Slaw 3/8cHam w/AM, Sub B 2.0PEARS, Diced w/Juice 3/8cBANANA, Fresh Regular 1/2 cupORANGES, 138 Quarters1/2 cupAPPLES, 163ct Whole 3/8cSide Salad 1/2 cupCARROTS, Fresh Baby 3/8c
TOMATO, Fresh Cherry 3/8cCUCUMBER, Slices 3/8cWG CHIX Patty, SSFRANK, TURKEY 8-1 B 2.0SANDWICH, PB&J D Deck WheatDRES_Ranch, Lite, 1/8 cupDRES_Italian, Lite 1/8 cupCOND_Mayo, LiteCOND_Ketchup 1/4 cupCOND_Mustard, Yellow 1/8 cupMILK, 1% White 8ozMILK, Skim, Chocolate
Total3 ozw1 Each1 each3/8 Cup1 Each3/8 cup1 EACH1 each1 each1 Cup3/8 Cup, 10 ea3/8 Cup3/8 Cup1 Each1 Each1 Each1/8 cup1/8 cup1 Tbsp1/4 cup1/8 cup1 Each1 Each
4001342525
15015
10011010010010050
1550
1505025
2001510
10050
160240
27617477
147308579063561820
107
44129280110029356322
10390
824508
50000000
00
25500
100500
125
54064696
1391078
5101
1044
21
875981691290353130765157108125
3.080.961.081.631.101.592.633.202.590.831.64
0.460.404.881.076.700.000.000.000.580.000.000.00
1.011.391.010.292.700.280.260.130.130.300.50
0.160.124.102.773.320.000.000.000.320.000.070.00
17.6120.749.932.7
163.25.05.1
53.46.5
16.618.1
9.17.9
127.5150.0146.5
0.00.00.06.10.0
306.2250.0
13979
0613312
065
30058
8047819
45741
123348
0000
4360
480500
4196
0126208
605
1741564
1134
25700000
2020
145100
0.25.750.0
3.920.0
0.698.79
70.964.967.611.47
6.861.811.480.0
0.150.00.00.0
0.590.00.01.2
25.1319.282.440.82
20.130.191.1
1.250.280.830.36
0.460.335.39
11.8120.18
1.00.00.0
0.510.0
8.269.0
13.116.68
13.0413.0831.2915.0523.0715.6714.883.494.67
2.291.2246.5
27.22103.97
1.01.911.0
17.780.0
12.2313.0
12.298.171.799.81
12.460.030.330.160.180.0
0.07
0.00.09
18.4514.1534.7310.02.383.5
0.090.0
2.380.0
4.513.790.422.046.060.000.110.010.030.000.01
0.000.013.084.547.601.500.001.000.010.001.550.00
*0.000.000.000.00
*0.030.000.000.000.000.000.00
0.000.000.000.000.000.000.000.000.000.000.000.00
Weighted Daily Average% of Calories
669 64 1314 7.39 3.27 410.0 2306 469 27.47 25.9715.5%
76.2145.6%
26.1035.1%
6.418.6%
*0.00*0.0%
*N/A* - denotes a nutrient that is either missing o r incomplete for an individual ingredient* - denotes combined nutrient totals with either mi ssing or incomplete nutrient data¹ - denotes optional nutrient values
NOTICE: The data contained within this report and the NUTRIKIDS® Menu Planning and Nutritional Analys is software should not be used for and does not pro vide menu planning for a child with a medical condition or food allergy. Ingredi ents and menu items are subject to change or substi tution without notice. Please consult a medical pr ofessional for assistance in planning for or treating medical conditions.

Pender County SchoolsPage 15 Oct 3, 2011 thru Oct 31, 2011 Spreadsheet - Portion Values Jan 18, 2012
ES Lunch Base
Portion Plan Cals Cholst Sodm Fiber Iron Calcm Vit-A Vit-A Vit-C Protn Carb T-Fat S-Fat Tr-Fat¹Size Qty (kcal) (mg) (mg) (g) (mg) (mg) (IU) (RE) (mg) (g) (g) (g) (g) (g)
Fri - 10/21/2011ES Lunch BaseSALISBURY STK AP B 2.0GRAVY, BrownSALAD Ham Pizza AP B 2.0ROLL, DINNER AP WRICE, White 1/2cHam w/AM, Sub B 2.0PINEAPPLE, Chunks w/Juice 3/8cBANANA, Fresh Regular 1/2 cupORANGES, 138 Quarters1/2 cupAPPLES, 163ct Whole 3/8cSide Salad 1/2 cupCARROTS, Fresh Baby 3/8c
TOMATO, Fresh Cherry 3/8cCUCUMBER, Slices 3/8cWG CHIX Patty, SSBEEF Burger CHZAM AP B 2.5SANDWICH, PB&J D Deck WheatDRES_Ranch, Lite, 1/8 cupDRES_Italian, Lite 1/8 cupCOND_Mayo, LiteCOND_Ketchup 1/4 cupCOND_Mustard, Yellow 1/8 cupMILK, 1% White 8ozMILK, Skim, Chocolate
Total1 Each1/4 cup1 Each1 each1/2 Cup1 Each3/8 Cup1 EACH1 each1 each1 Cup3/8 Cup, 10 ea3/8 Cup3/8 Cup1 Each1 Each1 Each1/8 cup1/8 cup1 Tbsp1/4 cup1/8 cup1 Each1 Each
4001401001515
14015
15011010010010050
1550
1406525
2001510
10050
160240
20027
17477
103308329063561820
107
44132980110029356322
10390
450
4500
50000000
00
25530
100500
125
350288646963
10785101
1044
21
875919691290353130765157108125
1.000.230.961.080.321.100.452.633.202.590.831.64
0.460.404.882.196.700.000.000.000.580.000.000.00
1.800.121.391.010.952.700.330.260.130.130.300.50
0.160.124.103.863.320.000.000.000.320.000.070.00
40.04.0
120.749.910.2
163.29.15.1
53.46.5
16.618.1
9.17.9
127.5174.2146.5
0.00.00.06.10.0
306.2250.0
00
97900
3124565
30058
8047819
45741
123252
0000
4360
480500
00
19600
6298
605
1741564
1134
25500000
2020
145100
1.20.0
5.750.00.00.0
4.098.79
70.964.967.611.47
6.861.811.480.0
0.150.00.00.0
0.590.00.01.2
14.00.68
19.282.442.13
20.130.451.1
1.250.280.830.36
0.460.335.39
23.9220.18
1.00.00.0
0.510.0
8.269.0
4.03.8
6.6813.0422.2531.297.72
23.0715.6714.883.494.67
2.291.2246.5
30.54103.97
1.01.911.0
17.780.0
12.2313.0
15.00.978.171.790.22
12.460.0
0.330.160.180.0
0.07
0.00.09
18.4512.0134.7310.02.383.5
0.090.0
2.380.0
6.000.283.790.420.066.060.000.110.010.030.000.01
0.000.013.085.157.601.500.001.000.010.001.550.00
0.00*0.000.000.00
*0.00*0.030.000.000.000.000.000.00
0.000.000.000.000.000.000.000.000.000.000.000.00
Weighted Daily Average% of Calories
632 49 1264 6.08 3.98 414.7 2058 461 27.53 24.9215.8%
76.0948.2%
23.3433.2%
6.419.1%
*0.00*0.0%
*N/A* - denotes a nutrient that is either missing o r incomplete for an individual ingredient* - denotes combined nutrient totals with either mi ssing or incomplete nutrient data¹ - denotes optional nutrient values
NOTICE: The data contained within this report and the NUTRIKIDS® Menu Planning and Nutritional Analys is software should not be used for and does not pro vide menu planning for a child with a medical condition or food allergy. Ingredi ents and menu items are subject to change or substi tution without notice. Please consult a medical pr ofessional for assistance in planning for or treating medical conditions.

Pender County SchoolsPage 16 Oct 3, 2011 thru Oct 31, 2011 Spreadsheet - Portion Values Jan 18, 2012
ES Lunch Base
Portion Plan Cals Cholst Sodm Fiber Iron Calcm Vit-A Vit-A Vit-C Protn Carb T-Fat S-Fat Tr-Fat¹Size Qty (kcal) (mg) (mg) (g) (mg) (mg) (IU) (RE) (mg) (g) (g) (g) (g) (g)
Mon - 10/24/2011ES Lunch BasePP MAC & CHEESE SC B 2.0SALAD Chix Bacon Shaker 2.0ROLL, DINNER AP WVEGETABLES MIX, Frozen 3/8cTurkey w/AM, Wp B 2.0APPLESAUCE, Canned 3/8cBANANA, Fresh Regular 1/2 cupORANGES, 138 Quarters1/2 cupAPPLES, 163ct Whole 3/8cSide Salad 1/2 cupCARROTS, Fresh Baby 3/8c
TOMATO, Fresh Cherry 3/8cCUCUMBER, Slices 3/8cWG CHIX Patty, SSBEEF Burger CHZAM AP B 2.5SANDWICH, PB&J D Deck WheatDRES_Ranch, Lite, 1/8 cupDRES_Italian, Lite 1/8 cupCOND_Mayo, LiteCOND_Ketchup 1/4 cupCOND_Mustard, Yellow 1/8 cupMILK, 1% White 8ozMILK, Skim, Chocolate
Total1 Cup1 each1 each3/8 Cup1 Each3/8 Cup1 EACH1 each1 each1/2 Cup3/8 Cup, 10 ea3/8 Cup3/8 Cup1 Each1 Each1 Each1/8 cup1/8 cup1 Tbsp1/4 cup1/8 cup1 Each1 Each
4001002525
25025
10011010010010050
1550
1507525
2001510
16050
160240
5302987756
340429063569
20
107
44132980110029356322
10390
644400
25000000
00
25530
100500
125
47257496
2111208
171015
44
21
875919691290353130765157108125
2.742.801.083.192.001.672.633.202.590.421.64
0.460.404.882.196.700.000.000.000.580.000.000.00
2.991.811.010.601.740.000.260.130.130.150.50
0.160.124.103.863.320.000.000.000.320.000.070.00
533.2243.749.918.1
188.10.05.1
53.46.58.3
18.1
9.17.9
127.5174.2146.5
0.00.00.06.10.0
306.2250.0
9641239
03171304
065
30058
4027819
45741
123252
0000
4360
480500
209248
03246108
605
871564
1134
25500000
2020
145100
1.526.480.0
2.320.00.0
8.7970.964.963.811.47
6.861.811.480.0
0.150.00.00.0
0.590.00.01.2
25.739.282.442.08
15.730.01.1
1.250.280.420.36
0.460.335.39
23.9220.18
1.00.00.0
0.510.0
8.269.0
51.7312.7413.04
9.533.6310.8823.0715.6714.881.754.67
2.291.2246.5
30.54103.97
1.01.911.0
17.780.0
12.2313.0
23.7219.321.791.44
16.140.0
0.330.160.180.0
0.07
0.00.09
18.4512.0134.7310.02.383.5
0.090.0
2.380.0
12.467.060.420.696.470.000.110.010.030.000.01
0.000.013.085.157.601.500.001.000.010.001.550.00
0.000.000.00
*0.000.000.000.000.000.000.000.00
0.000.000.000.000.000.000.000.000.000.000.000.00
Weighted Daily Average% of Calories
735 52 1528 8.90 4.29 561.3 4286 732 26.77 27.5115.0%
90.6049.3%
26.8632.9%
8.4610.4%
*0.00*0.0%
*N/A* - denotes a nutrient that is either missing o r incomplete for an individual ingredient* - denotes combined nutrient totals with either mi ssing or incomplete nutrient data¹ - denotes optional nutrient values
NOTICE: The data contained within this report and the NUTRIKIDS® Menu Planning and Nutritional Analys is software should not be used for and does not pro vide menu planning for a child with a medical condition or food allergy. Ingredi ents and menu items are subject to change or substi tution without notice. Please consult a medical pr ofessional for assistance in planning for or treating medical conditions.

Pender County SchoolsPage 17 Oct 3, 2011 thru Oct 31, 2011 Spreadsheet - Portion Values Jan 18, 2012
ES Lunch Base
Portion Plan Cals Cholst Sodm Fiber Iron Calcm Vit-A Vit-A Vit-C Protn Carb T-Fat S-Fat Tr-Fat¹Size Qty (kcal) (mg) (mg) (g) (mg) (mg) (IU) (RE) (mg) (g) (g) (g) (g) (g)
Tue - 10/25/2011ES Lunch BaseBEEF STROGANOFFPASTA, Egg NoodlesSALAD Chix Bacon Shaker 2.0ROLL, DINNER AP WPEAS, Green Cooked 3/8cTurkey w/AM, Wp B 2.0PEARS, Diced w/Juice 3/8cBANANA, Fresh Regular 1/2 cupORANGES, 138 Quarters1/2 cupAPPLES, 163ct Whole 3/8cSide Salad 1/2 cupCARROTS, Fresh Baby 3/8c
TOMATO, Fresh Cherry 3/8cCUCUMBER, Slices 3/8cWG CHIX Patty, SSFRANK, TURKEY 8-1 B 2.0SANDWICH, PB&J D Deck WheatDRES_Ranch, Lite, 1/8 cupDRES_Italian, Lite 1/8 cupCOND_Mayo, LiteCOND_Ketchup 1/4 cupCOND_Mustard, Yellow 1/8 cupMILK, 1% White 8ozMILK, Skim, Chocolate
Total3/4 CUP1/2 cup1 each1 each3/8 Cup1 Each3/8 cup1 EACH1 each1 each1 Cup3/8 Cup, 10 ea3/8 Cup3/8 Cup1 Each1 Each1 Each1/8 cup1/8 cup1 Tbsp1/4 cup1/8 cup1 Each1 Each
40075752525
25025
10011010010010050
1550
1606525
2001510
15050
240160
21390
2987768
340579063561820
107
44129280110029356322
10390
480
4400
25000000
00
25500
100500
125
6128
57496
2461208
5101
1044
21
875981691290353130765157108125
0.370.822.801.083.942.001.592.633.202.590.831.64
0.460.404.881.076.700.000.000.000.580.000.000.00
1.950.741.811.011.091.740.280.260.130.130.300.50
0.160.124.102.773.320.000.000.000.320.000.070.00
85.210.5
243.749.917.2
188.15.05.1
53.46.5
16.618.1
9.17.9
127.5150.0146.5
0.00.00.06.10.0
306.2250.0
1510
12390
1570304
065
30058
8047819
45741
123348
0000
4360
480500
290
2480
616108
605
1741564
1134
25700000
2020
145100
2.040.0
6.480.07.10.0
0.698.79
70.964.967.611.47
6.861.811.480.0
0.150.00.00.0
0.590.00.01.2
18.153.289.282.443.69
15.730.191.1
1.250.280.830.36
0.460.335.39
11.8120.18
1.00.00.0
0.510.0
8.269.0
11.5616.3812.7413.0410.2233.6315.0523.0715.6714.883.494.67
2.291.2246.5
27.22103.97
1.01.911.0
17.780.0
12.2313.0
11.271.23
19.321.791.48
16.140.030.330.160.180.0
0.07
0.00.09
18.4514.1534.7310.02.383.5
0.090.0
2.380.0
3.640.417.060.420.686.470.000.110.010.030.000.01
0.000.013.084.547.601.500.001.000.010.001.550.00
0.570.000.000.00
*0.000.000.000.000.000.000.000.00
0.000.000.000.000.000.000.000.000.000.000.000.00
Weighted Daily Average% of Calories
671 46 1532 8.86 4.30 454.7 3171 549 30.67 23.6714.1%
84.1050.2%
24.2932.6%
6.268.4%
*0.11*0.1%
*N/A* - denotes a nutrient that is either missing o r incomplete for an individual ingredient* - denotes combined nutrient totals with either mi ssing or incomplete nutrient data¹ - denotes optional nutrient values
NOTICE: The data contained within this report and the NUTRIKIDS® Menu Planning and Nutritional Analys is software should not be used for and does not pro vide menu planning for a child with a medical condition or food allergy. Ingredi ents and menu items are subject to change or substi tution without notice. Please consult a medical pr ofessional for assistance in planning for or treating medical conditions.
Pender County SchoolsPage 18 Oct 3, 2011 thru Oct 31, 2011 Spreadsheet - Portion Values Jan 18, 2012
ES Lunch Base
Portion Plan Cals Cholst Sodm Fiber Iron Calcm Vit-A Vit-A Vit-C Protn Carb T-Fat S-Fat Tr-Fat¹Size Qty (kcal) (mg) (mg) (g) (mg) (mg) (IU) (RE) (mg) (g) (g) (g) (g) (g)
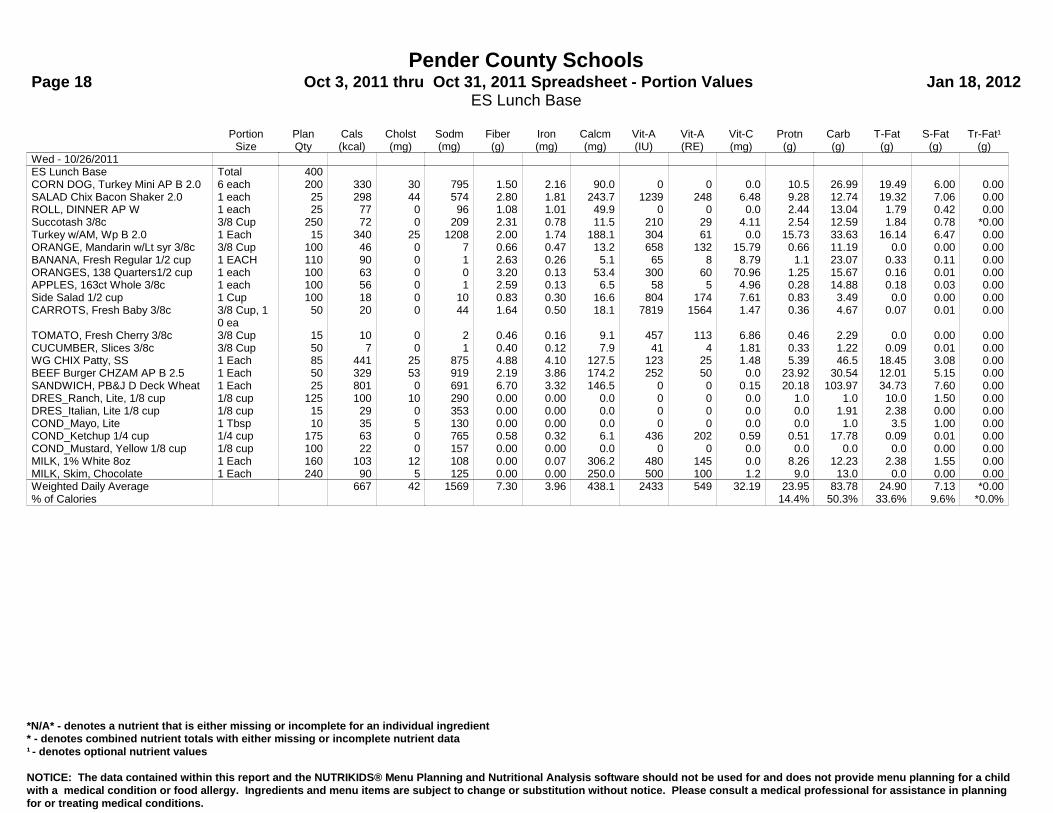
Wed - 10/26/2011ES Lunch BaseCORN DOG, Turkey Mini AP B 2.0SALAD Chix Bacon Shaker 2.0ROLL, DINNER AP WSuccotash 3/8cTurkey w/AM, Wp B 2.0ORANGE, Mandarin w/Lt syr 3/8cBANANA, Fresh Regular 1/2 cupORANGES, 138 Quarters1/2 cupAPPLES, 163ct Whole 3/8cSide Salad 1/2 cupCARROTS, Fresh Baby 3/8c
TOMATO, Fresh Cherry 3/8cCUCUMBER, Slices 3/8cWG CHIX Patty, SSBEEF Burger CHZAM AP B 2.5SANDWICH, PB&J D Deck WheatDRES_Ranch, Lite, 1/8 cupDRES_Italian, Lite 1/8 cupCOND_Mayo, LiteCOND_Ketchup 1/4 cupCOND_Mustard, Yellow 1/8 cupMILK, 1% White 8ozMILK, Skim, Chocolate
Total6 each1 each1 each3/8 Cup1 Each3/8 Cup1 EACH1 each1 each1 Cup3/8 Cup, 10 ea3/8 Cup3/8 Cup1 Each1 Each1 Each1/8 cup1/8 cup1 Tbsp1/4 cup1/8 cup1 Each1 Each
4002002525
25015
10011010010010050
1550855025
1251510
175100160240
3302987772
340469063561820
107
44132980110029356322
10390
304400
25000000
00
25530
100500
125
79557496
2091208
7101
1044
21
875919691290353130765157108125
1.502.801.082.312.000.662.633.202.590.831.64
0.460.404.882.196.700.000.000.000.580.000.000.00
2.161.811.010.781.740.470.260.130.130.300.50
0.160.124.103.863.320.000.000.000.320.000.070.00
90.0243.749.911.5
188.113.25.1
53.46.5
16.618.1
9.17.9
127.5174.2146.5
0.00.00.06.10.0
306.2250.0
01239
021030465865
30058
8047819
45741
123252
0000
4360
480500
0248
02961
1328
605
1741564
1134
25500000
2020
145100
0.06.480.0
4.110.0
15.798.79
70.964.967.611.47
6.861.811.480.0
0.150.00.00.0
0.590.00.01.2
10.59.282.442.54
15.730.661.1
1.250.280.830.36
0.460.335.39
23.9220.18
1.00.00.0
0.510.0
8.269.0
26.9912.7413.0412.5933.6311.1923.0715.6714.883.494.67
2.291.2246.5
30.54103.97
1.01.911.0
17.780.0
12.2313.0
19.4919.321.791.84
16.140.0
0.330.160.180.0
0.07
0.00.09
18.4512.0134.7310.02.383.5
0.090.0
2.380.0
6.007.060.420.786.470.000.110.010.030.000.01
0.000.013.085.157.601.500.001.000.010.001.550.00
0.000.000.00
*0.000.000.000.000.000.000.000.00
0.000.000.000.000.000.000.000.000.000.000.000.00
Weighted Daily Average% of Calories
667 42 1569 7.30 3.96 438.1 2433 549 32.19 23.9514.4%
83.7850.3%
24.9033.6%
7.139.6%
*0.00*0.0%
*N/A* - denotes a nutrient that is either missing o r incomplete for an individual ingredient* - denotes combined nutrient totals with either mi ssing or incomplete nutrient data¹ - denotes optional nutrient values
NOTICE: The data contained within this report and the NUTRIKIDS® Menu Planning and Nutritional Analys is software should not be used for and does not pro vide menu planning for a child with a medical condition or food allergy. Ingredi ents and menu items are subject to change or substi tution without notice. Please consult a medical pr ofessional for assistance in planning for or treating medical conditions.

Pender County SchoolsPage 19 Oct 3, 2011 thru Oct 31, 2011 Spreadsheet - Portion Values Jan 18, 2012
ES Lunch Base
Portion Plan Cals Cholst Sodm Fiber Iron Calcm Vit-A Vit-A Vit-C Protn Carb T-Fat S-Fat Tr-Fat¹Size Qty (kcal) (mg) (mg) (g) (mg) (mg) (IU) (RE) (mg) (g) (g) (g) (g) (g)
Thu - 10/27/2011ES Lunch BaseTURKEY Rst, 2.0GRAVY, BrownSALAD Chix Bacon Shaker 2.0ROLL, DINNER AP WPOTATO, Sweet Whole 1/2 cpTurkey w/AM, Wp B 2.0PEACHES, Diced w/ Juice 3/8cBANANA, Fresh Regular 1/2 cupORANGES, 138 Quarters1/2 cupAPPLES, 163ct Whole 3/8cSide Salad 1/2 cupCARROTS, Fresh Baby 3/8c
TOMATO, Fresh Cherry 3/8cCUCUMBER, Slices 3/8cWG CHIX Patty, SSFRANK, TURKEY 8-1 B 2.0SANDWICH, PB&J D Deck WheatDRES_Ranch, Lite, 1/8 cupDRES_Italian, Lite 1/8 cupCOND_Mayo, LiteCOND_Ketchup 1/4 cupCOND_Mustard, Yellow 1/8 cupMILK, 1% White 8ozMILK, Skim, Chocolate
Total2 ozw1/4 cup1 each1 each1 Each1 Each3/8 Cup1 EACH1 each1 each1 Cup3/8 Cup, 10 ea3/8 Cup3/8 Cup1 Each1 Each1 Each1/8 cup1/8 cup1 Tbsp1/4 cup1/8 cup1 Each1 Each
40017510025
12525015
10011010010010050
1550908025
2001510
10050
160240
5927
29877
161340399063561820
107
44129280110029356322
10390
200
4400
25000000
00
25500
100500
125
2582885749617
12084101
1044
21
875981691290353130765157108125
0.000.232.801.083.812.000.002.633.202.590.831.64
0.460.404.881.076.700.000.000.000.580.000.000.00
0.620.121.811.011.871.740.000.260.130.130.300.50
0.160.124.102.773.320.000.000.000.320.000.070.00
1.94.0
243.749.926.0
188.10.05.1
53.46.5
16.618.1
9.17.9
127.5150.0146.5
0.00.00.06.10.0
306.2250.0
00
12390
1730423565
30058
8047819
45741
123348
0000
4360
480500
00
24803
61478
605
1741564
1134
25700000
2020
145100
0.00.0
6.480.0
16.610.0
0.948.79
70.964.967.611.47
6.861.811.480.0
0.150.00.00.0
0.590.00.01.2
8.090.689.282.444.33
15.730.01.1
1.250.280.830.36
0.460.335.39
11.8120.18
1.00.00.0
0.510.0
8.269.0
1.163.8
12.7413.0436.5933.639.38
23.0715.6714.883.494.67
2.291.2246.5
27.22103.97
1.01.911.0
17.780.0
12.2313.0
2.190.97
19.321.790.22
16.140.0
0.330.160.180.0
0.07
0.00.09
18.4514.1534.7310.02.383.5
0.090.0
2.380.0
0.720.287.060.420.076.470.000.110.010.030.000.01
0.000.013.084.547.601.500.001.000.010.001.550.00
*N/A**0.000.000.00
*N/A*0.000.000.000.000.000.000.00
0.000.000.000.000.000.000.000.000.000.000.000.00
Weighted Daily Average% of Calories
634 41 1243 7.55 4.05 421.9 2164 482 36.20 23.5114.8%
88.6255.9%
19.2127.3%
4.766.8%
*0.00*0.0%
*N/A* - denotes a nutrient that is either missing o r incomplete for an individual ingredient* - denotes combined nutrient totals with either mi ssing or incomplete nutrient data¹ - denotes optional nutrient values
NOTICE: The data contained within this report and the NUTRIKIDS® Menu Planning and Nutritional Analys is software should not be used for and does not pro vide menu planning for a child with a medical condition or food allergy. Ingredi ents and menu items are subject to change or substi tution without notice. Please consult a medical pr ofessional for assistance in planning for or treating medical conditions.

Pender County SchoolsPage 20 Oct 3, 2011 thru Oct 31, 2011 Spreadsheet - Portion Values Jan 18, 2012
ES Lunch Base
Portion Plan Cals Cholst Sodm Fiber Iron Calcm Vit-A Vit-A Vit-C Protn Carb T-Fat S-Fat Tr-Fat¹Size Qty (kcal) (mg) (mg) (g) (mg) (mg) (IU) (RE) (mg) (g) (g) (g) (g) (g)
Fri - 10/28/2011ES Lunch BasePIZZA AP 50/50 Smart Chz WdgSALAD Chix Bacon Shaker 2.0ROLL, DINNER AP WBROCCOLI, w/Cheese 3/8cTurkey w/AM, Wp B 2.0PINEAPPLE, Chunks w/Juice 3/8cBANANA, Fresh Regular 1/2 cupORANGES, 138 Quarters1/2 cupAPPLES, 163ct Whole 3/8cSide Salad 1/2 cupCARROTS, Fresh Baby 3/8c
TOMATO, Fresh Cherry 3/8cCUCUMBER, Slices 3/8cWG CHIX Patty, SSBEEF Burger CHZAM AP B 2.5SANDWICH, PB&J D Deck WheatDRES_Ranch, Lite, 1/8 cupDRES_Italian, Lite 1/8 cupCOND_Mayo, LiteCOND_Ketchup 1/4 cupCOND_Mustard, Yellow 1/8 cupMILK, 1% White 8ozMILK, Skim, Chocolate
Total1 Each1 each1 each3/8 Cup1 Each3/8 Cup1 EACH1 each1 each1 Cup3/8 Cup, 10 ea3/8 Cup3/8 Cup1 Each1 Each1 Each1/8 cup1/8 cup1 Tbsp1/4 cup1/8 cup1 Each1 Each
400250
55
40010
15011010010010050
1550606010
2001510
10050
160240
3102987757
340329063561820
107
44132980110029356322
10390
154406
25000000
00
25530
100500
125
67057496
2971208
5101
1044
21
875919691290353130765157108125
2.002.801.081.962.000.452.633.202.590.831.64
0.460.404.882.196.700.000.000.000.580.000.000.00
2.701.811.010.491.740.330.260.130.130.300.50
0.160.124.103.863.320.000.000.000.320.000.070.00
300.0243.749.958.0
188.19.15.1
53.46.5
16.618.1
9.17.9
127.5174.2146.5
0.00.00.06.10.0
306.2250.0
5001239
08133044565
30058
8047819
45741
123252
0000
4360
480500
100248
01546198
605
1741564
1134
25500000
2020
145100
0.06.480.0
26.190.0
4.098.79
70.964.967.611.47
6.861.811.480.0
0.150.00.00.0
0.590.00.01.2
15.09.282.443.24
15.730.451.1
1.250.280.830.36
0.460.335.39
23.9220.18
1.00.00.0
0.510.0
8.269.0
38.012.7413.043.74
33.637.72
23.0715.6714.883.494.67
2.291.2246.5
30.54103.97
1.01.911.0
17.780.0
12.2313.0
11.019.321.793.87
16.140.0
0.330.160.180.0
0.07
0.00.09
18.4512.0134.7310.02.383.5
0.090.0
2.380.0
4.007.060.422.036.470.000.110.010.030.000.01
0.000.013.085.157.601.500.001.000.010.001.550.00
0.000.000.00
*0.000.000.000.000.000.000.000.00
0.000.000.000.000.000.000.000.000.000.000.000.00
Weighted Daily Average% of Calories
640 41 1541 7.50 4.06 604.3 3131 666 52.87 28.5517.9%
79.1149.5%
23.1932.6%
7.6510.8%
*0.00*0.0%
Weighted Average 669 52 1501 7.74 3.94 477.5 3693 662 30.74 26.3415.7%
84.5650.6%
23.6431.8%
6.558.8%
*0.02*0.0%
*N/A* - denotes a nutrient that is either missing o r incomplete for an individual ingredient* - denotes combined nutrient totals with either mi ssing or incomplete nutrient data¹ - denotes optional nutrient values
NOTICE: The data contained within this report and the NUTRIKIDS® Menu Planning and Nutritional Analys is software should not be used for and does not pro vide menu planning for a child with a medical condition or food allergy. Ingredi ents and menu items are subject to change or substi tution without notice. Please consult a medical pr ofessional for assistance in planning for or treating medical conditions.

Pender County SchoolsPage 21 Oct 3, 2011 thru Oct 31, 2011 Spreadsheet - Portion Values Jan 18, 2012
ES Lunch Base
Portion Plan Cals Cholst Sodm Fiber Iron Calcm Vit-A Vit-A Vit-C Protn Carb T-Fat S-Fat Tr-Fat¹Size Qty (kcal) (mg) (mg) (g) (mg) (mg) (IU) (RE) (mg) (g) (g) (g) (g) (g)
Nutrient Menu AVG % of Cals Target % of Target Miss Data Shortfall Error Messages (if any)CaloriesCholesterol (mg)Sodium (mg)Fiber (g)Iron (mg)Calcium (mg)Vitamin A (IU)Vitamin A (RE)Vitamin C (mg)Protein (g)Carbohydrate (g)Total Fat (g)Saturated Fat (g)Trans Fat (g)
66952
15017.743.94
477.53693662
30.7426.3484.5623.646.550.02
15.75%50.56%31.80%8.82%0.03%
7851008009.004.23
370.451426285
17.4214.56
<=30.00%<10.00%
85%52%
188%86%93%
129%259%232%176%181%
Missing
116
1.260.30
Correction Required - Calories are Low
Correction Required - Sodium too HighCorrection Required - Fiber is LowCorrection Required - Iron is Low
Correction Required - Total Fat too High
*N/A* - denotes a nutrient that is either missing o r incomplete for an individual ingredient* - denotes combined nutrient totals with either mi ssing or incomplete nutrient data¹ - denotes optional nutrient values
NOTICE: The data contained within this report and the NUTRIKIDS® Menu Planning and Nutritional Analys is software should not be used for and does not pro vide menu planning for a child with a medical condition or food allergy. Ingredi ents and menu items are subject to change or substi tution without notice. Please consult a medical pr ofessional for assistance in planning for or treating medical conditions.