Embed Size (px)
Citation preview
Penal Populism and the Public Thermostat:
Crime, Public Punitiveness and Public Policy
Will Jennings, University of Southampton
Emily Gray, University of Sheffield
Stephen Farrall, University of Sheffield
Colin Hay, Sciences Po, Paris
Paper for the P.S.A. Elections, Public Opinion and Parties Specialist Group annual conference, Cardiff,
2015

Abstract
A rising tide of ‘penal populism’ -- encapsulated in more punitive sentencing and the increased use
of imprisonment and social controls -- has been identified in Britain as resulting from the interaction
of political elites and the demand (or perceived demand) of citizens for punitive policy. This paper
sets out to establish whether feedback processes between crime rates, public opinion and public
policy can account for this growth of penal populism in Britain. To do this it considers whether there
has in fact been a punitive shift in mass opinion, and the degree to which this has reflected trends in
crime rates (or perceptions of crime). It examines whether the trend towards popular punitiveness
has, in turn, been reversed in response to the crime drop over the past couple of decades. This uses
the most extensive dataset ever assembled on aggregate opinion on crime and law and order in
Britain (consisting of more than 2,000 survey items collated between 1938 and 2013) to construct a
new over-time measure of punitive attitudes, contrasting the trend in favour of tougher sentencing
with more liberal attitudes on the death penalty. It tests the “thermostatic” response of punitive
attitudes to changes in crime rates, measured at annual intervals over the long-term (1980 to 2013)
and monthly intervals in the shorter-term (2001 to 2013). It then considers the degree to which
changes in mass opinion have impacted on criminal justice policy, specifically in relation to changes
in the incarceration rate and the emphasis of crime in the policy agenda of British government.

Getting tough on crime: policy feedback, penal populism and punitive sentiment
Between 1980 and 2010, the prison population of England and Wales doubled, from around
40,000 to more than 80,000 people. A rising tide of ‘penal populism’ was first identified during the
1990s (see Bottoms 1995; Garland 2001), encapsulated in harsher sentencing, the increased use of
imprisonment, social control orders and other innovative and experimental forms of crime control
(e.g. anti-social behaviour orders). In the aftermath of widespread urban riots across the UK in 2011,
the punitive response of the criminal justice system was showcased in the higher rate of custodial
sentences for rioters compared to similar offences in the previous year (House of Commons Library
2011), increasing the prison population to record levels. This marked the latest apex of the ‘punitive
turn’ in criminal justice policy in Britain, mirroring similar growth of punitiveness in the US (e.g., see
Gottschalk 2006; Enns 2014). In Britain, the grip of this penal punitiveness on mass opinion and
electoral politics is now perceived to be such that it is “a stance that no serious politician can safely
disavow” (Sparks 2003, p. 170). Throughout the 1980s and 1990s, politicians from both main political
parties had increasingly presented themselves as ‘tough on crime’ (Newburn 2007). In this regard,
ideas about penal populism highlight the interaction of political elites and the demand (or perceived
demand) of citizens for punitive policy. Despite the widespread consensus over the rise of penal
populism, as Enns (2014, p. 858) notes, there is much scepticism over the nature and role of mass
opinion in these dynamics (Beckett 1997; Gottschalk 2008). In the UK case, this is reflected in the
disconnect between rising fear of crime (and broader concern about social disorder) and actual falls
in crime rates. What evidence is there, then, that the public has become increasingly punitive? And
to what extent have changes in mass opinion impacted on the expansion of the criminal justice state
and, specifically, the use of imprisonment as a means of punishment?
This paper sets out to establish whether feedback between crime rates, public opinion and
public policy can account for this rising tide of penal populism in Britain. To do this it considers the
degree to which there has in fact been a punitive shift in mass opinion, and the degree to which this
has reflected trends in crime rates (or perceptions of crime). It examines whether the trend towards

popular punitiveness has, in turn, been reversed in response to the crime drop over the past couple
of decades. This uses the most extensive dataset ever assembled on aggregate opinion on crime and
law and order in Britain (consisting of more than 2,000 survey items collated from 1938 to 2013) to
construct a new over-time measure of punitive attitudes, contrasting the trend in favour of tougher
sentencing with more liberal attitudes on the death penalty. It tests the “thermostatic” response of
punitive attitudes to changes in crime rates, measured at annual intervals over the long-term (1970
to 2013) and monthly intervals in the shorter-term (2001 to 2013). It then considers the degree to
which changes in mass opinion have impacted on criminal justice policy, specifically in relation to the
incarceration rate and the emphasis of crime in the policy agenda of British government. As such,
the paper tests the ‘democracy-at-work’ thesis, as criticised by Beckett (1997) but upheld by Enns
(2014) and to some extent Baumgartner et al. (2008). More generally, it considers whether theories
of thermostatic public opinion and dynamic representation can be extended to the case of crime in
the UK. Our findings suggest that the public’s punitiveness is a function the crime rate. Further, we
show that changes in the incarceration rate are associated with changes in punitive opinion, offering
evidence of the opinion-policy link for criminal justice, as has been shown in the US (Enns 2014).
But before introducing our data and the time series analysis, we first reflect on how theories
of feedback in and between public policy and public opinion inform our expectations about the rising
tide of penal populism.
Punitive attitudes and the public thermostat
Implicit to the concept of penal populism is that the public has a preference for generally
punitive policies in the field of criminal justice. These punitive attitudes are viewed as stable and
enduring, as well as electorally popular. Wlezien’s (1995) “thermostatic” theory of public opinion
would suggest, however, that the public’s preferences for punitive policies to deal with crime should
recognise and adjust in response to, changes in policy. Even if most people would agree that crime is
not desirable (a “valence issue” where there is broad consensus over policy ends, Stokes 1963) some

might want the government to be doing more on the issue, some less. The public will have relative
preferences for policy on crime. That is, they will prefer government to be doing more or less (for
example on violent crime, vandalism or anti-social behaviour) relative to the status quo. According
to Wlezien (1995), relative preferences can be theorised as the difference between some underlying
ideal point of the public’s preference for policy (P*) and actual policy (P). This can be expressed:
R = P* – P. (1)
Where R is relative preferences, P* is some ideal level of policy and P is the current level of policy.
Relative preferences therefore may change either as a result of change in the underlying ideal point
or when policy differs. A substantial line of research demonstrates that this is the case across a wide
range of policy domains (e.g. Wlezien 1995; Soroka and Wlezien 2010; Wlezien and Soroka 2012). It
is important to note that changes in policy conditions are not the same as changes in policy, and this
may have implications both for public responsiveness and representation in policy (see Jennings and
Wlezien 2015). In the case of crime we might expect that the relative punitiveness of the public, that
is the degree to which people think government should be more or less tough on offenders, will be a
function of the level of crime in society at large. Specifically, the prevalence of crime (and its impact
on citizens) should influence the unobserved ideal preference, against which relative preferences for
policy (R) are formed. If the crime level is low, the ideal point of public demand for punitive policies
(P*) will be lower than when the crime level is high, with the actual level of policy (P) remaining
unchanged. This relationship should be relatively stable. If this is the case, we would also expect
rises (falls) in the crime rate to lead to thermostatic changes in preferences for more (less) punitive
criminal justice policy. So while Wlezien (1995) tests thermostatic preferences against changes in P
(as measured with changes in public expenditure), here our assumption is that relative preferences
for being tough on crime will respond to P*, as captured by the crime rate. (Of course, there may be
other broader social values influencing the distribution of ideal preferences for penal policy as well,
but would expect at least some correspondence between punitive preferences and the crime rate.)

In the case of crime, the theory of thermostatic public opinion raises additional questions.
Past studies have shown that fear of crime is weakly related to crime (e.g. Biderman 1967; Hough
and Mayhew 1983; Hough 1995; Hale 1996; Warr 2000; Jackson et al. 2007; Jackson 2008). Given
this, public punitiveness might not be as closely associated with changes in the crime rate. Certainly
the “crime gap” – between fear of crime and its actual prevalence – could impede the relationship
between relative preferences for being tough on crime and crime itself. This is testable empirically,
of course. Beckett (2007) criticises the ‘democracy-at-work’ thesis as an explanation for the punitive
shift in crime control, suggesting that popular support for punishment is more ambiguous than often
characterised.1 There are reasons to at least be cautious, then, regarding whether public demand for
being tough on crime is responsive to underlying (and complex) social problems.
Punitive mass opinion and dynamic representation
Political actors have strategic incentives to reflect changes in punitive attitudes of citizens in
their policy decisions. Studies of dynamic representation posit a feedback processes between public
preferences and policy (e.g. Stimson et al. 1995; Wlezien 1995; 1996; Erikson et al. 2002; Soroka and
Wlezien 2010). If the public adjusts its preference for more or less policy in a particular domain, and
government responds, this is dynamic representation (Stimson et al. 1995, p. 543). This is consistent
with the ideas behind penal populism. Office-seeking officials will tend to adjust their policy stance
and performance on crime in view of retaining or gaining support at elections in the future. Parties
in government will also seek to retain (or gain) “ownership” of the issue of law and order, by being
seen to be tough on crime (Holian 2004; Walgrave et al. 2009; Egan 2013). Given these theoretical
expectations, what might be expected of criminal justice policy given the (claimed) punitive shift in
public opinion?
1 Beckett (2007) develops this argument using the longstanding survey question about the “most important
problem” (MIP) facing the nation, a measure itself has been subject to some debate (Wlezien 2005; Jennings and Wlezien 2011). While the MIP provides a good indicator of the issues that are atop people’s minds at a given moment in time, it is less reliable as a measure of preferences or for analysis of representation (Jennings and Wlezien 2015).

Clearly the patterns of responsiveness are going to vary according to the political and legal
system (see Enns 2014 for a discussion of the US). Past studies have revealed the influence of public
opinion over aspects of criminal justice in the US (e.g. Baumgartner et al. 2008; Enns 2014). While
many of the street-level bureaucrats in the British criminal justice system are largely impervious to
direct public or political pressure, there are reasons to believe that aspects of crime control policies
may be responsive to shifts in opinion. Not least the example of the punitive response to the August
2011 riots reveals a willingness of the system to act in such a way as to ‘send a message’. In the UK,
government has direct legislative influence over the content of criminal law, governing offences and
sentencing. It also has direct control over spending on the police and prison system, as well as their
management, and over the introduction of specific crime-stopping initiatives. Elected government
thus has multiple means of pulling the levers of the penal regime to respond to shifts in the public’s
demand for policies that are tough on crime. These are the theoretical expectations. How can they
be tested?
Data and Analysis
Constructing a Measure of Punitive Opinion for the UK
The first survey of public attitudes on criminal justice was fielded by the British Institute of
Public Opinion (which would later become Gallup UK) in January 1938, concerning whether flogging
should be abolished as a punishment for offenders (see Gallup 1976). Early on, polls on crime and
law and order were relatively rare and tended to focus on whether or not the death penalty should
be kept or abolished (the death penalty was eventually abolished in 1965). It is possible to discern
some long-term trends in punitive opinion from major election and social surveys like the British
Election Study (BES) and the British Social Attitudes Survey (BSAS). Since 1982, the British Crime
Survey (now known as the Crime Survey for England and Wales, CSEW), primarily a survey about
self-reported victimisation, has also asked the public about its attitudes on aspects of the criminal
justice system such as sentencing and confidence in the police, courts and prisons. However, most

survey questions relating to crime/punishment have been infrequent and irregular. Additionally, the
initial focus on attitudes towards the death penalty means that data on punitiveness more generally,
for less serious crimes, is far thinner. The sparseness of the data makes it hard to discern long-term
shifts in public attitudes, which may be further obscured due to sampling error. We therefore have a
large amount of information about public attitudes on crime and punishment, observed at different
points in time, but no single continuous measure of opinion.
Following Enns (2014), we use Stimson’s (1991) ‘dyad ratios algorithm’ to extract the latent
underlying dimension of public attitudes towards criminal justice. This captures the degree to which
public opinion is liberal or punitive in its view on how crime should be dealt with. Stimson’s (1991)
method is attractive because it offers a potential solution to the irregular and infrequent availability
of nevertheless informative poll data at different points in time (see McGann 2014 for an alternative
method based on item-response theory). It has been used in other studies to construct measures of
the public mood on immigration (Jennings 2009; Ford et al. 2015), the policy competence of parties
(Green and Jennings 2012), and trust in government (Chanley et al. 2000; Keele 2007). The principle
behind the algorithm is intuitive; the ratio of aggregate-level survey responses to the same question
at different points in time provides meaningful information about the relative state of public opinion
– telling us whether, on average, public attitudes have become more or less punitive (see Stimson
1991, Appendix 1, and Bartle et al. 2011 for an extended technical discussion of the method).2 This
extracts the underlying tendency of all survey items relating to crime and punishment, analogous to
a principal components approach.
2 Each survey item can be expressed as the ratio of attitudes on crime or punishment at two points in time: a
‘dyad’. This ratio provides an estimate of the relative punitive opinion, for a given question, in years t+i and t+j.
jt
itij
X
XP
This enables recursive estimation of the index of punitive opinion for each survey item for each time period based on all data available. Because there are multiple estimates of punitive opinion (i.e. there are multiple survey items) and they are not all equivalent indicators of the latent construct, the dyad ratios algorithm estimates the squared correlation of each series with the underlying dimension and uses this to weight the series (Bartle et al. 2011, p. 269). This correlation is interpretable as a factor loading, and is reported below for selected survey items.

We use data from British Election Study (via Bartle et al. 2011), British Crime Survey and
British Social Attitudes Survey (see Jennings et al. 2015), and sources of poll data from Gallup (see
Gallup 1976) and Ipsos-MORI. This identified all opinion questions relating to the sentencing and
punishment of criminals, capital punishment, confidence in the police or criminal justice system,
how to deal with ‘anti-social behaviour’ (a term which became a buzzword during the 1990s for
juvenile misdemeanours and other low-level crime). Survey items are scored as the percentage of
respondents expressing a punitive attitude or preference; for example, 75 per cent agreeing or
agreeing strongly with the statement “people who break the law should be given stiffer sentences”
(BSAS: 1986-2012) or 65 per cent indicating that non-violent prison sentences should be shorter is a
“bad idea” (CSEW: 1983, 1987). Again following Enns (2014), we include questions that relate to
trust and confidence in the criminal justice system (e.g. courts, police, magistrates).3 The argument
here is that lower levels of confidence in policing and criminal justice will be associated with support
for more punitive action on crime. In total our dataset consists of 2,007 survey items observed over
the period from 1938 to 2013. Because the vast preponderance of survey items fall within the period
from 1980 to 2013, our analysis focuses upon this period. (Full details of the number of survey items
per year are reported in Appendix, Table A1.)
For reasons that will become clear in a moment, we estimate a measure of punitive opinion
including and excluding survey questions relating to the death penalty. In Table 1 we report factor
loadings of selected survey items, as well as the proportion of variance explained by the underlying
factor. Here we see a substantial proportion of variance loads onto a single underlying dimension,
indicating the central tendency in the public’s punitive attitudes. This accounts for 58.1 per cent of
all variance in survey questions on crime and criminal justice, and 63.8 per cent when survey items
relating to the death penalty are omitted. It is also evident in Table 1 that the correlation (i.e. factor
3 It might be argued confidence in the criminal justice system is not a direct measure of expressed preferences
for punitive policy. For example, someone might have a strong preference for liberal, rehabilitation-focused policy but still be confident in the court system and the police. We estimated our measure of punitive opinion including and excluding survey items that relate to trust/confidence and find that the correlation between the two series is more than 0.8.

loading) of a number of items is reversed when attitudes on capital punishment are excluded. This
suggests that punitive opinion on the death penalty may differ in a systematic and meaningful way
from attitudes on other aspects of punishment and confidence in the criminal justice system.
Table 1. Factor Loadings of Selected Question Series and the Measure of Punitive Opinion
Punitive Opinion (incl. death penalty)
Punitive Opinion (excl. death penalty)
N Correlation N Correlation
Survey item
CSEW: Are sentences too tough, about right or too lenient? 16 0.868 16 0.867
CSEW: Are young offenders dealt with too leniently? 15 0.928 15 0.915
CSEW: Would you say the police in this area do a good job or a poor job? 11 -0.963 11 0.854
CSEW: How good a job do you think judges are doing? 11 -0.269 11 0.713
CSEW: How good a job do you think magistrates are doing? 11 -0.769 11 0.941
CSEW: How good a job do you think the prison service is doing? 11 -0.805 11 0.311
BSAS: The law should always be obeyed, even if a particular law is wrong 22 0.444 22 -0.724
BSAS: For some crimes, the death penalty is the most appropriate sentence 24 0.914 24 -
BSAS: People who break the law should be given stiffer sentences 24 -0.360 24 0.358
BSAS: In favour of the death penalty for murder in the course of a terrorist act 8 0.847 - -
BSAS: In favour of the death penalty for murder of a policeman 8 0.873 - -
First dimension
Proportion of variance explained 58.1 63.8
N of series 72 46
N of survey items 2,007 1,850
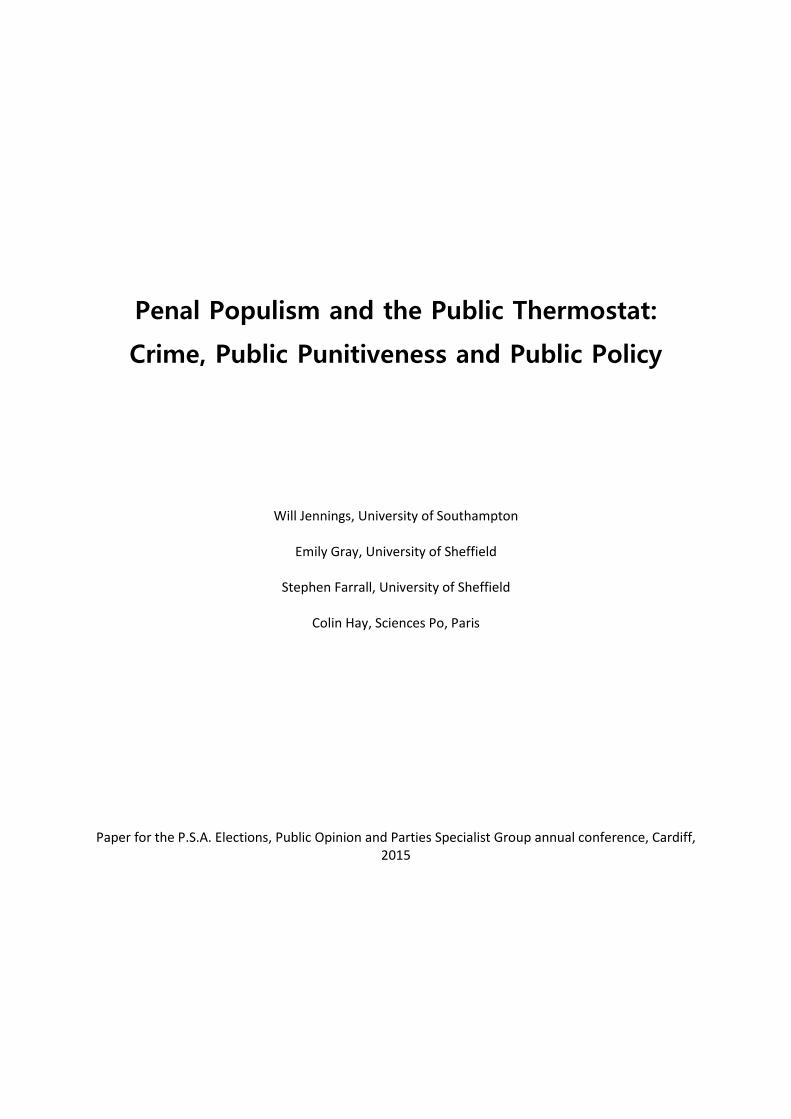
This indeed is what we observe in Figure 1 we plot the respective series for punitive opinion.
Retaining survey questions relating to the death penalty sees an increasingly liberal trend in public
opinion on criminal justice, declining steadily from the 1980s. This trend can be discerned from the
underlying survey data which reveal falling support for the death penalty. In the BSAS, this falls from
74 per cent support in 1986 to 55 per cent in 2012. In contrast, over the same period support for
stiffer sentences rises from 73 per cent to 79 per cent. This is reflected in the alternative measure of
punitive attitudes, excluding public opinion on the death penalty. This reveals a more cyclical trend
in public attitudes, with a fall in punitiveness from the early- to mid-1980s, and then rising punitive
sentiment that peaks around 2005. While this is consistent with claims about the increasing punitive
tide of public opinion, the sudden reversal of this trend from around 2007/8 onwards suggests that
the irreversibility of penal populism may have been overstated. The trends revealed in our measure
suggest that public opinion on crime exhibit important and meaningful over-time variation. Punitive
attitudes are not immutable, and indeed there may be parallel liberal and punitive tides of opinion in
relation to different aspects of criminal justice policy.
Figure 1. Public Opinion on Crime and Punishment, 1980-2013
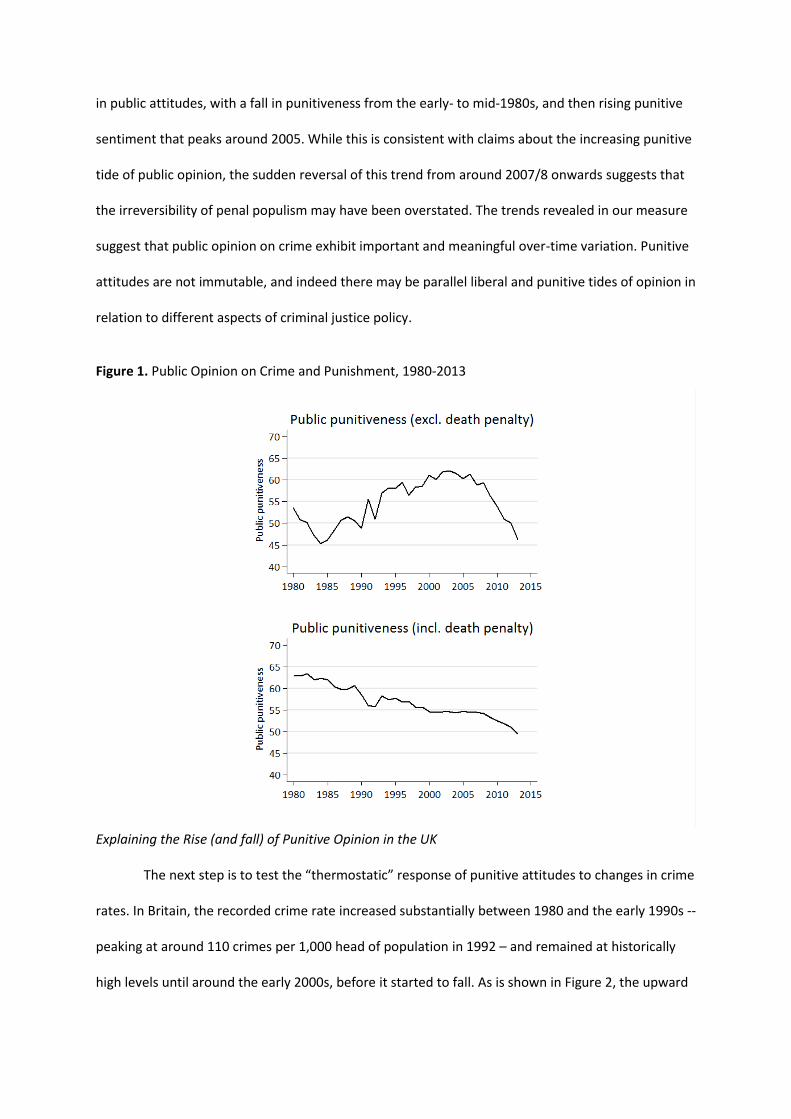
Explaining the Rise (and fall) of Punitive Opinion in the UK
The next step is to test the “thermostatic” response of punitive attitudes to changes in crime
rates. In Britain, the recorded crime rate increased substantially between 1980 and the early 1990s --
peaking at around 110 crimes per 1,000 head of population in 1992 – and remained at historically
high levels until around the early 2000s, before it started to fall. As is shown in Figure 2, the upward

trend in support for being tough on crime moved largely in parallel with the recorded crime rate.
Indeed, the correlation of the series over this period is equal to a substantial 0.61 (N=34, p=0.000).
Notably, the onset of the “crime drop”, from around 2001/2, appears to have directly preceded a
decline in public support for more punitive action on crime. Recall we are interested in the degree to
which punitive opinion reacts to changes in the actual crime rate, as well as perceptions of crime.
Figure 2. Punitive Opinion and Recorded Crime in England & Wales, 1980-2013
We therefore test the lagged effect of the crime rate using a time series regression model in first
differences, where change in punitive opinion at t, is estimated as a function of change in the crime
rate in the previous year, t-1. We also test for the effect of change in fear of crime on public opinion
(using the CSEW survey item about whether people “feel safe walking around in the dark at night”
interpolated for missing years, measured on a four-point scale from “very safe”, “safe”, “unsafe” to
“very unsafe”, so higher values indicate feelings of less personal security). An Augmented Dickey-
Fuller test of the punitive opinion measure does not reject the null of the presence of unit root, and

we thus model the variables in level form.4 The variables are standardised (i.e. the difference from
the mean is divided by the standard deviation) so that relative effects can be compared.
∆PUNITIVEt = 0 + β1∆CRIMEt-1 + β2∆FEARt-1 + µt
The model is fitted with the Prais-Winsten method in order to control for serial autocorrelation of
the residuals (µt), estimated as the first-order autoregressive process: µt = µt-1 + t. The results of the
regression models are reported in Table 2. Here we see that the recorded crime rate has a positive
and significant effect on support for punitive action on crime; a one standard deviation in the rate of
crime leads to a 0.5 standard deviation in punitive opinion. This indicates a substantial substantive
effect. When fear of crime is also controlled for this effect becomes weakly significant (at the 90 per
cent confidence level), and the size of effect is slightly reduced (to 0.3). This nevertheless suggests
that the public’s preference for punitive action on crime is thermostatic: as crime rises, demand for
getting tough on crime also increases, as crime falls so too does support for punitive measures.
Table 2. Recorded Crime, Fear of Crime and Punitive Opinion, 1981-2012
∆PUNITIVEt
(1)
∆PUNITIVEt
(2)
∆CRIMEt-1 0.447 0.296 (0.171)* (0.167)+ ∆FEARt-1 0.401 (0.181)* Intercept -0.011 0.027 (0.057) (0.052) N 31 31 R-squared 0.19 0.34 Adjusted R-squared 0.16 0.29 RMSE 0.43 0.41 Durbin-Watson statistic 1.716 1.714 Rho -0.386 -0.507 Start 1981 1981 End 2012 2012
+ p<0.1; * p<0.05; ** p<0.01; *** p<0.001
4 We also tested alternative model specifications consistent with the time serial properties of the data and our
theoretical expectations; for example, we estimated a single-equation error-correction model including both first differences and lags of the crime rate and fear of crime and the lag of punitive opinion which also revealed a significant and positive lagged effect of the crime rate (though no effect was observed for fear of crime).
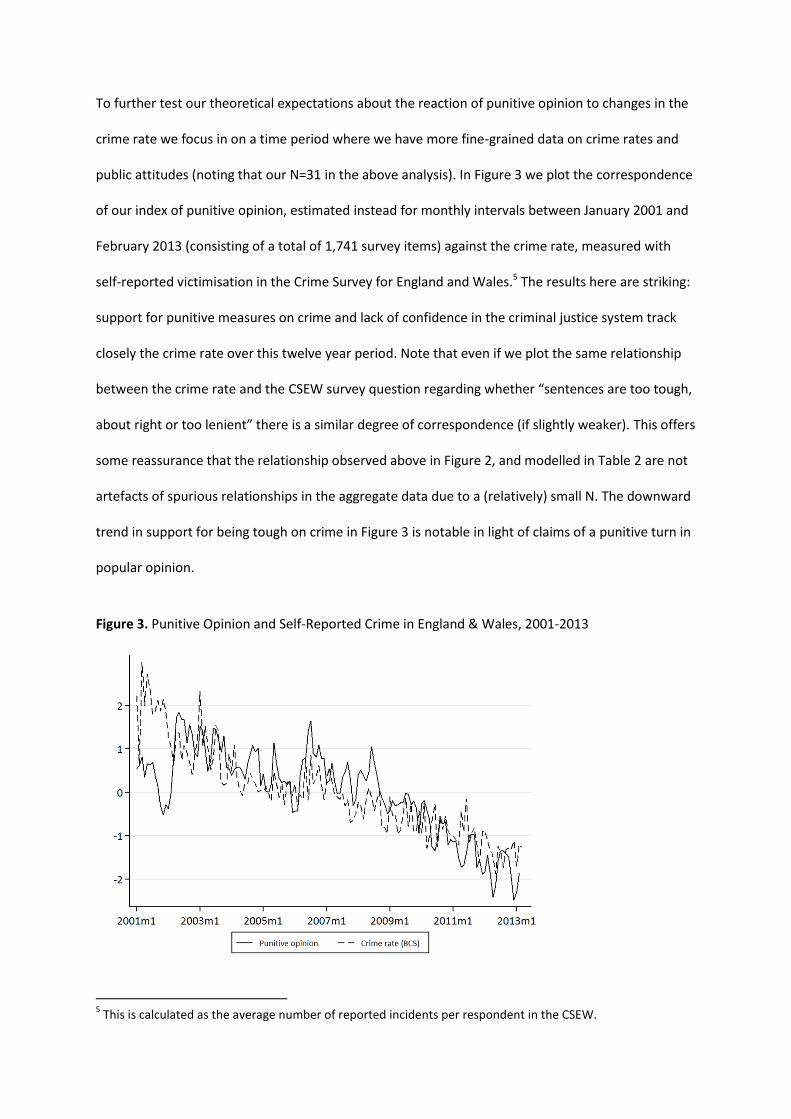
To further test our theoretical expectations about the reaction of punitive opinion to changes in the
crime rate we focus in on a time period where we have more fine-grained data on crime rates and
public attitudes (noting that our N=31 in the above analysis). In Figure 3 we plot the correspondence
of our index of punitive opinion, estimated instead for monthly intervals between January 2001 and
February 2013 (consisting of a total of 1,741 survey items) against the crime rate, measured with
self-reported victimisation in the Crime Survey for England and Wales.5 The results here are striking:
support for punitive measures on crime and lack of confidence in the criminal justice system track
closely the crime rate over this twelve year period. Note that even if we plot the same relationship
between the crime rate and the CSEW survey question regarding whether “sentences are too tough,
about right or too lenient” there is a similar degree of correspondence (if slightly weaker). This offers
some reassurance that the relationship observed above in Figure 2, and modelled in Table 2 are not
artefacts of spurious relationships in the aggregate data due to a (relatively) small N. The downward
trend in support for being tough on crime in Figure 3 is notable in light of claims of a punitive turn in
popular opinion.
Figure 3. Punitive Opinion and Self-Reported Crime in England & Wales, 2001-2013
5 This is calculated as the average number of reported incidents per respondent in the CSEW.
We again model the relationship between change in the crime rate and change in punitive opinion.
This time, using a single-equation error-correction framework, we estimate the contemporaneous
effect of change in the crime rate (∆CRIMEt), as well that lagged effect of change in the crime rate
(CRIMEt-1), controlling for lagged values of punitive opinion (PUNITIVEt-1). The latter captures the rate
of re-equilibration in response to a shock (i.e. the error-correction mechanism).6 The variables are
again standardised so that relative effects can be compared.
∆PUNITIVEt = 0 + β1PUNITIVEt-1 + β2∆CRIMEt + β3CRIMEt-1 + t
The results, reported in Table 3 below, again provide support for the theoretical expectation that
punitive opinion will be responsive to the crime rate. A one standard deviation change in the self-
reported rate of victimisation leads to a 0.1 standard deviation increase in punitive attitudes on
crime. Similarly, a one standard deviation increase in the lagged value of the self-reported crime rate
leads to a 0.1 standard deviation in opinion. Additionally, the error-correction parameter (-0.121,
p<0.01) indicates that 90 per cent of a one-unit shock to punitive opinion remains after one month,
81 per cent after the second month (0.9 x 0.9), 0.73 per cent after the third month (0.9 x 0.9 x 0.9),
and so on. It is clear, then, that public support for being tough on crime is responsive over time to
the rate of crime – at least for the period in question.
6 When contemporaneous and lagged values of fear of crime are also included in the model, their effects are
not significant at the 95 per cent confidence level. A fully specified model including the interaction of fear of crime and the (self-reported) crime rate provides further support for positive and significant short- and long-run effects of the crime rate, and a slightly superior model fit (the interaction of the lag of the crime rate and fear of crime is negative and significant, indicating that the effect of the crime rate on punitive opinion is lower when fear of crime is higher). We opt to present a more parsimonious model here, but the general inferences remain the same.

Table 3. Self-Reported Crime and Punitive Opinion
∆PUNITIVEt
PUNITIVEt-1 -0.121 (0.041)** ∆CRIMEt 0.136 (0.060)* CRIMEt-1 0.100 (0.043)* Intercept -0.013 (0.029) N 145 R-squared 0.074 Adjusted R-squared 0.054 RMSE 0.348 Durbin-Watson statistic 1.753 Start 2001 M1 End 2013 M3
* p<0.05; ** p<0.01; *** p<0.001
Does Public Opinion Influence Criminal Justice Policy?
If public opinion becomes more or less punitive in direct response to changes in crime rates,
it might be expected that vote-maximising politicians would, in turn, look to adjust criminal justice
policies to offer reassurance to citizens wanting them to get tough on crime. There are many ways
that elected representatives might look to respond to public support for tougher policies on crime,
and these are contingent on the particular configuration of the political system and arrangement of
policing and criminal justice. They might increase spending (if in a position to), hold hearings into the
issue or announce crime control initiatives, engage in rhetoric about “getting tough on crime”, or
make changes to the law relating to evidence or sentencing. As is the case in the US (Enns, p. 862),
incarceration rates provide a good measure of the punitiveness of criminal justice policy since policy-
makers have substantial power over the creation of offences, sentencing and general rules around
prisoners on parole and license. They also to a much lesser extent indicate the effectiveness of the
criminal justice system as a whole in detecting and prosecuting offenders. While political means of
influence over incarceration policy in the UK are quite direct, the absence of political appointees in
police, prosecutors or judiciary might be expected to insulate it somewhat from pressures of public
opinion, as observed in the US.

For initial analysis of dynamic representation, we use change in the incarceration rate (per
1,000 head of population) as our dependent variable. Change in the number of new admittances to
the prison population is preferable to measuring the current prison population level, which is a stock
measure reflecting the accumulation of all decisions taken up to that time point. As Enns (2014, pp.
862-863) puts it: “…if ... the incarceration rate reflects shifts in the public’s support for being tough
on crime ... an increase (decrease) in the public’s punitiveness should correspond with more (fewer)
new admittances.” We plot our measure of public punitiveness against change in the incarceration
rate in Figure 4.
Figure 4. Punitive Opinion and Change in the Incarceration Rate in England & Wales, 1980-2013
While the incarceration rate dances around a little more than the measure of punitive public opinion
(understandably as the dyad ratios algorithm smooths the series to control for sampling error), this
reveals a fair degree of covariation between the series. Indeed, the correlation between the series is
equal to 0.47 (p<0.01).

To model the relationship between public punitiveness and the incarceration rate we use an
error-correction model (ECM). Drawing on the approach used by Enns (2014), this enables us to test
the short-run and long-run effects of our predictors of interest. Specifically, we model change in the
incarceration rate as a function of change in and lagged values of public punitiveness and the crime
rate, with lagged values of the incarceration rate included to control for the rate of error-correction
(INCARCERATIONt-1). The model takes the form:
∆INCARCERATIONt = 0 + β1INCARCERATIONt-1 + β2∆PUNITIVEt + β3PUNITIVEt -1
+ β4∆CRIMEt + β5CRIMEt-1 + µt
The model is again fitted with the Prais-Winsten method in order to control for serial autocorrelation
of the residuals (µt), estimated as the first-order autoregressive process: µt = µt-1 + t. The variables
are standardised so that relative effect sizes can be compared. The results of a base model of change
in the incarceration rate, presented in the first column of Table 4, suggest that public punitiveness is
associated with increases in punishment. This finding is largely confirmed by the ECMs presented in
the second and third columns, which reveal positive and weakly significant (p<0.1) short-run effects
of punitive attitudes and positive and strongly significant (p<0.05) long-run effects. Interestingly, and
in contrast to findings for the US (Enns 2014, p. 866) the short-run effect of the crime rate on change
in incarceration is negative and significant. That is, an increase in the crime rate in a given period is
associated with a fall in the prison population (per head of general population). This is surprising, as
it would not be expected that rising crime would be associated with falling rates of incarceration --
and merits further investigation.

Table 4. The Relationship between Punitive Opinion and Changes in the Incarceration Rate, 1980-2013
∆INCARCERATIONt
(1)
∆INCARCERATIONt
(2)
∆INCARCERATIONt
(3)
∆INCARCERATIONt
(4)
PUNITIVEt 0.015 (0.006)* INCARCERATIONt-1 -0.066 -0.095 -0.072 (0.037)+ (0.037)* (0.076) ∆PUNITIVEt 0.072 0.094 0.083 (0.040)+ (0.048)+ (0.055) PUNITIVEt-1 0.107 0.113 0.101 (0.037)** (0.047)* (0.058)+ ∆CRIMEt -0.184 -0.178 (0.075)* (0.083)* CRIMEt-1 -0.037 -0.013 (0.043) (0.068) ∆INEQUALITYt -0.111 (0.149) INEQUALITYt-1 -0.032 (0.074) Intercept -0.733 0.068 0.070 0.080 (0.321)* (0.034)+ (0.026)* (0.032)* N 33 33 33 31 R-squared 0.17 0.25 0.41 0.36 Adjusted R-squared 0.14 0.18 0.30 0.17 RMSE 0.12 0.12 0.11 0.12 Durbin-Watson statistic 1.816 1.830 1.800 1.807 Rho 0.414 0.406 0.253 0.231 Start 1981 1981 1981 1981 End 2013 2013 2013 2013
+ p<0.1; * p<0.05; ** p<0.01; *** p<0.001
As previously for our test of the thermostatic public, it is possible to focus our analysis in on a period
where we have more fine-grained data on public attitudes and incarceration rates. This uses data on
the total prison population from the monthly bulletins of the Ministry of Justice (and previously the
Home Office) as well as data on crime rates from the CSEW.7 In Figure 5 we plot the de-trended
measures as the prison population and punitive opinion series exhibit underlying persistence that
may otherwise conceal the relationship of interest. The figure reveals a degree of commonality
between the series, although public opinion is far more volatile, with the correlation equal to 0.61
(p<0.001).
7 We use the total prison population instead of the per capita measure used above because monthly estimates
of the UK population are not published by the Office for National Statistics. This likely is a contributing factor in the upward trend in the prison population during the period.

Figure 5. Punitive Opinion and the Prison Population in England & Wales, de-trended series, 2001-
2013
For our final test of responsiveness of the incarceration rate to the public’s preferences for punitive
policy, we estimate another ECM including the short- and long-run effects of punitive attitudes, also
including a control for time to capture the underlying trend in the prison population over the period
between 2001 and 2013. We also estimate a model, report in the second column of Table 5, using a
specific survey question that is asked monthly in the CSEW “Are sentences too tough, about right or
lenient?” This provides further confirmation that our index of punitive opinion has indicator validity
as a measure of public preferences. In terms of the results presented in Table 5, we see that punitive
opinion has positive and significant short- and long-run effects on the incarceration rate. Further,
the error-correction parameter (-0.316, p<0.001) indicates that shocks to the prison population are
quickly absorbed. The control for time indicates that there is a significant positive trend in the size of
the prison population.

Table 5. The Relationship between Punitive Opinion and Change in the Incarceration Rate, 2001-2013
∆INCARCERATIONt
(1)
∆INCARCERATIONt
(2)
INCARCERATIONt-1 -0.316 -0.242 (0.057)*** (0.049)*** ∆PUNITIVEt 0.109 0.040 (0.029)*** (0.014)** PUNITIVEt-1 0.105 0.050 (0.023)*** (0.014)*** TIMEt 0.009 0.005 (0.002)*** (0.001)*** Intercept -5.051 -3.097 (0.938)*** (0.685)*** N 145 146 R-squared 0.253 0.184 Adjusted R-squared 0.232 0.161 RMSE 0.118 0.123 Durbin-Watson statistic 2.000 2.039 Start 2001 M1 2001 M1 End 2013 M3 2013 M3
+ p<0.1; * p<0.05; ** p<0.01; *** p<0.001
Together, these results provide considerable support for the theoretical expectation that public
opinion exerts an influence over the functioning of the criminal justice system. We observe positive
and significant effects of our measure of punitive attitudes on the incarceration rate over both the
longer- and shorter-term using alternative measures of public preferences for policy. The remaining
question regarding the influence of public opinion on crime is whether it also translates into broader
political emphasis of the issue in the policy agenda of government. Using data from the UK Policy
Agendas Project (www.policyagendas.org.uk) we are able to test the effect of punitive opinion on
the proportion of the Queen’s Speech (the annual statement of the British government’s executive
and legislative priorities for the forthcoming parliamentary session, see Jennings et al. 2011) that is
assigned to the issue of crime, law and order. We again use an ECM framework, standardising all the
variables.

Table 6. The Relationship between Punitive Opinion and the Queen’s Speech, 1980-2011
∆QSt
QSt-1 -1.037 (0.214)*** ∆PUNITIVEt 0.847 (0.446)+ PUNITIVEt-1 1.116 (0.391)** ∆CRIMEt 0.291 (0.574) CRIMEt-1 -0.403 (0.288) ∆MIPt 0.145 (0.317) MIPt-1 -0.236 (0.294) Intercept -0.050 (0.166) N 29 R-squared 0.578 Adjusted R-squared 0.437 RMSE 0.856 Durbin-Watson statistic 2.124 Start 1981 End 2011
+ p<0.1; * p<0.05; ** p<0.01; *** p<0.001
The results presented in Table 6 provide further confirmation of the strong association between
public attitudes and attention of policy-makers to the issue of crime. While the Queen’s Speech is
not what might be described as a fruitful venue for ‘rhetorical’ politics it nevertheless provides the
government with a high profile platform to selectively emphasise issues of importance to the wider
public, media and other organised interests. Change in mass opinion is significantly associated with
increased attention to the issue of crime and as such seems to be a major factor in the rise of the
criminal justice state (Garland 2001).
Conclusion
As crime rose steadily throughout the 1980s and much of the 1990s, public anxiety and
demand for penal policies that were tough on crime grew, leading to the increased attentiveness of
government to criminal justice policy. During the same period, the rate of imprisonment doubled,
putting substantial strain on Britain’s prison system and, in particular, its overcrowded antiquated

Victorian prisons. As we have shown here, the rising tide of punitive opinion was an important factor
in the increased use of incarceration as a policy response. The ‘prison works’ school of the new right
(continued under the New Labour government) therefore reflected popular support for government
being tough on crime. While many accounts of penal populism emphasise the politicization of the
issue of crime by parties and politicians, evidence we have presented here suggests that the shifting
public mood on crime preceded increases in the incarceration rate and government attention to the
issue of crime. At the same time, we have also shown that the tide of punitive opinion has turned
since the mid-2000s, applying a brake (if not leading to a complete reversal) to the size of the prison
population.
Our analysis is based on new dataset on public attitudes on crime and punishment in the UK
that is unprecedented in its scope, consisting of more than 2,000 observations of aggregate-level
survey items. This enabled us to determine whether there has been a punitive shift in opinion; and
we provide some support for this claim. We also found, however, that public support for being tough
on crime has declined over the past decade, in parallel with falling crime rates. In sum, the findings
offer substantial support for the thermostatic theory of public opinion, applied to the policy domain
of criminal justice in the case of the UK (between 1980 and 2013). Alongside this, the results reveal
that public punitiveness does influence the incarceration rate as well as the policy agenda of British
government on the issue. This is consistent with the findings of Enns’ (2014) study of mass opinion
and incarceration in the US spanning the period between 1953 and 2010. Cross-national similarities
here point to the prospective value of future comparative investigation.
The methodological approach adopted for our analysis leaves a few questions unanswered.
One is whether some policy feedback processes might start ‘downstream’ in other domains. For
instance it is well-established that economic conditions are a contributing factor to crime rates, and
it therefore might follow that decisions in relation to management of the economy may impact on
policy in other domains, e.g. crime, leading to public demand for policies that are tougher on crime.
The idea of “policy as its own cause” of course is not new (Wildavsky 1979). Another question relates

to whether media, politicians or organised interests might still lead public attitudes on crime, and
the public responsiveness that we observe is driven by omitted variables reflecting elite mobilization
of mass opinion. While we cannot be sure, the similar findings observed over the longer-term (from
1980 to 2013) and the shorter-term (from January 2001 to March 2013), where the time series are a
function of different data-generating processes (recorded crime rates compared with self-reported
victimisation rates), should provide confidence that the rise and fall of public punitiveness fits with
the theoretical expectations of thermostatic opinion. This also underpins a possible argument that
penal populism was simply a strategic response of policy-makers to the rising punitive tide of mass
opinion, but that as crime rates have fallen (some might argue due to the increasingly tough policies
on crime) this thirty year trend has reversed, and increasingly liberal public attitudes on crime have
contributed to stabilisation of the prison population. How long this apparently liberal turn in public
opinion lasts may have significant impacts in the long-term on the culture of control and potentially
the rolling-back of the criminal justice state in Britain.

Bibliography
Bartle, John, Sebastian Dellepiane-Avellaneda and James A. Stimson. (2011). ‘The Moving Centre: Preferences for Government Activity in Britain, 1950-2005.’ British Journal of Political Science 41(2): 259-285.
Baumgartner, Frank R., Suzanna L. De Boef, and Amber E. Boydstun. (2008). The Decline of the Death Penalty and the Discovery of Innocence. Cambridge: Cambridge University Press.
Beckett, Katherine. (1997). Making Crime Pay: Law and order in contemporary American politics. Oxford: Oxford University Press.
Biderman, Albert D., L.A. Johnson, J. McIntyre and AW. Weir. (1967). ‘Report on a Pilot study in the District of Columbia on Victimization and Attitudes Toward Law Enforcement.’ President’s Commission on Law Enforcement and Administration of Justice, Field Surveys I. Washington, DC: US Government Printing Office.
Bottoms, Anthony. (1995). ‘The Politics of Sentencing Reform.’ In Chris Clarkson and Rod Morgan (eds.), The Philosophy and Politics of Punishment and Sentencing. Oxford: Oxford University Press.
Budge, Ian, and Dennis Farlie. (1983). Explaining and Predicting Elections: Issue Effects and Party Strategies in Twenty-Three Democracies. London: Allen & Unwin.
Chanley, Virginia A., Thomas Rudolph and Wendy M. Rahn. (2000). ‘The Origin and Consequences of Public Trust in Government: A Time Series Analysis.’ Public Opinion Quarterly 64: 239-257.
Chanley, Virginia A. (2002). ‘Trust in Government in the Aftermath of 9/11: Determinants and Consequences.’ Political Psychology 23(3): 469-483.
Egan, Patrick. (2013). Partisan Priorities: How Issue Ownership Drives and Distorts American Politics. Cambridge: Cambridge University Press.
Enns, Peter. (2014). ‘The Public’s Increasing Punitiveness and Its Influence on Mass Incarceration in the United States’. American Journal of Political Science 55(4): 857-872.
Erikson, Robert S., Michael B. MacKuen and James A. Stimson. (2002). The Macro Polity. Cambridge: Cambridge University Press.
Ford, Rob, Will Jennings and Will Somerville. (2015). ‘Public opinion, responsiveness and constraint: Britain's three immigration policy regimes.’ Journal of Ethnic and Migration Studies 41(9): 1391-1411.
Gallup, George H. (ed.). (1976). The Gallup International Public Opinion Polls, Great Britain: 1937-1975. New York: Random House.
Garland, David. (2001). The Culture of Control. Oxford: Oxford University Press.
Gottschalk, Marie. (2006). The Prison and the Gallows: The Politics of Mass Incarceration in America. Cambridge: Cambridge University Press.
Gottschalk, Marie. (2008). ‘Hiding in Plain Sight: American Politics and the Carceral State.’ Annual Review of Political Science 11: 235-260.

Gray, Emily, Jonathan Jackson and Stephen Farrall. (2008). ‘Reassessing the Fear of Crime.’ European Journal of Criminology 5(3): 309-326.
Green, Jane, and Will Jennings. (2012). ‘Valence as Macro-Competence: An Analysis of Mood in Party Competence Evaluations in the U.K.’ British Journal of Political Science 42(2): 311-343.
Hale, Chris. (1996). ‘Fear of Crime: A Review of the Literature.’ International Review of Victimology 4(2): 79-150.
Hall, Stuart, Chas Chritcher, Tony Jefferson, John Clarke and Brian Roberts. (1978). Policing the Crisis. London: Macmillan.
Holian, David B. (2004). ‘He’s Stealing My Issues! Clinton’s Crime Rhetoric and the Dynamics of Issue Ownership.’ Political Behavior 26(2): 95-124.
Hough. Michael. (1995). Anxiety about Crime: Findings from the 1994 British Crime Survey, Home Office Research Study 147. London: Home Office.
Hough, Michael, and Patricia Mayhew. (1983). The British Crime Survey: First Report, Home Office Research Study No. 76. London: Home Office.
House of Commons Library. (2011). The August 2011 riots: a statistical summary. Research paper 11/71. London: House of Commons Library.
Jackson, Jonathan. (2008). Bridging the social and the psychological in fear of crime research. In Murray Lee and Stephen Farrall (eds.), Fear of Crime: Critical voices in an age of anxiety. London: Glasshouse.
Jennings, Will. (2009). ‘The Public Thermostat, Political Responsiveness and Error-Correction: Border Control and Asylum in Britain, 1994-2007.’ British Journal of Political Science 39(4): 847-870.
Jennings, Will, Shaun Bevan and Peter John. (2011). ‘The Agenda of British Government: the Speech from the Throne, 1911-2008.’ Political Studies 59(1): 74-98.
Jennings, Will, Stephen Farrall and Shaun Bevan. (2012). ‘The Economy, Crime and Time: an analysis of recorded property crime in England & Wales 1961-2006.’ International Journal of Law, Crime and Justice 40(3): 192-210.
Jennings, Will, Emily Gray, Colin Hay and Stephen Farrall. (2015). ‘Collating Longitudinal Data on Crime, Victimisation and Social Attitudes in England and Wales: A New Resource for Exploring Long-term Trends in Crime.’ British Journal of Criminology 55(5): 1005-1015.
Jennings, Will, and Peter John. (2009). ‘The Dynamics of Political Attention: Public Opinion and the Queen’s Speech in the United Kingdom.’ American Journal of Political Science 53(4): 838-854.
Jennings, Will, and Christopher Wlezien. (2011). ‘Distinguishing between Most Important Problems and Issues?’ Public Opinion Quarterly 75(3): 545-555.
Jennings, Will, and Christopher Wlezien. (2015). ‘Problems, Preferences and Representation’. Political Science Research and Methods 3(3): 659-681.
Keele, Luke J. (2005). ‘Macro Measures and Mechanics of Social Capital.’ Political Analysis 13(2): 139-156.

Keele, Luke J. (2007). ‘Social Capital and the Dynamics of Trust in Government’, American Journal of Political Science 51(2): 241-254.
Kellstedt, Paul M. (2000). ‘Media Framing and the Dynamics of Racial Policy Preferences.’ American Journal of Political Science 44(2): 245-260.
McGann, Anthony J. (2014). ‘Estimating the Political Center from Aggregate Data: An Item Response Theory Alternative to the Stimson Dyad Ratios Algorithm.’ Political Analysis 22(1): 115-129.
Newburn, Tim. (2007). ‘Tough on Crime: Penal Policy in England and Wales’. Crime and Justice 36: 425-470.
Petrocik, John R. (1996). ‘Issue Ownership in Presidential Elections, with a 1980 Case Study.’ American Journal of Political Science 40(3): 825-850.
Soroka, Stuart N., and Christopher Wlezien. (2010). Degrees of Democracy: Politics, Public Opinion, and Policy. Cambridge: Cambridge University Press.
Sparks, Richard. (2003). ‘State of insecurity: punishment, populism and contemporary political culture.’ In Sean McConville (ed.) The Use of Punishment. London: Routledge, pp. 149-174.
Stimson, James A. (1991). Public Opinion in America: Moods, Cycles, and Swings. Boulder: Westview.
Stimson, James A., Michael B. MacKuen and Robert S. Erikson. (1995). ‘Dynamic Representation.’ American Political Science Review 89(3): 543-65.
Stokes, Donald E. (1963). ‘Spatial Models of Party Competition.’ American Political Science Review 57(2): 368-377.
Walgrave, Stefaan, Jonas Lefevere and Michiel Nuytemans. (2009). ‘Issue Ownership Stability and Change: How Political Parties Claim and Maintain Issues Through Media Appearances.’ Political Communication 26(2): 153-172.
Warr, Mark. (2000). ‘Public Perceptions of and Reactions to Crime.’ In Joseph F. Sheley (ed.), Criminology: A Contemporary Handbook. Belmont, CA: Wadsworth.
Wildavsky, Aaron. (1979). “Policy as its own cause.” In Aaron Wildavsky (ed.), Speaking Truth to Power. Boston: Little, Brown.
Wlezien, Christopher. (1995). ‘The Public as Thermostat: Dynamics of Preferences for Spending.’ American Journal of Political Science 39(4): 981-1000.
Wlezien, Christopher. (1996). ‘Dynamics of Representation: The Case of US Spending on Defence.’ British Journal of Political Science 26(1): 81-103.
Wlezien, Christopher. (2005). ‘On the Salience of Political Issues: The Problem with ‘Most Important Problem.’’ Electoral Studies 24(4): 555-579.
Wlezien, Christopher, and Stuart N. Soroka. (2012). ‘Policy-Institutions and the Opinion-Policy Link.’ West European Politics 35(6): 1407-1432.

APPENDIX
Table A1: N of Survey Items on Crime, Criminal Justice
Year Incl.
death penalty
Excl. death
penalty
1938 4 2
1939 1 1
1940 0 0
1941 0 0
1942 0 0
1943 0 0
1944 0 0
1945 0 0
1946 0 0
1947 4 0
1948 0 0
1949 0 0
1950 0 0
1951 0 0
1952 0 0
1953 2 0
1954 0 0
1955 2 0
1956 2 0
1957 0 0
1958 1 0
1959 0 0
1960 0 0
1961 1 0
1962 4 0
1963 1 0
1964 2 0
1965 2 0
1966 1 0
1967 0 0
1968 0 0
1969 1 0
1970 3 0
1971 0 0
1972 0 0
1973 3 3
1974 1 0
1975 1 0
1976 3 3
1977 1 0
1978 5 1
1979 3 1
1980 0 0
1981 20 8
1982 10 0
1983 22 7
1984 4 1
1985 13 9
1986 6 4
1987 20 9
1988 0 0
1989 17 3
1990 15 10
1991 7 6
1992 3 2
1993 11 7
1994 21 7
1995 14 9
1996 8 7
1997 10 9
1998 2 1
1999 12 11
2000 3 2
2001 128 126
2002 123 122
2003 123 122
2004 125 124
2005 123 121
2006 121 120
2007 154 153
2008 181 180
2009 159 158
2010 159 158
2011 159 158
2012 150 149
2013 36 36