Embed Size (px)
Citation preview

PEER-REVIEWED ARTICLE bioresources.com
Li et al. (2013). “Structure and properties of lignin,” BioResources 8(4), 5120-5132. 5120
Chemical Structure and Thermochemical Properties of Enzymatically Acidolyzed Lignins from Soft and Hard Wood
Ji-Biao Li, Shu-Bin Wu,* and Xiao-Hong Li
Enzymatic/Mild Acidolysis Lignin (EMAL) was isolated from Cunninghamia lanceolata and eucalyptus woods. The chemical structure and thermochemical properties were characterized by means of elemental analysis, Fourier transform infrared spectroscopy (FT-IR), thermal gravimetric analysis (TG), and pyrolysis-gas chromatography combined with mass spectrometry (Py-GC/MS). The EMAL isolated from Cunninghamia lanceolata (C-EMAL) had larger HHV (higher heat value) in comparison to the EMAL isolated from eucalyptus (E-EMAL) due to the greater carbon content of the C-EMAL. The E-EMAL had more syringyl units, whereas the C-EMAL contained more guaiacyl units. It was observed that thermal decomposition occurred over a wide temperature range, and that at a given starting temperature, within the same sample, a higher heating rate produced a higher temperature at which maximum weight loss peaked. The pyrolysis products were mainly composed of carboxylic acids, alcohols, ketones, aldehydes, olefins, alkanes, esters, ethers, and phenols. At all pyrolysis temperatures, the largest components of the pyrolysis products obtained from C-EMAL were the phenols.
Keywords: Lignin; Elemental analysis; FT-IR; TG; Py-GC/MS
Contact information: State Key Lab. Pulp & Paper Engineering, South China University of Technology
Guangzhou, Guangdong, P R. China 510640; *Corresponding author: [email protected]
INTRODUCTION
With increasing concerns about environmental protection and the depletion of
fossil fuels, the need for efficient utilization of biomass resources has attracted worldwide
interest, as biomass has been recognized as a potential source of renewable energy to
replace the declining fossil fuel resources (Demirbas 2002; Pattiya 2011). Currently,
about 80 to 85% of the accumulated carbon dioxide in the atmosphere is attributed to the
combustion of fossil fuels and land abuse, especially deforestation.
Focus has gradually turned to replacing fossil fuels with renewable ones to
decrease the emissions of greenhouse gases. To achieve this shift to renewable fuels, new
strategies and large-scale processes for production are needed. Biomass energy has
become one of the most important ingredients in the sustainable energy system due to its
renewability, abundance, and significant environmental benefits (Chauhan and Kaith
2012). Recently, many methods have been developed for biomass utilization, such as
combustion (McIlveen-Wright et al. 2006.), pyrolysis (Lou et al. 2010; Lv et al. 2012),
gasification (Lu et al. 2008; Zhang et al. 2012), and liquefaction (Saisu et al. 2003; Fang
et al. 2008; Roberts et al. 2010).
Previous studies have focused on the thermochemical properties of biomass raw
materials such as cellulose, hemicellulose, and other model compounds. Hazelnut shell

PEER-REVIEWED ARTICLE bioresources.com
Li et al. (2013). “Structure and properties of lignin,” BioResources 8(4), 5120-5132. 5121
(Demirbas 2010) was liquefied in glycerol and glycerol Na2CO3 mixture and in water
directly, and it was found that sodium carbonate could lead to the hydrolysis of macro-
molecules, such as cellulose and hemicellulose, into smaller fragments, and the polar
glycerol solvent molecules are attracted to the dry solid matrix and held by hydrogen
bonding forces; The thermochemical conversion of catechol as a lignin model compound
(Wahyudiono et al. 2009) was studied in supercritical water, and it was observed that
phenol was considered as a main product of catechol decomposition and the formation of
phenol increased with an increase in water density. However, research on lignin is scarce
compared with the research that has been done on various other biomass materials. In this
work, a method proposed by Wu et al. (2006) for obtaining enzymatic/mild acidolysis
lignin (EMAL) from wood fiber was applied. This method efficiently contributed to the
separation of chemical bonds between lignin and carbohydrate under mild chemical
conditions. With the aim investigating the pyrolytic properties of lignin, this work will
present information on the thermochemical characteristics of lignin and on the
distribution of small molecular weight compounds as determined by TG and Py-GC/MS,
which is of great guiding significance for revealing the pyrolysis mechanism of lignin.
EXPERIMENTAL
Materials Eucalyptus and Cunninghamia lanceolata
Eucalyptus (species not identified) and Cunninghamia lanceolata woods were
acquired from Guangdong Province (P. R. China). These two raw materials were ground
using a disintegrator, and then extracted for 48 h using an acetone solvent and later ball-
milled for at least 60 h. The obtained powder was used for the preparation of EMAL,
which was conducted via isolation of the lignin from both kinds of wood.
Cellulase enzymatic hydrolysis
The milled wood powder (10 g on a dry basis) was subjected to enzyme treatment
using an industrial cellulase (CMCase) with an activity of about 1,300 units/mL of
carboxymethyl cellulose (CMC). The enzymatic hydrolysis was carried out at 40 oC in a
500-mL conical flask over a period of 48 h at a pH value of 4.5 (using an acetate buffer
solution). After enzymatic hydrolysis, the impure enzymatic hydrolysis lignin was
centrifuged and washed twice with acidic deionized water having a pH value of 2.0 (HCl)
and then freeze-dried for 24 h.
Mild acidolysis
Impure enzymatic hydrolysis lignin (5 g on a dry basis) was suspended in 100 mL
of dioxane/acidified deionized water solution (85:15 v/v, 0.01 mol/L HCl) and was
extracted at 87 oC in a nitrogen gas atmosphere for 2 h. The obtained mixture solution
was filtered, and the lignin solution was collected. The solid residue was sequentially
washed with fresh dioxane/deionized water solution (85:15 v/v) 2 to 3 times. Next, the
entire filtrated solution was neutralized with sodium bicarbonate under magnetic stirring
that lasted 3 h. The neutralized solution was then evaporated until a thick solution had
formed. This thick solution was carefully dropped into a large quantity of acidified
deionized water (pH 2.0, HCl), and the precipitated lignin was separated by
centrifugation, then washed and freeze-dried. Finally, the obtained lignin was washed

PEER-REVIEWED ARTICLE bioresources.com
Li et al. (2013). “Structure and properties of lignin,” BioResources 8(4), 5120-5132. 5122
with HPLC-grade hexane and dried in a vacuum oven at room temperature.
Methods Characterization of EMAL chemical structure
The elements of the EMAL isolated from eucalyptus and Cunninghamia
lanceolata were analyzed using a Vario-EL CUBE elemental analyzer (Germany
ELEMENTAR), and an FT-IR spectra of the EMAL was recorded on a Nexus 670
spectrophotometer (Thermo Nicolet) from 4,000 to 500 cm-1
using a KBr disc containing
1% finely ground samples.
Thermochemical properties of EMAL
A thermogravimetric experiment was performed using a TG209 integrated
Thermal Gravimetric Analyzer from NETZSCH Corporation in Germany with high
purity nitrogen with a flow rate of 25 mL/min as the carrier gas. About 8 to 10 mg of
material was placed in a ceramic crucible and then heated from room temperature to
700 oC at a heating rate of 10
oC/min and 20
oC/min. The obtained thermogravimetric
rate data were automatic saved through the system of the gravimetric analyzer.
The Py-GC/MS systems included a JHP-3 JAI Curie point pyrolyzer (CDS5200,
USA) and a Shimadzu QP2010 Plus gas chromatograph/mass spectrometer (Japan).
About 0.1 mg of each of the EMAL samples was pyrolyzed at 400, 500, and 600 oC for
15 s, and the gas products were then purged by high-purity helium into the gas
chromatograph via a transfer line. The flow rate of the carrier gas was 50 mL/min, and
the split ratio was 30:1. The injection temperature was 280 oC. The pyrolysis products
were separated in a DB-5 (Agilent Technologies, USA) capillary column (15 m × 0.25
mm × 0.25 µm). For lignin pyrolysis, the GC oven was kept at 50 oC for 2 min and then
heated to 250 oC at steps of 10
oC/min. The ion source temperature was 250
oC. The mass
spectrometer was operated in the EI mode using 70 eV of electron energy. The mass
range m/z 45 to 500 was scanned. An identification of the pyrolysis compounds was
attained by comparison of their mass fragment with the PerkinElmer NIST 05 mass
spectral library.
RESULTS AND DISCUSSION Elemental Analysis
The C, H, N, and S contents were determined using the elemental analyzer. The O
content was calculated by subtracting the sum of the C, H, N, and S contents from 100%.
Results for the elemental analysis of the two kinds of EMAL are summarized in Table 1.
The higher heating value (HHV) of the biomass was calculated using the Dulong formula
(Yuan et al. 2009),
HHV (MJ/kg) = 0.3383ZC + 1.422(ZH-ZO/8) (1)
where ZC, ZH, and ZO are the weight percentages of carbon, hydrogen, and oxygen,
respectively. Generally, the HHV was strongly related to the carbon content, such that
greater carbon content led to a greater HHV of the biomass. From Table 1, it can be seen
that the C-EMAL had a larger HHV in comparison to the E-EMAL, a difference that was
attributed to the larger carbon content of the C-EMAL.

PEER-REVIEWED ARTICLE bioresources.com
Li et al. (2013). “Structure and properties of lignin,” BioResources 8(4), 5120-5132. 5123
Table 1. Elemental Analysis of EMAL (%)
Materials Elements HHV (MJ/Kg) C H O N S
E-EMAL 57.88 6.625 34.813 0.14 0.542 22.814
C-EMAL 60.31 6.546 32.238 0.24 0.666 23.981
FT-IR Analysis The FT-IR spectra of the two EMALs are shown in Fig. 1. The IR signal and the
typical absorption with the corresponding functional groups are listed in Table 2. It can
be observed that the FT-IR spectra of E-EMAL and C-EMAL were generally similar,
only with different absorption intensities. The absorption signals of the C-EMAL at 3422,
2928, 1656, and 1263 cm-1
were larger and broader, which suggested that the C-EMAL
contained more conjugated C=O compounds and more guaiacyl units. On the other hand,
the signal of the E-EMAL at 1123 cm-1
was sharper and stronger, meaning that the E-
EMAL contained more syringyl units.
4000 3500 3000 2500 2000 1500 1000 500
Wavenumber cm-1
E-EMAL
C-EMAL
Fig. 1. FT-IR spectra of E-EMAL and C-EMAL
Table 2. Analysis of FT-IR Spectra of EMAL
Wave number(cm-1
) Functional groups Origin
E-EMAL C-EMAL
3429 3422 O-H stretching Phenolics 2920, 2850 2928, 2847 C-H stretching -CH3,-CH2,-CH
1710 1708 C=O stretching Non-conjugated carbonyl 1656 1656 C=O stretching Conjugated carbonyl
1594, 1506, 1421
1596, 1509, 1422 C=C stretching Aromatic ring
1461 1460 C-H bending -CH2 1251 1263 =C-O-R stretching Guaiacyl unit 1123 1128 C-H bending Syringyl unit
1022 1028 C-H bending, C-O bending
Aromatic ring, Methoxyl group
825 848 C-H bending Guaiacyl unit

PEER-REVIEWED ARTICLE bioresources.com
Li et al. (2013). “Structure and properties of lignin,” BioResources 8(4), 5120-5132. 5124
TG Analysis The TG and DTG curves of the E-EMAL and C-EMAL at the heating rates of 10,
and 20 oC/min are shown in Figs. 2, 3, 4, and 5, respectively. These figures showed that
thermal decomposition occurred over a wide temperature range, arising at approximately
150 oC. Then, a major loss of weight followed, accompanied by liquefaction with
charring, which was highly exothermic (Grabowska et al. 2013). However, beyond
500 oC, this was followed by a slow additional mass loss leading up to the final
temperature, at which point the TG curves tended to become flat. It was seen that the char
residue at 700 oC for E-EMAL varied between 25 and 30% at the heating rate of 10, and
20 oC/min respectively, whereas the char residue at 700
oC for C-EMAL rose from 30 to
35% Depending on the heating rates, these thermochemical differences resulted in
different chemical structures of the two EMALs. C-EMAL contained more guaiacyl units,
which contributed to condensation and coupling reaction and then led to the higher char
residue (Wang et al. 2009).
100 200 300 400 500 600 700
0.2
0.3
0.4
0.5
0.6
0.7
0.8
0.9
1.0
Temperature / ℃
We
igh
t / %
-0.005
-0.004
-0.003
-0.002
-0.001
0.000
De
riv
ati
ve
we
igh
t / %
/ ℃
Fig. 2. TG and DTG curves of E-EMAL at 10
oC/min
100 200 300 400 500 600 700
0.2
0.3
0.4
0.5
0.6
0.7
0.8
0.9
1.0
Temperature / ℃
Wei
gh
t /
%
-0.005
-0.004
-0.003
-0.002
-0.001
0.000
Der
ivati
ve
wei
gh
t /
% /℃
Fig. 3. TG and DTG curves of E-EMAL at 20
oC/min
It was also observed that, at a given starting temperature within the same sample,
higher heating rates resulted in a higher temperature for maximum weight loss. This
could have been because the increased heating rate resulted in shortening of the time that
was required to attain the temperature necessary for pyrolysis, thus favoring thermal
degradation while also bringing about larger differences in temperature between the
PEER-REVIEWED ARTICLE bioresources.com
Li et al. (2013). “Structure and properties of lignin,” BioResources 8(4), 5120-5132. 5125
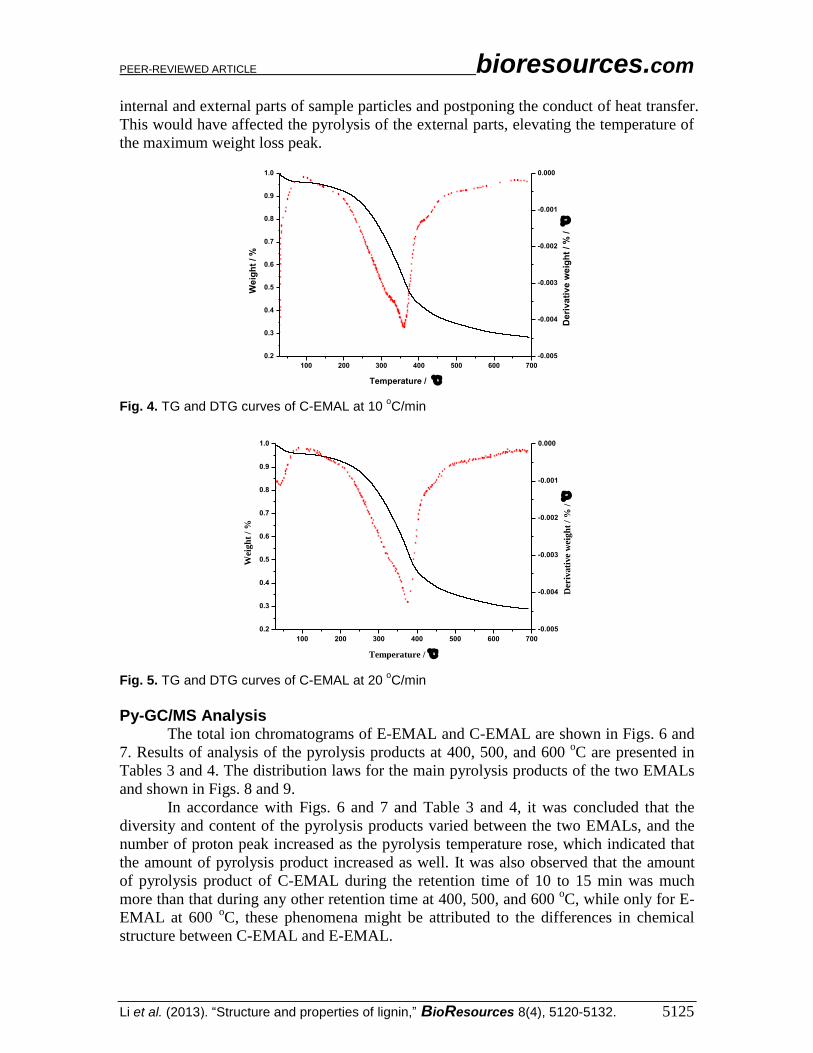
internal and external parts of sample particles and postponing the conduct of heat transfer.
This would have affected the pyrolysis of the external parts, elevating the temperature of
the maximum weight loss peak.
100 200 300 400 500 600 700
0.2
0.3
0.4
0.5
0.6
0.7
0.8
0.9
1.0
Temperature / ℃
We
igh
t / %
-0.005
-0.004
-0.003
-0.002
-0.001
0.000
De
riv
ati
ve
we
igh
t / %
/ ℃
Fig. 4. TG and DTG curves of C-EMAL at 10
oC/min
100 200 300 400 500 600 700
0.2
0.3
0.4
0.5
0.6
0.7
0.8
0.9
1.0
Temperature / ℃
Wei
gh
t /
%
-0.005
-0.004
-0.003
-0.002
-0.001
0.000
Der
ivati
ve
wei
gh
t /
% /
℃
Fig. 5. TG and DTG curves of C-EMAL at 20
oC/min
Py-GC/MS Analysis The total ion chromatograms of E-EMAL and C-EMAL are shown in Figs. 6 and
7. Results of analysis of the pyrolysis products at 400, 500, and 600 oC are presented in
Tables 3 and 4. The distribution laws for the main pyrolysis products of the two EMALs
and shown in Figs. 8 and 9.
In accordance with Figs. 6 and 7 and Table 3 and 4, it was concluded that the
diversity and content of the pyrolysis products varied between the two EMALs, and the
number of proton peak increased as the pyrolysis temperature rose, which indicated that
the amount of pyrolysis product increased as well. It was also observed that the amount
of pyrolysis product of C-EMAL during the retention time of 10 to 15 min was much
more than that during any other retention time at 400, 500, and 600 oC, while only for E-
EMAL at 600 oC, these phenomena might be attributed to the differences in chemical
structure between C-EMAL and E-EMAL.

PEER-REVIEWED ARTICLE bioresources.com
Li et al. (2013). “Structure and properties of lignin,” BioResources 8(4), 5120-5132. 5126
Figures 8 and 9 showed that the pyrolysis organic products of the two EMALs
were mainly composed of carboxylic acids, alcohols, ketones, aldehydes, olefins, alkanes,
esters, ethers, and phenols at 500 and 600 oC. Among these, the largest components of the
pyrolysis products of C-EMAL at the pyrolysis temperatures of 400, 500, and 600 oC
were the phenols, constituting approximately 25.37%, 39.62%, and 30.4%, respectively.
Unlike C-EMAL, the largest components of the pyrolysis products of E-EMAL varied
depending on temperature; the acids accounted for 16.17% at 400 oC; the ethers for about
41.78% at 500 oC, and the phenols for about 27.18% at 600
oC. The advent of phenol and
some other phenols with low molecular weight at 600 oC was attributed to the secondary
pyrolysis (Nakamura et al. 2008).
0 2 4 6 8 10 12 14 16 18 20 22 240.0
2.0x10⁵
4.0x10⁵
6.0x10⁵
8.0x10⁵
1.0x10⁶
1.2x10⁶
1.4x10⁶
1.6x10⁶
Residence time/ min
400 ℃
0 2 4 6 8 10 12 14 16 18 20 22 240.0
2.0x10⁵
4.0x10⁵
6.0x10⁵
8.0x10⁵
1.0x10⁶
1.2x10⁶
1.4x10⁶
1.6x10⁶
1.8x10⁶
2.0x10⁶
500 ℃
600 ℃
0 2 4 6 8 10 12 14 16 18 20 22 240
1x10⁶
2x10⁶
3x10⁶
4x10⁶
5x10⁶
6x10⁶
7x10⁶
Fig. 6. Total ion chromatograms of E-EMAL pyrolysis at 400, 500, and 600
oC
0 2 4 6 8 10 12 14 16 18 20 22 24
0.0
2.0x10⁵
4.0x10⁵
6.0x10⁵
8.0x10⁵
1.0x10⁶
1.2x10⁶
500 ℃
Retention time/ min
400 ℃
0 2 4 6 8 10 12 14 16 18 20 22 240.0
2.0x10⁶
4.0x10⁶
6.0x10⁶
8.0x10⁶
0 2 4 6 8 10 12 14 16 18 20 22 240.0
2.0x10⁶
4.0x10⁶
6.0x10⁶
8.0x10⁶
600 ℃
Fig. 7. Total ion chromatograms of C-EMAL pyrolysis at 400, 500, and 600
oC

PEER-REVIEWED ARTICLE bioresources.com
Li et al. (2013). “Structure and properties of lignin,” BioResources 8(4), 5120-5132. 5127
Tables 3 and 4 showed that the pyrolysis products of phenols of the two EMALs
mainly contained cresyl (H-type), guaiacyl (G-type), and syringyl (S-type) compounds.
Table 3. Analysis of Pyrolysis Products of E-EMAL at 400, 500, and 600 oC
Groups Compound Molecular weight
Area %
400oC 500
oC 600
oC
Alcohols 3-Butyn-1-ol 70 - 1.95 0.38 1-Cyclohexene-1-methanol 112 - 3.74 0.78 2-Methyl-1-pentanol 102 - - 9.43 Ethylene glycol 62 2.20 - - 1,3-Dioxolane-2-methanol 104 - - 2.55 1-nonanol 144 - - 1.70 (4-isopropylphenyl) methanol 150 - 1.18 - Acids D-Alanine 89 - 3.75 - Acetic acid glacial 60 15.94 - 10.45 Pentadecanoic acid 242 - 1.57 - Stearic acid 284 0.23 - - Furans Furfuryl alcohol 98 0.72 0.61 - Tetrahydrofuran 72 - 1.09 - Furfural 96 5.69 3.71 0.64 Ethers 1-Ethoxy-2-methylpropane 102 - - 2.14 2-Ethoxyethanol 90 - - 0.65 2-(Vinyloxy)ethanol 88 - - 0.83 1-Ethoxy-2-methylpropane 102 - - 0.39 2-Ethoxyethyl ether 162 - - 1.08 2-(2-Methoxyethoxy)ethanol 120 - - 0.33 Diethylene glycol 106 - 9.30 - 2(2-Ethoxyethoxy)ethanol 134 5.25 12.80 - 12-Crown-4 176 5.10 19.34 - Di(ethylene glycol) vinyl ether 132 - - 0.96 Octadecyl vinyl ether 296 - 0.34 - Olefins 1-Octene 112 - - 0.65 1-Decene 140 - - 1.17 1-Tridecene 182 - - 1.15 1-Tetradecene 196 - - 3.60 alpha-Cedrene 204 - 0.55 - 1-Pentadecene 210 - - 0.63 1-Nonadecene 267 - 1.13 1.64 Aldehydes Decanal 156 - 0.52 - Pentadecanal 226 0.21 - - 4-Isopropylbenzaldehyde 148 1.93 2.63 - 4-Isopropylbenzaldehyde 148 - 0.45 - Vanillin 152 - 2.87 - 3,5-Dimethoxy-4-hydroxybenzaldehyde 182 - 0.80 - Hexadecanal 240 - 0.62 - Phenols o-Cresol 108 - - 1.24 Guaiacol 124 - - 8.76 2-Methoxy-4-methylphenol 138 4.88 - - 4-Ethyl-2-methoxyphenol 152 1.23 - - 4-Hydroxy-3-methoxystyrene 150 6.36 - - 2,6-Dimethylphenol 122 - - 1.32 2-Methoxy-5-methylphenol 138 - - 6.62 2,3,5-Trimethylphenol 136 - - 0.87 4-Ethyl-2-methoxyphenol 152 - - 0.37 4-Ethyl-2-methoxyphenol 152 - - 2.37

PEER-REVIEWED ARTICLE bioresources.com
Li et al. (2013). “Structure and properties of lignin,” BioResources 8(4), 5120-5132. 5128
2,6-Dimethoxyphenol 154 0.26 - 1.86 2-Methoxy-3-(2-propenyl)phenol 164 1.44 0.42 - 2-Methoxy-5-[(E)-1-propenyl]phenol 164 - - 2.84 2-methoxy-4-propyl-Phenol 166 0.20 - 1.29 (Z)-Isoeugenol 164 - 0.54 - 3-Methoxy-2-naphthol 174 - 1.10 -
2,6-Dimethoxy-4-(2-propenyl)phenol 194 - 0.75 - Alkanes Hexadecane 226 - - 1.20 Pentadecane 212 - - 0.90 Heptadecane 240 - - 0.78 Ketones 5-Hexen-2-one 98 5.68 - - Hydroxyacetone 74 0.66 - - 2-Methyl-4-hydroxyacetophenone 150 - - 2.36 Acetovanillone 166 0.48 2.68 - (4-Hydroxy-3-methoxyphenyl)acetone 180 - 1.88 -
1-(2,4-Dihydroxy-3-methylphenyl)-1-
propanone 180 - 2.02 -
Esters Ethyl pipecolinate 157 0.49 - - Hexadecyl octanoate 368 - 0.35 - Diisobutyl phthalate 278 0.36 0.66 - Dibutyl phthalate 278 0.20 0.35 - 2-ethylhexyl hydrogen phthalate 278 - 7.37 0.79 Others Toluene 92 - - 0.69 CO2 44 30.31 - 18.08 Benzothiazole 135 - 0.36 - L-Nicotine 162 - 3.66 - 3,5-Dimethoxytoluene 152 - - 0.51 Dicyclohexylamine 181 - 0.68 - N,N-Dimethylpropionamide 101 0.17 - - 4-Methylbenzyl chloride 140 0.13 - - 2-Phenylnaphthalene 204 0.33 - - 1-Benzylnaphthalene 218 0.42 - - 1-Benzylnaphthalene 218 0.27 - -
p-Terphenyl 230 0.48 - -
Table 4. Analysis of Pyrolysis Products of C-EMAL at 400, 500, and 600 oC
Groups Compound Molecular
weight
Area %
400oC 500
oC 600
oC
Ketones 2-Butanone 72 - 4.05 - Hydroxyacetone 74 - 0.93 - 4-Hydroxy-3-methylacetophenone 150 - 15.21 3.94 (4-Hydroxy-3-methoxyphenyl)acetone 180 - - 4.02 Acetovanillone 166 - - 6.26 Alcohols Cyclobutanol 72 - - 4.01 Decyl alcohol 158 - 0.28 - 1-Undecanol 172 - 2.79 0.70 1-pentadecanol 228 - - 0.34 Cedrol 222 - - 0.58 3-cyclohexyl-1-propanol 142 0.42 - - Acids Acetic acid glacial 60 6.37 4.68 - Acetoxyacetic acid 118 - 0.46 - Decanoic acid 172 0.58 - - 1-Naphthalenyloxyacetic acid 202 0.67 - - Myristic acid 228 - - 0.12 Pentadecanoic acid 242 - 0.24 0.81 Furans Furfural 96 1.14 0.74 -

PEER-REVIEWED ARTICLE bioresources.com
Li et al. (2013). “Structure and properties of lignin,” BioResources 8(4), 5120-5132. 5129
5-Methyl furfural 110 - 0.27 - 6-methoxy-3-methyl-benzofuran 162 - - 3.77
Phenols Phenol 94 - - 0.55 o-Cresol 108 - - 1.40 Guaiacol 124 10.32 13.14 5.39 2-Methoxy-4-methylphenol 138 5.24 - - 2-methoxy-5-methyl-phenol 138 - 11.05 2.84 4-Ethyl-2-methoxyphenol 152 - 2.50 0.78 2-methoxy-3-(2-propen-1-yl)-phenol 164 - - 2.20 4-Hydroxy-3-methoxystyrene 150 9.81 0.74 - Eugenol 164 - 4.27 - 2-methoxy-4-propyl-Phenol 166 - 4.12 - (Z)-Isoeugenol 164 - 1.92 - (e)-isoeugenol 164 - 1.88 17.24 Olefins 1-Decene 140 - - 0.23
(R)-4-Isopropenyl-1-methyl-1-
cyclohexene 136 - 0.22 -
1-Tridecene 182 - 0.15 0.20 1-Tetradecene 196 - 1.23 1.55 alpha-Cedrene 204 1.14 1.11 - 1,1-Diphenylethylene 180 0.22 - - 4-Phenyl-1-butene 132 1.12 - - 1-Heptadecene 238 - 0.97 - 1-Nonadecene 267 - 0.24 0.31 Ethers triethylene glycol ethyl ether 178 - 0.42 - Di(ethylene glycol) vinyl ether 132 - 0.38 - 3-Methylanisole 122 - - 0.17 2,5-Dimethylphenol methylether 136 - 1.43 0.94 Isohomoveratrol 152 - 0.47 - Methyl isoeugenol 178 - - 0.65 1-Ethoxydodecane 214 - - 0.32 12-Crown-4 176 0.67 - - Octadecyl vinyl ether 297 1.13 - 0.34 Aldehydes 4-Isopropylbenzaldehyde 148 - 0.13 - 4-Hydroxy-2-methoxybenzaldehyde 152 - - 13.88 Pentadecanal 226 0.90 - - Hexadecanal 240 - - 0.64 Alkanes Tetradecane 198 - 0.55 - Pentadecane 212 - 0.59 - Heptadecane 240 - 0.23 - Heneicosane 297 - -- 0.26 Esters Methyl pyruvate 102 - 0.16 - 4-Allyl-2-methoxyphenyl acetate 206 3.00 - - Diisobutyl phthalate 278 0.19 0.42 0.51 Methyl vanillate 182 - - 1.19 Dibutyl phthalate 278 - - 0.29 2-ethylhexyl hydrogen phthalate 278 - 0.42 1.81 Others Toluene 92 - - 0.29 CO2 44 27 12.88 12.02 Dicyclohexylamine 181 - 1.29 - Cyclobutylamine 71 6.75 - - 2-Phenylnaphthalene 204 3.41 - - 1-Benzylnaphthalene 218 2.60 - - 1-Benzylnaphthalene 218 1.67 - -
p-Terphenyl 230 2.64 - -

PEER-REVIEWED ARTICLE bioresources.com
Li et al. (2013). “Structure and properties of lignin,” BioResources 8(4), 5120-5132. 5130
Lignin macromolecules consisted of a large number of β-O-4 and α-O-4 couplings
(Pandey and Kim 2011) which were easy to cleave as the pyrolytic temperature increased,
accompanied with the advent of H-, G-, and S-type phenols; Meanwhile, the cleavages of
β-O-4 and Cα-Cβ at high temperature contributed to the formation of acetic acid, and the
rupture of aromatic rings resulted in straight-chain alkanes.
Alcoh
ols
Acids
Fura
ns
Ether
s
Olefin
s
Aldeh
ydes
Pheno
ls
Alkan
es
Ket
ons
Ester
s0
5
10
15
20
25
30
35
40 400 0C
500 0C
600 0C
Yie
lds
/ %
Fig. 8. The distribution law of the main pyrolysis products of E-EMAL at 400, 500, and 600
oC
Alcoh
ols
Acids
Fura
ns
Ether
s
Olefin
s
Ald
ehyd
es
Pheno
ls
Alkan
es
Ket
ons
Ester
s0
5
10
15
20
25
30
35
40 400 0C
500 0C
600 0C
Yie
lds
/ %
Fig. 9. The distribution law of the main pyrolysis products of C-EMAL at 400, 500, and 600
oC
CONCLUSIONS
1. Enzymatic/mild acidolysis lignin from Cunninghamia lanceolata (C-EMAL) was
found to have a larger higher heating value (HHV) than the corresponding lignin from
eucalyptus (E-EMAL) due to the greater carbon content of the C-EMAL.
2. C-EMAL contained more conjugated C=O compounds and more guaiacyl units,
whereas, given that the signal of E-EMAL at 1123 cm-1
was sharper and stronger, the
E-EMAL included more syringyl units.
PEER-REVIEWED ARTICLE bioresources.com
Li et al. (2013). “Structure and properties of lignin,” BioResources 8(4), 5120-5132. 5131
3. Thermal decomposition occurred over a wide temperature range, beginning at
approximately 150 oC and followed by a slow additional mass loss leading up to the
final temperature. The TG curves tended to become flat beyond 500 oC. It was also
observed that, at a given starting temperature within the same sample, higher heating
rates led to a higher temperature for peak weight loss.
4. The diversity and content of the pyrolysis products varied between the two EMALs
and the pyrolysis organic products of the two EMALs were mainly composed of
carboxylic acids, alcohols, ketones, aldehydes, olefins, alkanes, esters, ethers, and
phenols at 500, and 600 oC. The largest components of the pyrolysis products of the
C-EMAL were the phenols, constituting approximately 25.37% at 400 oC, 39.62% at
500 oC, and 30.4% at 600
oC. These phenols mainly consisted of guaiacol and some
other phenolic derivatives. Unlike those of C-EMAL, the largest components of the
pyrolysis products of E-EMAL varied depending on temperature: acids accounted for
16.17% at 400 oC, ethers for 41.78% at 500
oC, and phenolics for 27.18% at 600
oC.
ACKNOWLEDGEMENTS
This work was supported by the State Natural Sciences Foundation
(NO.31270638) and the National Major Fundamental Research Program of China (973
programs, NO.2013CB228101).
REFERENCES CITED
Chauhan, A., and Kaith, B. (2012). “Novel materials procured from surface modification
of biomass,” Waste and Biomass Valor. 3(2), 141-148.
Demirbas, A. (2002). “Partly chemical analysis of liquid fraction of flash pyrolysis
products from biomass in the presence of sodium carbonate,” Energy Conversion and
Management 43(14), 1801-1809.
Demirbas, A. (2010). “Direct and alkaline glycerol liquefaction of hazelnut shell,”
Energy Sources, Part A 32 (8), 744-751.
Fang, Z., Sato, T., Smith, Jr., R. L., Inomata, H., Arai, K., and Kozinski, J. A. (2008).
“Reaction chemistry and phase behavior of lignin in high-temperature and
supercritical water,” Bioresour. Technol. 99(9), 3424-3430.
Grabowska, B., Szucki, M., Suchy, J. S., and Eichholz, S. (2013). “Thermal degradation
behavior of cellulose-based material for gating systems in iron casting production,”
Polimery 58(1), 39-44.
Lu, Y. J., Jin, H., Guo, L. J., Zhang, X. M., Cao, C. Q., and Guo, X. (2008). “Hydrogen
production by biomass gasification in supercritical water with a fluidized bed
reactor,” Int. J. Hydrogen Energy 33(21), 6066-6075.
Lou, R., Wu, S. B., and Lv, G. J. (2010). “Fast pyrolysis of enzymatic/mild acidolysis
lignin from moso bamboo,” BioResources 5(2), 827-837.
Lv, G. J., and Wu, S. B. (2012). “Analytical pyrolysis studies of corn stalk and its three
main components by TG-M S and Py-GC/MS,” J. Anal. Appl. Pyrolysis 97, 11-18.
McIlveen-Wright, D. R., Pinto, F., Armesto, L., Caballerod, M. A., Aznard, M. P.,
Cabanillasc, A., Huanga, Y., Francob, C., Gulyurtlub, I., and McMullana, J. T. (2006).

PEER-REVIEWED ARTICLE bioresources.com
Li et al. (2013). “Structure and properties of lignin,” BioResources 8(4), 5120-5132. 5132
“A comparison of circulating fluidized bed combustion and gasification power plant
technologies for processing mixtures of coal, biomass and plastic waste,” Fuel
Process. Technol. 87(9), 793-801.
Nakamura, T., Kawamoto, H., and Saka, S. (2008). “Pyrolysis behavior of Japanese cedar
wood lignin studied with various model dimers,” J. Anal. Appl. Pyrolysis 81(2), 173-
182.
Pandey, M. P., and Kim, C. C. (2011). “Lignin depolymerization and conversion: A
review of thermochemical methods,” Chem. Eng. Technol. 34, 29-41.
Pattiya, A. (2011). “Bio-oil production via fast pyrolysis of biomass residues from
cassava plants in a fluidized-bed reactor,” Bioresour. Technol. 102(2), 1959-1967.
Roberts, V., Rendt, S., Lemonidou, A. A., Li, X. B., and Lercher, J. A. (2010). “Influence
of alkali carbonates on benzyl phenyl ether cleavage pathways in superheated water,”
Appl. Catal. B. 95(1-2), 71-77.
Saisu, M., Sato, T., Watanabe, M., Adschiri, T., and Arai, K. (2003). “Conversion of
lignin with supercritical water-phenol mixtures,” Energy Fuels 17(4), 922-928.
Wu, S. B., and Li, M. S. (2006). “Study on chemical structure characteristics of wheat
straw lignin from enzymatic hydrolysis acidolysis,” Chemistry and Industry of Forest
Products 26(1), 105-111.
Wahyudiono, Sasaki, M., and Goto, M. (2009). “Conversion of biomass model compound
under hydrothermal conditions using batch reactor,” Fuel 88, 1656-1664.
Wang, S. R., Wang, K., Liu, Q., Gu, Y. L., Luo, Z. Y., Cen, K. F., and Fransson, T. (2009).
“Comparison of the pyrolysis behavior of lignins from different tree species,”
Biotechnol. Adv.27 (5), 562-567.
Yuan, X. Z., Tong, J. Y., Zeng, G. M., Li, H., and Xie, W. (2009). “Comparative studies
of products obtained at different temperatures during straw liquefaction by hot
compressed water,” Energy Fuels 23, 3262-3267.
Zhang, Z., Chen, B., Chen, A., and Zhao, W. (2012). “Barriers to commercialization
development of crop straw gasification technology in China and promoting policy
design,” Energy Sources Part B 8(3), 279-289.
Article submitted: May 27, 2013; Peer review completed: August 19, 2013; Revised
version received and accepted: August 19, 2013; Published: August 20, 2013.