Embed Size (px)
Citation preview

Peer Comparisons

Table of ContentsPeer Comparisons Introduction 8.1 Total Enrollment, Fall 2006 8.3 Total Enrollment by Level, Fall 2006 8.3 Undergraduate Enrollment, Fall 2006 8.4 by Full-time/Part-time Status 8.4 by Gender 8.5 by Ethnicity 8.5 Graduate Enrollment, Fall 2006 8.6 by Full-time/Part-time Status 8.6 by Gender 8.7 by Ethnicity 8.7 Total Degrees Awarded, Academic Year 2005-06: 8.8 by Level 8.8 by Gender 8.9 by Ethnicity 8.9 Bachelor's Degrees Awarded, Academic Year 2005-06: by Gender 8.10 by Ethnicity 8.10 by Discipline 8.11 Master's Degrees Awarded, Academic Year 2005-06: by Gender 8.12 by Ethnicity 8.12 by Discipline 8.13 Doctoral Degrees Awarded, Academic Year 2005-06: by Gender 8.14 by Ethnicity 8.14 by Discipline 8.15 First-year Retention Rate, Fall 2005 Cohort 8.16 Six-Year Graduation Rate, Fall 2000 Cohort 8.16 Student to Faculty Ratio, Fall 2006 8.17 Percent of Classes with Fewer than 20 Students, Fall 2006 8.17 Percent of Classes with 50 or more Students, Fall 2006 8.17 First-time First-year Enrollment, Fall 2006 8.18 by Gender 8.19 by Ethnicity 8.19 Acceptance Rate, Fall 2006 8.20 First-time First-year Yield, Fall 2006 8.20 SAT 25th-75th Percentile Range, Fall 2006 8.21 Proportion of Incoming First-years in Top 10% of High School Class, Fall 2006 Cohort 8.21 Average Faculty Compensation, Academic Year 2006-07: Professors 8.22 Associate Professors 8.22 Assistant Professors 8.23 Proportion of Instructional Faculty Who are Full-time, Fall 2006 8.23 University Endowment Funds, Fiscal Year 2006 8.24 University Endowment Assets per FTE Student, Fiscal Year 2006 8.24 Expenditures per FTE Student, Fiscal Year 2006 8.25 Tuition & Fees, Academic Year 2007-08 8.26 Tuition & Fees Plus Room & Board, Academic Year 2007-08 8.26 Full-time First-year Enrollment, Fall 2005 Cohort 8.27 Percent of Full-time First-year Students Receiving Financial Aid, Fall 2005 Cohort 8.27 Full-time First-year Students Receiving Federal Grant Aid, Fall 2005 Cohort: Percent Receiving Aid 8.28 Average Amount of Aid Received 8.28 Full-time First-year Students Receiving State/Local Grant Aid, Fall 2005 Cohort: Percent Receiving Aid 8.29 Average Amount of Aid Received 8.29 Full-time First-year Students Receiving Institutional Grant Aid, Fall 2005 Cohort: Percent Receiving Aid 8.30 Average Amount of Aid Received 8.30 Full-time First-year Students Receiving Student Loan Aid, Fall 2005 Cohort: Percent Receiving Aid 8.31 Average Amount of Aid Received 8.31

Peer ComparisonsSource Data:
The data used for the Peer Comparisons section of this book comes from multiple data sources, as listed below:Academe - Bulletin of the American Association of University Professors (Academe)National Center for Education Statistics - Integrated Postsecondary Education Data System (IPEDS)National Association of College and University Business Officers (NACUBO)U.S. News & World Report's "America's Best Colleges 2008" (US News & World Report)
Peer Institution List:
The following list of schools was selected by executive administration for benchmarking purposes:California Institute of Technology (Cal Tech)Cornell University (Cornell)Duke University (Duke)Emory University (Emory)Georgia Institute of Technology (Georgia Tech)Massachusetts Institute of Technology (MIT)Northwestern University (Northwestern)University of Pennsylvania (Penn)Princeton University (Princeton)Rensselaer Polytechnic Institute (RPI)Rice University (Rice)Stanford University (Stanford)Washington University in St. Louis (Washington)
Definitions:
Degree Disciplines: All degree disciplines are categorized according to their Classification of Instructional Programs (CIP) codeArchitecture & Visual & Performing Arts: Includes Architecture and related services; visual and performing artsBusiness Management, Marketing & Related Support Services: Includes business, management, marketing, and related support servicesComputer & Information Sciences: Includes computer and information sciences and support servicesEngineering: Includes engineering; engineering technologies/techniciansHumanities & Social Sciences: Includes area, ethnic, cultural, and gender studies; communication, journalism, and related programs; communications technologies/technicians and support services; foreign languages, literatures, and linguistics; english language and literature/letters; liberal arts and sciences, general studies and humanities; philosophy and religious studies; theology and religious vocations; psychology; social sciences; historyMathematics, Statistics, Biological & Physical Sciences: Includes biological and biomedical sciences; mathematics and statistics; physical sciences
Other Disciplines: Includes agriculture, agriculture operations, and related sciences; natural resources and conservation; personal and culinary services; education; family and consumer sciences/human sciences; legal professions and studies; library science; military technologies; multi/interdisciplinary studies; parks, recreation, leisure, and fitness studies; science technologies/technicians; security and protective services; construction trades; mechanic repair technologies/technicians; precision production; transportation and materials moving; health professions and related clinical sciencesPublic Administration & Social Services: Includes public administration and social services professions
Expenditures: Includes the following institutional expenses: Instruction, research, public service, academic support, student services, and institutional support
Faculty Compensation: Sum of salaries and benefits
Federal Grant Aid: Includes grants that were provided by federal agencies such as the U.S. Department of Education, including Title IV Pell Grants and Supplemental Educational Opportunity Grants (SEOGs). Also includes need-based and merit-based educational assistance funds and training vouchers provided from other federal agencies and/or federally-sponsored educational benefits programs, including the Veteran's Administration, Department of Labor, etc.
Freshmen Retention Rate: The percent of first-time first-year students who return for their sophomore year
Institutional Grant Aid: Includes scholarships and fellowships that were granted and funded by the institution and/or individual departments within the institution (and are limited to students attending the institution). Also includes tuition and fee waivers granted by the institution (for which the institution is not reimbursed from another source). These would include scholarships targeted to certain groups of individuals (from a particular state or studying a certain subject) for which the institution designated the recipient; athletic scholarships; etc.
Runzheimer Indices: Indices to adjust salaries for cost of living; adjusts salaries to a standard U.S. city
8.1

Definitions (cont.):
SAT 25th-75th Percentile Range: The range in which the middle 50% of the first-time freshmen scored on their SATs
Six-Year Graduation Rate: The percent of first-time first-year students who graduate within six years
State/Local Grant Aid: Includes grants that were provided by your state such as Leveraging Educational Assistance Partnerships (LEAP) (formerly SSIGs). Also includes merit scholarships that were provided by your state and tuition and fee waivers for which your institution was reimbursed by a state agency. Local grants would include any local government grants, scholarships or gift-aid that are awarded directly to the student.
Student Loan Aid: Includes all Title IV subsidized and unsubsidized loans made directly to students and for which the student is the designated borrower. (Include Perkins Loans made to students.) Exclude PLUS and other loans made directly to parents and for which the parent is the designated borrower. Also includes all institutionally- and privately-sponsored loans made to students, for which the student is the designated borrower (as long as the funds pass through the financial aid office).
Student to Faculty Ratio: The total full-time equivalent (FTE) enrollment of students divided by the total full-time equivalent (FTE) of instructional faculty
8.2

Total Enrollment1
Carnegie Mellon vs. Peer InstitutionsFall 2006
2,086
9,999
19,639
13,373 12,338
17,936
10,253
18,486
23,743
7,085 6,6805,024
17,747
13,355
0
5,000
10,000
15,000
20,000
25,000
Cal Tec
h
Carneg
ie Mell
on
Cornell
Duke
Emory
Georg
ia Tec
hMIT
Northwes
tern
Penn
Prince
tonRPI
Rice
Stanford
Washington
Source: IPEDS
Total Enrollment by Level1
Carnegie Mellon vs. Peer InstitutionsFall 2006
41% 55
% 69%
47% 54
% 69%
40% 50
%
50% 68
% 78%
60%
36% 55
%
13% 13
%
8% 10% 9%
59% 45
% 26%
40% 33
%
31%
60% 42
%
40% 32
% 22%
40%
58%
35%
6%
5%
0%
20%
40%
60%
80%
100%
Cal Tec
h
Carneg
ie Mell
on
Cornell
Duke
Emory
Georg
ia Tec
hMIT
Northwes
tern
Penn
Prince
tonRPI
Rice
Stanford
Washington
% Undergraduate % First-professional % GraduateSource: IPEDS
Enrollment: 2,086 9,999 19,639 13,373 12,338 17,936 10,253 18,486 23,743 7,085 6,680 5,024 17,747 13,355
1. Enrollment counts do not include students enrolled at our Qatar campus.
8.3

Undergraduate Enrollment1
Carnegie Mellon vs. Peer InstitutionsFall 2006
864
5,548
13,562
6,330 6,646
12,361
4,127
9,179
11,922
4,790 5,192
3,011
6,4227,386
0
2,000
4,000
6,000
8,000
10,000
12,000
14,000
16,000
Cal Tec
h
Carneg
ie Mell
on
Cornell
Duke
Emory
Georg
ia Tec
hMIT
Northwes
tern
Penn
Prince
tonRPI
Rice
Stanford
Washington
Source: IPEDS
Undergraduate Enrollment by Full-time/Part-time Status1
Carnegie Mellon vs. Peer InstitutionsFall 2006
100%
97%
100%
99%
98%
93% 99%
89%
85% 10
0%
99%
99%
100%
85%
7%
11%
15%
15%3% 1% 2% 1% 1%1%
0%
20%
40%
60%
80%
100%
Cal Tec
h
Carneg
ie Mell
on
Cornell
Duke
Emory
Georg
ia Tec
hMIT
Northwes
tern
Penn
Prince
tonRPI
Rice
Stanford
Washington
% Full-time % Part-timeSource: IPEDS
864 5,548 13,562 6,330 6,646 12,361 4,127 9,179 11,922 4,790 5,192 3,011 6,422 7,386Enrollment:
1. Enrollment counts do not include students enrolled at our Qatar campus.
8.4

Undergraduate Enrollment by Ethnicity1
Carnegie Mellon vs. Peer InstitutionsFall 2006
11%
11% 17
%
13%
12% 19
%
12%
13% 17%
10% 19
% 24%
12%8%
12%
8%
8%
10% 9%
86% 77
%
81%
78%
81%
84% 73
%
83% 77%
74%
87% 77
% 70%
83%
6%
5%
6% 4% 5% 3%
5%
6%
5%
0%
20%
40%
60%
80%
100%
Cal Tec
h
Carneg
ie Mell
on
Cornell
Duke
Emory
Georg
ia Tec
hMIT
Northwes
tern
Penn
Prince
tonRPI
Rice
Stanford
Washington
% Under-represented Minority % Non-resident Alien % OtherSource: IPEDS
Enrollment: 864 5,548 13,562 6,330 6,646 12,361 4,127 9,179 11,922 4,790 5,192 3,011 6,422 7,386
Undergraduate Enrollment by Gender1
Carnegie Mellon vs. Peer InstitutionsFall 2006
71%
62%
51%
51%
42%
71%
56%
47%
48% 54%
75%
51%
52%
48%
29%
38%
49%
49%
58%
29%
44%
53%
52% 46%
25%
49%
48%
52%
0%
20%
40%
60%
80%
100%
Cal Tec
h
Carneg
ie Mell
on
Cornell
Duke
Emory
Georg
ia Tec
hMIT
Northwes
tern
Penn
Prince
tonRPI
Rice
Stanford
Washington
% Men % WomenSource: IPEDS
Enrollment: 864 5,548 13,562 6,330 6,646 12,361 4,127 9,179 11,922 4,790 5,192 3,011 6,422 7,386
1. Enrollment counts do not include students enrolled at our Qatar campus.
8.5

Graduate EnrollmentCarnegie Mellon vs. Peer Institutions
Fall 2006
1,222
4,4515,181 5,350
4,080
5,5756,126
7,824
9,453
2,2951,488
2,013
10,285
4,715
0
2,000
4,000
6,000
8,000
10,000
12,000
Cal Tec
h
Carneg
ie Mell
on
Cornell
Duke
Emory
Georg
ia Tec
hMIT
Northwes
tern
Penn
Prince
tonRPI
Rice
Stanford
Washington
Source: IPEDS
Graduate Enrollment by Full-time/Part-time StatusCarnegie Mellon vs. Peer Institutions
Fall 2006
100%
74%
100%
94%
82%
82% 97
%
73%
74%
100%
76% 96
%
66% 72%
26% 18
%
18%
27%
26%
24%
34% 28
%
6% 4%3%
0%
20%
40%
60%
80%
100%
Cal Tec
h
Carneg
ie Mell
on
Cornell
Duke
Emory
Georg
ia Tec
hMIT
Northwes
tern
Penn
Prince
tonRPI
Rice
Stanford
Washington
% Full-time % Part-timeSource: IPEDS
Enrollment: 1,222 4,451 5,181 5,350 4,080 5,575 6,126 7,824 9,453 2,295 1,488 2,013 10,285 4,715
8.6
Graduate Enrollment by GenderCarnegie Mellon vs. Peer Institutions
Fall 200670
%
70%
62%
52%
39%
74%
70%
56%
49% 60
% 69%
64%
64%
51%
30%
30%
38%
48%
61%
26%
30%
44%
51% 40
% 31%
36%
36%
49%
0%
20%
40%
60%
80%
100%
Cal Tec
h
Carneg
ie Mell
on
Cornell
Duke
Emory
Georg
ia Tec
hMIT
Northwes
tern
Penn
Prince
tonRPI
Rice
Stanford
Washington
% Men % WomenSource: IPEDS
Enrollment: 1,222 4,451 5,181 5,350 4,080 5,575 6,126 7,824 9,453 2,295 1,488 2,013 10,285 4,715
Graduate Enrollment by EthnicityCarnegie Mellon vs. Peer Institutions
Fall 2006
8% 14%
7% 8% 7% 10%
7%
36%
42%
41%
25% 18% 42
%
36%
23% 27
% 39%
41%
34%
35%
22%
58%
54%
53%
67%
67% 50
%
59%
71% 66% 56
%
52%
57%
59%
71%
6%6% 5% 6% 6%4%6%0%
20%
40%
60%
80%
100%
Cal Tec
h
Carneg
ie Mell
on
Cornell
Duke
Emory
Georg
ia Tec
hMIT
Northwes
tern
Penn
Prince
tonRPI
Rice
Stanford
Washington
% Under-represented Minority % Non-resident Alien % OtherSource: IPEDS
Enrollment: 1,222 4,451 5,181 5,350 4,080 5,575 6,126 7,824 9,453 2,295 1,488 2,013 10,285 4,715
8.7

Total Degrees Awarded by LevelCarnegie Mellon vs. Peer Institutions
Academic Year 2005-06
45%
40% 60
%
43%
43% 60
%
35%
38%
42% 63
%
64%
56%
36% 46
%
22% 52
% 27%
37%
29%
31%
46% 47%
40% 21
% 28%
34%
44% 35
%
33%
8%
8%
19%
16% 9%
14%
8%
13%
22% 10
%
7%8%
10%
6%
8%
10%
10%
6%7%5%
0%
20%
40%
60%
80%
100%
Cal Tec
h
Carneg
ie Mell
on
Cornell
Duke
Emory
Georg
ia Tec
hMIT
Northwes
tern
Penn
Prince
tonRice RPI
Stanford
Washington
%Bachelor %Masters %Doctoral %Other
544 3,182 5,872 3,449 3,473 4,157 3,198 5,550 6,773 1,786 1,631 1,444 4,822 3,602Degrees:
Source: IPEDS
Total Degrees AwardedCarnegie Mellon vs. Peer Institutions
Academic Year 2005-06
544
3,182
5,872
3,449 3,4734,157
3,198
5,550
6,773
1,786 1,631 1,444
4,822
3,602
01,0002,0003,0004,0005,0006,0007,0008,000
Cal Tec
h
Carneg
ie Mell
on
Cornell
Duke
Emory
Georg
ia Tec
hMIT
Northwes
tern
Penn
Prince
tonRice RPI
Stanford
Washington
Source: IPEDS
8.8

Total Degrees Awarded by GenderCarnegie Mellon vs. Peer Institutions
Academic Year 2005-0672
%
66%
54%
55%
42%
73%
67%
54%
51% 56% 74
%
59%
59%
52%
28%
34%
46%
45%
58%
27%
33%
46%
49% 44% 26
%
41%
41%
48%
0%
20%
40%
60%
80%
100%
Cal Tec
h
Carneg
ie Mell
on
Cornell
Duke
Emory
Georg
ia Tec
hMIT
Northwes
tern
Penn
Prince
tonRice RPI
Stanford
Washington
%Men %WomenSource: IPEDS
544 3,182 5,872 3,449 3,473 4,157 3,198 5,550 6,773 1,786 1,631 1,444 4,822 3,602Degrees:
Total Degrees Awarded by EthnicityCarnegie Mellon vs. Peer Institutions
Academic Year 2005-06
9% 13%
15%
10%
9% 8% 9% 12%
15%
15%
9%
26% 29%
18% 21
% 27%
18% 19% 20
%
17% 15
% 21%
13%
68%
64%
74%
84% 78% 69
% 64%
75%
72%
69%
77% 71% 64
%
78%
6%6% 7%
7%
3%
0%
20%
40%
60%
80%
100%
Cal Tec
h
Carneg
ie Mell
on
Cornell
Duke
Emory
Georg
ia Tec
hMIT
Northwes
tern
Penn
Prince
tonRice RPI
Stanford
Washington
%Under-represented Minority %Non-resident Alien %OtherSource: IPEDS
544 3,182 5,872 3,449 3,473 4,157 3,198 5,550 6,773 1,786 1,631 1,444 4,822 3,602Degrees:
8.9

Bachelors Degrees Awarded by GenderCarnegie Mellon vs. Peer Institutions
Academic Year 2005-0667
%
60%
49%
50%
40%
71%
59%
46%
51%
54%
75%
54%
51%
48%
33%
40%
51%
50%
60%
29%
41%
54%
49%
46%
25%
46%
49%
52%
0%
20%
40%
60%
80%
100%
Cal Tec
h
Carneg
ie Mell
on
Cornell
Duke
Emory
Georg
ia Tec
hMIT
Northwes
tern
Penn
Prince
tonRice RPI
Stanford
Washington
%Men %Women
247 1,287 3,534 1,469 1,496 2,477 1,129 2,097 2,867 1,125 1,036 811 1,756 1,648Degrees:
Source: IPEDS
Bachelors Degrees Awarded by EthnicityCarnegie Mellon vs. Peer Institutions
Academic Year 2005-06
9% 10%
10% 17
%
11%
11% 16%
11%
11% 15%
18% 25
%
12%
9%
9%
9%
83%
79%
83%
81%
85%
83% 75
%
84%
79%
76%
88% 76
% 69%
84%
6%
11%
4%
6%
6%
6%
8%
6%6%3%
2%
7%
0%
20%
40%
60%
80%
100%
Cal Tec
h
Carneg
ie Mell
on
Cornell
Duke
Emory
Georg
ia Tec
hMIT
Northwes
tern
Penn
Prince
tonRice RPI
Stanford
Washington
%Under-represented Minority %Non-resident Alien %OtherSource: IPEDS
247 1,287 3,534 1,469 1,496 2,477 1,129 2,097 2,867 1,125 1,036 811 1,756 1,648Degrees:
8.10

Bachelors Degrees Awarded by DisciplineCarnegie Mellon vs. Peer Institutions
Academic Year 2005-06
8%
36%
25%
33%
14%17
%18%
53%
16%
14%
56%
16%
18%
21%
12%
15%
1%
13%
12%
7%
1%
14%
7%
51%
45%
45%
42%
5%
57%
25%
21%
3%
4%
54%
8%
61%
47%
4%
5%
3%
18%
2%
11%
7%
1%
1%
1%
10%
15%
10%
10%
4%
4%
7%
14%
2%4%
2%
2%
6%
10%
4%
12%
16%
18%
10%
13%
15%
10%
57%
6%
11%
27%
8%
7%
15%
9%
1%
2%
2%
1% 2%
7%
13%
19%
6% 3%
7%3%5%3%5% 3%
18% 12
%
0%
20%
40%
60%
80%
100%
Cal Tec
h
Carneg
ie Mell
on
Cornell
Duke
Emory
Georg
ia Tec
hMIT
Northwes
tern
Penn
Prince
tonRice RPI
Stanford
Washington
Source: IPEDS
247 1,287 3,534 1,469 1,496 2,477 1,129 2,097 2,867 1,125 1,036 811 1,756 1,648Degrees:
%Other Disciplines%Public Admin. & Social Services%Mathematics, Statistics, Biological & Physical Sciences%Architecture & Visual & Performing Arts%Computer & Information Sciences%Humanities & Social Sciences%Business Management, Marketing & Related Support Services%Engineering
8.11

Masters Degrees Awarded by GenderCarnegie Mellon vs. Peer Institutions
Academic Year 2005-0679
%
71%
64%
60%
42%
75%
72%
62%
52% 58% 71
%
68%
64%
55%
21%
29%
36%
40%
58%
25%
28%
38%
48% 42% 29
%
32%
36%
45%
0%
20%
40%
60%
80%
100%
Cal Tec
h
Carneg
ie Mell
on
Cornell
Duke
Emory
Georg
ia Tec
hMIT
Northwes
tern
Penn
Prince
tonRice RPI
Stanford
Washington
%Men %Women
120 1,650 1,584 1,275 996 1,280 1,467 2,616 2,741 373 449 486 2,112 1,274Degrees:
Source: IPEDS
Masters Degrees Awarded by EthnicityCarnegie Mellon vs. Peer Institutions
Academic Year 2005-06
9% 8% 8% 13%
9%
38%
38%
35% 15%
40%
34%
27% 29
% 35%
26%
21%
31%
22%
57%
56%
59%
86% 67
% 52%
59%
68%
63% 57%
66%
66% 61%
70%
18%
5% 6% 7% 5% 8% 8% 7%6%
5%
0%
20%
40%
60%
80%
100%
Cal Tec
h
Carneg
ie Mell
on
Cornell
Duke
Emory
Georg
ia Tec
hMIT
Northwes
tern
Penn
Prince
tonRice RPI
Stanford
Washington
%Under-represented Minority %Non-resident Alien %Other
120 1,650 1,584 1,275 996 1,280 1,467 2,616 2,741 373 449 486 2,112 1,274Degrees:
Source: IPEDS
8.12

Masters Degrees Awarded by DisciplineCarnegie Mellon vs. Peer Institutions
Academic Year 2005-06
11%
55%
8%
60%
17% 23
%
44%
8% 6%
25%
35%
6%
40%
33%
20%
50%
30%
4%
35%
52%
33%12
%
37%
53%32
%
30%
10%
12%
9%
4%
23%
10%
17%
3%
4%
10%
17%
8%
7%
8%
7%
7%
2%
12%
4%
2%
8%
9%1%
8%
22%
8%
5%
1%
15%
5%
9%
7%
3%
10%
8%
1%
5%
7%
7%
9%
9%
15%11
%
14%
5%
2%
2%
8%
2%8%
3%
24%
13%
25%
7%
1%
1%
5%
3%
12% 11
%
10%
2%2%
26%
15%
1%2%
45%
15%12
%
1%
0%
20%
40%
60%
80%
100%
Cal Tec
h
Carneg
ie Mell
on
Cornell
Duke
Emory
Georg
ia Tec
hMIT
Northwes
tern
Penn
Prince
tonRice RPI
Stanford
Washington
Degrees:
Source: IPEDS
120 1,650 1,584 1,275 996 1,280 1,467 2,616 2,741 373 449 486 2,112 1,274
%Other Disciplines%Public Admin. & Social Services%Mathematics, Statistics, Biological & Physical Sciences%Architecture & Visual & Performing Arts%Computer & Information Sciences%Humanities & Social Sciences%Business Management, Marketing & Related Support Services%Engineering
8.13

Doctoral Degrees Awarded by GenderCarnegie Mellon vs. Peer Institutions
Academic Year 2005-0676
%
70%
61%
57%
35%
78%
73%
50%
50% 65
% 75%
56% 66
%
49%
24%
30%
39%
43%
65%
22%
27%
50%
50% 35
% 25%
44% 34
%
51%
0%
20%
40%
60%
80%
100%
Cal Tec
h
Carneg
ie Mell
on
Cornell
Duke
Emory
Georg
ia Tec
hMIT
Northwes
tern
Penn
Prince
tonRice RPI
Stanford
Washington
%Men %Women
177 245 476 271 204 400 602 423 496 288 146 147 677 303Degrees:
Source: IPEDS
Doctoral Degrees Awarded by EthnicityCarnegie Mellon vs. Peer Institutions
Academic Year 2005-06
7%
44% 60
%
47%
13%
55%
42%
33%
31% 45
%
64%
41%
40%
26%
54% 38
%
48%
93% 76
%
40%
55%
62%
64% 52
% 32%
54%
55%
68%
2% 2% 5% 11%
6% 2% 5% 5% 2% 5% 4% 6%3%
1%
0%10%20%30%40%50%60%70%80%90%
100%
Cal Tec
h
Carneg
ie Mell
on
Cornell
Duke
Emory
Georg
ia Tec
hMIT
Northwes
tern
Penn
Prince
tonRice RPI
Stanford
Washington
%Under-represented Minority %Non-resident Alien %Other
177 245 476 271 204 400 602 423 496 288 146 147 677 303Degrees:
Source: IPEDS
8.14

Doctoral Degrees Awarded by DisciplineCarnegie Mellon vs. Peer Institutions
Academic Year 2004-
2% 4%
10%
5% 7%
0%
30%
36%
21%
17%
69%
42%
26%
7%
28%
59%
32%
32%
12%
4%
20%
30%
37%
10%
17%
28%
34%
3%
20%
17%
16%
63%
20%
31%
31%
43%
17%
28%
21%
28%
29%
18%
41%
30%
31%
22%
3%
3%
9%
7%
3%
4%
5%
3%
0%
21% 15
%
18%
21%
23%
0%
13%
32%
2% 1% 1% 2% 1%
1%
2%
1%
2%
2%
1%
12%
2%
2%
10%
2%
1%
2%
4%
3%
1%
3%
2%
0%
2%
4%
6%
0%
20%
40%
60%
80%
100%
Cal Tec
h
Carneg
ie Mell
on
Cornell
Duke
Emory
Georg
ia Tec
hMIT
Northwes
tern
Penn
Prince
tonRice RPI
Stanford
Washington
%Other Disciplines%Business Mgmt., Marketing & Related Support Services%Computer & Information Sciences%Mathematics, Statistics, Biological & Physical Sciences%Humanities & Social Sciences%Public Administration & Social Services%Engineering%Architecture & Visual & Performing ArtsSource: IPEDS
187 207 452 277 162 355 581 366 463 273 137 134 671 275Degrees:
Doctoral Degrees Awarded by DisciplineCarnegie Mellon vs. Peer Institutions
Academic Year 2005-06
12%
32%
32%
59%
28%
7%
26%
42%
69%
1%
17%21
%
36%
30%
1%
3%
4%
4%
3%
2%
2%
3%
5%
37%
16%
17%
20%
3%
34%
28%
17%
10%
2%
30%
20%
12%
1%
2%
4%3%
10%
2%
1%
7%
9%
3%
3%
22%
2%
1%3%
7%
5%
10%
4%
2%
1%
1%
2%
2%
31%
30%
41%
18%
29%
28%
21%
28%
17%
43%
31%
31%
20%
63% 4%
2%
2%
1%
1%
2%
32%
13%
5%
23%
21%
6%
18%15
%
21%
4%
0%
20%
40%
60%
80%
100%
Cal Tec
h
Carneg
ie Mell
on
Cornell
Duke
Emory
Georg
ia Tec
hMIT
Northwes
tern
Penn
Prince
tonRice RPI
Stanford
Washington
Degrees:
Source: IPEDS
177 245 476 271 204 400 602 423 496 288 146 147 677 303
%Other Disciplines%Public Admin. & Social Services%Mathematics, Statistics, Biological & Physical Sciences%Architecture & Visual & Performing Arts%Computer & Information Sciences%Humanities & Social Sciences%Business Management, Marketing & Related Support Services%Engineering
8.15

Full-time First-year Retention RateCarnegie Mellon vs. Peer Institutions
Fall 2005 Cohort98% 94% 96% 96% 94% 91%
98% 97% 98% 98%92% 96% 98% 96%
0%
20%
40%
60%
80%
100%
Cal Tec
h
Carneg
ie Mell
on
Cornell
Duke
Emory
Georg
ia Tec
hMIT
Northwes
tern
Penn
Prince
tonRPI
Rice
Stanford
Washington
Source: IPEDS
Six-year Graduation RateCarnegie Mellon vs. Peer Institutions
Fall 2000 Cohort
89% 86%92% 94%
87%77%
93% 93% 94% 96%
82%
93% 95% 91%
0%
20%
40%
60%
80%
100%
Cal Tec
h
Carneg
ie Mell
on
Cornell
Duke
Emory
Georg
ia Tec
hMIT
Northwes
tern
Penn
Prince
tonRPI
Rice
Stanford
Washington
Source: US News & World Report
8.16

Student to Faculty RatioCarnegie Mellon vs. Peer Institutions
Fall 2006
3
10 108 7
14
7 7 6 5
15
5 6 7
02468
10121416
Cal Tec
h
Carneg
ie Mell
on
Cornell
Duke
Emory
Georg
ia Tec
hMIT
Northwes
tern
Penn
Prince
tonRPI
Rice
Stanford
Washington
Source: US News & World Report
Percent of Classes with Fewer than 20 StudentsCarnegie Mellon vs. Peer Institutions
Fall 2006
75%66% 60%
73%66%
42%
61%74% 74% 72%
42%
62%73% 73%
0%
20%
40%
60%
80%
100%
Cal Tec
h
Carneg
ie Mell
on
Cornell
Duke
Emory
Georg
ia Tec
hMIT
Northwes
tern
Penn
Prince
tonRPI
Rice
Stanford
Washington
Source: US News & World Report
Percent of Classes with 50 or More StudentsCarnegie Mellon vs. Peer Institutions
Fall 2006
8% 9%16%
6% 6%20% 14% 8% 8% 10% 10% 9% 10% 9%
0%
20%
40%
60%
80%
100%
Cal Tec
h
Carneg
ie Mell
on
Cornell
Duke
Emory
Georg
ia Tec
hMIT
Northwes
tern
Penn
Prince
tonRPI
Rice
Stanford
Washington
Source: US News & World Report
8.17

First-time First-year Enrollment1
Carnegie Mellon vs. Peer InstitutionsFall 2006
214
1,428
3,188
1,683 1,665
2,837
1,002
2,0622,371
1,228 1,270
713
1,6461,470
0
500
1,000
1,500
2,000
2,500
3,000
3,500
Cal Tec
h
Carneg
ie Mell
on
Cornell
Duke
Emory
Georg
ia Tec
hMIT
Northwes
tern
Penn
Prince
tonRPI
Rice
Stanford
Washington
Source: IPEDS
1. Enrollment counts do not include students enrolled at our Qatar campus.
8.18

First-time First-year Enrollment by Gender1
Carnegie Mellon vs. Peer InstitutionsFall 2006
72%
61%
52%
51%
44%
69%
55%
47%
49%
53% 71
%
50%
49%
51%
28%
39%
48%
49%
56%
31%
45%
53%
51%
47% 29
%
50%
51%
49%
0%
20%
40%
60%
80%
100%
Cal Tec
h
Carneg
ie Mell
on
Cornell
Duke
Emory
Georg
ia Tec
hMIT
Northwes
tern
Penn
Prince
tonRPI
Rice
Stanford
Washington
% Men % WomenSource: IPEDS
Enrollment: 214 1,428 3,188 1,683 1,665 2,837 1,002 2,062 2,371 1,228 1,270 713 1,646 1,470
First-time First-year Enrollment by Ethnicity1
Carnegie Mellon vs. Peer InstitutionsFall 2006
10%
12%
16%
13%
10% 21
%
13%
15%
17%
9%
20%
24%
12%
13%
8%
9% 10%
83% 77%
79%
77%
80%
86% 70
%
82% 75
%
73%
90% 74
%
70%
84%
6%
5%
1%
7%
6%
4%4%7%
6%
8%
12%
0%
20%
40%
60%
80%
100%
Cal Tec
h
Carneg
ie Mell
on
Cornell
Duke
Emory
Georg
ia Tec
hMIT
Northwes
tern
Penn
Prince
tonRPI
Rice
Stanford
Washington
% Under-represented Minority % Non-resident Alien % OtherSource: IPEDS
Enrollment: 214 1,428 3,188 1,683 1,665 2,837 1,002 2,062 2,371 1,228 1,270 713 1,646 1,470
1. Enrollment counts do not include students enrolled at our Qatar campus.
8.19

Acceptance RateCarnegie Mellon vs. Peer Institutions
Fall 2006
17%
34%25% 24%
37%
67%
13%
30%
18%10%
67%
24%
11%21%
0%
20%
40%
60%
80%
100%
Cal Tec
h
Carneg
ie Mell
on
Cornell
Duke
Emory
Georg
ia Tec
hMIT
Northwes
tern
Penn
Prince
tonRPI
Rice
Stanford
Washington
Source: IPEDS
First-time First-year YieldCarnegie Mellon vs. Peer Institutions
Fall 2006
37%
22%
46% 43%
29%
46%
66%
41%
66% 69%
28%34%
67%
32%
0%
20%
40%
60%
80%
100%
Cal Tec
h
Carneg
ie Mell
on
Cornell
Duke
Emory
Georg
ia Tec
hMIT
Northwes
tern
Penn
Prince
tonRPI
Rice
Stanford
Washington
Source: IPEDS
8.20

SAT 25th-75th Percentile RangeCarnegie Mellon vs. Peer Institutions
Fall 2006
1000
1100
1200
1300
1400
1500
1600
0 1 2 3 4 5 6 7 8 9 10 11 12 13 14 15
Ric
e
Cal
Tec
h
Car
negi
e M
ello
n
Cor
nell
Duk
e
Emor
y
Geo
rgia
Tec
h
MIT
Nor
thw
este
rn
Penn
Prin
ceto
n
RPI
Stan
ford
Was
hing
ton
Source: US News & World Report
Proportion of Incoming First-years in Top 10% of High School ClassCarnegie Mellon vs. Peer Institutions
Fall 2006 Cohort
88%
75%84%
89% 88%
66%
97%
83%
94% 94%
62%
87% 89%95%
0%
20%
40%
60%
80%
100%
Cal Tec
h
Carneg
ie Mell
on*
Cornell
Duke
Emory*
Georg
ia Tec
hMIT
Northwes
tern
Penn
Prince
ton*RPI
Rice
Stanford
Washington
Source: US News & World Report (*Under 51% of entering first-year students reporting)
8.21

Average Faculty Compensation - Professors(Compensation Adjusted Using Runzheimer Indices)
Carnegie Mellon vs. Peer InstitutionsAcademic Year 2006-07
$140
,626
$134
,064
$171
,042
$185
,758
$179
,651
$154
,950
$125
,103
$144
,583
$176
,391
$156
,932
$152
,312
$125
,541
$163
,385
$0$20,000$40,000$60,000$80,000
$100,000$120,000$140,000$160,000$180,000$200,000
Cal Tec
h
Carneg
ie Mell
on
Cornell
Duke
Emory
Georg
ia Tec
hMIT
Northwes
tern
Penn
Prince
tonRice
Stanford
Washington
Source: Academe
Average Peer Professor Compensation = $156,356
Average Faculty Compensation - Associate Professors(Compensation Adjusted Using Runzheimer Indices)
Carnegie Mellon vs. Peer InstitutionsAcademic Year 2006-07
$101
,567
$99,
009
$123
,268
$128
,706
$117
,056
$109
,616
$88,
417
$99,
304
$125
,208
$102
,018
$105
,296
$90,
860
$104
,441
$0
$20,000
$40,000
$60,000
$80,000
$100,000
$120,000
$140,000
Cal Tec
h
Carneg
ie Mell
on
Cornell
Duke
Emory
Georg
ia Tec
hMIT
Northwes
tern
Penn
Prince
tonRice
Stanford
Washington
Source: Academe
Average Peer Associate Professor Compensation = $107,980
8.22

Average Faculty Compensation - Assistant Professors(Compensation Adjusted Using Runzheimer Indices)
Carnegie Mellon vs. Peer InstitutionsAcademic Year 2006-07
$94,
525
$87,
039
$107
,933
$105
,239
$102
,672
$94,
637
$79,
074
$85,
991
$102
,535
$77,
638
$89,
376
$71,
579
$84,
824
$0
$20,000
$40,000
$60,000
$80,000
$100,000
$120,000
Cal Tec
h
Carneg
ie Mell
on
Cornell
Duke
Emory
Georg
ia Tec
hMIT
Northwes
tern
Penn
Prince
tonRice
Stanford
Washington
Source: Academe
Average Peer Assistant Professor Compensation = $91,335
Proportion of Instructional Faculty who are Full-timeCarnegie Mellon vs. Peer Institutions
Fall 2006
98%93%
98% 97% 95%100%
89%94%
86%93% 94% 93%
100%92%
0%
20%
40%
60%
80%
100%
Cal Tec
h
Carneg
ie Mell
on
Cornell
Duke
Emory
Georg
ia Tec
hMIT
Northwes
tern
Penn
Prince
tonRPI
Rice
Stanford
Washington
Source: US News & World Report
8.23

University Endowment Funds ($000)Carnegie Mellon vs. Peer Institutions
Fiscal Year 2006
$1,5
80,9
22
$939
,581 $4
,321
,199
$4,4
97,7
18
$4,8
70,0
19
$1,0
47,7
24
$8,3
68,0
66
$5,1
40,6
68
$5,3
13,2
68
$13,
044,
900
$682
,894 $3
,986
,664
$14,
084,
676
$4,6
84,7
37
$0$2,000,000$4,000,000
$6,000,000$8,000,000
$10,000,000$12,000,000
$14,000,000$16,000,000
Cal Tec
h
Carneg
ie Mell
on
Cornell
Duke
Emory
Georg
ia Tec
hMIT
Northwes
tern
Penn
Prince
tonRPI
Rice
Stanford
Washington
Endo
wm
ent F
unds
($00
0)
Source: NACUBO
Average Peer Institution Endowment Funds ($000) = $5,509,497
University Endowment Assets per FTE Student ($000)Carnegie Mellon vs. Peer Institutions
Fiscal Year 2006
$729
$103 $2
22 $338 $410
$64
$820
$321
$252
$1,9
11
$113
$795
$1,0
71
$407
$0
$500
$1,000
$1,500
$2,000
$2,500
Cal Tec
h
Carneg
ie Mell
on
Cornell
Duke
Emory
Georg
ia Tec
hMIT
Northwes
tern
Penn
Prince
tonRPI
Rice
Stanford
WashingtonEn
dow
men
t Ass
ets
per F
TE S
tude
nt ($
000)
Source: NACUBO
Average Peer Institution Endowment Assets per FTE Student ($000) = $573
8.24

Expenditures per FTE Student ($000)Carnegie Mellon vs. Peer Institutions
Fiscal Year 2006
$221
$78 $70
$110$92
$41
$214
$71
$104 $107
$48$65
$145$133
$0
$50
$100
$150
$200
$250
Cal Tec
h
Carneg
ie Mell
on
Cornell
Duke
Emory
Georg
ia Tec
hMIT
Northwes
tern
Penn
Prince
tonRPI
Rice
Stanford
WashingtonEx
pend
iture
s pe
r FTE
Stu
dent
($00
0)
Source: IPEDS
Average Peer Institution Expenditures per FTE Student ($000) = $109.4
8.25

Tuition & FeesCarnegie Mellon vs. Peer Institutions
Academic Year 2007-08$3
2,83
5
$37,
354
$34,
781
$35,
856
$34,
336
$24,
343
$34,
986
$35,
429
$35,
916
$33,
705
$35,
878
$28,
900
$37,
726
$35,
524
$0$5,000
$10,000$15,000$20,000$25,000$30,000$35,000$40,000$45,000
Cal Tec
h
Carneg
ie Mell
on
Cornell
Duke
Emory
Georg
ia Tec
hMIT
Northwes
tern
Penn
Prince
tonRPI
Rice
Stanford
Washington
Average Peer Institution Tuition & Fees = $33,863
Tuition & Fees Plus Room & BoardCarnegie Mellon vs. Peer Institutions
Academic Year 2007-08
$42,
375
$47,
014
$45,
971
$45,
636
$44,
556
$31,
701
$45,
386
$46,
205
$46,
124
$44,
685
$46,
298
$39,
150
$48,
534
$46,
776
$0
$10,000
$20,000
$30,000
$40,000
$50,000
$60,000
Cal Tec
h
Carneg
ie Mell
on
Cornell
Duke
Emory
Georg
ia Tec
hMIT
Northwes
tern
Penn
Prince
tonRPI
Rice
Stanford
Washington
Average Peer Institution Tuition, Fees, Room & Board = $44,107
8.26

Full-time First-year Enrollment1
Carnegie Mellon vs. Peer InstitutionsFall 2005 Cohort
234
1,407
3,076
1,724 1,637
2,453
1,001
1,952
2,484
1,221 1,240
721
1,6331,461
0
500
1,000
1,500
2,000
2,500
3,000
3,500
Cal Tec
h
Carneg
ie Mell
on
Cornell
Duke
Emory
Georg
ia Tec
hMIT
Northwes
tern
Penn
Prince
tonRPI
Rice
Stanford
Washington
Source: IPEDS
Percent of Full-time First-year Students Receiving Financial AidCarnegie Mellon vs. Peer Institutions
Fall 2005 Cohort
53%
68%73%
62% 62%
82% 81%
65%59% 55%
97%
84%
72%
57%
0%
20%
41%
61%
81%
102%
Cal Tec
h
Carneg
ie Mell
on
Cornell
Duke
Emory
Georg
ia Tec
hMIT
Northwes
tern
Penn
Prince
tonRPI
Rice
Stanford
Washington
Source: IPEDS
8.27
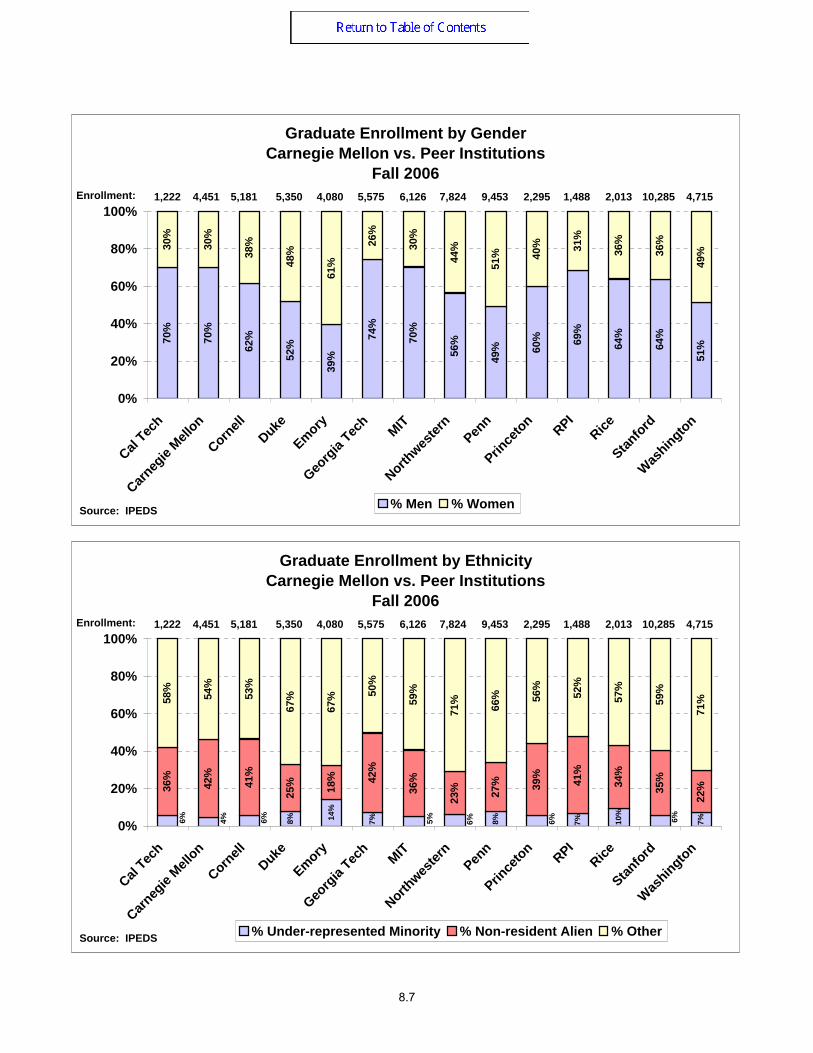
Percent of Full-time First-year Students Receiving Federal Grant AidCarnegie Mellon vs. Peer Institutions
Fall 2005 Cohort
10% 11% 12%16%
12% 13%
23%
34%
8% 9%15% 15%
11% 9%
0%
20%
40%
60%
80%
100%
Cal Tec
h
Carneg
ie Mell
on
Cornell
Duke
Emory
Georg
ia Tec
hMIT
Northwes
tern
Penn
Prince
tonRPI
Rice
Stanford
Washington
Source: IPEDS
Average Amount of Federal Grant Aid ReceivedCarnegie Mellon vs. Peer Institutions
Fall 2005 Cohort
$5,525$5,916
$5,189
$6,143
$4,641
$3,252
$5,401
$3,536
$6,630$5,950
$6,500
$2,719
$5,551
$3,654
$0$1,000$2,000$3,000$4,000$5,000$6,000$7,000$8,000
Cal Tec
h
Carneg
ie Mell
on
Cornell
Duke
Emory
Georg
ia Tec
hMIT
Northwes
tern
Penn
Prince
tonRPI
Rice
Stanford
Washington
Source: IPEDS
8.28

Percent of Full-time First-year Students Receiving State/Local Grant AidCarnegie Mellon vs. Peer Institutions
Fall 2005 Cohort
24%
6%
19%13%
26%
63%
3%
29% 30%
6%
39%
22%
6% 8%
0%
20%
40%
60%
80%
100%
Cal Tec
h
Carneg
ie Mell
on
Cornell
Duke
Emory
Georg
ia Tec
hMIT
Northwes
tern
Penn
Prince
tonRPI
Rice
Stanford
Washington
Source: IPEDS
Average Amount of State/Local Grant Aid ReceivedCarnegie Mellon vs. Peer Institutions
Fall 2005 Cohort
$3,310$2,880 $2,573
$3,034$3,881
$5,503
$1,985
$3,257$3,989
$1,785 $1,602
$3,304
$8,322
$2,491
$0
$2,000
$4,000
$6,000
$8,000
$10,000
Cal Tec
h
Carneg
ie Mell
on
Cornell
Duke
Emory
Georg
ia Tec
hMIT
Northwes
tern
Penn
Prince
tonRPI
Rice
Stanford
Washington
Source: IPEDS
8.29

Percent of Full-time First-year Students Receiving Institutional Grant AidCarnegie Mellon vs. Peer Institutions
Fall 2005 Cohort
52%
63%
43% 45% 46%
25%
58%52%
39%
55%
93%
66%
46% 47%
0%
20%
40%
60%
80%
100%
Cal Tec
h
Carneg
ie Mell
on
Cornell
Duke
Emory
Georg
ia Tec
hMIT
Northwes
tern
Penn
Prince
tonRPI
Rice
Stanford
Washington
Source: IPEDS
Average Amount of Institutional Grant Aid ReceivedCarnegie Mellon vs. Peer Institutions
Fall 2005 Cohort
$23,367
$16,891$18,364
$22,825
$18,863
$5,768
$24,299
$18,264$20,613
$17,262$14,890
$20,294$19,122
$0
$5,000
$10,000
$15,000
$20,000
$25,000
Cal Tec
h
Carneg
ie Mell
on
Cornell
Duke
Emory
Georg
ia Tec
hMIT
Northwes
tern
Penn
Prince
tonRPI
Rice
Stanford
Washington
Source: IPEDS
8.30

Percent of Full-time First-year Students Receiving Student Loan AidCarnegie Mellon vs. Peer Institutions
Fall 2005 Cohort
20%
47% 44%38% 36% 36% 39% 39% 39%
12%
52%
29%21%
31%
0%
20%
40%
60%
80%
100%
Cal Tec
h
Carneg
ie Mell
on
Cornell
Duke
Emory
Georg
ia Tec
hMIT
Northwes
tern
Penn
Prince
tonRPI
Rice
Stanford
Washington
Source: IPEDS
Average Amount of Student Loan Aid ReceivedCarnegie Mellon vs. Peer Institutions
Fall 2005 Cohort
$1,591
$5,749
$6,961
$5,750$5,146
$4,235 $4,044 $3,834
$6,276
$3,419
$5,894
$2,769
$4,223 $4,454
$0$1,000$2,000$3,000$4,000$5,000$6,000$7,000$8,000
Cal Tec
h
Carneg
ie Mell
on
Cornell
Duke
Emory
Georg
ia Tec
hMIT
Northwes
tern
Penn
Prince
tonRPI
Rice
Stanford
Washington
Source: IPEDS
8.31