Embed Size (px)
Citation preview
192 SSSAJ: Volume 75: Number 1 • January–February 2011
Soil Sci. Soc. Am. J. 75:192–206Posted online 17 Nov. 2010doi:10.2136/sssaj2010.0152Received 29 Mar. 2010. *Corresponding author ([email protected]). © Soil Science Society of America, 5585 Guilford Rd., Madison WI 53711 USAAll rights reserved. No part of this periodical may be reproduced or transmitted in any form or by any means, electronic or mechanical, including photocopying, recording, or any information storage and retrieval system, without permission in writing from the publisher. Permission for printing and for reprinting the material contained herein has been obtained by the publisher.
Pedogenesis and Soil-Geomorphic Relationships in an Arid Mountain Range, Mojave Desert, California
Pedology
Mountains are distinct and conspicuous parts of the desert landscape. Th ey comprise approximately 38% of desert lands of the southwestern United
States (Clements et al., 1957) and are characterized by extreme topography, com-plex slopes with steep gradients, and distinct geomorphic junctions at the moun-tain–piedmont boundary (Cooke et al., 1993). Because of their extent and setting, mountains probably control or strongly infl uence surfi cial processes in the desert landscape, yet few studies have directly explored pedogenic and soil-geomorphic processes of these landforms.
Previous work has shown that, for desert soils generally, eolian dust accumulation and the amount and pattern of water infi ltration are key determinants of pedogenesis (Brown and Dunkerley, 1996; Shafer et al., 2007). In turn, dust trapping and infi ltration are controlled by land surface characteristics and near-surface soil horizons. For example, desert pavements and vesicular horizons are the products of those surface characteristics that are able to trap and store considerable quantities of dust (Wells et al., 1985). Th us, the process of dust fl ux across and into the surface is immensely important to the landscape hydrology and geomorphology in these arid systems.
Although dust is a major contributor to soils of desert piedmonts (Simonson, 1995), several studies have shown that dust also accumulates in arid mountains. Soils under steep bouldery talus slopes of the Buckskin Range, Nevada, are deep and well developed (Blank et al., 1996). Th ese soils have resulted from a combination
Daniel R. Hirmas*Dep. of GeographyUniv. of KansasLawrence, KS 66045-7613
Robert C. GrahamSoil and Water Sciences ProgramDep. of Environmental SciencesUniv. of CaliforniaRiverside, CA 92521-0424
Mountains are impressive features of many desert landscapes because of their elevation, complex topography, and sheer extent. Soil genesis and landscape processes were studied in the southern Fry Mountains, Mojave Desert, California. Our aim was to better understand the processes responsible for the distribution of soil properties in this landscape. Measured properties in 65 soil pits across the study site show that dust, soluble salt, NO3
−–N, and carbonate distributions are correlated with the prevailing wind direction. Th is fi nding suggests that the mountain range eff ectively traps eolian sediment. Soils mantling these mountains have accumulated, on average, 41 kg m−2 silicate dust, 172 g m−2 soluble salts, 3.3 g m−2 NO3
−–N, and 79 kg m−2 carbonate and reached maximum concentrations of 156 kg m−2, 1800 g m−2, 43 g m−2, and 398 kg m−2, respectively, on windward sides of the range. Th e basin fl oor encompassing Soggy Lake, an upwind playa, is the probable primary source of these materials. Soil morphology and land surface characteristics from four major mountain landforms were used to interpret the pedogenic and soil-geomorphic processes that have led to the distribution patterns of these accumulations. Our study demonstrates that arid mountains accumulate and store appreciable quantities of dust, soluble salts, NO3
−, and carbonate and are therefore important to the overall geomorphic evolution and biogeochemical cycling of the region. Th e previously unaccounted storage of pedogenic carbonate in similar mountain ranges could increase the global soil inorganic C pool estimate by as much as 15 to 174 Pg C.
Abbreviations: CCE, calcium carbonate equivalent; EC, electrical conductivity; SAR, sodium adsorption ratio; TDS, total dissolved solids.
SSSAJ: Volume 75: Number 1 • January–February 2011 193
of eolian deposition, subsequent mineral transformation to smectites, and the upward raft ing of talus. Dust-fi lled pockets and crevices in the bedrock of mountain peaks and isolated ridges occur across the Mojave Desert (Reynolds et al., 2006). Th e propensity for dust accumulation in the soils of arid mountains has been linked to the distinctive land surface characteristics of the uplands (Hirmas, 2008), yet few studies have investigated this connection.
In this study, we examined the relationships between soil genesis and geomorphologically controlled dust fl ux in an arid mountain range by integrating multiple techniques. Th e ultimate goal of this work was to understand and isolate the relevant soil-geomorphic processes responsible for the distribution of soil morphological, textural, and chemical properties in this landscape.
MATERIALS AND METHODSStudy Area
Th is study was conducted in the southern Fry Mountains, Mojave Desert, California (Fig. 1), approximately 150 km northeast
of Los Angeles. Th e study area is a bolson (i.e., an internally drained intermontane basin; Peterson, 1981) and includes Soggy Lake playa (Fig. 1). Bedrock exposures in the Fry Mountains include Mesozoic diorites, monzonites, and interspersed high-grade metamorphic rocks (Nash, 1988). Soil ages on the bajada, estimated from luminescence dates at nearby trenches, range from 4400 to 28,000 yr (Rockwell et al., 2000). Annual rainfall commonly varies between 76 and 127 mm and occurs predominantly during the winter months (Howell et al., 2007), which yields an aridic soil moisture regime that borders on xeric. Creosote-bush [Larrea tridentata (DC.) Coville] and burro-weed [Ambrosia dumosa (A. Gray) W.W. Payne] dominate the vegetation, with brittlebush (Encelia farinosa A. Gray ex Torr.) locally prominent in the mountains and saltbush (Atriplex spp.) common at the playa margin (Hirmas et al., 2010). Elevations within the ?430-ha study area range from 875 m in the playa to 1200 m at the mountaintop (Fig. 1).
Soggy Lake playa is intermittently fl ooded by runoff from the surrounding piedmont and uplands during fl ash fl oods (French, 1977). Studies on paleolake levels and alluvial fans in the Mojave Desert suggest that the region experienced several periods of increased
moisture since the last glacial maximum (e.g., Enzel et al., 1989, 2003; Ely et al., 1993; Wells et al., 2003). Th ese wetter periods are known to be associated with intermittent lake stands of the nearby Mojave River basin. We are, however, unaware of any studies documenting the paleohydrology of Soggy Lake.
Th e site included six watersheds of the southern Fry Mountains, the associated piedmont, and the basin fl oor. Th e mountains were subdivided using the taxonomic logic of Peterson (1981) and terms consistent with Wysocki et al. (2000) where applicable. Previous work at the site revealed four major landforms within the southern Fry Mountains: mountaintop, mountainfl at, mountainfl ank, and mountainbase (Hirmas, 2008). Briefl y, mountaintops are defi ned as crest or ridgeline positions on a mountain and are characterized by gentle ridge slopes oft en interrupted by crags or knolls, which may form small isolated peaks. Mountainfl ats are broad, open expanses of subdued, low-relief topography containing hills, colluvial aprons, and pediments that are located within the mountain range and are elevated above the surrounding piedmont by at least 50 to 100 m. Mountainfl anks are long complex sideslopes of a mountain. Mountainbase landforms occur at the base of mountain slopes and are
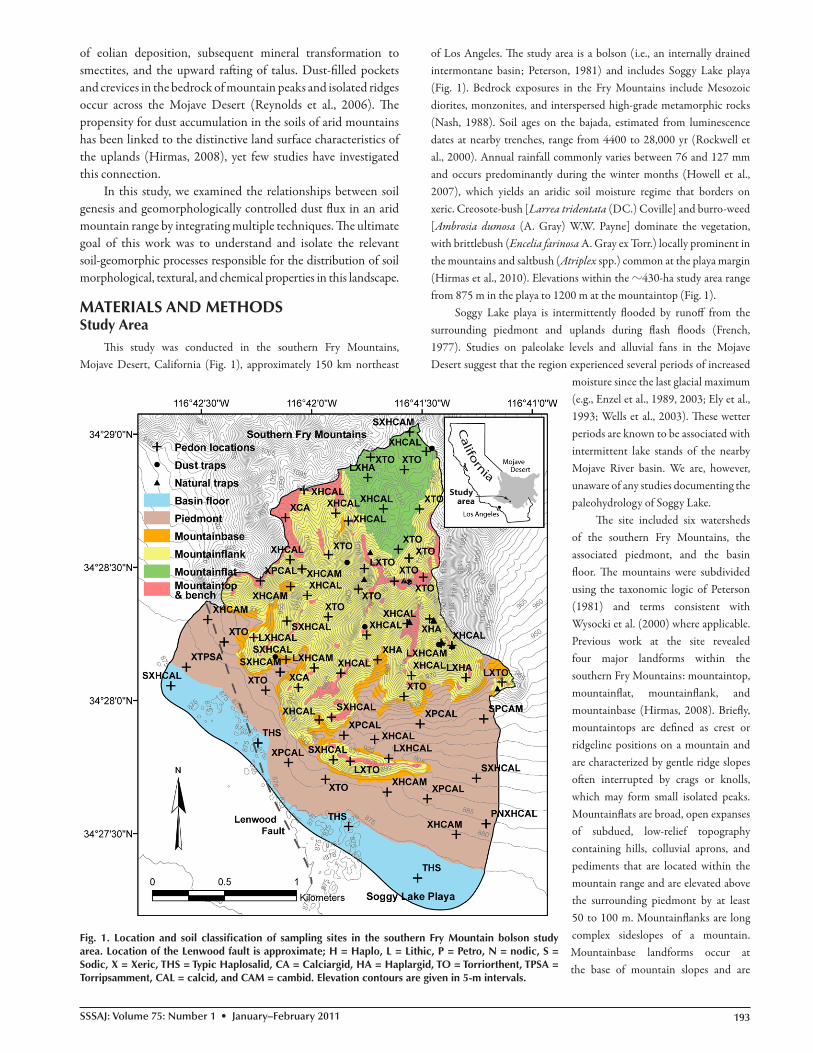
Fig. 1. Location and soil classifi cation of sampling sites in the southern Fry Mountain bolson study area. Location of the Lenwood fault is approximate; H = Haplo, L = Lithic, P = Petro, N = nodic, S = Sodic, X = Xeric, THS = Typic Haplosalid, CA = Calciargid, HA = Haplargid, TO = Torriorthent, TPSA = Torripsamment, CAL = calcid, and CAM = cambid. Elevation contours are given in 5-m intervals.

194 SSSAJ: Volume 75: Number 1 • January–February 2011
composed largely of thick wedges of colluvium. Bench landforms, which occurred within the mountainfl anks, were grouped with mountaintops on the basis of similar land surface characteristics, such as the frequency, size, and sorting of surface clasts. Th e locations of these landforms within the study area are shown in Fig. 1.
Soil Sampling and AnalysesTh e number of sampling sites was approximately proportional to
the map area of each landform (Fig. 1) and sampling locations were randomly distributed within each landform. At each sampling site, the following land surface characteristics were measured: percentage of land surface covered by clasts, mean clast width, clast frequency, clast sorting, percentage of land surface covered by overlapping clasts, and land surface roughness. Mean values and procedures used to measure these variables are given by Hirmas (2008). Briefl y, a 1-m tape transect was placed on the ground in a random orientation. (To ensure randomness, we tossed a fi eld knife into the air and chose the orientation of the blade when it came to rest on the ground as the orientation for the tape.) Every surface rock touching the edge of the tape was counted (clast frequency) and its b-axis (width) measured. Applying the line-transect method to this tape, the percentage of the land surface covered by clasts was measured as well as the overlap coverage (defi ned as the aerial coverage of overlapping clasts, >2 mm, not embedded in the soil surface). Land surface roughness was measured by the chain method (Saleh, 1993) and converted to standard deviation of elevations following Jester and Klik (2005). In addition to land surface characteristics, soils were excavated by hand (45 pits in the mountains) and backhoe (20 pits in the piedmont and basin fl oor), described and classifi ed (Soil Survey Staff , 2010), and sampled by morphologic horizon for analyses. Bulk density was determined by the paraffi n-coated clod method (Blake and Hartge, 1986) on triplicate samples from each horizon; these measurements included the gravel fraction.
To assess the particle size distribution of silicate dust at the site, six dust traps were constructed and placed across the study area in April 2006 (Fig. 1). Th e dust traps were similar to those used by Reheis and Kihl (1995) with the exception that they were placed on the ground and secured with cobbles around the base instead of mounted 2 m above the ground on steel fence posts. Hardware-cloth baskets were constructed to fi t within the traps (Reheis and Kihl, 1995) and held approximately 500, 4.3-mm-diameter, glass marbles. Th e baskets were removed from the traps in April 2007, placed on a large plastic funnel, and rinsed with deionized water into 1-L plastic bottles. Th e remainder of the trap was likewise rinsed into the bottles. Dust was separated from suspensions in the laboratory by centrifugation and subsequently air dried to pellet form. Th e total mass of dust was calculated by adding the moisture-corrected pellet mass to the total dissolved solids (TDS) in the supernatant.
In addition to dust traps, 11 “natural traps” were located and sampled (Fig. 1). Th ese were pockets, crevices, and weathering spalls of granitic boulders and outcrops on mountaintops and ridgelines. Th e geomorphic position and orientation toward the prevailing wind direction made these natural traps logical places for the accumulation of dust. Th e natural traps were sampled similarly to the techniques used by Reynolds et al. (2006); the fi ne-earth fraction in the upper <2 cm
was collected from each location. Th e particle size distribution was determined on suspensions of soil, dust trap, and natural trap samples using a Horiba LA 930 laser scattering particle-size and distribution analyzer (Horiba Instruments, Irvine, CA), which yielded data in 73 bins between 0.115 and 2000 μm (Hirmas et al., 2010).
Saturated soil pastes were extracted with the procedure outlined in Soil Survey Laboratory Staff (1996). Soil weights and water volumes for each paste were recorded. Th ese values were combined with bulk density to convert concentration data from each horizon to a mass-per-volume basis according to
sp sp ad gr b 761 1 1C C f f [1]
where C is concentration (g m−3), Csp is concentration of the saturation paste extract (mg L−1), θsp is the gravimetric water content of the saturation paste (i.e., water/air-dried soil ratio), θad is the gravimetric water content of the air-dried soil, fgr is the gravel fraction (kg kg−1) determined by sieving, ρb is the bulk density of the soil, including gravel (g cm−3), and f>76 is the volumetric fraction of cobbles and stones estimated by percentage diagrams in the fi eld. Within the upper 1 m of each pedon, horizon concentrations were combined and converted to a mass-per-unit-area basis with
1
n
i ii
M TC [2]
where M is the upper 1-m concentration (g m−2), n is the lowest horizon within the upper 1 m, Ti is the thickness of the ith horizon (m), Ci is the concentration of the ith horizon (g m−3), and Tn is the thickness from the upper depth of the lowest horizon to either the bottom boundary of that horizon or 1 m, whichever is shallower.
Electrical conductivity (EC) and pH were determined on saturation extracts immediately aft er extraction; EC was also measured in the supernatant of the dust trap samples on returning to the laboratory. Total dissolved solids (mg L−1) were calculated by multiplying the EC (dS m−1) by a factor of 640 for low values (EC < 5.0 dS m−1) and 800 for high values (EC ≥ 5.0 dS m−1) (U.S. Salinity Laboratory Staff , 1954; Sparks, 2003).
Base cations were determined on saturation extracts by inductively coupled plasma–optical emission spectroscopy (PerkinElmer Corp., Waltham, MA) and used to calculate Na adsorption ratios (SARs; U.S. Salinity Laboratory Staff , 1954) for classifi cation purposes. Saturation extracts were analyzed for NO3
−–N by ion chromatography (Dionex Corp., Sunnyvale, CA) with ion suppression EC detection. Th e CaCO3 equivalent (CCE) of the soil, gravel fractions, and dust trap samples was determined using a manometric method following Hirmas et al. (2010).
Th e spatial distributions of the various results were interpolated by ordinary kriging using a spherical variogram model with nugget in the Geostatistical Analyst extension of ArcGIS 9.2 (ESRI, Redlands, CA). Chemical data and land surface characteristics were interpolated within each landform. Th ese were combined and smoothed across the study area to create a realistic picture of the spatial distributions. All other statistics and graphics were analyzed and prepared with R 2.6.1 (R Development Core Team, Vienna).

SSSAJ: Volume 75: Number 1 • January–February 2011 195
RESULTSLand Surface Characteristics
Land surface characteristics show a general decreasing trend from the mountains to the basin fl oor (Fig. 2). Th is trend is clearly seen in clast cover (Fig. 2a), clast width (Fig. 2b), clast sorting (Fig. 2d), clast overlap (Fig. 2e), and land surface roughness (Fig. 2f ), all of which show a decrease with decreasing slope gradient.
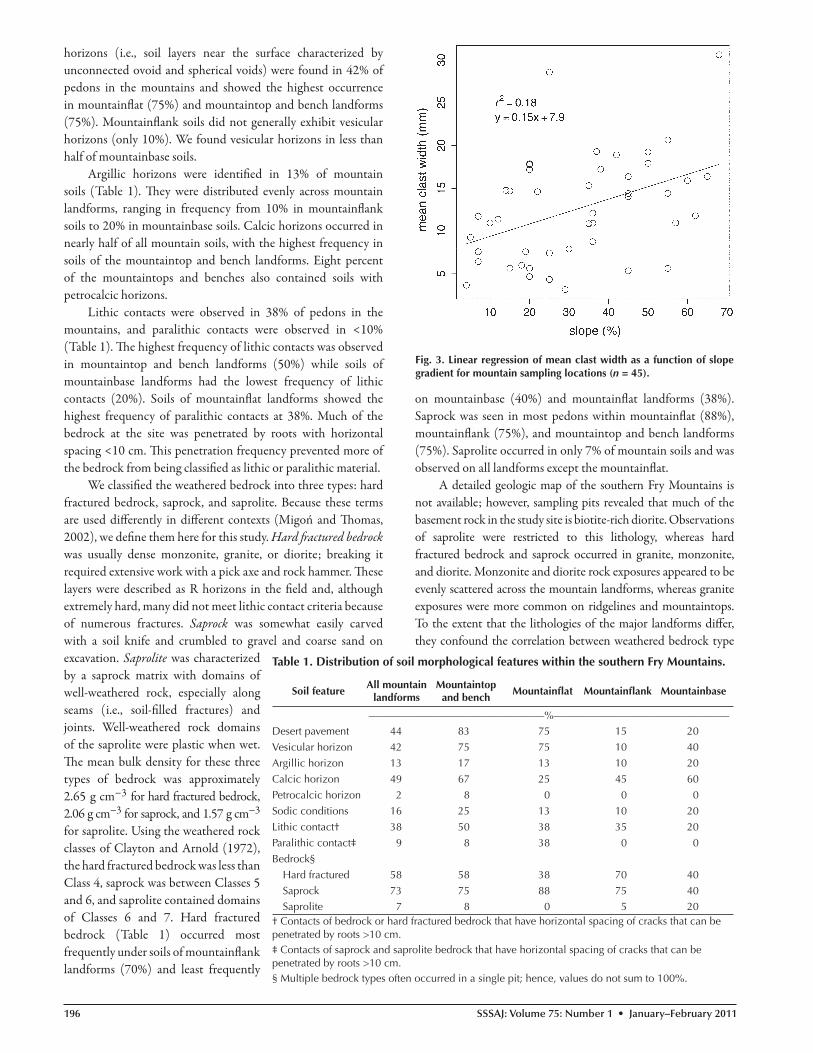
In addition, slope gradient appears to be linked to land surface characteristics on major landforms within the mountains. Clast width (Fig. 2b) was generally higher on surfaces with steep slopes (e.g., mountainfl anks) than on gently-sloping areas in the mountains (e.g., mountaintops and mountainfl ats), probably because steep slopes involve larger gradients that can move clasts of larger width. Figure 3 shows this positive relationship between mean clast width and surface slope. Although the
correlation is low, the probability that there is no relationship between slope and width is extremely small (P < 0.004). Higher clast frequencies (Fig. 2c) were observed on gently sloping landforms in the mountains, probably because of the inverse relationship between clast frequency and width (Hirmas, 2008). Th e mountainfl at, mountaintop, and bench landforms (all somewhat gently sloping) were mantled by a high density of clasts. Th ese landforms had well-sorted (Fig. 2d; high values represent poorly sorted surfaces), relatively smooth (Fig. 2f ) surfaces because they are blanketed with moderate to well-developed desert pavements (Table 1).
Soil MorphologyTh e distribution of soil morphological features in the
study area is related to mountain landforms (Table 1). Vesicular
Fig. 2. Spatial distribution of selected land surface characteristics in the southern Fry Mountain bolson study area showing (a) percentage of land surface covered by clasts, (b) mean clast width, (c) clast frequency, (d) clast sorting, (e) percentage of land surface covered by overlapping clasts, and (f) land surface roughness (standard deviation of elevations). North arrows shown. Vertical exaggeration = 2. Same scale for the x and
y dimensions as in Fig. 1.
196 SSSAJ: Volume 75: Number 1 • January–February 2011
horizons (i.e., soil layers near the surface characterized by unconnected ovoid and spherical voids) were found in 42% of pedons in the mountains and showed the highest occurrence in mountainfl at (75%) and mountaintop and bench landforms (75%). Mountainfl ank soils did not generally exhibit vesicular horizons (only 10%). We found vesicular horizons in less than half of mountainbase soils.
Argillic horizons were identifi ed in 13% of mountain soils (Table 1). Th ey were distributed evenly across mountain landforms, ranging in frequency from 10% in mountainfl ank soils to 20% in mountainbase soils. Calcic horizons occurred in nearly half of all mountain soils, with the highest frequency in soils of the mountaintop and bench landforms. Eight percent of the mountaintops and benches also contained soils with petrocalcic horizons.
Lithic contacts were observed in 38% of pedons in the mountains, and paralithic contacts were observed in <10% (Table 1). Th e highest frequency of lithic contacts was observed in mountaintop and bench landforms (50%) while soils of mountainbase landforms had the lowest frequency of lithic contacts (20%). Soils of mountainfl at landforms showed the highest frequency of paralithic contacts at 38%. Much of the bedrock at the site was penetrated by roots with horizontal spacing <10 cm. Th is penetration frequency prevented more of the bedrock from being classifi ed as lithic or paralithic material.
We classifi ed the weathered bedrock into three types: hard fractured bedrock, saprock, and saprolite. Because these terms are used diff erently in diff erent contexts (Migoń and Th omas, 2002), we defi ne them here for this study. Hard fr actured bedrock was usually dense monzonite, granite, or diorite; breaking it required extensive work with a pick axe and rock hammer. Th ese layers were described as R horizons in the fi eld and, although extremely hard, many did not meet lithic contact criteria because of numerous fractures. Saprock was somewhat easily carved with a soil knife and crumbled to gravel and coarse sand on excavation. Saprolite was characterized by a saprock matrix with domains of well-weathered rock, especially along seams (i.e., soil-fi lled fractures) and joints. Well-weathered rock domains of the saprolite were plastic when wet. Th e mean bulk density for these three types of bedrock was approximately 2.65 g cm−3 for hard fractured bedrock, 2.06 g cm−3 for saprock, and 1.57 g cm−3 for saprolite. Using the weathered rock classes of Clayton and Arnold (1972), the hard fractured bedrock was less than Class 4, saprock was between Classes 5 and 6, and saprolite contained domains of Classes 6 and 7. Hard fractured bedrock (Table 1) occurred most frequently under soils of mountainfl ank landforms (70%) and least frequently
on mountainbase (40%) and mountainfl at landforms (38%). Saprock was seen in most pedons within mountainfl at (88%), mountainfl ank (75%), and mountaintop and bench landforms (75%). Saprolite occurred in only 7% of mountain soils and was observed on all landforms except the mountainfl at.
A detailed geologic map of the southern Fry Mountains is not available; however, sampling pits revealed that much of the basement rock in the study site is biotite-rich diorite. Observations of saprolite were restricted to this lithology, whereas hard fractured bedrock and saprock occurred in granite, monzonite, and diorite. Monzonite and diorite rock exposures appeared to be evenly scattered across the mountain landforms, whereas granite exposures were more common on ridgelines and mountaintops. To the extent that the lithologies of the major landforms diff er, they confound the correlation between weathered bedrock type
Fig. 3. Linear regression of mean clast width as a function of slope gradient for mountain sampling locations (n = 45).
Table 1. Distribution of soil morphological features within the southern Fry Mountains.
Soil featureAll mountain
landformsMountaintop
and benchMountainfl at Mountainfl ank Mountainbase
————————————————–%————————————————–Desert pavement 44 83 75 15 20
Vesicular horizon 42 75 75 10 40
Argillic horizon 13 17 13 10 20
Calcic horizon 49 67 25 45 60
Petrocalcic horizon 2 8 0 0 0
Sodic conditions 16 25 13 10 20
Lithic contact† 38 50 38 35 20
Paralithic contact‡ 9 8 38 0 0
Bedrock§
Hard fractured 58 58 38 70 40
Saprock 73 75 88 75 40 Saprolite 7 8 0 5 20† Contacts of bedrock or hard fractured bedrock that have horizontal spacing of cracks that can be penetrated by roots >10 cm.‡ Contacts of saprock and saprolite bedrock that have horizontal spacing of cracks that can be penetrated by roots >10 cm.§ Multiple bedrock types often occurred in a single pit; hence, values do not sum to 100%.

SSSAJ: Volume 75: Number 1 • January–February 2011 197
and landform. Th is fi nding may limit the extrapolation of these results beyond the southern Fry Mountains.
Th e spatial distribution and taxonomic classifi cation of soils across the study area are related to mountain landforms (Fig. 1). Th ese data for the mountains, piedmont, and basin fl oor are synthesized in Table 2. Remarkably, piedmont and mountain soils showed similar diversity at the order level: 69% of mountain pedons were classifi ed as Aridisols and 31% as Entisols, compared with 75% Aridisols and 25% Entisols for piedmont pedons. All basin fl oor pedons were classifi ed as Aridisols (75% Salids and 25% Calcids). At the suborder level, Argids occurred only in the mountains and Calcids were found in the piedmont (44%) and mountains (45%). Cambids were observed more frequently in the piedmont (31%) than in the mountains (11%). Psamments occurred only in the piedmont (6%); other Entisols were classifi ed as Orthents. Although lithic contacts were observed in 38% of all mountain pedons (Table 1), only a fraction of those (20%)
were taxonomically shallow (Table 2). Most of the soils in the mountains (80%) were not in lithic subgroups.
Particle Size DistributionsTh e basin fl oor, piedmont, and mountain soils showed
diff erences in particle size distributions. Median percentages of particle size fractions and 95% confi dence intervals are given as center bars and notches, respectively, within the box plots of Fig. 4. Sand percentages were signifi cantly diff erent (P < 0.05) from one another and ranged from 11% in the basin fl oor to 66% in the piedmont. Mountain soils contained signifi cantly (P < 0.05) more silt (43%) than piedmont soils (27%). Basin fl oor soils showed the highest median value of silt at 63%. Clay percentages for the piedmont and mountain
soils were similarly low at 6 and 7%, respectively, compared with those of the basin fl oor (24%). Th us, the basin fl oor was relatively low in sand but high in silt and clay, the piedmont was high in sand but lower in silt and clay, and the mountain was high in sand and silt but low in clay. Figure 4 also shows a trend of increasing spread in the data from basin fl oor to mountain landforms; this is represented by the separation between the upper and lower box hinges and length of the whiskers. Th e increase in variation was probably caused by the increased complexity of geomorphic and pedogenic processes from basin fl oor to mountain landforms.
Ternary particle size plots for soil horizons from each mountain landform fall into one of six textural classes (Fig. 5): sand, loamy sand, sandy loam, loam, silt loam, and silty clay loam. All soil horizons in the mountains contained <35% clay. Th e A horizons showed a wide spread across the six soil textural classes (Fig. 5b). Th e fi ne-earth fraction of vesicular (Fig. 5c) and B (Fig. 5d) horizons, however, was concentrated toward the silt region in loam, silt loam, or silty clay loam textural classes. Particle size distributions of Cr horizons (Fig. 5e) concentrated toward the silt-poor, sand-rich corner of the textural triangle in sand, loamy sand, and sandy loam textural classes. Th e fi ne-earth fraction from R horizon fractures (Fig. 5f ) showed a bimodal pattern, where samples tended more toward the sand and silt regions of the diagram than the center.
Particle-size histograms for the dust sampling locations (Fig. 1) show a consistently well-defi ned peak in the coarse silt to fi ne sand range (Fig. 6). Mean values for these peaks are 119 μm (dust traps) and 106 μm (natural traps). Two anomalous peaks in the coarse and very coarse sand range (?1000 μm) probably refl ect localized eff ects. For example, at the time of sampling, coarse-textured debris at the entrance of a fresh rodent burrow was found approximately 2 m upwind from the anomalous dust trap. Th is burrow debris may have contributed to the bimodal distribution of that sample.
Given that these samples were taken at widely spaced locations and at varying elevations in the southern Fry Mountains (Fig. 1), it is noteworthy that they should have such well-defi ned particle size peaks, which occurred at approximately 110 μm. Th at is, the data do not show a particle-size sorting eff ect that might be expected across the range of elevations
Table 2. Distribution of soil taxonomic classes across the southern Fry Mountain bolson study area.
Soil classifi cation Total study area Basin fl oor Piedmont Mountain
——————————–%——————————–Aridisols 72 100 75 69
Salids 5 75 0 0
Argids 9 0 0 13
Calcids 43 25 44 45
Cambids 15 0 31 11
Entisols 28 0 25 31
Psamments 2 0 6 0
Orthents 26 0 19 31
Lithic subgroups 14 0 0 20Nonlithic subgroups 86 100 100 80
Fig. 4. Box plots of sand (s), silt (si), and clay (c) percentages comparing the three major physiographic parts of the landscape: basin fl oor, piedmont, and mountain. Boxes show the upper and lower quartiles, center bars show median values, whiskers extend to extreme data points (with a distance from the box of no more than 1.5 times the interquartile range), points show very extreme values, and notches around center bars are roughly 95% confi dence intervals around the median values.

198 SSSAJ: Volume 75: Number 1 • January–February 2011
and distances represented in this sampling scheme. Th erefore, we defi ned a “target dust size” between 32 and 373 μm that consistently contained these peaks to conservatively estimate the
fraction of soil attributable to dust (Fig. 6). Th at is, although the dust contained particles <32 μm, these particle sizes were not used to estimate the dust fraction in soil samples because
Fig. 5. Particle size ternary plots and textural classes for the fi ne-earth fraction (<2 mm) of horizons across mountain landforms showing (a) all horizons, (b) A horizons, (c) vesicular horizons, (d) B horizons, (e) Cr horizons, and (f) sampled R horizons.

SSSAJ: Volume 75: Number 1 • January–February 2011 199
they were indistinguishable from fi nes that had weathered in situ. We determined the boundaries of the target dust size window using the infl ection points that correspond to the base above and below the consistent peaks in Fig. 6. For each soil sample (horizon), a 10th-order polynomial was fi tted to the
histogram data within the target dust size range and integrated from the base of the curve to the peak. By integrating from the base of the curve rather than zero, we fi ltered out the contribution of in situ weathered particles within that size range (32–373 μm). Volumetric dust fractions from fi ne-earth soil samples were, in this way, conservatively estimated strictly from particle-size data. Dust fractions were converted to a mass per unit area basis with calculations similar to Eq. [1] and [2], correcting for gravel, cobble, and stone fractions.
Dust concentrations within the upper 1 m were highest (approximately 380 kg m−2) on the western extent of the basin fl oor, where our sampling included coppice dunes that dot the surface (Fig. 7a). Th e piedmont showed the highest quantities of dust in soils of inset fans at the eastern and western ends of the study area (Fig. 7a). Mountain soils (Fig. 7b) showed a general decreasing trend in dust content from southwest to northeast. In addition to this trend, major landforms accounted for some of the distribution patterns with respect to dust. For example, soils of mountaintop landforms had low dust contents compared with mountainfl ank soils (Fig. 7b). Dust concentrations were 53 kg m−2 in the basin fl oor, 136 kg m−2 in the piedmont, and 41 kg m−2 in the mountains (Table 3). Although mountain soils had smaller quantities of dust compared with piedmont soils (Table 3), their fi ne-earth fractions had higher concentrations of silt-size particles (Fig. 4).
Total dust fl ux (including sand) measured in dust trap samples across the range (Fig. 1) had an average value of 77.8 g m−2 yr−1 (Table 4), which is higher than most values reported for the Mojave Desert (e.g., Reheis and Kihl, 1995). Our study area, however, is part of the larger Bureau of Land Management
Fig. 6. Particle size histograms for dust trap (n = 6) and natural trap (n = 11) samples. Target dust size peaks are at approximately 110 μm.
Fig. 7. Spatial distribution of dust in the upper 1 m (a) across the southern Fry Mountain bolson study area and (b) rescaled for the mountains.
North arrows shown. Vertical exaggeration = 2. Same scale for the x and y dimensions as in Fig. 1.
Table 3. Total quantity of dust, total dissolved solids (TDS), NO3–N, and CaCO3 equivalent (CCE) per area for landforms of the southern Fry Mountain bolson study area.
Landform Dust TDS NO3−–N CCE
kg m−2 ——— g m−2 ——— kg m−2
Basin fl oor 53 10568 565 208
Piedmont 136 2311 1.4 72
Mountain 41 172 3.3 79Total study area 76 2203 72 92

200 SSSAJ: Volume 75: Number 1 • January–February 2011
Johnson Valley Off -Highway Vehicle Area. Th is area contains patches of vehicular surface disturbance on piedmonts and basin fl oors, especially a few kilometers south of the southern Fry Mountains (McAuliff e et al., 2007). Such areas of disturbance are more vulnerable to wind erosion (van Donk et al., 2003), which may explain, in part, the higher values. Additionally, sediment fl ux values increase with decreasing height above the soil surface (van Donk et al., 2003). Because our dust traps were placed on the ground, this may also explain the higher fl uxes.
Soil ChemistryTh e pattern of salinity (TDS) within the upper 1 m across
the study area is related to landform distribution (Fig. 8a and 8b). Total dissolved salts were highest for the basin fl oor, averaging 10.6 kg m−2; this was approximately fi ve times greater than for the piedmont (2.3 kg m−2) and 60 times greater than for the mountains (0.17 kg m−2; Table 3; Fig. 8a). Within the basin fl oor, depth-weighted EC determined on saturated-paste extracts ranged from 11.5 dS m−1 in the coppice dune area to 36.7 dS m−1 in Soggy Lake playa (locations shown in Fig. 7a). Th e distribution of salinity across the mountains follows a conspicuous decreasing trend from southwest to northeast (Fig. 8b). Two opposing landform eff ects were observed in addition to the general salinity trend. Soils on gently sloping mountaintops toward the west and southwest showed higher total salinity (maximum TDS = 1.8 kg m−2) in the upper 1 m compared with mountainfl anks downslope (maximum TDS = 0.8 kg m−2) (Fig. 8b). Toward the south of the range, however, mountainfl anks showed higher salinity (maximum TDS = 1.8 kg m−2) than mountaintops (maximum TDS < 0.1 kg m−2). Th e average fl ux of TDS from dust trap samples was 2.9 g m−2 yr−1 (Table 4).
In addition to salinity, 14% of the sampled pedons had subgroup classifi cations that indicated high SARs (Fig. 1). Sixteen percent of mountain soils exhibited sodic conditions (SAR ≥ 13) within one or more horizons (Table 1). Th e distribution of soils aff ected by a high SAR ranged from 10% in the mountainfl ank to 25% in mountaintop and bench landforms (Table 1). Although not expressed at the subgroup level in Fig. 1, all pedons in the basin fl oor and 63% of soils in the piedmont had horizons with sodic conditions.
Interpolated maps of NO3−–N concentrations in the
upper 1 m are depicted in Fig. 8c and 8d. Th e average NO3−–N
concentration in the basin fl oor was remarkably high at 565 g m−2 (Table 3) and reached 930 g m−2 within Soggy Lake playa (Fig. 8c). Th is concentration range was more than 100 times the concentration in the piedmont and mountain soils (Table 3). Mountain soils contained about twice as much NO3
−–N on average (3.3 g m−2) as piedmont soils (1.4 g m−2; Table 3). Figure 8d shows a trend in the mountains for NO3
−–N distribution similar to that for salinity (Fig. 8b); NO3
−–N concentrations did, however, decrease somewhat more strongly from south to
north compared with salinity. Th e landform distribution of NO3
−–N within the southwest area of the mountains showed a trend that was additionally similar to salinity. Mountainfl ank soils contained lower concentrations of NO3
−–N (?20 g m−2) compared with mountaintop soils (43 g m−2) in the west and southwest parts of the range. Th e reverse trend was observed in the southern tip of the range: mountainfl anks had higher concentrations of NO3
−–N (43 g m−2) than mountaintops (<1 g m−2) (Fig. 8d). Th e average NO3
−–N fl ux measured in dust trap samples was 199 mg m−2 yr−1 (Table 4).
Calcium carbonate equivalent values were generally highest (nearly 400 kg m−2) in soils of Soggy Lake playa and mountainfl anks (Table 3; Fig. 8e). Average integrated CCE values for the upper 1 m were 208 kg m−2 in the basin fl oor, 72 kg m−2 in the piedmont, and 79 kg m−2 in the mountains (Table 3). Th e general distribution of CCE in the mountains loosely mimics salinity: values decreased from southwest to northeast. Geochemical analyses of the saturation extracts from each horizon revealed that >99% of the CCE is calcite (CaCO3) with only a minor contribution (<1%) from NaHCO3. Calcium carbonate equivalent fl ux measured in dust trap samples had an average value of 2.3 g m−2 yr−1 (Table 4).
DISCUSSIONLinks between Landforms, Soil Morphology, and Dust FluxDust Flux
Th e quantity of soil material attributable to dust is linked to landforms at two scales. At the broad scale, there is a link between the steep topography of the mountains, the prevailing wind direction, and the distribution of dust (Pelletier and Cook, 2005). Prevailing winds blow sediment from the basin fl oor and piedmont to the mountains in an easterly direction; this fi nding was interpreted from the leeward edges of coppice dunes at the site (Fig. 7a) and observations of sand accumulating on the western fl anks of ranges in the area (Nash, 1988). At this scale, the mountains act as a wind baffl e, encouraging dust deposition especially near the mouths of the two westernmost watersheds in the study area (Fig. 7b). Th e orthogonal orientation of the mountain front to the prevailing wind direction enhances dust deposition on these watersheds. Th is process gives rise to the general trend observed in Fig. 7b of decreasing dust
Table 4. Measured fl uxes of total dust (including sand), CaCO3 equivalent (CCE), and total dissolved solids (TDS) in dust trap samples from the southern Fry Mountains determined for the period April 2006 to April 2007.
Dust trap sample
Latitude LongitudeTotal dust
fl uxCCE fl ux TDS fl ux NO3
−–N fl ux
——— g m−2 yr−1 ——— mg m−2 yr−1
DT1 N 34°28.162′ W 116°42.169′ 147.4 3.5 1.4 134
DT2 N 34°28.516′ W 116°41.843′ 98.3 1.8 1.9 150
DT3 N 34°28.944′ W 116°41.456′ 35.0 1.5 3.6 374
DT4 N 34°28.275′ W 116°41.763′ 12.6 0.6 5.5 226
DT5 N 34°28.442′ W 116°41.561′ 80.9 2.4 2.5 136DT6 N 34°28.207′ W 116°41.428′ 92.6 3.7 2.4 173

SSSAJ: Volume 75: Number 1 • January–February 2011 201
content from southwest to northeast and is consistent with experimental and modeling data that show dust preferentially deposits on windward slopes (Goossens, 1988). Reheis and Kihl (1995) reported that dust deposition rates were higher on north and west (i.e., windward) sides of mountain ranges oriented transverse to the prevailing wind direction in the Mojave Desert.
At fi ner scales, individual landforms infl uence the distribution of dust. Mountaintop and bench landforms contain less dust than mountainfl ank or mountainbase landforms. Steep landforms are characterized by rough surfaces (Fig. 2f ) with poorly sorted clasts (Fig. 2d) that, together with slope gradient, increase the potential for dust deposition and retention (Pye, 1995). Th is is because microsites between surface clasts trap and protect the dust from entrainment by the wind (Cooke et al., 1993). Mountaintop landforms, by contrast, have well-sorted and smooth surfaces on gentle slopes with fewer microsites that can trap and retain dust. In addition, the high dust
content in soils near the mountainbase and low dust content in mountaintop soils (Fig. 7b) coincide with diff erences in slope shape. Concave slopes, which characterize zones near the mountainbase, tend to have high dust accumulation, whereas convex slopes (e.g., mountaintops) are associated with low dust accumulation (Goossens, 2000). Th is result, however, may be confounded by the increased distance from the source area. Th at is, mountainbase landforms (concave slopes) are closer to dust-producing areas than mountaintops (convex slopes).
Desert Pavement and Near-Surface HorizonsGently sloping mountain landforms (e.g., mountaintops)
have surfaces mantled by desert pavement (Table 1). Th e formation of these pavements requires a degree of geomorphic stability and antiquity (McFadden et al., 1989), as shown by the presence of well-developed desert varnish, smaller surface clast widths (Fig. 2b and 3), increased surface clast frequency (Fig.
Fig. 8. Upper 1-m spatial distribution across the southern Fry Mountain bolson study area showing (a) total dissolved solids (TDS), (b) TDS rescaled for the mountains, (c) NO3
−–N, (d) NO3−–N
rescaled for the mountains, and (e) CaCO3 equivalent. North arrows shown. Vertical exaggeration = 2. A scale for the x and y dimensions
is given in Fig. 1.

202 SSSAJ: Volume 75: Number 1 • January–February 2011
2c), and well-sorted surface clasts (Fig. 2d). Th ese last three lines of evidence indicate surfaces that have been stable long enough for clasts to comminute and form smooth, dense, and well-sorted pavements (Wells et al., 1985). Vesicular horizons, formed by the deposition and incorporation of eolian material (Fig. 5c), are common on these landforms (Table 1) and are evidence of past dust accumulation (McFadden et al., 1986). Although gently sloping landforms have a lower potential to trap dust than steep landforms, they have stable surfaces that have retained dust longer. Because desert pavement formation smoothes landform surfaces (Birkeland, 1999), mountaintops and benches may have previously had rougher surfaces that trapped dust more effi ciently than the current land surface characteristics suggest.
Subsurface HorizonsSoil morphology indicates that the mountaintop and bench
landforms are older and more stable than the steeply sloping mountainfl anks. Soils on mountaintops and benches have argillic horizons more frequently than those on mountainfl anks (Table 1). Argillic horizons require thousands to tens of thousands of years to form in desert environments (Birkeland, 1999) and are encouraged by pluvial climates suitable for the weathering and translocation of clay (Reheis, 1987; Chadwick and Davis, 1990). Th e presence of argillic horizons, therefore, indicates geomorphic stability probably throughout the Holocene or longer. Petrocalcic horizons, also more abundant on mountaintops and benches, take much longer to form (Machette, 1985) and thus imply even greater stability.
Although calcic horizons do occur on mountainfl anks, they oft en have abrupt upper boundaries to overlying colluvial material. Th ese abrupt boundaries suggest that the calcic horizons have had their upper portions stripped by mass movement and have been buried by subsequent colluvial accumulations. Because carbonate in gravelly soils commonly precipitates fi rst as coats on the bottom of clasts (i.e., pendants) (Gile et al., 1966), the common observations of carbonate coats randomly oriented on gravels in the upper mantle of these soils indicate colluvial additions from upslope carbonate-enriched horizons.
Th e presence of calcic horizons on mountaintop and bench landforms not only indicates that the soils have some stability, but that they are infl uenced by dust infl ux. Mojave Desert dust is known to contain carbonates (Reheis and Kihl, 1995; Reheis, 2006) and with few exceptions (e.g., Boettinger and Southard, 1991) the formation of calcic horizons in the Mojave has been attributed to eolian inputs of CaCO3 (Reheis et al., 1995). In particular, the local basin fl oor sediments upwind from the mountain are carbonate rich (Table 3) and an average CCE fl ux value of 2.3 g m−2 yr−1 was measured in dust trap samples across the range (Table 4).
Subsoil RockLithic contacts were more common under low-gradient
mountain landforms such as the mountaintop and bench and less so under mountainfl ank and mountainbase landforms
(Table 1). Steep mountainfl anks are susceptible to gravitational mass movement processes. Th ese processes move regolith, which thickens downslope, oft en deeply burying underlying bedrock. Steep mountain landforms are mantled with deeper regolith than gently sloping landforms (mountaintops and benches), causing lithic contacts to occur deeply below the surface and probably beneath the sampling depths used in this study. In addition, the high fracture density of bedrock (which prevents it from meeting the requirements of a lithic contact) may be related to the activity of the Lenwood fault (Fig. 1), which may have shattered bedrock in the mountains. Paleoseismic studies have revealed that this part of the eastern California shear zone has experienced at least three clusters of earthquake activity in the last 15,000 yr (Rockwell et al., 2000).
Hard fractured bedrock, which oft en occurred below saprock, was common under mountainfl ank soils (70%). Such bedrock on steep slopes was usually overlain by thicker regolith than on mountaintop and bench landforms. Although most of this regolith is colluvial, water and dust infl ux on steep landforms may promote bedrock weathering. Mountainfl anks have surfaces that promote the infi ltration of water and the deposition and retention of dust. Th e dust contains relatively high quantities of soluble salts and these salts can be leached into the bedrock. (We measured an average TDS fl ux of 2.9 g m–2 yr–1 in dust trap samples [Table 4] and an average TDS fo 13.1 kg m–3 in surface horizons of basin fl oor soils from which this dust probably arises.) Soluble salts may encourage bedrock weathering if they are carried in solution into rock pores where they crystallize by evapoconcentration (Smith, 2009). Th e susceptibility of igneous bedrock at the study site to salt weathering depends on how easily the percolating salt solution can enter the rock (encouraged by fi ssures and macropores) and the grain size (medium- to coarse-grained rocks are more susceptible to weathering), and pore structure (Cardell et al., 2003) of the bedrock. Although we did not assess this susceptibility, the common fractures and seams in addition to the occurrence of medium- and coarse-grained granitic and dioritic rock present a physical environment in which salt weathering may be eff ective. In addition, the weathering of biotite (much of the subsurface bedrock at the site was identifi ed as biotite diorite) to vermiculite is a common mechanism of saprock formation (Nettleton et al., 1970; Graham et al., 2010) and may have occurred in the biotite-rich diorites of the Fry Mountains during wetter climates.
Carbonates are ubiquitous in seams and fractures of bedrock in the mountains. Th e various types of weathered bedrock (hard fractured, saprock, or saprolite) could provide long-term storage for inorganic C. Figure 9 illustrates the reason for this long-term storage. Rough, steep, windward landscape positions encourage carbonate-laden dust deposition (e.g., Fig. 7b and 9a) and water infi ltration in arid environments (Yair and Klein, 1973; Goossens, 1988). Seams and fractures of the bedrock are calcifi ed as percolating meteoric water dissolves near-surface carbonate and concentrates it at depth (Fig. 9a) (Quade and Cerling, 1990; Boettinger and Southard, 1991). During intense rainfall,

SSSAJ: Volume 75: Number 1 • January–February 2011 203
erosional events may be triggered, causing soils and sediment above the bedrock to be eroded and transported downslope (Fig. 9b), eventually reaching the piedmont. Subsequently, new colluvial debris is transported from upslope areas to mantle the bedrock (Fig. 9c) and the process is repeated (Fig. 9d). Similar hillslope sensitivity to more frequent intense precipitation accompanying climatic shift s in the southwestern United States has been documented (e.g., Harvey et al., 1999; Pederson et al., 2001; Hunt and Wu, 2004). Seams and fractures within the bedrock thus act as geomorphically stable sinks for eolian carbonate. Th e presence of carbonate in seams and fractures of bedrock may enhance weathering by its higher water retention (Duniway et al., 2007). Th e distribution of these carbonates (generally concentrated on windward slopes of the range) suggests that eolian deposition is their primary source (Fig. 8e).
Eolian Dust Flux and Mountain BiogeochemistryTh e southern Fry Mountains have a dust concentration of 41
kg m−2 on average and a concentration of 156 kg m−2 on windward slopes (Table 3; Fig. 7). Higher concentrations occur on basin fl oor
and piedmont landforms (e.g., playas and alluvial fans); these have been shown, however, to act as variable sources of dust in the Mojave Desert (Reheis, 2006). Th e ability of an alluvial fan, for example, to emit dust depends on whether the fan is active or not. Four observations from this study suggest that mountain landforms, by contrast, act primarily as sinks, providing long-term storage for eolian dust. First, the quantity of dust decreases signifi cantly from southwest (>150 kg m−2) to northeast (<1 kg m−2; Fig. 7b). Th e mountain soils must be stable long enough to accumulate, store, and maintain this pattern of distribution and high gradient of dust, probably across time scales of thousands to tens of thousands of years. Second, the occurrence of dust at considerable depths (oft en to >1 m) in these soils suggests that they have been stable long enough for dust translocation between coarse clasts and into weathered and fractured bedrock. Th ird, although not quantifi ed in the study, faunal burrows were noticed more frequently in the piedmont than in the mountains, possibly because burrowing is easier in piedmont soils, which have fewer rock fragments. Soil mounds from faunal burrowing are susceptible to defl ation and entrainment by wind, serving as a dust source on inset fans of the piedmont. Fewer burrow mounds in the mountains means dust is less likely to be derived by this process. Fourth, the complex topography of the mountains makes trapped dust unlikely to defl ate from the surface without being retrapped downwind on other parts of the range. Regolith on mountain landforms was dominated by a clast-supported matrix, suggesting that although landforms are collecting dust, these
landform surfaces have not appreciably aggraded by eolian processes. Th e storage time of dust in the mountains is primarily controlled by the stability of the regolith with respect to alluvial and colluvial processes.
Th e considerable concentrations of the dust size fraction in the young inset fans (Fig. 7a) may be largely reworked dust, translocated from the mountains to the piedmont by alluvial processes. Th is fi nding is evident from the alluvial stratifi cation preserved throughout most of the sampling depths. Vesicular horizons, which are formed in near-surface accumulations of dust, were absent on these landforms, suggesting that the dust size fraction was deposited by water rather than wind. Th ese fans, therefore, may be more signifi cant sources, rather than sinks, of this dust size fraction.
Th e concentration of salinity in soils of the southern Fry Mountains decreases from southwest to northeast. Th e source for this salt is probably surface sediments just west of Soggy Lake (across the Lenwood fault; Fig. 1). Using the classifi cation proposed by Reheis (2006), Soggy Lake is a “dry playa,” which means that it is characterized by a groundwater depth
Fig. 9. Diagram illustrating the process by which inorganic C (CaCO3) in weathered and fractured bedrock on mountainfl anks is protected from erosion and stored over large time scales.
204 SSSAJ: Volume 75: Number 1 • January–February 2011
of >10 m (French, 1977; nwis.waterdata.usgs.gov/usa/nwis/gwlevels, verifi ed 17 Oct. 2010) and has a surface dominated by hard-packed silt and clay. On the western side of the Lenwood fault, however, a puff y, surface salt layer was observed aft er a summer rainstorm event in June 2006; this is characteristic of a “wet playa” or at least a transition between a dry and wet playa (Reheis, 2006). Depth to the water table is approximately 20 m on the eastern side of the fault and 12 m on the western side, as estimated from widely spaced wells (French, 1977). Water-table contours indicate that groundwater fl ows from southwest to northeast near the playa and that the Lenwood fault is a hydrologic barrier obstructing this fl ow (French, 1977). Observations of wet playa surface conditions indicate that the Lenwood fault is indeed obstructing groundwater fl ow and causing a rise in the water-table level on its western side. Th e groundwater is probably within 10 m of the surface and able to transport salts by capillary rise under high evaporative surface conditions, especially aft er summer precipitation events. Th e transport of salts by capillary rise is signifi cant because this area can serve as a point source for dust enriched with soluble salts relative to other parts of the basin fl oor. Th e process of surface salt concentration aft er wetting–drying events and subsequent deposition downwind has been observed across the Mojave Desert (Reheis, 2006, Reynolds et al., 2007, 2009).
High levels of NO3−–N were observed on some
mountaintop and bench landforms within the mountains (Fig. 8d), in part because of the presence of desert pavement on these landforms (Graham et al., 2008). Soils on other mountaintop and bench landforms (e.g., in the southern part of the range) contained relatively little NO3
−–N. High levels of NO3−–N
were also observed in mountainfl anks at the southern end of the range (Fig. 8d). As with soluble salts, the NO3
−–N distribution mirrors the relative distribution of the basin fl oor, thus suggesting that the basin fl oor is the primary source for both soluble salts and NO3
−–N in the southern Fry Mountains. In addition, we measured an average NO3
−–N fl ux of 199 mg m−2 yr−1 from dust trap samples across the range (Table 4). Although the source of the large pool of NO3
−–N in the basin fl oor is unclear, desert sources of NO3
− include precipitation, dry deposition of NO3−
salts, nitrifi cation of NH4, biological assimilation of atmospheric N2 and subsequent mineralization, and N2 fi xation by lightning (Kumar et al., 1995; Walvoord et al., 2003).
Inorganic Carbon and Implications for the Global Carbon Inventory
Th e distribution of inorganic C diff ers somewhat from the distributions of dust, soluble salts, and NO3
−–N (Fig. 7a, 8a, 8c, and 8e). Carbonate concentrations were as high in the mountains as in other parts of the landscape and, on average, the mountains contained about 10% more than the piedmont (Table 3). Values were especially high in the southern and western portions of the range, reaching 398 kg m−2 CCE (47.8 kg m−2 inorganic C). Although carbonate can accumulate in soils through the direct sequestration of atmospheric C via mineral weathering
(Boettinger and Southard, 1991) and calcite biomineralization (Monger et al., 1991), the high concentrations on the windward sides of the range suggest that eolian deposition and recycling of carbonate is a dominant mechanism for the site. Arid mountains in the Mojave Desert and elsewhere should, therefore, be viewed as potential signifi cant sinks for inorganic C (especially on windward slopes).
Current global estimates of soil inorganic C (SIC) exclude the direct contribution from arid mountains. For example, the 1:5,000,000 Soil Map of the World (FAO-UNESCO, 1975), which has been used in digitized form to estimate global SIC stocks (e.g., Batjes, 1996; Eswaran et al., 2000), shows for the Mojave Desert region that inorganic C values were estimated from alluvial soils only. Mountains comprise an estimated 38% of the map area in this region and between 40 and 50% in other desert regions of the world (Clements et al., 1957; Goudie, 2002), although mountainous areas have not been quantifi ed for all deserts (Cooke et al., 1993). Th erefore, this study used 38% as a conservative estimate. Using this value (38% of the desert land surface area ? 18.9 million km2; United Nations Environment Programme, 1997) and the average CaCO3 of the southern Fry Mountains (79 kg m−2 CCE, Table 3), arid mountains may contain as much as 174 Pg of inorganic C, thus increasing the global SIC estimate from 750 Pg (Batjes, 1996) to 924 Pg. If current estimates have neglected only the diff erence between mountain and piedmont carbonate concentrations (i.e., 7 kg m−2 CCE; Table 3), arid mountains add a more modest, but still signifi cant, amount (15 Pg) of SIC to the global inventory. Although it is uncertain that this alone accounts for the “missing carbon sink” referred to in global and regional C studies (e.g., Stephens et al., 2007; Tian et al., 2009), accounting for pedogenic carbonate in arid mountains may signifi cantly contribute toward balancing global C budgets.
CONCLUSIONSArid mountains are host to diverse geomorphic processes
in the Mojave Desert. Th e results of this study show that the southern Fry Mountains act as a baffl e against the prevailing winds and trap eolian sediment from the basin fl oor and piedmont. Th us, these mountains are a sink for signifi cant quantities of silicate dust (41 kg m−2), soluble salts (172 g m−2), NO3
−–N (3.3 g m−2), and carbonate (79 kg m−2). Distributions of these constituents on windward slopes of the mountains are controlled by landforms (through their land surface characteristics) and account for diff erences in soil morphology. Th ey also explain the diversity of soils across landforms. Where present, lithic contacts were deeper and the associated soils showed less morphological development on steep slopes (e.g., mountainfl anks) than in soils of gently sloping landforms in the mountains. If the relationships observed in this range hold for other desert regions, arid mountains are storing massive amounts of carbonate that may add as much as 174 Pg of inorganic C to the global C pool estimate. Th is C appears to be held in long-term storage within the soils and fractured bedrock of arid mountain ranges.
SSSAJ: Volume 75: Number 1 • January–February 2011 205
ACKNOWLEDGMENTSTh is research was supported in part by a graduate fellowship from the UC Kearney Foundation of Soil Science. Intermap Technologies generously provided the digital elevation model used in this work. Special thanks are given to Brad Hewitt, Josh Barraza, Megan Harlow, Judy Turk, Héctor Estrada-Medina, Ann Rossi, Dr. Brian P. Black, Jorge Hirmas, Christopher Friesen, Wendell Icenogle, Dr. Rodrigo Vargas, Kimberly Hirmas, Robert Herrmann, and Nathan Corey for assistance in the fi eld. We thank Carrie-Ann Houdeshell (USDA-NRCS) for providing invaluable insight in choosing the study area, Dr. Scott Bradford (USDA-ARS) for use of the laser particle analyzer, and the Bureau of Land Management for approval to conduct research on land they administer. Th e comments from three anonymous reviewers helped strengthen the manuscript.
REFERENCESBatjes, N.H. 1996. Total carbon and nitrogen in soils of the world. Eur. J. Soil
Sci. 47:151–163.Birkeland, P.W. 1999. Soils and geomorphology. 3rd ed. Oxford Univ. Press,
New York.Blake, G.R., and K.H. Hartge. 1986. Bulk density. p. 363–375. In A. Klute
(ed.) Methods of soil analysis. Part 1. 2nd ed. Agron. Monogr. 9. ASA and SSSA, Madison, WI.
Blank, R.R., J.A. Young, and T. Lugaski. 1996. Pedogenesis on talus slopes, the Buckskin Range, Nevada, USA. Geoderma 71:121–142.
Boettinger, J.L., and R.J. Southard. 1991. Silica and carbonate sources for Aridisols on a granitic pediment, western Mojave Desert. Soil Sci. Soc. Am. J. 55:1057–1067.
Brown, K.J., and D.L. Dunkerley. 1996. Th e infl uence of hillslope gradient, regolith texture, stone size and stone position on the presence of a vesicular layer and related aspects of hillslope hydrologic processes: A case study from the Australian arid zone. Catena 26:71–84.
Cardell, C., T. Rivas, M.J. Mosquera, J.M. Birginie, A. Moropoulou, B. Prieto, B. Silva, and R. Van Grieken. 2003. Patterns of damage in igneous and sedimentary rocks under conditions simulating sea-salt weathering. Earth Surf. Processes Landforms 28:1–14.
Chadwick, O.A., and J.O. Davis. 1990. Soil-forming intervals caused by eolian sediment pulses in the Lahontan basin, northwestern Nevada. Geology 18:243–246.
Clayton, J.L., and J.F. Arnold. 1972. Practical grain size, fracturing density, and weathering classifi cation of intrusive rocks of the Idaho batholith. Gen. Tech. Rep. INT-2. U.S. For. Serv. Intermountain Forest Range Exp. Stn., Ogden, UT.
Clements, T., R.H. Merriam, R.O. Stone, J.L. Eymann, and H.L. Reade. 1957. A study of desert surface conditions. Tech. Rep. EP-53. U.S. Army Environ. Protection Res. Div., Natick, MA.
Cooke, R., A. Warren, and A. Goudie. 1993. Desert geomorphology. Univ. College London Press, London.
Duniway, M.C., J.E. Herrick, and H.C. Monger. 2007. Th e high water-holding capacity of petrocalcic horizons. Soil Sci. Soc. Am. J. 71:812–819.
Ely, L.L., Y. Enzel, V.R. Baker, and D.R. Cayan. 1993. A 5000-year record of extreme fl oods and climate change in the southwestern United States. Science 262:410–412.
Enzel, Y., D.R. Cayan, R.Y. Anderson, and S.G. Wells. 1989. Atmospheric circulation during Holocene lake stands in the Mojave Desert: Evidence of regional climate change. Nature 341:44–47.
Enzel, Y., S.G. Wells, and N. Lancaster. 2003. Late Pleistocene lakes along the Mojave River, southeast California. p. 61–77. In Y. Enzel et al. (ed.) Paleoenvironments and paleohydrology of the Mojave and southern Great Basin deserts. Spec. Pap. 368. Geol. Soc. Am., Boulder, CO.
Eswaran, H., P.F. Reich, J.M. Kimble, F.H. Beinroth, E. Padmanabhan, and P. Moncharoen. 2000. Global carbon stocks. p. 15–25. In R. Lal et al. (ed.) Global climate change and pedogenic carbonates. Lewis Publ., Boca Raton, FL.
FAO-UNESCO. 1975. Soil Map of the World (1:5000000). Vol. 2. North America. UNESCO, Paris.
French, J.J. 1977. Ground-water storage in the Johnson Valley Area, San Bernardino County, California. USGS Water-Resour. Invest. 77-130. U.S. Gov. Print. Offi ce, Washington, DC.
Gile, L.H., F.F. Peterson, and R.B. Grossman. 1966. Morphological and genetic
sequences of carbonate accumulation in desert soils. Soil Sci. 101:347–360.Goossens, D. 1988. Th e eff ect of surface curvature on the deposition of loess: A
physical model. Catena 15:179–194.Goossens, D. 2000. Dry aeolian dust accumulation in rocky deserts: A medium-
term fi eld experiment based on short-term wind tunnel simulations. Earth Surf. Processes Landforms 25:41–57.
Goudie, A.S. 2002. Great warm deserts of the world: Landscapes and evolution. Oxford Univ. Press, Oxford, UK.
Graham, R.C., D.R. Hirmas, Y.A. Wood, and C. Amrhein. 2008. Large near-surface nitrate pools in soils capped by desert pavement in the Mojave Desert. Calif. Geol. 36:259–262.
Graham, R.C., A.M. Rossi, and K.R. Hubbert. 2010. Rock to regolith conversion: Producing hospitable substrates for terrestrial ecosystems. GSA Today 20:4–9.
Harvey, A.M., P.E. Wigand, and S.G. Wells. 1999. Response of alluvial fan systems to the Late Pleistocene to Holocene climatic transition: Contrasts between the margins of pluvial lakes Lahontan and Mojave, Nevada and California, USA. Catena 36:255–281.
Hirmas, D.R. 2008. Surface processes, pedology, and soil-landscape modeling of the southern Fry Mountain bolson, Mojave Desert, California. Ph.D. diss. Univ. of California, Riverside.
Hirmas, D.R., C. Amrhein, and R.C. Graham. 2010. Spatial and process-based modeling of soil inorganic carbon storage in an arid piedmont. Geoderma 154:486–494.
Howell, D., Y. Kim, C. Haydu-Houdeshell, P. Clemmer, R. Almaraz, and M. Ballmer. 2007. Fitting soil property spatial distribution models in the Mojave Desert for digital soil mapping. p. 465–475. In P. Lagacherie et al. (ed.) Digital soil mapping: An introductory perspective. Elsevier, Amsterdam.
Hunt, A.G., and J.Q. Wu. 2004. Climatic infl uences on Holocene variations in soil erosion rates on a small hill in the Mojave Desert. Geomorphology 58:263–289.
Jester, W., and A. Klik. 2005. Soil surface roughness measurement: Methods, applicability, and surface representation. Catena 65:174–192.
Kumar, P.P., G.K. Manohar, and S.S. Kandalgaonkar. 1995. Global distribution of nitric oxide produced by lightning and its seasonal variation. J. Geophys. Res. 100:11203–11208.
Machette, M.N. 1985. Calcic soils of the southwestern United States. Spec. Pap. 203. Geol. Soc. Am., Boulder, CO.
McAuliff e, J.R., E.P. Hamerlynck, and M.C. Eppes. 2007. Landscape dynamics fostering the development and persistence of long-lived creosotebush (Larrea tridentata) clones in the Mojave Desert. J. Arid Environ. 69:96–126.
McFadden, L.D., J.B. Ritter, and S.G. Wells. 1989. Use of multiparameter relative-age methods for age estimation and correlation of alluvial fan surfaces on a desert piedmont, eastern Mojave Desert, California. Quat. Res. 32:276–290.
McFadden, L.D., S.G. Wells, and J.C. Dohrenwend. 1986. Infl uences of Quaternary climatic changes on processes of soil development on desert loess deposits of the Cima volcanic fi eld, California. Catena 13:361–389.
Migoń, P., and M.F. Th omas. 2002. Grus weathering mantles: Problems of interpretation. Catena 49:5–24.
Monger, H.C., L.A. Daugherty, W.C. Lindemann, and C.M. Liddell. 1991. Microbial precipitation of pedogenic calcite. Geology 19:997–1000.
Nash, D.B. 1988. Detection of a buried horizon with a high thermal diff usivity using thermal remote sensing. Photogramm. Eng. Remote Sens. 54:1437–1446.
Nettleton, W.D., K.W. Flach, and R.E. Nelson. 1970. Pedogenic weathering of tonalite in southern California. Geoderma 4:387–402.
Pederson, J., G. Smith, and F. Pazzaglia. 2001. Comparing the modern, Quaternary, and Neogene records of climate-controlled hillslope sedimentation in southeast Nevada. Geol. Soc. Am. Bull. 113:305–319.
Pelletier, J.D., and J.P. Cook. 2005. Deposition of playa windblown dust over geologic time scales. Geology 33:909–912.
Peterson, F.F. 1981. Landforms of the Basin and Range Province: Defi ned for soil survey. Tech. Bull. 28. Nevada Agric. Exp. Stn., Univ. of Nevada, Reno.
Pye, K. 1995. Th e nature, origin and accumulation of loess. Quat. Sci. Rev. 14:653–667.
Quade, J., and T.E. Cerling. 1990. Stable isotopic evidence for a pedogenic origin of carbonates in Trench 14 near Yucca Mountain, Nevada. Science 250:1549–1552.
Reheis, M.C. 1987. Climatic implications of alternating clay and carbonate formation in semiarid soils of south-central Montana. Quat. Res. 27:270–282.

206 SSSAJ: Volume 75: Number 1 • January–February 2011
Reheis, M.C. 2006. A 16-year record of eolian dust in Southern Nevada and California, USA: Controls on dust generation and accumulation. J. Arid Environ. 67:487–520.
Reheis, M.C., J.C. Goodmacher, J.W. Harden, L.D. McFadden, T.K. Rockwell, R.R. Shroba, J.M. Sowers, and E.M. Taylor. 1995. Quaternary soils and dust deposition in southern Nevada and California. Geol. Soc. Am. Bull. 107:1003–1022.
Reheis, M.C., and R. Kihl. 1995. Dust deposition in southern Nevada and California, 1984–1989: Relations to climate, source area, and source lithology. J. Geophys. Res. 100:8893–8918.
Reynolds, R.L., R. Bogle, J. Vogel, H. Goldstein, and J. Yount. 2009. Dust emission at Franklin Lake Playa, Mojave Desert (USA): Response to meteorological and hydrological changes 2005–2008. p. 105–115. In A. Oren et al. (ed.) Saline lakes around the world: Unique systems with unique values. Nat. Resour. Environ. Issues 15. S.J. and Jessie E. Quinney Nat. Resour. Res. Library, Logan, UT.
Reynolds, R.L., M. Reheis, J. Yount, and P. Lamothe. 2006. Composition of aeolian dust in natural traps on isolated surfaces of the central Mojave Desert: Insights to mixing, sources, and nutrient inputs. J. Arid Environ. 66:42–61.
Reynolds, R.L., J.C. Yount, M. Reheis, H. Goldstein, P. Chavez, Jr., R. Fulton, J. Whitney, C. Fuller, and R.M. Forester. 2007. Dust emission from wet and dry playas in the Mojave Desert, USA. Earth Surf. Processes Landforms 32:1811–1827.
Rockwell, T.K., S. Lindvall, M. Herzberg, D. Murbach, T. Dawson, and G. Berger. 2000. Paleoseismology of the Johnson Valley, Kickapoo, and Homestead Valley faults: Clustering of earthquakes in the eastern California shear zone. Bull. Seismol. Soc. Am. 90:1200–1236.
Saleh, A. 1993. Soil roughness measurement: Chain method. J. Soil Water Conserv. 48:527–529.
Shafer, D.S., M.H. Young, S.F. Zitzer, T.G. Caldwell, and E.V. McDonald. 2007. Impacts of interrelated biotic and abiotic processes during the past 125 000 years of landscape evolution in the Northern Mojave Desert, Nevada, USA. J. Arid Environ. 69:633–657.
Simonson, R.W. 1995. Airborne dust and its signifi cance to soils. Geoderma 65:1–43.
Smith, B.J. 2009. Weathering processes and forms. p. 69–100 In A.J. Parsons and
A.D. Abrahams (ed.) Geomorphology of desert environments. 2nd ed. Springer, New York.
Soil Survey Laboratory Staff . 1996. Soil survey laboratory methods manual. Soil Surv. Invest. Rep. 42. Ver. 3.0. U.S. Gov. Print. Offi ce, Washington, DC.
Soil Survey Staff . 2010. Keys to Soil Taxonomy. 11th ed. U.S. Gov. Print. Offi ce, Washington, DC.
Sparks, D.L. 2003. Environmental soil chemistry. 2nd ed. Academic Press, Amsterdam.
Stephens, B.B., K.R. Gurney, P.P. Tans, C. Sweeney, W. Peters, L. Bruhwiler, et al. 2007. Weak northern and strong tropical land carbon uptake from vertical profi les of atmospheric CO2. Science 316:1732–1735.
Tian, Y.-Q., X.-L. Xu, M.-H. Song, C.-P. Zhou, Q. Gao, and H. Ouyang. 2009. Carbon sequestration in two alpine soils on the Tibetan Plateau. J. Integr. Plant Biol. 51:900–905.
United Nations Environment Program. 1997. World atlas of desertifi cation. 2nd ed. Hodwin Arnold, London.
U.S. Salinity Laboratory Staff . 1954. Diagnosis and improvement of saline and alkali soils. USDA Agric. Handbk. 60. U.S. Gov. Print. Offi ce, Washington, DC.
van Donk, S.J., X. Huang, E.L. Skidmore, A.B. Anderson, D.L. Gebhart, V.E. Prehoda, and E.M. Kellogg. 2003. Wind erosion from military training lands in the Mojave Desert, California, U.S.A. J. Arid Environ. 54:687–703.
Walvoord, M.A., F.M. Phillips, D.A. Stonestrom, R.D. Evans, P.C. Hartsough, B.D. Newman, and R.G. Striegl. 2003. A reservoir of nitrate beneath desert soils. Science 302:1021–1024.
Wells, S.G., W.J. Brown, Y. Enzel, R.Y. Anderson, and L.D. McFadden. 2003. Late Quaternary geology and paleohydrology of pluvial Lake Mojave, southern California. p. 79–114. In Y. Enzel et al. (ed.) Paleoenvironments and paleohydrology of the Mojave and southern Great Basin deserts. Spec. Pap. 368. Geol. Soc. Am., Boulder, CO.
Wells, S.G., J.C. Dohrenwend, L.D. McFadden, B.D. Turrin, and K.D. Mahrer. 1985. Late Cenozoic landscape evolution on lava fl ow surfaces of the Cima volcanic fi eld, Mojave Desert, California. Geol. Soc. Am. Bull. 96:1518–1529.
Wysocki, D.A., P.J. Schoeneberger, and H.E. LaGarry. 2000. Geomorphology of soil landscapes. p. E5–E39. In M.E. Sumner (ed.) Handbook of soil science. CRC Press, Boca Raton, FL.
Yair, A., and M. Klein. 1973. Th e infl uence of surface properties on fl ow and erosion processes on debris covered slopes in an arid area. Catena 1:1–18.

Reproduced with permission of the copyright owner. Further reproduction prohibited without permission.


![Pedogenesis Eko [Compatibility Mode]](https://img.dokumen.tips/doc/110x75/5571fdab497959916999a445/pedogenesis-eko-compatibility-mode.jpg)