Embed Size (px)
Citation preview
Original Research
Pediatric Perfusion Imaging Using Pulsed ArterialSpin LabelingJiongjiong Wang, PhD,1,2* Daniel J. Licht, MD,3 Geon-Ho Jahng, PhD4
Chia-Shang Liu, BA,5 Joan T. Rubin, BA,6 John Haselgrove, PhD,6
Robert A. Zimmerman, MD,6 and John A. Detre, MD1,2
Purpose: To test the feasibility of pediatric perfusion imagingusing a pulsed arterial spin labeling (ASL) technique at 1.5 T.
Materials and Methods: ASL perfusion imaging was car-ried out on seven neurologically normal children and fivehealthy adults. The signal-to-noise ratio (SNR) of the per-fusion images along with T1, M0, arterial transit time, andthe temporal fluctuation of the ASL image series were mea-sured and compared between the two age groups. In addi-tion, ASL perfusion magnetic resonance (MR) was per-formed on three children with neurologic disorder.
Results: In the cohort of neurologically normal children, a70% increase in the SNR of the ASL perfusion images and a30% increase in the absolute cerebral blood flow comparedto the adult data were observed. The measures of ASL SNR,T1, and M0 were found to decrease linearly with age. Transittime and temporal fluctuation of the ASL perfusion imageseries were not significantly different between the two agegroups. The feasibility of ASL in the diagnosis of pediatricneurologic disease was also illustrated.
Conclusion: ASL is a promising tool for pediatric perfusionimaging given the unique and reciprocal benefits in terms ofsafety and image quality .
Key Words: arterial spin labeling (ASL); pediatric brain im-aging; cerebral blood flow (CBF); pediatric stroke; periven-tricular leukomalacia (PVL); benign external hydrocephalusJ. Magn. Reson. Imaging 2003;18:404–413.© 2003 Wiley-Liss, Inc.
CEREBRAL BLOOD FLOW (CBF) represents an impor-tant physiologic parameter for the diagnosis and man-agement of childhood brain disorders, particularly ce-rebrovascular disease. To date, however, bothnormative and disease data on pediatric brain perfu-sion remain sparse due to the lack of suitable tech-niques for CBF measurement. Nuclear medicine ap-proaches, such as single positron emission computedtomography (SPECT) and positron emission tomogra-phy (PET), rely on radioisotopes and are ethically prob-lematic when applied to the pediatric population. Al-though dynamic tracking of paramagnetic contrastagent in conjunction with magnetic resonance imaging(MRI) scanning has been routinely conducted in adultsto measure cerebral perfusion(1), its application in chil-dren has been limited by the technical difficulty in ad-ministering the intravenous contrast agent, especiallyin neonates. While macrovascular flow can be assessedusing transcranial Doppler ultrasound or phase con-trast MR angiography, only large vessels can be de-tected and flow values do not reliably predict CBF.
Arterial spin labeling (ASL) perfusion MRI is a prom-ising approach to directly measure CBF by utilizingarterial blood water as an endogenous diffusible tracer,in a way analgous to that used in 15O PET scanning(2).In ASL, arterial blood water is magnetically labeledproximal to the tissue of interest, and the effects of thispre-labeling are determined by pair-wise comparisonwith images acquired using control labeling. This tech-nique has been demonstrated to provide reproducibleand reliable quantitative CBF measurements in variouscerebrovascular and psychiatric disorders in adults(3–5). Pediatric perfusion imaging based on ASL may pro-vide unique advantages compared to applications ofASL in the adult population. Because ASL is totallynoninvasive and does not require intravenous injection,pediatric perfusion can be safely assessed in a widerange of age groups, including adolescents, children,neonates, and even fetuses. While the widespread ap-plication of ASL in the adult (especially aged) popula-tion has been hampered by the relatively small frac-tional perfusion signal, pediatric ASL is expected toprovide improved signal-to-noise ratio (SNR) due to theincreased blood flow in children(6–12). Previous evi-dence also suggested that the water content of brain ishigher in children than in adults(13), resulting in in-
1Department of Radiology, University of Pennsylvania, Philadelphia,Pennsylvania.2Department of Neurology, University of Pennsylvania, Philadelphia,Pennsylvania.3Department of Child Neurology, the Children’s Hospital of Philadel-phia, Philadelphia, Pennsylvania.4VA Medical Center, University of California-San Francisco, San Fran-cisco, California.5Department of Biochemistry and Biophysics, University of Pennsylva-nia, Philadelphia, Pennsylvania.6Department of Radiology, the Children’s Hospital of Philadelphia, Phil-adelphia, Pennsylvania.Contract grant sponsor: W.W. Smith Charitable Trust; Contract grantnumber: H0203; Contract grant sponsor: Pfizer.*Address reprint requests to: J.W., Department of Neurology, Univer-sity of Pennsylvania, 3400 Spruce Street, Philadelphia, PA 19104.E-mail: [email protected] January 13, 2003; Accepted May 16, 2003.DOI 10.1002/jmri.10372Published online in Wiley InterScience (www.interscience.wiley.com).
JOURNAL OF MAGNETIC RESONANCE IMAGING 18:404–413 (2003)
© 2003 Wiley-Liss, Inc. 404
creased equilibrium MR signal and spin-lattice, spin-spin relaxation time (T1, T2)(14), which should furtherimprove ASL signal in children through increasedtracer concentration and life time. Given the uniqueand reciprocal benefits in terms of safety and imagequality, ASL perfusion MRI may be particularly wellsuited for pediatric imaging.
The present study was intended to test the feasibilityof pediatric perfusion imaging using a pulsed ASL(PASL) technique at 1.5 T. Compared to continuousASL, which employs relatively long width radiofre-quency (RF) pulses, PASL techniques use nearly instantpulses with comparatively low levels of RF depositionfor spin labeling, and are particularly advantageous incircumstances where specific absorption rate (SAR) im-poses a limitation, such as high magnetic field andpediatric imaging(15). The second purpose of this studywas to test the hypothesis that pediatric ASL providesimproved SNR, as well as increased measures of CBF,compared to adult data. We compared PASL perfusionimages in children diagnosed without neurologic dis-ease and healthy adults by examining parameters in-cluding T1, M0, ASL SNR, CBF, and arterial transittime. Temporal fluctuation of the perfusion image se-ries was also measured because previous functionalMRI studies suggested that child data may containhigher level of motion and physiologic noise(16). Fi-nally, selected children with neurologic diseases werescanned using the PASL technique to illustrate its fea-sibility in the diagnosis of pediatric brain disorders.
MATERIALS AND METHODS
Imaging Sequence
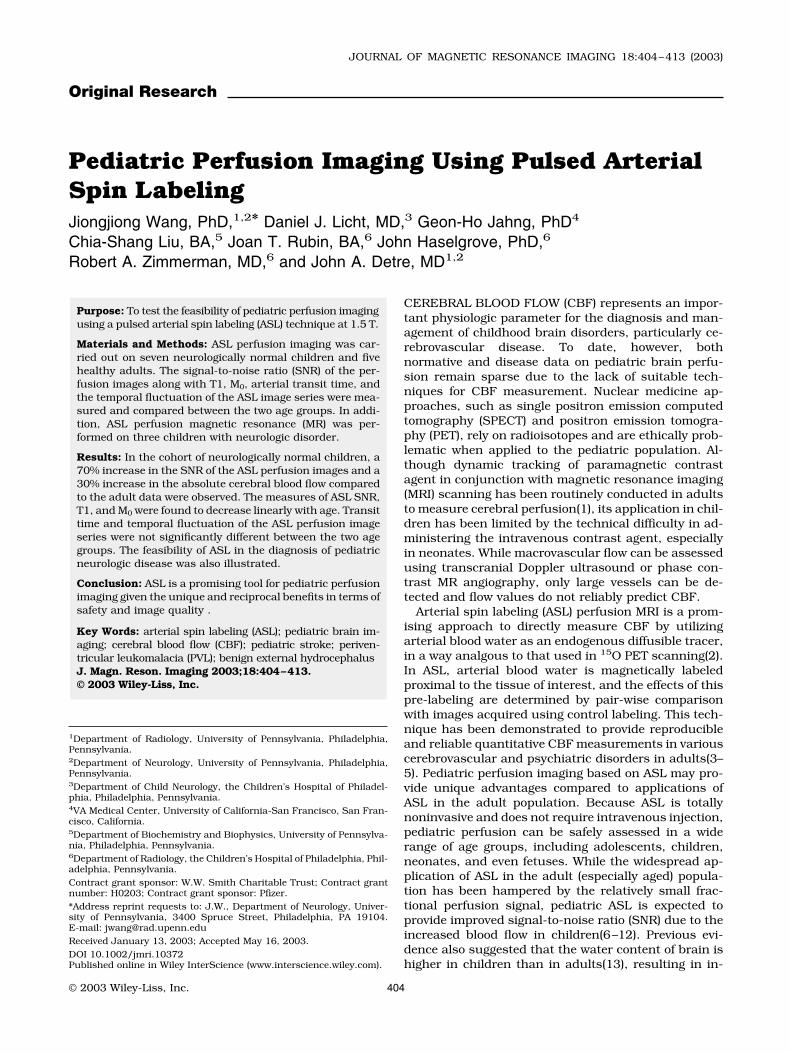
MR scanning was carried out on a 1.5-T Siemens Visionwhole body scanner, using the standard birdcage headcoil. Figure 1 displays the diagram of the PASL pulsesequence. This technique was a modified version of theFAIR technique(17), in which a saturation pulse wasapplied at TI1 � 800 msec after the global or slice-
selective inversion(18). For optimal labeling, a hyper-bolic secant (HS) inversion pulse was generated usingthe MATPULSE software(19) with 15.36-msec duration,22 �T RF amplitude, and 95% tagging efficiency. Agradient of 0.7 mT/m was applied along with the HSpulse during tag, while the HS pulse was applied in theabsence of gradient during control. The slab of the slice-selective inversion was 10-cm thick, and the slice pro-file was verified by Bloch equation simulation as well asphantom test. The saturation pulse was applied to a10-cm slab adjacent and inferior to the selective inver-sion slab in both label and control acquisitions. Thepurpose of this saturation pulse was to eliminate anyremaining labeling effect at TI1, so that the duration ofthe tagging bolus could be explicitly defined for perfu-sion quantification(20). To improve the effect for spoil-ing longitudinal magnetization, two saturation pulseswere played out consecutively followed by crusher gra-dients. A delay time (w) was inserted between the sat-uration and excitation pulses to minimize transit re-lated effects in ASL images(20,21). This delay timeshould be greater than the arterial transit time to allowall the labeled blood to flow into image slices by the timeimage is acquired (TI2), thereby the ASL perfusion mea-surement would be immune to uncertainties in arterialtransit time. Imaging parameters were: matrix size �64 � 64, TR/TE � 3000/29 msec, slice thickness � 8mm with 2-mm gap. Seven slices were acquired sequen-tially from inferior to superior using a gradient-echoecho-planer imaging (EPI) sequence, and each slice ac-quisition took about 80 msec. The field of view (FOV)was varied from 20–22 cm in children and 22–24 cm inadults, which could cause about 20% SNR gain foradult data.
MR Scanning
Perfusion scans were performed on five healthy adults(one woman and four men, ages 27–40 years, mean31.6 years) and nine children (one girl, ages one monthto 10 years, mean 3.7 years). The pediatric subjectswere identified from a list of patients scheduled forclinical non-contrast MRI for the diagnosis of develop-mental delay and headaches. The pediatric perfusionscans (about 13 minutes) were attached to the routineclinical examination, during which vital physiologic pa-rameters were continuously monitored. Written in-formed consent was obtained from the children’s par-ents as well as from adults before the scan according toan Institutional Review Board approval. Two children’sdata were later excluded because of RF artifact, result-ing in seven complete pediatric data sets. Steady stateperfusion imaging with 80 acquisitions was performedat three delays, respectively, on each adult and child(w � 0.1, 0.4, and 0.7 seconds in all adults, and fivechildren; w � 0.3, 0.6, and 0.9 seconds in the remain-ing two children). A M0 image was acquired after theperfusion scans for T1 mapping. Five of the seven chil-dren (age � 5) were sedated during the scan. In addi-tion, the perfusion protocol was carried out on threechildren with diagnosed neurologic diseases (periven-tricular leukomalacia, benign external hydrocephalus,and stroke).
Figure 1. Diagram of the PASL pulse sequence used in thepresent study, depicting related RF pulses and the gradientsalong the slice direction (Gss). The pulse sequence consisted ofinterleaved global and slice-selective inversion recovery acqui-sitions using HS pulses. Saturation pulses were applied to aslab inferior to the imaging slice (infsat 90°) to externally definethe duration of the tagging bolus (TI1), followed by a post-labeling delay time (w). Image acquisition was carried out atTI2 after the HS inversion pulses using gradient-echo EPI se-quences.
Pediatric Perfusion Imaging 405
Data Processing
The raw image series at each delay were separated intolabel and control pairs and pair-wise subtracted, fol-lowed by averaging across the image series to form themean ASL perfusion images. The first pair of acquisi-tion was excluded from analysis to avoid saturationeffect. In each child or adult, T1 image was calculatedusing the M0 image and mean raw image in perfusionscans. Due to the employed TR of three seconds, this T1measurement may cause underestimation of prolongedT1 values greater than one second, e.g., 14% reductionfor T1 of 1.4 seconds. Visual inspection of the ASLimages at different delay times suggested most of theintravascular focal signals disappeared at w � 0.7 sec-onds (see Fig. 2); therefore, data acquired at w � 0.7second were used for CBF quantification. Linear inter-polation was used to obtain the data at w � 0.7 secondin the two children undergoing scans with w � 0.3, 0.6,and 0.9 seconds. CBF images were calculated by (18)
f ���M
2�M0TI1exp� � TI2/T1a(1)
where �M is the difference signal between tag and con-trol acquisitions, � is the blood/tissue water partitioncoefficient, T1a is the longitudinal relaxation time ofblood, � is the inversion efficiency, TI1 � 800 msec is theduration between the inversion and saturation pulses,TI2 (� TI1 w) is the image acquisition time (see Fig. 1).Conversion to CBF values used assumed values of � �0.9 mL/g, � � 0.95, T1a � 1.2 seconds, and the acquiredM0 image. These parameters were primarily based onexperience in healthy adults; potential effects of ignor-ing the difference between adults and children on CBFquantification will be discussed below.
Because ASL signal series at three delays were ac-quired in each child or adult, it is possible to estimatethe arterial transit time for the tagged blood to flow fromthe labeling region to the imaging slices. This was per-
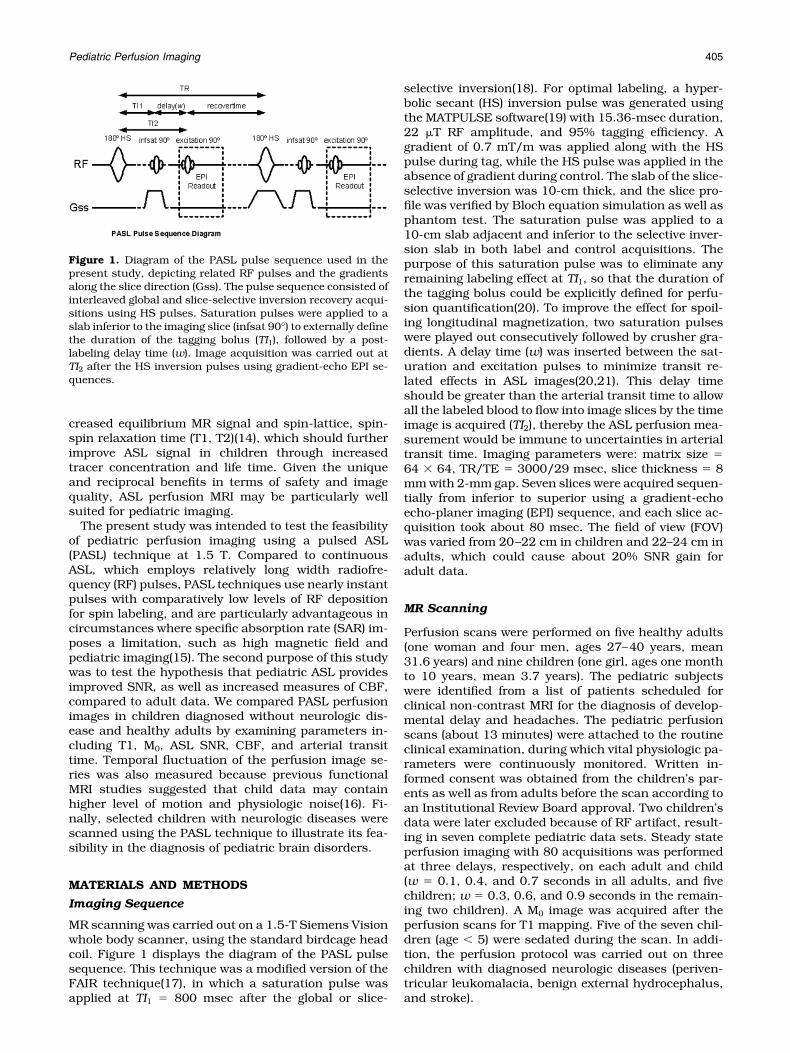
Figure 2. T1 histogram averaged across the seven children and five adults with representative T1 and M0 images acquired in a16-month-old child and 29-year-old adult (displayed using same scale). The child T1 and M0 images have higher intensities thanadult images.
Table 1Whole Brain Mean T1 and M0 Along With the Gray and White Matter Fraction in Child and Adult Groups
T1 (msec) M0 (AU)Gray matter
fractionWhite matter
fraction
Child group 988.1 � 59.0 1168.2 � 204.7 0.73 � 0.07 0.17 � 0.09Adult group 885.3 � 29.7 946.8 � 44.3 0.52 � 0.03 0.30 � 0.06T test P value
(2-tailed unpaired)0.003 0.029 0.0006 0.01
406 Wang et al.
formed by fitting the ASL signal series with the followingequation using the “curvefit” routine supplied by Inter-active Data Language(18)
�M �� 2M0f�
�exp� � TI2/T1a
� [min��a � w, 0 � ��a � TI2] (2)
where �a is transit time and the min( ) function returnsthe smaller of its two arguments. Figure 5a displays thesimulation results of Eq. [2] (fractional ASL signal, �M/M0, as a function of delay time, w) at different assumedtransit times. The parameters used in the simulationwere f � 60 mL/100 g/minute, � � 0.9 mL/g, � � 0.95,T1a �1.2 seconds, and TI1 � 800 msec. It can be seenthat �M reaches the maximum at w � �a and at leastone sample point has to be acquired at w � �a for
convergent results. Analyses of the data showed onlythe ASL signals in the bottom slice met the criteria in allthe subjects and were used to estimate the transit time.In two children, the ASL signals in the two edge sliceswere found to be higher than the center five slices,which is suspected to be caused by an imperfect sliceprofile of the labeling pulse perhaps attributable to sub-optimal coil performance. Data from the two edge slicesof these two children were excluded for transit timemeasurement and other analyses. In each child oradult, two regions of interest (ROI) of gray and whitematter were identified based on the T1 range associatedwith each type of tissue according to the T1 images andhistogram (see Fig. 1). We chose to empirically definethe segmentation of gray and white matter mainly be-cause automatic segmentation (SPM) failed to reliablyseparate different tissue type in child data. Comparison
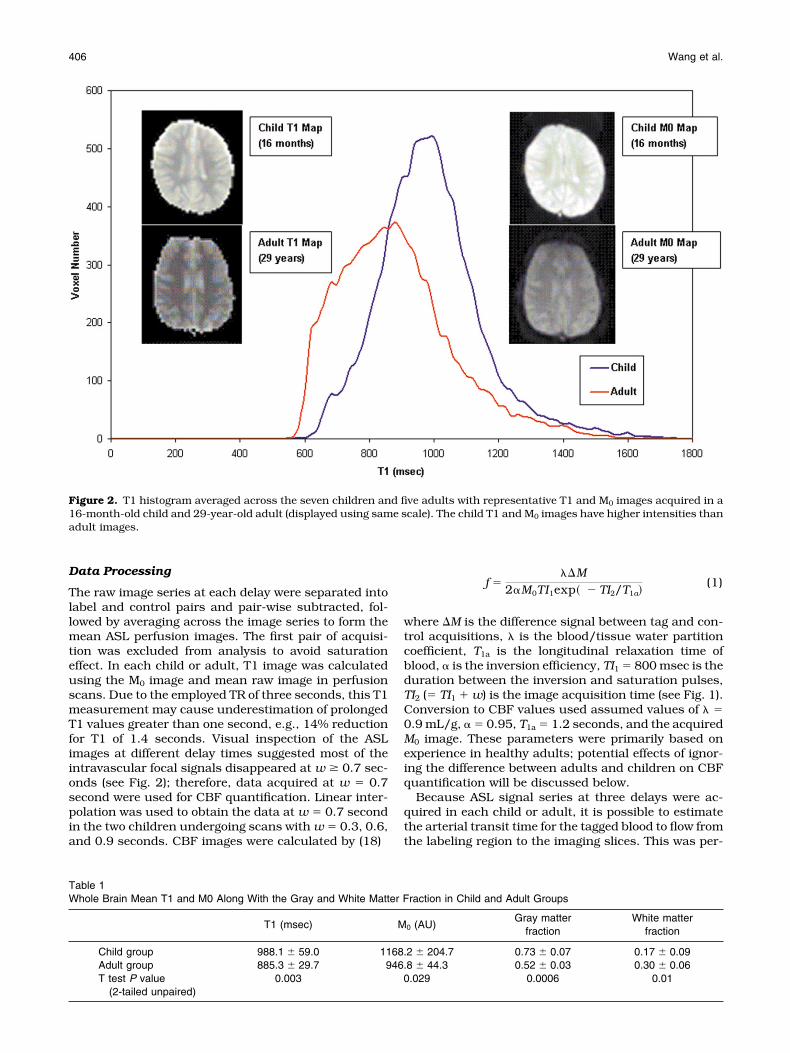
Figure 3. Four representative sets of ASL perfusion images acquired at three delays in the child (a, b, c) and adult (d) group.
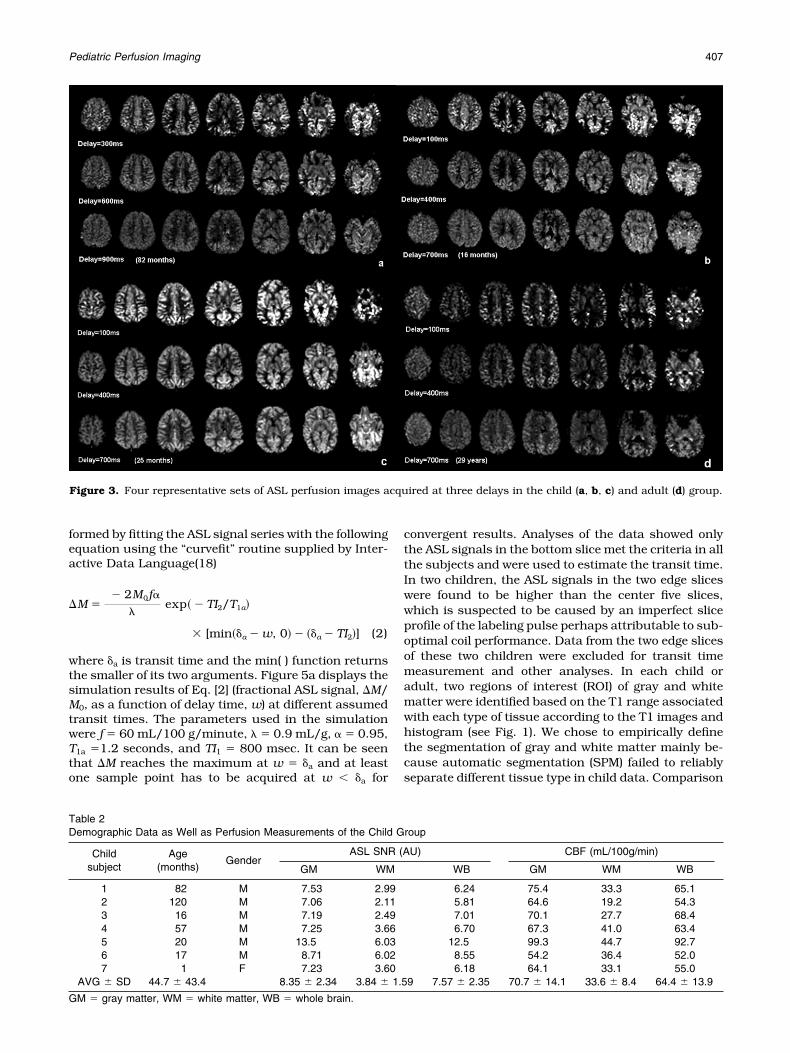
Table 2Demographic Data as Well as Perfusion Measurements of the Child Group
Childsubject
Age(months)
GenderASL SNR (AU) CBF (mL/100g/min)
GM WM WB GM WM WB
1 82 M 7.53 2.99 6.24 75.4 33.3 65.12 120 M 7.06 2.11 5.81 64.6 19.2 54.33 16 M 7.19 2.49 7.01 70.1 27.7 68.44 57 M 7.25 3.66 6.70 67.3 41.0 63.45 20 M 13.5 6.03 12.5 99.3 44.7 92.76 17 M 8.71 6.02 8.55 54.2 36.4 52.07 1 F 7.23 3.60 6.18 64.1 33.1 55.0
AVG � SD 44.7 � 43.4 8.35 � 2.34 3.84 � 1.59 7.57 � 2.35 70.7 � 14.1 33.6 � 8.4 64.4 � 13.9
GM � gray matter, WM � white matter, WB � whole brain.
Pediatric Perfusion Imaging 407

between the adult and child groups was then performedon the whole brain and ROI based measures of ASLSNR, M0, T1, CBF, and transit time. Because the ap-parent intensities of M0 images are affected by MR sys-tem variations, the M0 values were calibrated usingrecorded transmitter voltage and receiver gain on eachsubject according to the product manual(22). The ASL
SNR was defined as the ASL signal intensity divided bythe background noise level (measured from regions ofno signal). These parameters were then entered for re-gression analysis with age using SPSS software as wellas an unpaired t-test (two-tailed) for comparison be-tween the child and adult group. In addition, the tem-poral stability of the perfusion image series, determined
Figure 4. Measures of whole brain based ASL SNR (a), M0 (b), T1 (c), and CBF (d) as a function of age. Except for CBF, the otherthree parameters show negative linear relationship with age. The fitted function along with the correlation coefficient (R) andP-value of the regression analysis are shown in the plots. The triangle symbols and error bars represent the mean and SD,respectively, of the CBF measurements in each group.
Table 3Demographic Data as Well as Perfusion Measurements of the Adult Group
Adultsubject
Age(years)
GenderASL SNR (AU) CBF (mL/100g/min)
GM WM WB GM WM WB
1 27 M 5.35 1.87 4.19 44.5 16.2 36.22 29 M 6.27 3.62 5.43 55.7 33.5 50.03 31 F 5.59 1.48 4.68 69.9 17.2 61.44 31 M 4.40 1.88 3.79 46.9 21.5 42.55 40 M 4.67 2.16 3.95 71.5 36.6 63.3AVG � SD 31.6 � 5.0 5.26 � 0.74 2.20 � 0.82 4.41 � 0.66 57.7 � 12.5 25.0 � 9.4 50.7 � 11.7P(T test) 0.01 0.04 0.01 0.12 0.14 0.09
GM � gray matter, WM � white matter, WB � whole brain.
408 Wang et al.

by the SD divided by the mean of the time course of �Mimages, was measured in the whole brain, gray matter,and white matter ROIs and compared between the twoage groups.
RESULTS
M0 and T1 Mapping
Figure 2 displays the averaged T1 histogram along withrepresentative T1 and M0 images from the child andadult group. It can be clearly seen that child brain hasboth elevated T1 and M0 compared to adult brain, andthe differences reach statistical significance (see Table1). The averaged T1 histogram shows adult T1s are notonly distributed in a relatively lower range, they are alsomore dispersed compared to the child data. The childT1 values are more concentrated, and the separationbetween gray and white matter is more difficult to bediscerned. Based on Figure 2, the T1 range associatedwith white and gray matter was empirically defined as600–800 msec and 800–1100 msec, respectively, inadults, and 650–850 msec and 850–1150 msec, re-spectively, in children. This T1 based empirical tissuesegmentation was verified in each subject by compari-son with raw EPI images and ASL perfusion images thatshowed contrast between the gray and white matter.The volume fraction of white matter was found to bereduced, and the fraction of gray matter was corre-spondingly increased in children compared to adults(see Table 1). This effect was also statistically signifi-cant.
Perfusion Imaging
Figure 3 displays four representative sets of ASL perfu-sion images acquired at three delays in the child (a, b, c)and adult (d) group. With delay time greater than 0.7second, most of the bright focal intravascular signal dis-appears and the cortical structures become manifest inall four data sets. The overall image intensity fades as thedelay time increases and also decreases from inferior tosuperior slices due to the T1 decay of the tagged spins. Thespatial pattern and intensity of the �M images as a func-tion of delay time are similar in the two age groups, andare consistent with previous results using various ASLtechniques(21,23,24). The child ASL images show lesssusceptibility artifact in the orbitofrontal region comparedto adult images because the sinuses are not fully formedduring childhood(16).
It can be easily seen that the child ASL imagesprovide increased signal as well as improved delinea-tion of cortical and subcortical gray matter structurescompared to adult images. The measures of ASL SNRand CBF are tabulated in Tables 2 and 3. The ratio ofthe whole brain ASL SNR acquired in children andadults is 1.72:1 (1.69 and 1.74 in the gray and whitematter, respectively). The mean child CBF (wholebrain) is 1.27 times of that in adults (1.23 and 1.34 inthe gray and white matter, respectively). Because theT1 and M0 are higher, the increase of ASL SNR inchildren compared to adults is greater than the in-crease in CBF. Unpaired t-test shows that the childASL SNR is significantly higher than that of adults,
while the difference in CBF displays a trend in statis-tical analysis (Table 3). Figure 4 displays the regres-sion analyses of the whole brain ASL SNR (a), M0 (b),T1 (c), and CBF (d) with age. The measurements ofASL SNR and T1 showed negative linear relationshipwith age (P � 0.05), whereas the regression of M0 withage nearly reached statistical significance (P �0.056). The linear regression of CBF with age was notstatistically significant.
Figure 5 shows the simulated curve of ASL signal asa function of delay time (a) and the fitted curves intwo typical subjects from each age group (b). Thetransit time estimated from the ASL signal series inthe bottom slice was not significantly different be-tween adults and children (see Table 4). The patternof the fitted curves in Figure 5b suggests that childASL signal is increased due to prolonged T1, elevatedCBF, and M0 (see Discussion), but the flow velocityseems to remain the same as in adults. Temporalstability characterized by the normalized temporalSD shows no significant change between the two agegroups (Table 4). Our results suggest child and adultimage series demonstrate similar relative levels oftemporal fluctuation due to motion or physiologicnoise.
Figure 5. Simulated curve of ASL signal as a function of delaytime at various transit times based on Eq. [2] (a) and thetypical fitted curves in a 16-month-old child and 29-year-oldadult (b).
Pediatric Perfusion Imaging 409
Clinical Applications
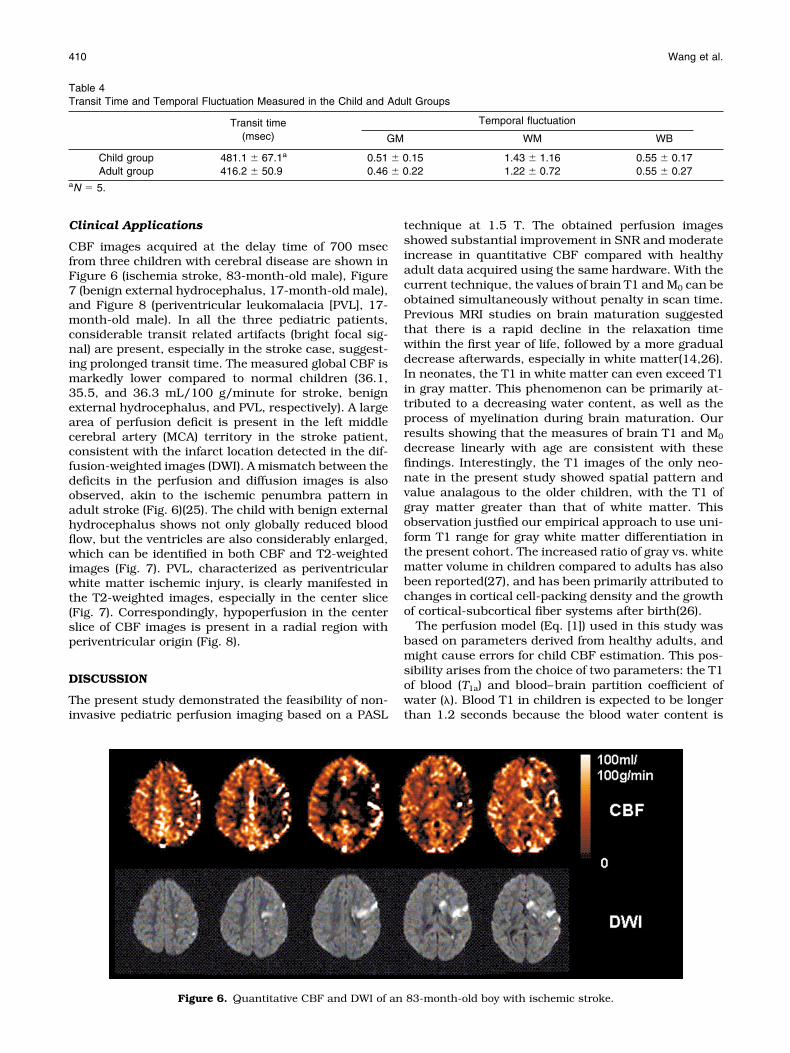
CBF images acquired at the delay time of 700 msecfrom three children with cerebral disease are shown inFigure 6 (ischemia stroke, 83-month-old male), Figure7 (benign external hydrocephalus, 17-month-old male),and Figure 8 (periventricular leukomalacia [PVL], 17-month-old male). In all the three pediatric patients,considerable transit related artifacts (bright focal sig-nal) are present, especially in the stroke case, suggest-ing prolonged transit time. The measured global CBF ismarkedly lower compared to normal children (36.1,35.5, and 36.3 mL/100 g/minute for stroke, benignexternal hydrocephalus, and PVL, respectively). A largearea of perfusion deficit is present in the left middlecerebral artery (MCA) territory in the stroke patient,consistent with the infarct location detected in the dif-fusion-weighted images (DWI). A mismatch between thedeficits in the perfusion and diffusion images is alsoobserved, akin to the ischemic penumbra pattern inadult stroke (Fig. 6)(25). The child with benign externalhydrocephalus shows not only globally reduced bloodflow, but the ventricles are also considerably enlarged,which can be identified in both CBF and T2-weightedimages (Fig. 7). PVL, characterized as periventricularwhite matter ischemic injury, is clearly manifested inthe T2-weighted images, especially in the center slice(Fig. 7). Correspondingly, hypoperfusion in the centerslice of CBF images is present in a radial region withperiventricular origin (Fig. 8).
DISCUSSION
The present study demonstrated the feasibility of non-invasive pediatric perfusion imaging based on a PASL
technique at 1.5 T. The obtained perfusion imagesshowed substantial improvement in SNR and moderateincrease in quantitative CBF compared with healthyadult data acquired using the same hardware. With thecurrent technique, the values of brain T1 and M0 can beobtained simultaneously without penalty in scan time.Previous MRI studies on brain maturation suggestedthat there is a rapid decline in the relaxation timewithin the first year of life, followed by a more gradualdecrease afterwards, especially in white matter(14,26).In neonates, the T1 in white matter can even exceed T1in gray matter. This phenomenon can be primarily at-tributed to a decreasing water content, as well as theprocess of myelination during brain maturation. Ourresults showing that the measures of brain T1 and M0
decrease linearly with age are consistent with thesefindings. Interestingly, the T1 images of the only neo-nate in the present study showed spatial pattern andvalue analagous to the older children, with the T1 ofgray matter greater than that of white matter. Thisobservation justfied our empirical approach to use uni-form T1 range for gray white matter differentiation inthe present cohort. The increased ratio of gray vs. whitematter volume in children compared to adults has alsobeen reported(27), and has been primarily attributed tochanges in cortical cell-packing density and the growthof cortical-subcortical fiber systems after birth(26).
The perfusion model (Eq. [1]) used in this study wasbased on parameters derived from healthy adults, andmight cause errors for child CBF estimation. This pos-sibility arises from the choice of two parameters: the T1of blood (T1a) and blood–brain partition coefficient ofwater (�). Blood T1 in children is expected to be longerthan 1.2 seconds because the blood water content is
Table 4Transit Time and Temporal Fluctuation Measured in the Child and Adult Groups
Transit time(msec)
Temporal fluctuation
GM WM WB
Child group 481.1 � 67.1a 0.51 � 0.15 1.43 � 1.16 0.55 � 0.17Adult group 416.2 � 50.9 0.46 � 0.22 1.22 � 0.72 0.55 � 0.27
aN � 5.
Figure 6. Quantitative CBF and DWI of an 83-month-old boy with ischemic stroke.
410 Wang et al.

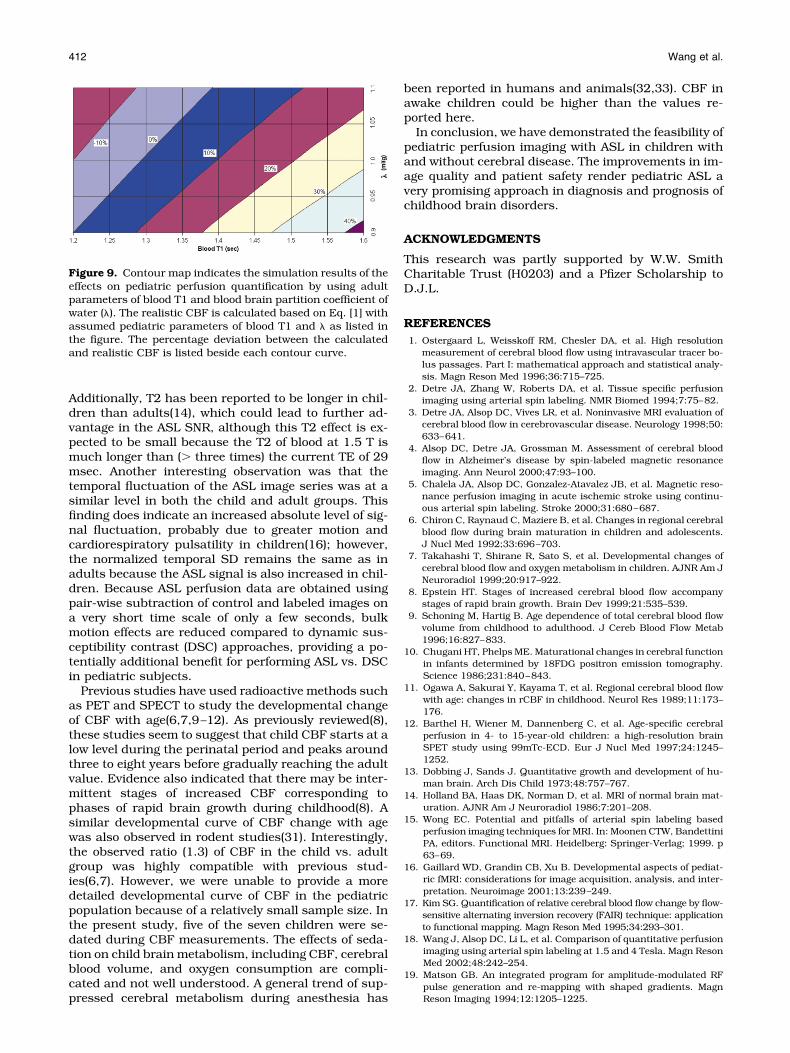
higher than that in adults(28). Our observation of ele-vated child brain T1 added support to this speculationbecause it has been reported that blood T1 generallyparallels but is slightly higher than brain T1(29). As aresult, adopting adult blood T1 in Eq. [1] may lead tooverestimation of child CBF. On the other hand, previ-ous results suggested that the blood–brain partitioncoefficient of water is higher in children (1.1 mL/g inneonates)(28) as opposed to adults (0.9 mL/g), whichwould cause underestimation of child CBF by using theadult �. Because the effects of � and T1a tend to bebalanced by each other, the adult perfusion modellikely provided a reasonable approximation in childCBF quantification, yielding CBF measures comparableto values obtained using radioactive methods(6). A sim-ulation was carried out to estimate the effects of in-creased � and T1a in children on the accuracy of pedi-atric perfusion quantification. Figure 9 displays thecontour map of the deviation between the realistic andcalculated CBF values if adult parameters are used inEq. [1]. Based on the reported values of � � 1.1 mL/gand T1a 1.5 seconds in neonates(28,30), there may beslight (10%) overestimation of perfusion in neonates
but the overall error is around 5% across the entire agespan (0–18 years). Given the relatively sparse literatureand large varibility of these parameters in pediatric agegroups, CBF quantification based on adult perfusionmodel seems to be a reasonable solution at present.Nevertheless, optimizing the specific perfusion modelfor child populations bears considerable importanceand significance in clinical diagnosis, as these param-eters may vary with pathologic state.
The improvements in the quality of pediatric perfu-sion images can be attributed to combined effects ofincreased blood flow, M0, and T1 in the pediatric pop-ulation. Because ASL techniques rely on arterial bloodwater as an endogeous tracer, increased blood watersignal (blood M0) will directly lead to higher tracer quan-tity and subsequently greater ASL signal in children.Because the lifetime of the tracer determined by bloodT1 is also prolonged in children, the loss of spin labelingduring the transit time will also be reduced compared toadults, producing further increased perfusion signal inbrain tissue. These two effects, in conjunction with themoderately elevated CBF, yield major improvements inthe pediatric perfusion signal obtained with ASL MRI.
Figure 7. Quantitative CBF and T2-weighted images of a 17-month-old boy with hydrocephalus.
Figure 8. Quantitative CBF and T2-weighted images of a 17-month-old boy with periventricular leukomalacia.
Pediatric Perfusion Imaging 411
Additionally, T2 has been reported to be longer in chil-dren than adults(14), which could lead to further ad-vantage in the ASL SNR, although this T2 effect is ex-pected to be small because the T2 of blood at 1.5 T ismuch longer than (� three times) the current TE of 29msec. Another interesting observation was that thetemporal fluctuation of the ASL image series was at asimilar level in both the child and adult groups. Thisfinding does indicate an increased absolute level of sig-nal fluctuation, probably due to greater motion andcardiorespiratory pulsatility in children(16); however,the normalized temporal SD remains the same as inadults because the ASL signal is also increased in chil-dren. Because ASL perfusion data are obtained usingpair-wise subtraction of control and labeled images ona very short time scale of only a few seconds, bulkmotion effects are reduced compared to dynamic sus-ceptibility contrast (DSC) approaches, providing a po-tentially additional benefit for performing ASL vs. DSCin pediatric subjects.
Previous studies have used radioactive methods suchas PET and SPECT to study the developmental changeof CBF with age(6,7,9–12). As previously reviewed(8),these studies seem to suggest that child CBF starts at alow level during the perinatal period and peaks aroundthree to eight years before gradually reaching the adultvalue. Evidence also indicated that there may be inter-mittent stages of increased CBF corresponding tophases of rapid brain growth during childhood(8). Asimilar developmental curve of CBF change with agewas also observed in rodent studies(31). Interestingly,the observed ratio (1.3) of CBF in the child vs. adultgroup was highly compatible with previous stud-ies(6,7). However, we were unable to provide a moredetailed developmental curve of CBF in the pediatricpopulation because of a relatively small sample size. Inthe present study, five of the seven children were se-dated during CBF measurements. The effects of seda-tion on child brain metabolism, including CBF, cerebralblood volume, and oxygen consumption are compli-cated and not well understood. A general trend of sup-pressed cerebral metabolism during anesthesia has
been reported in humans and animals(32,33). CBF inawake children could be higher than the values re-ported here.
In conclusion, we have demonstrated the feasibility ofpediatric perfusion imaging with ASL in children withand without cerebral disease. The improvements in im-age quality and patient safety render pediatric ASL avery promising approach in diagnosis and prognosis ofchildhood brain disorders.
ACKNOWLEDGMENTS
This research was partly supported by W.W. SmithCharitable Trust (H0203) and a Pfizer Scholarship toD.J.L.
REFERENCES1. Ostergaard L, Weisskoff RM, Chesler DA, et al. High resolution
measurement of cerebral blood flow using intravascular tracer bo-lus passages. Part I: mathematical approach and statistical analy-sis. Magn Reson Med 1996;36:715–725.
2. Detre JA, Zhang W, Roberts DA, et al. Tissue specific perfusionimaging using arterial spin labeling. NMR Biomed 1994;7:75–82.
3. Detre JA, Alsop DC, Vives LR, et al. Noninvasive MRI evaluation ofcerebral blood flow in cerebrovascular disease. Neurology 1998;50:633–641.
4. Alsop DC, Detre JA, Grossman M. Assessment of cerebral bloodflow in Alzheimer’s disease by spin-labeled magnetic resonanceimaging. Ann Neurol 2000;47:93–100.
5. Chalela JA, Alsop DC, Gonzalez-Atavalez JB, et al. Magnetic reso-nance perfusion imaging in acute ischemic stroke using continu-ous arterial spin labeling. Stroke 2000;31:680–687.
6. Chiron C, Raynaud C, Maziere B, et al. Changes in regional cerebralblood flow during brain maturation in children and adolescents.J Nucl Med 1992;33:696–703.
7. Takahashi T, Shirane R, Sato S, et al. Developmental changes ofcerebral blood flow and oxygen metabolism in children. AJNR Am JNeuroradiol 1999;20:917–922.
8. Epstein HT. Stages of increased cerebral blood flow accompanystages of rapid brain growth. Brain Dev 1999;21:535–539.
9. Schoning M, Hartig B. Age dependence of total cerebral blood flowvolume from childhood to adulthood. J Cereb Blood Flow Metab1996;16:827–833.
10. Chugani HT, Phelps ME. Maturational changes in cerebral functionin infants determined by 18FDG positron emission tomography.Science 1986;231:840–843.
11. Ogawa A, Sakurai Y, Kayama T, et al. Regional cerebral blood flowwith age: changes in rCBF in childhood. Neurol Res 1989;11:173–176.
12. Barthel H, Wiener M, Dannenberg C, et al. Age-specific cerebralperfusion in 4- to 15-year-old children: a high-resolution brainSPET study using 99mTc-ECD. Eur J Nucl Med 1997;24:1245–1252.
13. Dobbing J, Sands J. Quantitative growth and development of hu-man brain. Arch Dis Child 1973;48:757–767.
14. Holland BA, Haas DK, Norman D, et al. MRI of normal brain mat-uration. AJNR Am J Neuroradiol 1986;7:201–208.
15. Wong EC. Potential and pitfalls of arterial spin labeling basedperfusion imaging techniques for MRI. In: Moonen CTW, BandettiniPA, editors. Functional MRI. Heidelberg: Springer-Verlag; 1999. p63–69.
16. Gaillard WD, Grandin CB, Xu B. Developmental aspects of pediat-ric fMRI: considerations for image acquisition, analysis, and inter-pretation. Neuroimage 2001;13:239–249.
17. Kim SG. Quantification of relative cerebral blood flow change by flow-sensitive alternating inversion recovery (FAIR) technique: applicationto functional mapping. Magn Reson Med 1995;34:293–301.
18. Wang J, Alsop DC, Li L, et al. Comparison of quantitative perfusionimaging using arterial spin labeling at 1.5 and 4 Tesla. Magn ResonMed 2002;48:242–254.
19. Matson GB. An integrated program for amplitude-modulated RFpulse generation and re-mapping with shaped gradients. MagnReson Imaging 1994;12:1205–1225.
Figure 9. Contour map indicates the simulation results of theeffects on pediatric perfusion quantification by using adultparameters of blood T1 and blood brain partition coefficient ofwater (�). The realistic CBF is calculated based on Eq. [1] withassumed pediatric parameters of blood T1 and � as listed inthe figure. The percentage deviation between the calculatedand realistic CBF is listed beside each contour curve.
412 Wang et al.
20. Wong EC, Buxton RB, Frank LR. Quantitative imaging of perfusionusing a single subtraction (QUIPSS and QUIPSS II). Magn ResonMed 1998;39:702–708.
21. Alsop DC, Detre JA. Reduced transit-time sensitivity in noninva-sive magnetic resonance imaging of human cerebral blood flow.J Cereb Blood Flow Metab 1996;16:1236–1249.
22. Siemens MAGNERTON Vision manual. Functional description 2,Siemens AG, 1993.
23. Gonzalez-At JB, Alsop DC, Detre JA. Perfusion and transit timechanges during task activation determined with steady-state arte-rial spin labeling. Magn Reson Med 2000;43:739–746.
24. Edelman RR, Siewert B, Darby DG, et al. Qualitative mapping ofcerebral blood flow and functional localization with echo-planarMR imaging and signal targeting with alternating radio frequency.Radiology 1994;192:513–520.
25. Touzani O, Roussel S, MacKenzie ET. The ischaemic penumbra.Curr Opin Neurol 2001;14:83–88.
26. Inder TE, Huppi PS. In vivo studies of brain development by mag-netic resonance techniques. Ment Retard Dev Disabil Res Rev2000;6:59–67.
27. Giedd JN, Blumenthal J, Jeffries NO, et al. Brain developmentduring childhood and adolescence: a longitudinal MRI study. NatNeurosci 1999;2:861–863.
28. Herscovitch P, Raichle ME. What is the correct value for the brain–blood partition coefficient for water? J Cereb Blood Flow Metab1985;5:65–69.
29. Rooney WD, Johnson G, Tanabe J, et al. Relaxometric relaxo-graphic imaging of human brain. In: Proceedings of the 7th AnnualMeeting of ISMRM, Philadelphia, 1999. p 609.
30. van der Knaap MS, Valk J. MR imaging of the various stages ofnormal myelination during the first year of life. Neuroradiology1990;31:459–470.
31. Rowan RA, Maxwell DS. Patterns of vascular sprouting in the post-natal development of the cerebral cortex of the rat. Am J Anat1981;160:247–255.
32. Theodore WH. The role of fluorodeoxyglucose-positron emissiontomography in the evaluation of seizure disorders. Semin Neurol1989;9:301–306.
33. Todd MM, Weeks J. Comparative effects of propofol, pentobarbital,and isoflurane on cerebral blood flow and blood volume. J Neuro-surg Anesthesiol 1996;8:296–303.
Pediatric Perfusion Imaging 413