Embed Size (px)
Citation preview

1(12)
PEDESTRIAN-VEHICLE CONFLICT ANALYSIS AT SIGNALIZED
INTERSECTIONS USING MICRO-SIMULATION
Jiawei Wu
Center for Advanced Transportation Systems Simulation
Department of Civil Environment Construction Engineering
University of Central Florida
4000 Central Florida Blvd, Orlando, Florida, United States
Phone: + 1 4077613528 E-mail: [email protected]
Essam Radwan
Center for Advanced Transportation Systems Simulation
Department of Civil Environment Construction Engineering
University of Central Florida
4000 Central Florida Blvd, Orlando, Florida, United States
Phone: + 1 4075795555 E-mail: [email protected]
Hatem Abou-Senna
Center for Advanced Transportation Systems Simulation
Department of Civil Environment Construction Engineering
University of Central Florida
4000 Central Florida Blvd, Orlando, Florida, United States
Phone: + 1 4079707271 E-mail: [email protected]
ABSTRACT
The main goal of this study is to explore whether the VISSIM simulation model and Surrogate Safety
Assessment Model (SSAM) can be used to provide the reasonable estimates for pedestrian-vehicle
conflicts at signalized intersections. Two types of pedestrian-vehicle conflicts are discussed in this study,
including vehicle-yield-pedestrian and pedestrian-yield-vehicle. A total of 42 hours videos were
recorded at seven signalized intersections for field data collection. The calibrated and validated VISSIM
model was used to generate pedestrian-vehicle conflicts and SSAM software was used to extract these
conflicts by processing the vehicle trajectory file from the VISSIM model. The mean absolute percent
error (MAPE) was used to determine the maximum TTC and PET thresholds for pedestrian-vehicle
conflicts. The results showed that there was a best goodness-of-fit between simulated conflicts and
observed conflicts when the maximum TTC threshold was set to be 2.7 and the maximum PET threshold
was set to be 8. Moreover, the linear regression was developed to study the relationship between
simulated conflicts from the micro-simulation and the observed conflicts from the field. The result
indicated that there was a significant statistical relationship between the simulated conflicts and the
observed conflicts. However, it was also found that the VISSIM model underestimated the pedestrian-
vehicle conflicts. One possible reason was that the VISSIM simulation cannot generate the pedestrian-
vehicle conflicts that involved the illegal pedestrian behaviors such as red light violation in the real
world.

2(12)
1. INTRODUCTION In recent years, traffic agencies have begun to put much emphasis on the importance of pedestrian safety.
In the United States, nearly 76,000 pedestrians were reported injured in 2012. Although the number only
accounts for 3% percent of all the people injured in traffic crashes, the number of pedestrian fatalities is
still around 14% of total traffic fatalities (National Highway Traffic Safety Administration, 2014).
Furthermore, the state of Florida has consistently ranked as one of the worst states in terms of pedestrian
crashes, injuries and fatalities (Fatality Analysis Reporting System “FARS”, 2012). In addition,
according to the Florida Department of Transportation (FDOT) Crash Analysis Reporting (CAR)
System, the second highest location for pedestrian crashes is at intersection, which accounts for 40% of
the pedestrian crashes. Therefore, it is befitting to focus on the pedestrian safety at intersections.
In order to better understand the causation of pedestrian crashes, some researchers have tried to analyze
the potential factors that related to pedestrian safety by using the crash data (Haleem et al., 2015; Lefler
and Gabler, 2004). However, it requires a long period of time to collect sufficient amount of pedestrian
crash data from the field. Therefore, other studies have started to collect surrogate safety measures to
analyze pedestrian-vehicle interactions, such as conflicts (Zhang et al, 2014; Zhang et al., 2012;
Alomodfer et al., 2015). A traffic conflict is defined as an event involving two or more road users, in
which the action of one user causes the other user to make an evasive maneuver to avoid a collision
(Parker and Zegger, 1989). Three main methods were used for traffic conflicts research, including
excavation and analysis of measured data, modeling analysis of conflict mechanism and simulation-
based analysis (Li, et al., 2012).The first two methods were based on video recording while trained
people observed and identified the conflicts between the road users (Hauer, 1982; Migletz et al., 1985;
Cassidy et al., 1995; Mahmassani and Sheffi, 1981). However, the issue is that the data may be
inaccurate due to human error relating to the observers’ subjective judgments. Moreover, another
disadvantage of collecting traffic conflicts data in the field is the high cost, which leads to the other
limitations of the traffic conflict techniques (Huang et al., 2013). Therefore, the simulation based
analysis is widely used recently as an alternative tool to overcome the limitations of the other two
methods (Alhajyaseen et al., 2012).
In recent years, microscopic traffic simulation techniques have been widely used in transportation to
evaluate different traffic safety strategies. Some researches studies the potential ability to measure the
level of conflict in the traffic simulation model (Davis et al., 2011; Mak and Sicking, 2003; Young et
al., 2014). They found that the continuum of general traffic conditions, conflict, and severe conflict
could predict traffic crashes or crash severity in the traffic simulation model. A software application was
called “Surrogate Safety Assessment Model (SSAM)” designed by Federal Highway Administration
(FHWA) to perform statistical analysis of vehicle trajectory data output from microscopic traffic
simulation models (Gettman and Head, 2003). Microscopic models used include VISSIM, AIMSUM,
Paramics, and TEXAS. SSAM can calculate and summarize five surrogate safety measures, including
the time to collision (TTC), the post encroachment time (PET), the deceleration rate (DR), the maximum
speed (MaxS) and the speed differential (DeltaS). In addition, three different types of simulated conflicts
which include rear-end conflicts, lane-change conflicts, and crossing conflicts. These conflicts are
classified according to the lane link information or the angle between the two converging vehicles
(Gettman and Head, 2008).
Several studies attempted to demonstrate that the simulated conflicts from SSAM could reflect the safety
assessment in the real world. Gettman and Head (2008) tried to analyze the relationship between
simulated conflicts from SSAM and actual crash data in the real world. A model was developed to
predict crashes by using simulated conflicts at selected intersections, interchanges, and roundabouts.

3(12)
The results indicated that SSAM could provide significant correlations with actual crash data. Another
study also concluded that the calculated conflicts in micro-simulation model could predict the number
of crashes (Dijkstra et al., 2010). In addition, another research tested signalized intersections and
freeway merge areas to compare the simulated conflicts generated by VISSIM and SSAM to the
observed conflicts in the field (Huang et al., 2013; Fan et al., 2013). A procedure for using SSAM and
VISSIM for safety assessment at both signalized intersections and freeway merge areas was developed
to calibrate and validate the VISSIM model. It was found that calibrating the VISSIM simulation model
can improve the consistency between simulated conflicts from SSAM and observed conflicts in the field.
Essa and Sayed (2015) also investigated the transferability of calibrated parameter of VISSIM for
conflicts analysis by using SSAM. The results showed that the VISSIM transferred parameters could
provide better correlation between simulated and observed conflict than the default VISSIM parameters,
which emphasized that using micro-simulation to evaluate safety without proper model calibration
should be avoided.
In this study, the main objective of this study is to examine if the VISSIM simulation model and the
SSAM could estimate pedestrian-vehicle conflicts at signalized intersections. Three tasks are included
in this study. First, collect the field data at seven signalized intersections. Second, develop calibrated
and validated VISSIM simulation models at seven signalized intersections. Third, compare simulated
conflicts generated by SSAM to the conflicts observed in the field and identify if the VISSIM model
and SSAM could provide reasonable estimates for pedestrian-vehicle conflicts at signalized
intersections.
2. FIELD DATA COLLECTION The data collection in the field was used to develop, calibrate, and validate the VISSIM and SSAM
simulation models. Seven intersections were selected from urban areas in Florida, the United States.
Four criteria were considered in the site selection process: (1) the selected signalized intersection should
have high pedestrian volume; (2) the selected signalized intersection should have high traffic volume;
(3) the selected site should be in the urban area, but avoid CBD or downtown area; (4) the selected
signalized intersections should have number of pedestrian crashes according to the 5-year crash report.
The selected intersections are listed in Table 1.
Table 1: The Selected Mid-blocks and Intersections
a. 5-year Ped Crashes are from June 2009 to May 2014.
Several steps were implemented in order to extract the data from the field. In the first step, Google Maps
were utilized to extract the network geometry, such as link lengths, number of lanes, and connectors
between links to model turning movements. Second, cameras were set up in each intersection to record
No. Intersection Name 5-year Ped Crashes Location County
1 Primrose Dr & Colonial Dr 9 Orlando Orange
2 Silver Star & Hiawassee Rd 20 Pine Hills Orange
3 Sand Lake Rd & I-Drive 6 Orlando Orange
4 Kirkman Rd & Conroy Rd 13 Orlando Orange
5 Martin Luther King & US 92 7 Daytona Beach Volusia
6 Orange Ave & Kaley St 8 Orlando Orange
7 Semoran Blvd & Pershing Ave 8 Orlando Orange

4(12)
the traffic volume, pedestrian volume, pedestrian crossing behavior, maximum queue length, and
pedestrian-vehicle conflicts. One camera was set up on top of the roadside to achieve adequate viewing
height to cover the functional area of the intersections and mid-blocks. However, three intersections,
Sand Lake Rd & I-Drive, Kirkman Rd & Conroy Rd, and Semoran Blvd & Pershing Ave were too large
to cover the whole intersection with one camera. Therefore, two video cameras were set up for each of
these intersections, and each camera attached on the opposite corner of the intersection in order to cover
the whole intersection. Furthermore, field data collection was conducted during the weekday peak hours
under fine weather condition. The actual filming time was at 9:00 am-12:00 noon, and 3:00 pm-
6:00 pm in the afternoon for each intersection. In total, 6 hours of data were recorded for each
signalized intersection.
The recorded videos were later reviewed for evaluation and analysis in the laboratory. For traffic volume
and pedestrian volume, data was recorded in 15-min time intervals. Maximum queue length was
recorded for further validation of driver behavior in the VISSIM model. Furthermore, the camera angles
allowed only one or two approaches to be recorded for the queue length of each intersection. Pedestrian
behavior was collected to calibrate and validate VISSIM model for pedestrian behaviors. The parameters
of pedestrian behavior observed included the directions, platoon number, waiting time, crossing time,
and violation. Pedestrian conflicts between pedestrians and vehicles were recorded from the video by
identifying pedestrian or vehicle evasion actions meaning the potential occurrence of a vehicle crashing
into a pedestrian. Two trained observers were designated to review and analyze all the videotapes as
well as recorded the information for each conflict.
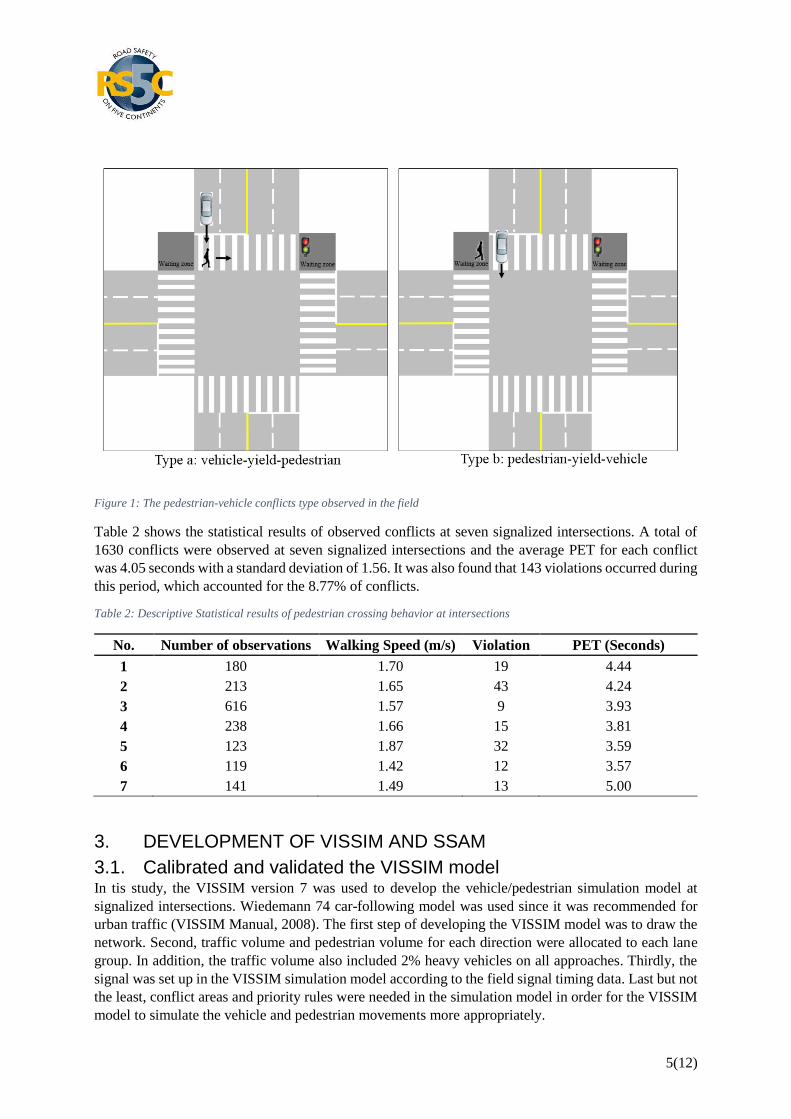
The pedestrian-vehicle conflicts observed in the field are classified into two types, including (a) vehicle-
yield-pedestrian and (b) pedestrian-yield-vehicle, as shown in Figure 1. If the vehicle decelerates in
order to avoid the crossing pedestrian, (which means the pedestrian arrives at the conflict point first),
this is the type (a) of conflict called vehicle-yield-pedestrian conflict. In contrast, if the vehicle arrives
at the conflict point first and the immediate arrival of the pedestrian comes afterward, then this is the
type (b) of conflict called pedestrian-yield-vehicle. In practice, the vehicle-yield-pedestrian conflict is
more dangerous than the pedestrian-yield-vehicle conflict. This is due to that when the pedestrian yield
the vehicle at the signalized intersection, the pedestrian always stands still until the vehicle passes the
potential conflict point. Under this condition, the TTC of pedestrian-yield-vehicle conflict is infinite.
However, the TTC of vehicle-yield-pedestrian is always small so that it is a potential collision.
Therefore, vehicle-yield-pedestrian conflict is more likely to lead to a traffic crash. In addition, the
previou studies also defined the pedestrian-vehicle conflict, which only referred to the vehicle-yield-
pedestrian conflict (Parker and Zegeer, 1989). Accordingly, this study only focuses on analyzing the
vehicle-yield-pedestrian conflicts as the pedestrian-vehicle conflicts.
5(12)
Figure 1: The pedestrian-vehicle conflicts type observed in the field
Table 2 shows the statistical results of observed conflicts at seven signalized intersections. A total of
1630 conflicts were observed at seven signalized intersections and the average PET for each conflict
was 4.05 seconds with a standard deviation of 1.56. It was also found that 143 violations occurred during
this period, which accounted for the 8.77% of conflicts.
Table 2: Descriptive Statistical results of pedestrian crossing behavior at intersections
No. Number of observations Walking Speed (m/s) Violation PET (Seconds)
1 180 1.70 19 4.44
2 213 1.65 43 4.24
3 616 1.57 9 3.93
4 238 1.66 15 3.81
5 123 1.87 32 3.59
6 119 1.42 12 3.57
7 141 1.49 13 5.00
3. DEVELOPMENT OF VISSIM AND SSAM
3.1. Calibrated and validated the VISSIM model In tis study, the VISSIM version 7 was used to develop the vehicle/pedestrian simulation model at
signalized intersections. Wiedemann 74 car-following model was used since it was recommended for
urban traffic (VISSIM Manual, 2008). The first step of developing the VISSIM model was to draw the
network. Second, traffic volume and pedestrian volume for each direction were allocated to each lane
group. In addition, the traffic volume also included 2% heavy vehicles on all approaches. Thirdly, the
signal was set up in the VISSIM simulation model according to the field signal timing data. Last but not
the least, conflict areas and priority rules were needed in the simulation model in order for the VISSIM
model to simulate the vehicle and pedestrian movements more appropriately.

6(12)
The VISSIM model cannot provide the necessary results until the model is calibrated and validated
(Cunto and Saccomanno, 2008). A total of seven intersections were separated into two groups, including
a calibration dataset with five intersections, and a validation dataset with two intersections. The five
intersections were used to develop and calibrate the VISSIM models, while the other two intersections
were used to testify the effectiveness of simulation model calibration.
First, the VISSIM simulation model was calibrated to reproduce the performance measures for both
traffic and pedestrians, such as traffic volume, pedestrian volume, queue length and pedestrian crossing
time. By applying the Chi-square tests, it was found out the difference in these measures between the
field and the simulation model were not statistically significant. Therefore, it could ensure that correct
number of vehicles and pedestrian were running at the correct speed. In addition, the different road user
behavior parameters and submodels (car-following, gap acceptance, and lane-changing) were also
needed to be calibrate (Archer, 2005). In this study, the objective is to generate the conflicts between
pedestrians and vehicles so that the number of conflicts and average TTC generated by SSAM was used
to calibrate the car-following model. A sensitivity analysis was used to calibrate the car-following
model, gap acceptance model, and lane-changing model. However, none of the parameters in the car-
following model and lane-changing model were sensitive to the result. Therefore, the default value of
the car following model, and lane-changing model were used in this case. In terms of gap acceptance
model, it was found that when the minimum gap acceptance was 3 seconds, the VISSIM provided the
best results. Last, animation of the VISSIM simulation models were checked to find out if some unusual
events happen. It was found that only few number of crashes took place in the simulation model. Finally,
the two intersections for validation were testifying the effectiveness of simulation model calibration by
using the same parameters. Therefore, the VISSIM simulation model was calibrated and validated. The
graphical representation of the Sand Lake Road and I Drive is shown in Figure 2.
Figure 2: VISSIM simulation model for Sand Lake Rd & I-Drive
Furthermore, the simulation was run for 3600 seconds (1 hour) with additional warm up period of 15
minutes in each scenario. A total of 10 runs with different seeding values for each one-hour time interval
7(12)
per intersection were completed for each scenario and the average of the runs was reported. For example,
six hours of simulated data were collected at the seven intersections, then the VISSIM model was run
for 10*6*7=420 times.
3.2. SSAM Calibration SSAM software can automate conflict analysis by directly processing vehicle trajectory data from
VISSIM. However, SSAM was not explicitly designed for pedestrian conflict analysis, so there is no
vehicle or entity type available in the trajectory file format by which to identify pedestrian conflicts. The
only way to get the pedestrian-vehicle conflicts is to export the result as a csv file. From the csv file, the
pedestrian-vehicle conflict can be filtered based on the “vehicle” length. The length of pedestrian is
usually defined between 0.3 and 0.5 meter. In comparison, the length of vehicle is usually defined over
3.5 meters.
Two threshold values for surrogate measures of safety were used in SSAM to detect the conflicts, which
are maximum TTC and maximum PET. TTC is defined as the time distance to a collision of two road
users if they keep their directions and velocities. PET is defined as the period of time from the moment
when the first road user is leaving the conflict area until the second road user reahces it. For example, if
the maximum TTC is set as 1.5, then SSAM will only generate the conflict data that contains TTC value
less than 1.5. In general, SSAM utilizes a default maximum TTC value of 1.5 seconds and maximum
PET value of 5 seconds to delineate the vehicle-vehicle conflicts. However, the pedestrian-vehicle
conflict is totally different from the vehicle-vehicle conflicts so that the maximum TTC and PET
thresholds need to be adjusted for pedestrian-vehicle conflicts.
A number of trials were applied to get the optimized TTC and PET thresholds. Finally, it was found that
when the maximum TTC threshold ranged from 2 to 3 and the maximum PET ranged from 5 to 9, SSAM
can provide a better estimate of number of conflicts that matches the field data. Therefore, further
analysis was needed to determine the exact value of TTC and PET for pedestrian-vehicle conflicts. Then,
the maximum TTC threshold was set as 2.0, 2.3, 2.5, 2.7, 3 for 5 levels, and the maximum PET threshold
was set as 5, 6, 7, 8, 9 for additional five levels. Therefore, 5*5=25 combinations of pedestrian-vehicle
conflicts were generated by SSAM. The mean absolute percent error (MAPE) was used to measure the
differences between the mean PET observed in the field and the mean PET simulated in VISSIM and
SSAM. The lower MAPE means that the small difference between the simulated conflicts and observed
conflicts. The MAPE value can be calculated by the following equation:
MAPE = 1
𝑛∑ |
𝑐𝑠𝑖 − 𝑐𝑜
𝑖
𝑐𝑜𝑖
𝑛
𝑖=1
|
Where n represents the number of intersections, 𝑐𝑠𝑖 represents the mean PET of the simulated conflicts
for one intersection, and 𝑐𝑜𝑖 represents the mean PET of the observed conflicts for one intersection.
MAPE value with different maximum TTC and PET thresholds is shown in Table 3. The MAPE value
for the total conflicts varied from 12.7% to 73.2% for different maixmum TTC and PET thresholds. In
addition, the contour plot for MAPE is shown in Figure 3. It is found that when the TTC ranges from
2.6 to 2.8 seconds and PET threshold ranges from 8 to 9, the best goodness-of-fit between the observed
and the simulated conflict of mean PET is achieved with the MAPE value under 13%. Therefore, the
suitable maximum TTC and PET thresholds for pedestrian-vehicle conflicts are 2.7 and 8, respectively.
Accordingly, the following analysis is based on the results when the maximum TTC threshold is set as
2.7 and the maximum PET threshold is set as 8.

8(12)
Table 3: MAPE with different maixmum TTC and PET thresholds
Maximum PET
threshold
Maximum TTC threshold
2 2.3 2.5 2.7 3
5 0.1473 0.1365 0.1438 0.1256 0.2885
6 0.1402 0.1382 0.1439 0.1394 0.1549
7 0.1475 0.1409 0.1421 0.1420 0.1551
8 0.1678 0.1399 0.1344 0.1273 0.1399
9 0.1922 0.1410 0.1378 0.1301 0.1467
Figure 3: Contour plot for MAPE value with different TTC and PET threshold
4. RELATIONSHIP BETWEEN SIMULATED CONFLICTS AND
OBSERVED CONFLICTS After both VISSIM and SSAM are calibrated, the conflicts generated by calibrated and validated the
VISSIM model are identified by SSAM only when the maximum TTC threshold is set as 2.7 and the
maximum PET threshold is set as 8. The number of average simulated conflicts for each three-hour
interval (am hours or pm hours) is summarized and compared to the observed conflicts in the field. In
this study, a linear regression model is applied to analyze the relationship between simulated and
observed conflits. Figure 4 shows the regression result of the linear regression model between observed
conflicts and simulated conflicts.

9(12)
Figure 4: Relationship between simulated conflicts and observed conflicts
According to the linear regression results, it is found that the p-value of independent variable is 0.00,
indicating that number of simulated conflicts is significantly associated with the number of observed
conflicts. In addition, the R2 value for the model was 0.8825, which means that 88.25% of the variability
in the observed conflicts can be explained by the variation in the simulated conflicts. For each one
additional unit increase in the number of simulated conflicts, the mean of the observed conflicts is
estimated to increase by 0.84. Although there is a significant statistical relationship between simulated
conflicts and observed conflicts, the number of simulated conflicts estimated by the VISSIM model and
SSAM is less than the number of conflicts observed in the field since the coefficient of x is smaller than
1. One possible explanation is that pedestrians doesn’t adhere to the rules of the traffic signal 100% of
the time in the field and 8.77% of the pedestrians have the illegal behviours such as red light voilation.
The illegal behaviors may increase the conflicts between pedestirans and vehilces. However, pedestrian
must follow the pedestrian signal 100% in the VISSIM simulation model, thus resulting in the simulated
conflicts being lower than the observed conflicts in the field. Consequently, there is a correlation
between simulated conflicts from VISSIM and obseved conflict in the field, however, the VISSIM
model underestimates the pedestrian-vehilce conflicts.
5. SUMMARY AND CONCLUSION In this study, the main purpose was to identify whether the VISSIM and SSAM could estimate the
pedestrian-vehicle conflicts at signalized intersections. First, field data was collected to obtain pedestrian
volume, traffic volume, pedestrian crossing behavior, and pedestrian-vehicle conflicts at seven
signalized intersections in Florida, the United States. Then, the calibrated and valideated the VISSIM
model of seven signalized intersections were tested to simulate each observed hour in the field. SSAM
was used to extract the pedestrian-vehicle conflicts by processing the vehicle trajectory data from the
calibrated and validated the VISSIM model. The mean absolute percent error (MAPE) was used to get
the suitable maximum TTC and PET thresholds for pedestrian-vehicle conflicts. After the SSAM was
calibrated, the simulated conflicts generated by VISSIM and identified by SSAM was compared to the
observed conflicts in the field to find out whether VISSIM and SSAM could provide the reasonable
results for safety assessment at signalized intersections.

10(12)
There were two major findings in this study. First, the suitable maximum TTC and PET thresholds for
pedestrian-vehicle conflicts were found through measuring the differences between the mean PET
observed in the field and the mean PET simulated in VISSIM and SSAM by using the MAPE. According
to the results, it was found that when the maximum TTC and PET threshold were 2.7 and 8 seconds,
respectively, the MAPE was the lowest, indicating that the best goodness-of-fit between simulated
conflicts and observed conflicts. Second, it was found that the number of simulated conflicts was
significantly related to the number of observed conflicts according to the linear regression results.
However, the number of simulated conflicts estimated by VISSIM model and SSAM was less than the
number of conflicts observed in the field based on the regression result, which means the VISSIM model
underestimated the pedestrian-vehicle conflicts.
This study has some limitations. First, the focus of this study was on pedestrian-vehicle conflicts at
signalized intersections in the urban area, not in the CBD or downtown area, which has a huge number
of pedestrians and low traffic volume. Since the pedestrian behavior and driver behavior are quite
different from the present study area, futher research is still needed to expand the study to different type
of areas to help transportation professionals better understand what conditions that the VISSIM and
SSAM can be used to assess the pedestrian safety. Second, the analysis only included the signalized
intersections. Therefore, it is recommended that more types of road facilities (e.g. un-signlaized
intersection and mid-block crossing) should be investigated.
6. ACKNOWLEGEMENT The work reported in this paper is part of an ongoing research project under contract which is sponsored
by the Southeast Region Transportation Center (STC) and the Florida Department of Transportation
(FDOT). The views expressed in this paper do not necessarily reflect those of the sponsors. The authors
would like to thank STC and FDOT for their support.
REFERENCES
Alhajyaseen, W. K. M., Asano, M., and Nakamura, H. (2012). Estimation of left-turning vehicle
maneuvers for the assessment of pedestrian safety at intersections. IATSS Research, vol. 36, no. 1, pp.
66–74.
Almodfer, R., Xiong, S., Fang, Z., Kong, X., and Zheng, S. (2015). Quantitative analysis of lane-based
pedestrian-vehicle conflict at a non-signalized marked crosswalk. Transportation Research Part F:
Traffic Psychology and Behaviour, , http://dx.doi.org/10.1016/j.trf.2015.07.004.
Archer, J. (2005). Indicators for traffic safety assessment and prediction and their application in micro-
simulation modelling: a study of urban and suburban intersections. In: Doctoral Dissertation.
Department of Infrastructure, Division for Transport and Logistic (TOL), Centre for Transport Research,
Royal Insititue of Technology, Stockholm, Sweden.
Cassidy, J. M., Madanat, S. M., Wang, M. and Yang, F. (1995). Unsignalized intersection capacity and
level of service: revisiting critical gap. Transportation Research Record 1484, TRB, National Research
Council, Washington, DC, USA.
Cunto, F. and Saccomanno, F. F. (2008). Calibration and validation of simuilated vehicle safety
performance at signalized intersections. Accident Analysis and Prevention, vol. 40, pp. 1171-1179.
Davis, G.A., Hourdos, J., Xiong, H., Chatterjee, I. (2011). Outline for a causal model of traffic conflicts
and crashes. Accident Analysis & Prevention, vol.43, no.6, pp. 1907-1919.

11(12)
Dijkstra, A., Marchesini, P., Bijleveld, F., Kars, V. (2010). Do Calculated Conflicts in a Micro-
Simulation Model Predicting the Number of Crashes? In Transportation Research Record: Journal of
the Transportation Research Board, No. 2147, Transportation Research Board of the National
Academies, Washington, D.C., pp. 105-112.
Easa, M., and Sayed, T. (2015). Transferability of calibrated microsimulation model parameters for
safety assessment using simulated conflicts. Accident Analysis and Prevention, vol. 84, pp. 41-53.
Fan, R., Yu, H., Liu, P., and Wang, W. (2013). Using VISSIM Simulation Model and Surrogate Safety
Assessment Model for Estimating Field Measured Traffic Conflicts at Freeway Merge Areas. IET
Intelligent Transport Systems, Vol. 7, No. 1, pp. 68-77.
Fatality Analysis Reporting System (FARS). (2012). http://www-fars.nhtsa.dot.gov/ Main/index.aspx
Gettman, D., Head, L. (2003). Documentation of Surrogate Safety Measures from Traffic Simulation
Models. Publication FHWA-RD-03050. FHWA, U.S. Department of Transportation.
Gettman, D., Head, L. (2008). Documentation of Surrogate Safety Assessment Model and Validation.
Publication FHWA-HRT-08-051. FHWA, Department of Transportation.
Haleem, K., Alluri, P., and Gan, A. (2015). Analyzing Pedestrian Crash Injury Severity at Signalized
and Non-signalized locations. Accident Analysis and Prevention, Vol. 81, pp. 14-23.
Hauer, E. (1982). Traffic conflicts and exposure. Accident Analysis and Prevention, vol. 14, no. 5, pp.
359–364.
Huang, F., Liu, P., Yu, H., and Wang, W. (2013). Identifying if VISSIM Simulation Model and SSAM
Provide Reasonable Estimates for Field Measured Traffic Conflicts at Signalized Intersections. Accident
Analysis and Prevention, Vol. 50, pp. 1014-1024.
Lefler, D. E., and Gabler, H. C. (2004). The Fatality and Injury Risk of Light Truck Impacts with
Pedestrians in the United States. Accident Analysis and Prevention, Vol. 36, No. 2, pp. 295-304.
Li, X., Yan, X., Li, X., and Wang, J. (2012). Using Cellular Automata to Investigate Pedestrian Conflicts
with Vehicles in Crosswalk at Signalized Intersection. Discrete Dynamics in Nature and Society, Vol.
2012, Article ID. 287502, pp.1-16.
Mahmassani, H. and Sheffi, Y. (1981). Using gap sequences to estimate gap acceptance functions.
Transportation Research B, vol. 15, no. 3, pp. 143–148.
Mak, K.K., Sicking, D.L. (2003). Roadside safety analysis program (RSAP)-Engineering Manual. In:
National Cooperative Highway Research Program Report 492. Transportation Research Board of the
National Academies, Washington, USA.
Migletz, D., Glauz, W. and Bauer, K. (1985). Relationships between traffic conflicts and accidents.
Report FHWA/RD-84/042, Federal Highway Administration, Washington, DC, USA.
NHTSA. (2014). Documentation of Traffic Safety Facts 2012 Data. Publication DOT HS 811 888.
NHTSA, U.S. Department of Transportation.
Parker, M. R., and Zegger, C. V. (1989). Documentation of Traffic Conflict Techniques for Safety and
Operations Observers Manual. Publication FHWA-IP-88-027, McLean, Va., Federal Highway
Administration.

12(12)
VISSIM 5.10 User Manual. (2008). PTV Planung Transport Verkehr AG, Stumpfstrabe 1, Germany.
Young, W., Sonhani, A., Lenne., M., and Sarvi, M. (2014). Simulation of safety: A review of the state
of the art in road safety simulation modelling. Accident Analysis and Prevention, Vol. 66, pp. 89-103.
Zhang, Y., Liu, S., Qiu, Z., Yao, D., and Peng, L. (2012). Pedestiran-vehicle Conflict Parameter Analysis
and Safety Evaluation. Journal of Harbin Institute of Technology, Vol. 44, No. 12, pp. 123-128.
Zhang, Y., Yao, D., Qiu, T. Z., and Peng, L. (2014). Scene-based Pedestrian Safety Performance Model
in Mixed Traffic Situation. IET Intelligent Transport Systems, Vol. 8, No. 3, pp. 209-218.