Embed Size (px)
Citation preview

PECHAN
FINAL REPORT: Evaluation of PM10 State Implementation Plans and Their Applicability to Visibility Control in Western Class I Areas Prepared for: Lee Alter Western Regional Air Partnership Western Governors’ Association 5210 E Pima St, Suite 110 Tucson, AZ 85712 Prepared by: Stephen M. Roe Ying K. Hsu Huan Ma E.H. Pechan & Associates, Inc. P.O. Box 1345 6245 Pleasant Valley Road El Dorado, CA 95623 and Cassie Archuleta Joe Adlhoch Air Resource Specialists, Inc. 1901 Sharp Point Drive, Suite E Fort Collins, CO 80525 August 5 2005 Contract No. # 04WGA139WRAP Pechan Report No. 05.08.004/9429.000

[This page intentionally left blank.]

PECHAN August 5, 2005
CONTENTS TABLES .................................................................................................................................. iv FIGURES................................................................................................................................. iv ACRONYMS AND ABBREVIATIONS................................................................................. v PREFACE............................................................................................................................... vii I. INTRODUCTION................................................................................................................ 1 II. REVIEW OF AMBIENT MONITORING DATA FOR SELECTED AREAS ................. 6
A. Juneau NAA (AK) .......................................................................................................... 8 B. Phoenix Metro NAA (AZ) .............................................................................................. 8 C. South Coast Air Basin NAA (CA) .................................................................................. 8 D. Mammoth Lakes NAA (CA)........................................................................................... 9 E. Denver Metropolitan NAA (CO)..................................................................................... 9 F. Telluride NAA (CO)........................................................................................................ 9 G. Crested Butte (CO).......................................................................................................... 9 H. Sandpoint NAA (ID)..................................................................................................... 10 I. Boise NAA (ID).............................................................................................................. 10 J. Clark County NAA (NV) ............................................................................................... 10 K. Klamath Falls NAA (OR) ............................................................................................. 10 L. King County (Seattle/Duwamish Valley) NAA (WA).................................................. 10 M. Wallula (Walla Walla Co) NAA (WA)........................................................................ 11 N. Sheridan (WY) .............................................................................................................. 11
III. CONTROL PROGRAM SUMMARY AND COMPARISON TO AMBIENT DATA HISTORY FOR SELECTED AREAS ................................................................................... 12
A. Juneau, Alaska .............................................................................................................. 12 B. Phoenix, Arizona........................................................................................................... 14 C. South Coast Air Basin, California................................................................................. 15 D. Mammoth Lakes, California ......................................................................................... 20 E. Denver Metro, Colorado................................................................................................ 21 F. Telluride, Colorado........................................................................................................ 24 G. Crested Butte, Colorado................................................................................................ 26 H. Boise, Idaho .................................................................................................................. 27 I. Sandpoint, Idaho............................................................................................................. 29 J. Clark County, Nevada .................................................................................................... 32 K. Klamath Falls, Oregon .................................................................................................. 34 L. King County, Washington ............................................................................................. 36 M. Wallula, Washington.................................................................................................... 38 N. Sheridan, Wyoming ...................................................................................................... 40
IV. ASSESSMENT OF THE SUCCESS AND LIMITATIONS OF PM10 PLANS FOR VISIBILITY CONTROL IN THE WRAP REGION ............................................................. 42
A. Applicability of WRAP PM10 SIP Measures and Other Control Measures as Regional Haze Controls...................................................................................................................... 42 B. Examples of How to Use this Report and Related Resources for Two WRAP Class I Areas ................................................................................................................................... 45
1. Yosemite NP, CA................................................................................................ 46 2. Saguaro NP (East), AZ ....................................................................................... 47
Report No. 05.08.004/9429.000 iii Final Report

PECHAN August 5, 2005
V. REFERENCES.................................................................................................................. 52 APPENDIX A. MONITORING DATA SUMMARY CHARTS........................................ A-1 APPENDIX B. TECHNICAL MEMORANDUM #2: TECHNICAL MEMORANDUM, AMBIENT MONITORING DATA CHARTS AND FIGURES..........................................B-1 APPENDIX C. CARB LIST OF PM CONTROL MEASURES..........................................C-1 TABLES Table I-1. Areas Recommended for In-Depth Analysis .......................................................... 4 Table II-1. PM10 Monitoring Summary ................................................................................... 7 Table III-1. RWC Regulatory Program History in Juneau .................................................... 13 Table III-2. Monitoring Summary for RWC Change-Out Program in Crested Butte ........... 27 Table IV-1. Common Source Categories Addressed in WRAP PM10 SIPs .......................... 43 Table IV-2. Relative Visibility Impacts of Primary PM Emissions from Several Source Sectors..................................................................................................................................... 45 FIGURES Figure I-1. Initial PM10 Areas Reviewed in the WRAP Region .............................................. 3 Figure I-2. Final 14 Areas Selected for In-Depth Review....................................................... 5 Figure III-1. 2001 Annual PM10 Concentrations in the SCAB.............................................. 17 Figure III-2. 2001 Annual PM2.5 Concentrations in the SCAB ............................................. 17 Figure III-3. 2004 PM10 Speciation for the SCAB Los Angeles Site .................................... 18 Figure III-4. 2004 PM10 Speciation for the SCAB Rubidoux Site ........................................ 18 Figure III-5. Trends in Sulfate and Nitrate Measured in the SCAB ...................................... 19 Figure III-6. Trends in Annual PM10 Measured at Rubidoux (RIVR) and other SCAB Monitors.................................................................................................................................. 20 Figure III-7. Denver Metropolitan NAA Boundaries and Monitoring Sites ......................... 22 Figure IV-1. 2002 Annual Average Aerosol Extinction at WRAP Class I Areas ................. 49 Figure IV-2. 2002 Aerosol Species Contribution to Extinction at Yosemite NP .................. 50 Figure IV-3. 2002 Aerosol Species Contribution to Extinction at Saguaro NP - East .......... 51
Report No. 05.08.004/9429.000 iv Final Report

PECHAN August 5, 2005
ACRONYMS AND ABBREVIATIONS ADEC Alaska Department of Environmental Conservation ADEQ Arizona Department of Environmental Quality AIR Automobile Inspection and Readjustment ALAPCO Association of Local Air Pollution Control Officials AoH Attribution of Haze AQCC Colorado Air Quality Control Commission AQMP Air Quality Management Plan AQS Air Quality System ARS Air Resource Specialists, Inc. BACM best available control measures BACT best available control technology BMP best management practice CAA Clean Air Act CAAA Clean Air Act Amendments CARB California Air Resources Board CBJ City and Borough of Juneau CDPHE Colorado Department of Public Health and Environment CFR Code of Federal Regulations CM coarse mass CMAQ Congestion Mitigation and Air Quality (Program) CMB chemical mass balance CO carbon monoxide EC elemental carbon EDMS Emission Data Management System EPA United States Environmental Protection Agency FIP Federal Implementation Plan GBUAPCD Great Basin Unified Air Pollution Control District GCVTC Grand Canyon Visibility Transport Commission I/M inspection and maintenance IDEQ Idaho Department of Environmental Quality ITD Idaho Transportation Department MAGs Maricopa Association of Governments μg/m3 micrograms per cubic meter MSM most stringent measures N/A not applicable NAA nonattainment area NAAQS National Ambient Air Quality Standards NAMS National Air Monitoring Stations NEAP Natural Events Action Plan NO3 nitrate NOV Notice of Violation NOx oxides of nitrogen NPS National Park Service OC organic carbon
Report No. 05.08.004/9429.000 v Final Report

PECHAN August 5, 2005
ODEQ Oregon Department of Environmental Quality ODOT Oregon Department of Transportation OM organic matter Pechan E.H. Pechan & Associates, Inc. PM10 particulate matter with an aerodynamic diameter of 10 microns or less PM2.5 particulate matter with an aerodynamic diameter of 2.5 microns or less PSAPCA Puget Sound Air Pollution Control Agency PURE Particulate Urban Resources Effort RWC residential wood combustion RACM reasonably available control measures RACT reasonably available control technology SCAB South Coast Air Basin SCAQMD South Coast Air Quality Management District SIHD Sandpoint Independent Highway Department SIP state implementation plan SLAMS State and Local Air Monitoring Stations SO2 sulfur dioxide SO4 sulfate STAPPA State and Territorial Air Pollution Program Administrators SWMP Sanding Winter Maintenance Program TAR Tribal Authority Rule TEOM Tapered Element Oscillating Microbalance TIP Tribal Implementation Plan TM Technical Memorandum TSP total suspended particulate UGB urban growth boundary VMT vehicle miles traveled VOC volatile organic compound WRAP Western Regional Air Partnership WYDEQ Wyoming Department of Environmental Quality
Report No. 05.08.004/9429.000 vi Final Report
PECHAN August 5, 2005
PREFACE Tribal Participation in the Western Regional Air Partnership (WRAP) Tribes, along with states and federal agencies, are full partners in the WRAP, having equal representation on the WRAP Board as states. Whether Board members or not, it must be remembered that all tribes are governments, as distinguished from the “stakeholders” (private interest) which participate on Forums and Committees but are not eligible for the Board. Despite this equality of representation on the Board, tribes are very differently situated than states. There are over four hundred federally recognized tribes in the WRAP region, including Alaska. The sheer number of tribes makes full participation impossible. Moreover, many tribes are faced with pressing environmental, economic, and social issues, and do not have the resources to participate in an effort such as the WRAP, however important its goals may be. These factors necessarily limit the level of tribal input into and endorsement of WRAP products. The tribal participants in the WRAP, including Board members Forum and Committee members and co-chairs, make their best effort to ensure that WRAP products are in the best interest of the tribes, the environment, and the public. One interest is to ensure that WRAP policies, as implemented by states and tribes, will not constrain the future options of tribes who are not involved in the WRAP. With these considerations and limitations in mind, the tribal participants have joined the state, federal, and private stakeholder interests in approving this report as a consensus document. The Regulatory Framework for Tribal Visibility Implementation Plans The Regional Haze Rule explicitly recognizes the authority of tribes to implement the provisions of the Rule, in accordance with principles of Federal Indian law, and as provided by the Clean Air Act (CAA) §301(d) and the Tribal Authority Rule (TAR) (40 Code of Federal Regulations (CFR) §§49.1– .11). Those provisions create the following framework: 1. Absent special circumstances, reservation lands are not subject to state jurisdiction. 2. Federally recognized tribes may apply for and receive delegation of federal authority to
implement CAA programs, including visibility regulation, or “reasonably severable” elements of such programs (40 CFR §§49.3, 49.7). The mechanism for this delegation is a Tribal Implementation Plan (TIP). A reasonably severable element is one that is not integrally related to program elements that are not included in the plan submittal, and is consistent with applicable statutory and regulatory requirements.
3. The Regional Haze Rule expressly provides that tribal visibility programs are “not
dependent on the strategies selected by the state or states in which the tribe is located” (64. Fed. Reg. 35756), and that the authority to implement §309 TIPs extends to all tribes within the Grand Canyon Visibility Transport Commission (GCVTC) region (40 CFR §51.309(d)(12).
Report No. 05.08.004/9429.000 vii Final Report

PECHAN August 5, 2005
4. The United States Environmental Protection Agency (EPA) has indicated that under
the TAR tribes are not required to submit §309 TIPs by the end of 2003; rather they may choose to opt-in to §309 programs at a later date (67 Fed. Reg. 30439).
5. Where a tribe does not seek delegation through a TIP, EPA, as necessary and
appropriate, will promulgate a Federal Implementation Plan (FIP) within reasonable timeframes to protect air quality in Indian country (40 CFR §49.11). EPA is committed to consulting with tribes on a government to government basis in developing tribe-specific or generally applicable TIPs where necessary (See, e.g., 63 Fed. Reg. 7263-64).
It is our hope that the [finding and recommendations of this product] will prove useful to tribes, whether they choose to submit full or partial 308 or 309 TIPs, or work with EPA to develop FIPs. We realize that the amount of modification necessary will vary considerably from tribe to tribe. The authors have striven to ensure that all references to tribes in the document are consistent with principles of tribal sovereignty and autonomy as reflected in the above framework. Any inconsistency with this framework is strictly inadvertent and not an attempt to impose requirements on tribes which are not present under existing law.
Report No. 05.08.004/9429.000 viii Final Report

PECHAN August 5, 2005
I. INTRODUCTION This report was prepared by E.H. Pechan & Associates, Inc. (Pechan) and Air Resource Specialists, Inc. (ARS) for the Western Regional Air Partnership’s (WRAP’s) Sources In and Near Class I Areas Forum (the Forum). The purpose of the report is to identify and evaluate historically successful efforts to reduce ambient particulate matter in PM10 (particulate matter with an aerodynamic diameter of 10 microns or less) nonattainment areas (NAAs), which may be applicable to controlling visibility-impairing emissions at or near Federal and Tribal Class I areas. In short, the analysis steps involved evaluation and classification of PM10 state implementation plans (SIPs); analysis of ambient PM10 trends; interviews with state, federal, and local officials intimately familiar with the development and implementation of each SIP; and a limited attempt to qualitatively extrapolate these empirical findings to potential application at Class I areas. The details of the procedure are as follows: 1. Identify all current and former PM10 NAAs in the WRAP region: the list of 69 areas
presented in Technical Memorandum #1 (TM#1; see Appendix A) included both current NAAs and maintenance areas. Two more areas that are in attainment of the PM10 standards were also identified for review in the project (Albuquerque, NM and Crested Butte, CO; see TM#2 in Appendix B). All of the identified areas are shown in Figure I-1 below;
2. Identify a subset of PM10 areas for initial review: in TM#1, 25 areas were identified
for further review based on interviews with U.S. Environmental Protection Agency (EPA) regional staff and state agency staff. These 25 candidate areas were recommended as areas that could provide information to satisfy the goals of the project (see Appendix A for more details);
3. Select a smaller subset of areas for in-depth review: in TM#2, 14 of the 25 areas
identified in TM#1 were selected for further review. These 14 recommended areas were selected based on a number of criteria, including significant negative ambient PM10 trends, geographic location (to achieve adequate coverage across the region), NAA category (as defined in TM#1; differentiates areas impacted by different source types), and PM10 planning season (winter versus other season PM issues). Table I-1 provides a summary of the criteria used to select the final 14 areas. Figure I-2 provides a map of these 14 recommended areas. TM#2 in Appendix B provides information on each candidate area and details on the selection of recommended areas;
4. Characterize the ambient monitoring data for each recommended area: Section II of
this report provides an analysis of the ambient monitoring data for each recommended area, where available; and
5. Describe the control measures associated with PM10 reductions in each area: this
objective is covered in Section III of this report. In addition to describing the applicable measures, implementation and enforcement issues that were encountered by the state or local agency are investigated. Implementation and enforcement issues are
Report No. 05.08.004/9429.000 1 Final Report

PECHAN August 5, 2005
Report No. 05.08.004/9429.000 2 Final Report
particularly important in the context of applying certain measures in the often small and remote communities in and near Class I areas;
6. Explore control measure transfer opportunities between PM10 programs and regional
haze programs: this is the topic of Section IV of this report. In this section of the report, information from the previous tasks is synthesized to provide examples of successful PM10 reduction programs that are likely to be beneficial in reducing visibility-impairing pollutants. A number of control measure reference sources are also provided that cover both primary and secondary PM sources.

PECHAN August 5, 2005
California
Arizona
Oregon
San Joaquin Valley
South CoastAir Basin
San Bernardino
Olympia, Tumwater, Lacey
Fort Hall Reservation
Utah
Clark
Medford-Ashland
Yuma
Mono Basin
Boise
Sandpoint
Pinehurst
Columbia FallsWhitefish
KalispellPolson
Ronan
Libby
Thompson Falls
LaGrande
Eugene-Springfield
LakeviewKlamath Falls
Grants Pass
DouglasPaul Spur
KentTacoma
Yakima
Wallula
Spokane
ButteLame Deer
Trona
Sheridan
Yavapai-Apache
Fort Peck
Flathead
Spokane
Northern Cheyenne
Montana
Imperial Valley
Coachella Valley
Indian Wells
Utah
Idaho
NevadaColorado
Wyoming
Texas
New Mexico
Washington
Nebraska
North Dakota
South Dakota
Kansas
Oklahoma
Ajo
Reno
Ogden
Lamar
Aspen
Hayden
Payson
Nogales
Phoenix
Missoula
Telluride
Canon CitySacramento
Denver Metro
Owens Valley
Crested Butte
Mammoth Lakes
Coso Junction
Bullhead City
Pagosa Springs
Steamboat Springs
AnthonyRillito
Salt Lake
Eagle RiverJuneau
Alaska
NAA Town/City
Counties Containing NAAs
Maintenance Area
Moderate
Serious
Class I Areas
Tribal Class I Areas
Multi-County NAAs
E.H.Pechan & Associates, IncPrepared by M.Ma
June, 2005
Figure I-1. Initial PM10 Areas Reviewed in the WRAP Region
Report No. 05.08.004/9429.000 3 Fianl Report

PECHAN August 5, 2005
Table I-1. Areas Recommended for In-Depth Analysis
PM10 Area State PM10 Designation NAA Categorya
Planning Season Commentsb
Juneau AK Moderate Lim. Anthro. Source
Winter Strong negative ambient trends show effectiveness of unpaved road and residential wood combustion (RWC) controls (primary sources of PM10). Small city to rural land use.
Phoenix AZ Serious Urban Spring-Summer Most sites do not show negative PM10 trends; however, the area is a rich source for recent control measure information. Fugitive dust sources (especially construction) dominate. Large city land use.
Los Angeles (South Coast Air Basin)
CA Serious Urban Summer Decreasing ambient trends at most sites; only area to look at both primary and secondary PM measures; complex mixture of urban sources; Large city land use.
Mammoth Lakes CA Maintenance Area Lim. Anthro. Source
Winter Negative ambient trends; RWC and paved road dust are primary sources targeted by controls; Resort town land use.
Denver Metro CO Maintenance Area Urban Winter Negative trends in 99th percentile at 6 of 17 sites; only 1 in 17 shows negative annual avg. trend; RWC, paved road dust, vehicles, and industrial sources are the most important and subject to control programs. Large city land use.
Telluride CO Maintenance Area Lim. Anthro. Source
Winter Negative ambient trends both in 99th percentile and annual average. Paved road dust and RWC important sources being controlled. Resort town land use.
Crested Butte CO Attainment n/a Winter In 1 of 3 monitors, 24-hr trend is increasing; all other indicators show negative trends. Special study conducted in 1990 on the efficiency of an RWC change-out program.
Boise ID Maintenance Area Urbanized Winter PM10 concentration trends are negative. Another example of success achieved in a more urbanized area.
Bonner (Sandpoint) ID Moderate Lim. Anthro. Source
Winter Strong negative 99th percentile and annual trends. RWC and paved road dust were the primary sources controlled.
Clark County NV Serious Lim. Anthro. Source
Spring-Summer 9 of 18 monitors show negative 99th percentile trends; 3 of 18 show negative annual trends. This area is a good source of information on implementing fugitive dust controls in rapidly growing areas.
Klamath Falls OR Maintenance Area Lim. Anthro. source
Winter Significant negative ambient PM10 trend shows effectiveness of control programs.
King County WA Maintenance Area Complex Source
Winter Strong negative ambient trends at nearly all sites.
Wallula WA Serious Lim. Anthro. Source
Spring-Summer No decreasing trends; also recent 24-hr exceedances; however, it might be an area with information on agricultural tilling controls.
Sheridan WY Moderate Lim. Anthro. Source
Winter Negative ambient trends (both annual and 99th percentile); good area to establish effectiveness of paved road dust controls.
a See TM#1 (Appendix A) for a description of the NAA categories. Most of the WRAP areas were categorized as limited anthropogenic source-driven areas. b TM#2 (Appendix B) provides details on the initial review of ambient data used to assist in the selection of these 14 recommended areas.
Report No. 05.08.004/9429.000 4 Fianl Report

N August 5, 2005
Report No. 05.08.004/9429.000 5 Fianl Report
California
Arizona
Oregon
South CoastAir Basin
Clark County
Boise
Sandpoint
Klamath Falls
King County
Wallula
Sheridan
Montana
Texas
Utah
Idaho
NevadaColorado
Wyoming
New Mexico
Washington
Nebraska
Kansas
North Dakota
South Dakota
Oklahoma
Phoenix
Telluride
Denver Metro
Crested Butte
Mammoth Lakes
Juneau
Alaska
Recommended Areas
Class I Areas
Tribal Class I Areas
E.H.Pechan & Associates, IncPrepared by M.Ma
June, 2005
Figure I-2. Final 14 Areas Selected for In-Depth Review
PECHA

PECHAN August 5, 2005
Report No. 05.08.004/9429.000 6 Final Report
II. REVIEW OF AMBIENT MONITORING DATA FOR SELECTED AREAS
Charts indicating seasonal averages, annual averages, and 24-hour 99th percentile for PM10 at each representative monitor for each NAA are included in Appendix A. Representative PM10 monitors were selected in consultation with EPA Regional and State Agency contacts, or were determined to be monitors within the NAA that had the most years of available data. The top charts indicate seasonal averages (micrograms per cubic meter (μg/m3)) for each year, where the winter season is an average of data from December through February (December is from the previous calendar year), spring is March through May, summer is June through August and fall is September through November. Seasonal averages were only calculated if at least 75 percent of all possible data were collected. Trends for each season for the entire span of years are indicated in the legend with a slope value (μg/m3/yr). Slopes are Theil slopes, and a p-value is calculated using Mann-Kendall trend analysis to determine the significance level of each slope. A trend line corresponding to the respective planning season is also included on the seasonal average chart. The second chart contains the annual average (μg/m3) for each site and for each year. Annual averages are calculated as an average of quarterly averages, and are only calculated if all 4 quarterly averages are available, where each quarter’s average includes at least 75 percent of possible data. The quarterly averages (Jan.-Mar., Apr.-Jun., Jul-Sept., and Oct.-Dec.) are not the same as seasonal averages, so the annual averages do not correspond to the averages of the 4 seasonal bars in the top plot. The third chart contains the 24-hour 99th percentile values for each year. For each site, the hypothesis was made that the long-term record of planning season averages could be split into two statistically different time periods, potentially corresponding to a single physically significant decrease in PM10 concentrations (i.e., corresponding to the implementation of SIP measures). In reality, many factors affect the seasonal PM10 trends and more than two populations may be needed to best describe some sites’ long-term trends. Changes which affect seasonal PM10 trends may also do so over the course of several years, thus making a distinct break point non-existent. For each site, all possible combinations of two populations were identified and population averages and 95 percent confidence intervals (using the student’s t-test) were calculated. If statistically significant time period splits existed, the split which yielded the largest difference between population means was considered a possible division point that may be related to implementation of various PM control measures. If a split was determined, it is indicated by vertical lines on the seasonal average charts with the average of each site’s planning season averages, and the confidence interval indicated on either side of the line. Table II-1 provides monitoring statistics for data that are represented in the charts in Appendix A for the representative samplers in each NAA. The Annual Trend columns indicate the slope and p-value for the annual averages for all available years. The Planning Season Trend columns indicate the planning season and the slope and p-value for those seasonal averages. The columns for Period 1 and Period 2 indicate the period of coverage and the averages and 95 percent

N August 5, 2005
Report No. 05.08.004/9429.000 7 Final Report
Table II-1. PM10 Monitoring Summary
Annual Trend Planning Season Trend Period 1 Period 2
NAA State Sampler Slope (μg/m3/yr)
P-Value Season Slope
(μg/m3/yr) P-
Value Years Avg. (μg/m3)
CI (95%) Years Avg.
(μg/m3) CI
(95%)
Juneau AK 02-110-0004 -1.0 <0.01 Winter -1.4 <0.01 1987-
1997 27.2 4.0 1998-2004 10.2 1.2
Phoenix AZ 04-013-3002 -1.2 <0.01 Summer -1.1 0.01 1986-
1989 52.8 4.9 1991-2004 38.5 3.5
West CA 06-037-1103 -1.5 <0.01 Summer -1.1 <0.01 1987-
1992 53.7 5.4 1993-2004 40.6 2.5 Los
Angeles East CA 06-065-8001 -1.6 <0.01 Summer -2.0 <0.01 1987-
1989 109.0 20.8 1990-2004 74.8 4.4
Mammoth Lakes CA 06-051-0001 -1.3 <0.01 Winter -2.1 <0.01 1986-
1992 46.5 11.4 1993-2004 27.9 3.7
Denver CO 08-031-0002 -0.2 0.25 Winter -0.7 0.03 N/A N/A
Telluride CO 08-113-0004 -1.6 <0.01 Winter -2.4 <0.01 1991-
1996 36.3 10.0 1997-2004 15.2 3.3
Crested Butte CO 08-051-0004 -0.4 <0.01 Winter -1.7 <0.01 1986-
1992 46.5 11.4 1993-2004 27.9 3.7
Bonner (Sandpoint) ID 16-017-0001 -0.8 <0.01 Winter -1.9 <0.01 1987-
1994 42.0 4.6 1995-2001 19.7 3.6
Boise ID 16-001-0011 -0.8 <0.01 Winter -1.9 <0.01 1987-
1995 42.3 6.1 1996-2004 22.3 2.6
Clark County NV 32-003-2001 0.1 0.46 Summer -0.3 0.18 N/A N/A
Klamath Falls OR 41-035-0004 -2.8 <0.01 Winter -5.2 <0.01 1986-
1991 120.7 45.7 1992-2004 32.3 6.5
King County WA 53-033-0057 -1.5 <0.01 Winter -2.6 <0.01 1985-
1995 52.4 10.7 1996-2003 27.2 4.9
Wallula WA 53-071-1001 -1.0 0.03 Spring -1.4 <0.01 1986-
1993 42.1 9.3 1994-2003 26.5 4.8
Sheridan WY 56-033-0002 -0.9 <0.01 Winter -1.8 <0.01 1986-
1995 51.5 7.1 1996-2004 31.8 3.4
PECHA

PECHAN August 5, 2005
confidence interval for the planning seasons in those years. If there were no statistically different averages for any two periods of time, these period averages are indicated as not applicable (N/A). Following the table are brief descriptions of monitoring data observations for each area. Each description includes a qualitative assessment of the data presented in the Appendix A charts, including characteristics on either side of any statistically determined time period splits and any anomalous data.
A. Juneau NAA (AK) The primary PM10 monitoring site in the Juneau area is located on the roof of Floyd Dryden Middle School (Air Quality System (AQS) ID 02-110-0004). All seasonal, annual and 24-hour 99th percentile averages indicate decreasing trends in PM10, with the winter season decreasing the most (slope of -1.4 μg/m3/yr). With a statistically significant break point between 1997 and 1998, the winter averaged 83 percent higher than the other seasonal averages through 1997, and 28 percent higher after 1997. Anomalous years included relatively low winter seasons in 1990 and 1994, and a high fall seasonal average in 1986 and 1991. B. Phoenix Metro NAA (AZ) PM10 data collected at the central Phoenix station, located at 1845 E. Roosevelt St.(AQS ID 04-013-3002), showed decreasing trends for all averages. During the Spring-Summer planning seasons, the spring showed a decline of -0.7 μg/m3/yr and the summer a decline of -1.1 μg/m3/yr. A statistically significant break point for the summer season was indicated between 1989 and 1991, with the summer averaging 52.8 ± 4.9 μg/m3 before 1990 and 38.5 ± 3.5 after 1990. Monitoring data were also reviewed for two other Maricopa County monitoring sites: Buckeye and Chandler. Buckeye was identified as a representative monitoring site for agricultural areas in Maricopa County, however it was established in 2004, so no historical record has been established. Chandler was identified as a site representative of Maricopa County areas impacted by construction activity. Monitoring data were available back to 1990. No significant trends were seen at this site, and the summer season average trend line was actually increasing over the period of 1990-2003. C. South Coast Air Basin NAA (CA) For the South Coast Air Basin, a monitor in Los Angeles (AQS ID 06-037-1103) was chosen to represent the west side of the basin, and the monitor in Rubidoux (AQS ID 06-065-8001) was chosen to represent the east side. The Los Angeles monitor is located at 1630 Main St (Los Angeles County). Again, all seasonal averages showed statistically significant decreasing trends, with the steepest decline in the fall (slope of -2.0 μg/m3/yr). During the summer planning season, a decrease of -1.1 μg/m3/yr was observed. A statistically significant break point was determined between 1992 and 1993, with the highest summer averages were through 1992 averaging of 53.7 ± 5.4 μg/m3, and 40.6 ± 2.5 after 1992.
Report No. 05.08.004/9429.000 8 Final Report

PECHAN August 5, 2005
The Rubidoux monitor is located at 5888 Mission Boulevard (Riverside County). All averages showed statistically significant decreasing trends, with fall averages decreasing the most (slope of -3.2 μg/m3/yr). For the summer planning season, a decrease of -2.0 μg/m3/yr was indicated. A statistically significant break point for the summer was determined between 1989 and 1990, with summer averaging 109.0 ± 20.8 μg/m3 through 1989, and averaging of 74.8 ± 4.4 after 1989. D. Mammoth Lakes NAA (CA) Data between 1987 and 2004 were collected for the Mammoth Lakes PM10 monitor located at Gateway Headquarters (AQS ID 06-051-0001). All seasonal, annual and 24-hour 99th percentile averages show decreasing trends, with PM10 at the station being dominated by the winter season, which averaged 132 percent higher than the other seasons. A statistically significant break point was found in the Mammoth Lakes data set for the winter planning season between the pre- and post-1993 periods. The winter season averages in the post-1993 period were about 40 percent lower than the 1986-1992 time-frame. E. Denver Metropolitan NAA (CO) The site with the longest history in the Denver metropolitan area is the downtown CAMP station, located at 2105 Broadway (AQS ID 08-031-0002). PM10 at the station was dominated by the winter season average between 1987 and 1995, with the winter season averaging about 58 percent higher than the other seasons through 1995 and averaging only 3 percent higher after 1995. Anomalously high winter seasons occurred in 1987 and 1993. The winter season was the only season with a statistically significant decreasing trend between 1987 and 2004, with a slope of -0.7 μg/m3/yr. F. Telluride NAA (CO) Monitoring for PM10 in Telluride began in 1985, but the original site was discontinued and relocated to the 333 W. Colorado location in June 1990 (AQS ID 08-113-0004). All averages showed statistically significant decreasing trends, with the winter season decreasing the most with a slope of -2.4 μg/m3/yr. The highest seasonal averages were recorded in winter of 1991 and 1992 and spring of 1993 and 1994. A statistically significant break point was determined between 1996 and 1997 at the Telluride site, with winter seasons averaging 36.3 ± 10.0 μg/m3 through 1996, and 15.2 ± 3.3 after 1996. While the winter season averages did not necessarily dominate the other seasonal averages through 1996, they averaged 9 percent higher than the other seasons through 1996 and 34 percent lower than the average of the other seasons after 1996. G. Crested Butte (CO) For the PM10 sampler located at Colorado 135 and Whiterock lane (AQS ID 08-051-0004), the winter seasonal average of PM10 in Crested Butte showed a significant decreasing trend between 1985 and 2004, with a slope of -1.7 µg/m3/yr. A statistically significant break point was determined between 1992 and 1993. The winter season average through 1992 was 46.5 ± 11.4 μg/m3 and 27.9 ± 3.7 after 1993. Through 1992, the winter average generally dominates the seasonal averages, with winter averages ~60 percent higher than the average of the other seasons,
Report No. 05.08.004/9429.000 9 Final Report

PECHAN August 5, 2005
and about 8 percent lower than the other seasons after 1992. Beginning in 1994, the spring season (March – May) begins to dominate the seasonal averages. H. Sandpoint NAA (ID) Monitoring at the Sandpoint Post Office (AQS ID 16-017-0001) began in January, 1986 and data were collected through 2001. All seasons, with the exception of the summer, showed statistically significant decreasing trends (significance level of 98 – 99 percent), and the winter averages declined the most, with slope of -2.5 μg/m3/yr. A statistically significant break point for the winter planning season was determined between 1994 and 1995 with winter averaging 42.0 ± 4.6 μg/m3 through 1994, and, after 1995, the winter averaging 19.7 ± 3.6 μg/m3. I. Boise NAA (ID) PM10 monitoring at the Mountain View School in Boise (AQS ID 16-001-0011) began in 1985 and was collected through 2004. All averages, with the exception of the summer seasonal average, showed statistically significant decreasing trends (significance level of 98 – 99 percent). PM10 trends for the winter planning season showed the steepest decline, with a slope of -1.9 μg/m3/yr. A statistically significant break point was determined between 1995 and 1996, with winter averaging 42.3 ± 6.1 μg/m3 through 1995 (approximately 64 percent higher than an average of the other seasons). After 1995, the winter averaged 22.3 ± 2.6 μg/m3 (about 1 percent lower than the other seasons), and the summer begins to dominate the seasonal averages. J. Clark County NAA (NV) In Clark County, the monitor at 1301 E. Lake Mead Dr. in North Las Vegas (AQS ID 32-003-2001), had the most complete data set between 1985 and 2004. The summer showed the most statistically significant decreasing trend, with a slope of -0.3 μg/m3/yr at an 82 percent significance level (p-value = 0.18). The winters of 1990 and 1991 were the highest recorded seasonal averages. K. Klamath Falls NAA (OR) The monitor at Peterson Elementary in Klamath Falls (AQS ID 41-035-0004) indicated decreasing trends between 1986 and 2004 for all averages. The winter and fall dominate the seasonal averages, with the winter showing the most dramatically decreasing slope (-5.2 μg/m3/yr). A statistically significant break point was determined between 1991 and 1992. Through 1991, the winter planning season averaged 120.7 ± 45.7 μg/m3, and after 1991, the winter averaged 32.3 ± 6.5 μg/m3. L. King County (Seattle/Duwamish Valley) NAA (WA) For King county, representative PM10 monitoring data were collected at the Duwamish Pumping Station in Seattle (AQS ID 53-033-0057). The monitor indicated decreasing trends between 1985 and 2003 for all averages. The winter season was highest in 1985 and 1986, with a decreasing slope of -2.6 μg/m3/yr through 2003. A statistically significant break point was
Report No. 05.08.004/9429.000 10 Final Report

PECHAN August 5, 2005
determined between 1995 and 1996, with winter averaging 52.4 ± 10.7 μg/m3 through 1995 (approximately 51 percent higher than the other seasonal averages), and 27.2 ± 4.9 μg/m3 after 1995 (9 percent higher than the other seasonal averages). M. Wallula (Walla Walla Co) NAA (WA) Since 1986, the monitoring network for the Wallula NAA has consisted of a single monitoring site, referred to in EPA’s AQS database as the Nedrow Farm/Wallula Junction monitoring site (AQS ID 53-071-1001). This monitoring site was discontinued in 2003. Between 1986 and 2003, the winter, spring, fall and annual averages, showed statistically significant decreasing trends (significance level of >97 percent). The summer season dominates the season averages, and showed a decreasing trend at only 83 percent significance level. For the spring planning season, a decreasing slope of -1.4 μg/m3/yr was indicated with a statistically significant break point determined between 1993 and 1994. The spring averaged 42.1 ± 9.3 μg/m3 through 1993, and 26.5 ± 4.8 after 1993. N. Sheridan (WY) In Sheridan, Wyoming, the primary PM10 monitor is located on the roof of Sheridan Police department building at 45 West 12th Street (AQS ID 56-033-0002). Between 1985 and 2004, the winter, spring, and fall averages, and 24-hour 99th percentile values showed statistically significant decreasing trends (significance level of >99 percent). The summer season showed a slightly decreasing trend at only a 80 percent significance level (p-value = 0.20). The winter season averages were decreased the most, with a slope of -1.8 μg/m3/yr. A statistically significant break point for the winter planning season occurs between 1995 and 1996, with winter averaging 51.5 ± 7.1 μg/m3 through 1995 and 31.8 ± 3.4 after 1995.
Report No. 05.08.004/9429.000 11 Final Report
PECHAN August 5, 2005
III. CONTROL PROGRAM SUMMARY AND COMPARISON TO AMBIENT DATA HISTORY FOR SELECTED AREAS
This section provides details on the PM10 control measures implemented in the areas selected for detailed analysis. A description of each of these areas is provided in TM#2 (see Appendix B). These descriptions include information on the setting, important PM10 sources, and the control measures implemented. For areas where a sufficient discussion of control measures was too lengthy for this report, links and references to sources of control program information are provided. At the end of each PM10 area description, a comparison is made between the ambient monitoring data provided in Section II and the control program history described in this section. A. Juneau, Alaska The Mendenhall Valley Airshed is located within the boundaries of the City and Borough of Juneau. The airshed consists of 12,000 acres and is the largest residentially-developed area in the region. The Mendenhall Valley is bordered to the east and west by steep ridges that rise more than 1,000 feet above the valley. Both climate and topography lead to stagnant conditions during the winter, when concentrations of PM10 increase. Exceedances of the 24-hr standard have also occurred during the Spring thru Fall period during dry periods with high winds. The area was designated as a moderate PM10 NAA upon enactment of the 1990 CAA Amendments (CAAA). The Alaska Department of Environmental Conservation (ADEC) submitted a revised PM10 SIP in 1993 (ADEC, 1993). The Mendenhall Valley Control Plan focused on residential wood combustion (RWC) and sources of fugitive dust (both paved and unpaved roads). Efforts to reduce ambient PM levels from RWC emissions began as early as 1982, when the first state regulations were adopted requiring a 75 percent opacity standard during announced air alerts. For the next 10 years, the RWC program became more rigorous and included both state and city regulatory efforts. These are summarized in Table III-1 (ADEC, 1993). Enforcement of the RWC program was initially performed by two City and Borough of Juneau (CBJ) canine control officers (trained in opacity readings). However, in 1986, enforcement was transferred to the police department. ADEC noted that the advantages of having the police enforce the program included: a 24-hr dispatcher to handle complaints; police are trained to deal with potentially belligerent people; and there are many more police staff available to enforce the program. The main disadvantage is that the RWC program is obviously the lowest enforcement priority for the police. For the 1992/93 season, CBJ hired two woodsmoke enforcement officers to supplement enforcement of the program. Penalties associated with the program include: $100 for the first offense for burning during an air episode, mandatory court appearance for the second offense; $100 for excessive smoke density or open burning out of season, $300 for second offense (excessive smoke density penalties were later amended to $50 and $75 for first and second offenses). ADEC (1993) noted that in the early years of the program, warning citations were issued to gain public support.
Report No. 05.08.004/9429.000 12 Final Report

PECHAN August 5, 2005
Table III-1. RWC Regulatory Program History in Juneau
Date Control Element
Summer 1982 State regulations adopted; 75 percent opacity standard during announced air alerts.
Summer/Fall 1983
State and city regulations adopted; RWC control area established; 50 percent opacity limit for all periods; no open burning November–March; air emergency shuts down all devices; air emergency level set at 260 µg/m3 total standard particulate (TSP); 2-year waiver to replace wood as sole heat source in homes.
Fall 1984 City reduces air emergency level to 150 µg/m3.
Fall 1986
City ordinance revised; 2-stage episode plan adopted; air alerts shut down all but Class I stoves; Class I stoves must meet State of Oregon certification limits (6 grams/PM-hr); Class I stoves must meet 10 percent opacity during alerts and have a permit; air emergencies shut down all devices; air alert level set at 100 µg/m3 TSP; air emergency level set at “anticipated to exceed 100µg/m3” following an alert.
Fall 1988
City ordinance revised for PM10; air alert level set at 92 µg/m3 PM10; air emergency level set at >92µg/m3 PM10 following an air alert; woodstove emission limit set at the New Source Performance Standard (NSPS) limit.
Winter 1992 City ordinance revised for PM10; air alert set at 75 µg/m3 PM10; fines for violations of ordinance increased; Class I woodstove permits set to expire 7/1/97 (owner must reapply for a new permit).
Additional local ordinances adopted by the CBJ that helped to lower RWC activity included building standards (insulation, window area); wood stoves were not allowed to be the sole source of heat; and backup systems were required that could heat a home to 70 degrees Fahrenheit. ADEC notes that there has been a shift away from the use of woodstoves toward the use of oil burning equipment (Edwards, 2005). For high PM event days in the 1990-1992 time-frame, ADEC identified unpaved roads as being the dominant contributor. These days were characterized by a lack of snow cover and higher than normal winds (late Spring thru early Fall). During their design day analyses, ADEC estimated that unpaved roads contributed over 90 percent of the measured PM (ADEC, 1993). ADEC estimated that about 27 of the 47 road miles in the Mendenhall Valley were unpaved. About 16 of these unpaved road miles were located in the eastern half of the valley and thought to be contributing significantly to PM10 exceedances. About 4 miles of these roadways were paved during 1991 and 1992. A large portion of the remaining roadways were to be paved during 1993 and 1994 (ADEC, 1993). The rest of the unpaved roadways in the eastern half of the valley are believed to have been paved by about 1996 (Edwards, 2005a). Federal funding from the Congestion Mitigation and Air Quality (CMAQ) Program was important in getting the road projects completed. For paved road dust, various programs have been investigated over the years including the use of deicers, better street sweeping, and better road sanding materials. However, there have not been
Report No. 05.08.004/9429.000 13 Final Report

PECHAN August 5, 2005
any programs that are thought to have resulted in significant PM10 emission reductions (Edwards, 2005a). Comparison of Control Program and Ambient Data History. The ambient data provided in Section II and Appendix A show significant negative trends in winter season average, annual average and 24-hr 99th percentile concentrations. Although not shown in the summary chart, significant reductions also appear to be occurring in the other seasons (Juneau historically experienced exceedances in different seasons). Reductions in the non-winter seasons are thought to be attributable to the road paving projects that occurred between 1991 and 1996. The difference in winter season concentrations in the post-1997 time-frame appears to be attributable to a combination of the RWC, unpaved road dust programs, and climate differences in recent years (milder winters). ADEC noted that the PM10 events have always been episodic and dependent on cold, dry weather in the winter (resulting in inversions) and dry weather with high winds (resulting in windblown dust). This could have resulted in lower sanding material use as well as fewer dry cold days to trap RWC emissions (Edwards, 2005a). Paving unpaved roads in the mid-1990s should have reduced the number of windblown dust events, and they should be of smaller magnitude. There was also a soccer field at the school which was within proximity to the monitor that was surfaced with some sort of artificial turf material around that 1998 timeframe. That would have reduced a local fugitive dust source near the monitor (Edwards, 2005a). Another contributor to recent downward trends in ambient PM is a movement away from wood burning for space heating in the area. The ADEC conducted a residential heating survey in Juneau’s Mendenhall Valley last year that shows that the percentage of homes with wood heating devices is declining and that many homes no longer burn wood. Oil-burning space heating equipment seems to be replacing woodstoves. B. Phoenix, Arizona The Phoenix Planning Area was designated as a moderate PM10 area in 1990. The initial SIP was submitted in 1991 and revised in 1993 and 1994. The area was reclassified as a serious PM10 area in 1996. In 1997, the Arizona Department of Environmental Quality (ADEQ) submitted a final plan covering attainment of the 24-hr standard for moderate PM10 areas (the “Microscale Plan”). In 1997, ADEQ also submitted to EPA the Maricopa Association of Governments’ (MAGs’) Serious Area Committed Particulate Control Measures for PM10 and Support Technical Analysis. Since neither the moderate nor the serious PM10 plans had been approved by December 10, 1997, EPA proposed a moderate area Federal Implementation Plan in 1998. Agricultural best management practices (BMPs) were adopted in 1998 with final compliance required by the end of 2001. EPA published the FIP in August 1998. In 1999, MAG adopted the Serious Area Plan for Maricopa County covering 77 different State and local government control measures. ADEQ submitted the regional Serious Area Plan to EPA in 1999. In 2000, the final revised MAG 1999 Serious Area Plan was submitted.
Report No. 05.08.004/9429.000 14 Final Report

PECHAN August 5, 2005
In 2002, EPA found controls proposed in ADEQ’s May 1997 Plan for Attainment of the 24-Hour PM10 Standard – Maricopa County PM10 NAA inadequate to ensure the attainment of the PM10 National Ambient Air Quality Standards (NAAQS) at the Salt River air quality monitoring sites. In 2004, ADEQ submitted a SIP revision covering the Salt River area of Phoenix. Information on the Phoenix SIP submittals can be found at the ADEQ website: http://www.azdeq.gov/environ/air/plan/index.html. Many of the control measures identified in the Phoenix SIP have been implemented as part of either the agricultural BMP or Maricopa County Rule 310, which covers a wide array of fugitive dust sources. More information on agricultural BMPs can be found in the following document: www.azdeq.gov/environ/air/plan/download/tsd.pdf. Information on Rule 310 can be found at: http://www.maricopa.gov/aq/ruledesc.asp. ADEQ staff indicated that an analysis of ambient data at three monitors would be needed to investigate the success of PM10 control measures in the Phoenix area (Cockrell, 2005). The Central Phoenix site is thought to be a good background site, which might also show the direct benefits of street sweeping controls. The Buckeye site is located in a portion of Maricopa County impacted by dust from agricultural sources. Therefore, this site serves as an example for investigating the success of agricultural BMPs. The Chandler site is situated in an area with a significant amount of construction, so the effects of construction fugitive dust controls (e.g., as contained in Rule 310) might be apparent. Note that full implementation of many of the Phoenix area controls occurred in the post-1999 period. Comparison of Control Program and Ambient Data History. The ambient monitoring data provided in Section II and Appendix A show significant negative trends at the Central Phoenix site. This site is representative of a residential background site. According to ADEQ staff, reductions seen at this monitor might be most attributable to improved street sweeping, although other dust control requirements certainly contributed to the reductions (e.g., other Maricopa County Rule 310 requirements). Data from two other Maricopa County sites were also reviewed. The Chandler site (AQS ID 04-013-0021) is thought to be representative of areas impacted by construction activity. At this site, there were no negative trends and the trends for the summer season and 24-hr 99th percentile were positive. Although the summer season average in 2004 was over 20 percent lower than preceding years, it is too early to tell whether the new requirements of Rule 310 have had a significant effect. The Buckeye site (AQS ID 04-013-4011) is representative of agricultural areas in Maricopa County. However, this site was established in 2004, so no historical record has been established. C. South Coast Air Basin, California There has been a long history of control implementation in the South Coast Air Basin (SCAB). Many of these programs were implemented in the 1970s through the 1990s and have affected both primary and secondary PM sources. Significant improvements in air quality have occurred
Report No. 05.08.004/9429.000 15 Final Report
PECHAN August 5, 2005
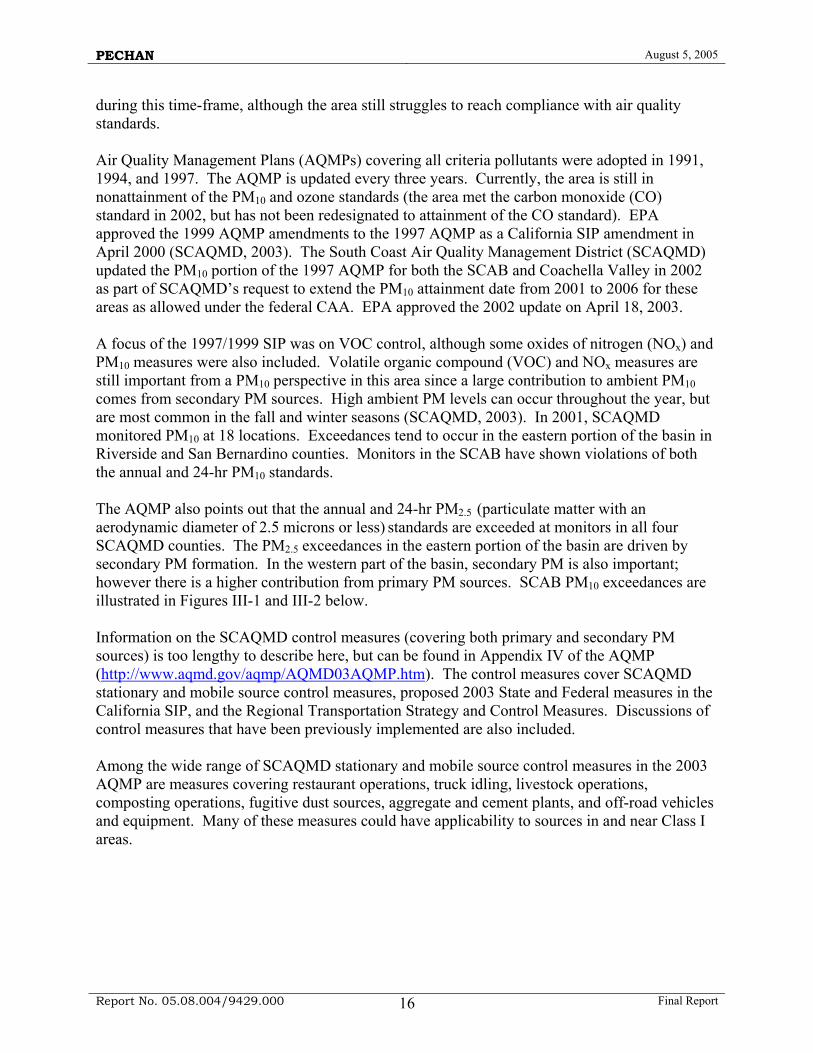
during this time-frame, although the area still struggles to reach compliance with air quality standards. Air Quality Management Plans (AQMPs) covering all criteria pollutants were adopted in 1991, 1994, and 1997. The AQMP is updated every three years. Currently, the area is still in nonattainment of the PM10 and ozone standards (the area met the carbon monoxide (CO) standard in 2002, but has not been redesignated to attainment of the CO standard). EPA approved the 1999 AQMP amendments to the 1997 AQMP as a California SIP amendment in April 2000 (SCAQMD, 2003). The South Coast Air Quality Management District (SCAQMD) updated the PM10 portion of the 1997 AQMP for both the SCAB and Coachella Valley in 2002 as part of SCAQMD’s request to extend the PM10 attainment date from 2001 to 2006 for these areas as allowed under the federal CAA. EPA approved the 2002 update on April 18, 2003. A focus of the 1997/1999 SIP was on VOC control, although some oxides of nitrogen (NOx) and PM10 measures were also included. Volatile organic compound (VOC) and NOx measures are still important from a PM10 perspective in this area since a large contribution to ambient PM10 comes from secondary PM sources. High ambient PM levels can occur throughout the year, but are most common in the fall and winter seasons (SCAQMD, 2003). In 2001, SCAQMD monitored PM10 at 18 locations. Exceedances tend to occur in the eastern portion of the basin in Riverside and San Bernardino counties. Monitors in the SCAB have shown violations of both the annual and 24-hr PM10 standards. The AQMP also points out that the annual and 24-hr PM2.5 (particulate matter with an aerodynamic diameter of 2.5 microns or less) standards are exceeded at monitors in all four SCAQMD counties. The PM2.5 exceedances in the eastern portion of the basin are driven by secondary PM formation. In the western part of the basin, secondary PM is also important; however there is a higher contribution from primary PM sources. SCAB PM10 exceedances are illustrated in Figures III-1 and III-2 below. Information on the SCAQMD control measures (covering both primary and secondary PM sources) is too lengthy to describe here, but can be found in Appendix IV of the AQMP (http://www.aqmd.gov/aqmp/AQMD03AQMP.htm). The control measures cover SCAQMD stationary and mobile source control measures, proposed 2003 State and Federal measures in the California SIP, and the Regional Transportation Strategy and Control Measures. Discussions of control measures that have been previously implemented are also included. Among the wide range of SCAQMD stationary and mobile source control measures in the 2003 AQMP are measures covering restaurant operations, truck idling, livestock operations, composting operations, fugitive dust sources, aggregate and cement plants, and off-road vehicles and equipment. Many of these measures could have applicability to sources in and near Class I areas.
Report No. 05.08.004/9429.000 16 Final Report

PECHAN August 5, 2005
Figure III-1. 2001 Annual PM10 Concentrations in the SCAB (SCAQMD, 2003)
Figure III-2. 2001 Annual PM2.5 Concentrations in the SCAB (SCAQMD, 2003)
Report No. 05.08.004/9429.000 17 Final Report

PECHAN August 5, 2005
Figures III-3 and III-4 below show the importance of secondary PM in the SCAB. These figures show that nitrates, sulfates, and organic material make up over half of the measured PM10 at the Los Angeles site and over 40 percent at the Rubidoux site.
Figure III-3. 2004 PM10 Speciation for the SCAB Los Angeles Site
Figure III-4. 2004 PM10 Speciation for the SCAB Rubidoux Site
Comparison of Control Program and Ambient Data History. The ambient data shown in Section II and Appendix A show that there are significant downward trends in measured PM10 at both selected monitoring sites. The Los Angeles site was selected to represent the western portion of the basin and the Rubidoux site was selected for the eastern portion of the basin. Significant negative trends are shown for the summer season average, the annual average, and the 24-hr 99th percentile value at both sites. Although differences were found at both sites in the summer season averages beginning in the early 1990s, it is not possible to identify specific control programs responsible for these differences (although implementation of the 1991 AQMP played some role in this). Given the long history and comprehensive nature of the control programs in the SCAB, it is not possible to assess the merits of individual control measures in reducing ambient PM10 levels. In
Report No. 05.08.004/9429.000 18 Final Report

PECHAN August 5, 2005
addition, control measures directed at ozone precursors have also controlled the important PM10 precursors (nitrates, sulfates, and organic carbon (OC)). Figure III-5 shows the trends in sulfur dioxide (SO2), NOx, nitrates, and sulfates measured at the Rubidoux monitoring site in the SCAB (Magliano, 2005). These data show a clear trend towards lower ambient nitrate and sulfate levels from 1978 to 2000. Discussions with SCAQMD staff indicate that the contribution of sulfate and nitrate to measured PM10 concentrations have still not changed dramatically (Cassmassi, 2005). This indicates that the SCAQMD control programs have been successful at reducing sources of both primary and secondary PM.
0
5
10
15
20
25
30
35
78 79 80 81 82 83 84 85 86 87 88 89 90 91 92 93 94 95 96 97 98 99
NO
X o
r SO
2 (pp
hm)
0
10
20
30
40
50
NO
3- or S
O4=
(µg/
m3)
NOX
SO2
NO3-
SO4=
Figure III-5. Trends in Sulfate and Nitrate Measured in the SCAB (Magliano, 2005)
Information provided by the SCAQMD indicate that PM10 levels in the SCAB should remain below the 24-hr standard and slightly above the annual standard by 2006 (~55 µg/m3; Cassmassi, 2005). As shown in Figure III-6, the only area in the SCAB still exceeding the PM10 standard is the Rubidoux station. According to SCAQMD staff, about 40 percent of the measured mass is associated with crustal material (this is the fine soil plus a portion of the coarse mass shown in Figure III-4). SCAQMD is currently conducting a local field study in the areas around the Rubidoux monitor. The study will investigate local sources, better characterize land use, map development areas, and possibly recommend local control measures. Additional control programs that have been proposed or recently revised that are expected to help the SCAB reach attainment include: Fugitive Dust (Rule 403); Emission Reductions from Livestock Waste (Rule 1127); Aggregate and Related Operations (Rule 1157); Cement Manufacturing Operations (Proposed Rule 1156); Fugitive Dust (Proposed Amended Rule 403); Wood Burning Fireplaces and Woodstoves (Proposed Rule 1187). Information on these amended and proposed rules can be found at: http://www.aqmd.gov/rules/index.html.
Report No. 05.08.004/9429.000 19 Final Report

PECHAN August 5, 2005
25
50
75
1995 1996 1997 1998 1999 2000 2001 2002 2003 2004
ug/m
3RiVR
AZUS
FONT
PERI
SNBD
NORC
Figure III-6. Trends in Annual PM10 Measured at Rubidoux (RIVR) and other SCAB Monitors (Cassmassi, 2005)
D. Mammoth Lakes, California As described in TM#2, Mammoth Lakes is one of three resort (ski) areas covered in this report (the other two are Crested Butte and Telluride). All of these areas were impacted by a combination of RWC and paved road dust (from road sanding materials) during the winter season. In Mammoth Lakes, the Great Basin Unified Air Pollution Control District (GBUAPCD) found that on some days RWC contributed 93 percent of the monitored PM10, while on other days paved road dust contributed up to 44 percent of the measured PM10 (GBUAPCD, 1995). Regulations were adopted that limited the number of woodburning appliances to one EPA-certified appliance per dwelling. The regulations also required the change-out of non-certified appliances upon resale of a dwelling. There were also no burn days established on days that could violate the standard. As part of this element of the RWC program, a public awareness program was used to encourage compliance (GBUAPCD, 1995). GBUAPCD estimated that in 1990 there were 5,946 woodburning appliances and that less than 1 percent were certified. By 1994, there were 5,749 appliances, but about 35 percent were certified. Without accounting for an increase in visitor and resident growth, an emission reduction of almost 20 percent was estimated. Since about 80 percent of the population in the winter months are tourists, the public awareness program had to be designed to occur daily in order to educate new arrivals of the no burn day program. Daily radio and television advertisements were used to make the public aware of the burn day status. A green day meant that it was o.k. to burn. A yellow day was a voluntary no burn day, while a red day indicated a mandatory no burn day. Cards and pamphlets were also placed in visitor rooms in the community that provided burning information. Approximately 10-14 no burn days were called each winter. A compliance estimate of 21 percent was made based on a local survey.
Report No. 05.08.004/9429.000 20 Final Report

PECHAN August 5, 2005
The paved road dust program relied on vacuum street sweeping and traffic volume limits. The control efficiency of the street sweeping program was estimated to be 34-68 percent. Overall, GBUAPCD estimated a control efficiency of 65-85 percent for street sweeping and traffic volume controls. Traffic volume controls limited the number of vehicles on certain roadways during days where elevated PM levels were expected. Comparison of Control Program and Ambient Data History. The ambient data shown in Section II and Appendix A show decreasing trends for the winter season, annual average, and 24-hr 99th percentile values. Winter season averages measured in the post-1993 period were 40 percent lower than those measured from 1986-1992. According to GBUAPCD staff, it is not possible to estimate the ambient reductions that occurred as a result of the RWC program versus the paved road dust program (Ono, 2005). Both programs occurred during the same time-frame. On certain days, paved road dust would be the primary contributor to ambient PM10, while on other days RWC was the primary contributor. E. Denver Metro, Colorado The Denver Metro area consists of all of Denver, Jefferson, and Douglas Counties; Boulder County (excluding Rocky Mountain National Park) and the Automobile Inspection and Readjustment Program portions of Adams and Arapahoe Counties (see Figure III-7). Historically, the particulate matter standard had been frequently violated during the winter in the 1970s, 1980s, and early 1990s throughout the Denver metropolitan area (CDPHE, 2001). Important source categories have been paved road dust, vehicle exhaust, and industrial emissions. Monitoring of total suspended particulate (TSP) began in the 1960’s and continued through 1987. In 1987, based on relatively high TSP levels, the Denver area was designated as a “Group I” NAA for PM10 (meaning that it would likely not achieve the PM10 standard). The Denver area was then designated a “moderate” NAA in 1990 pursuant to the CAA. This designation was for the 24-hour PM10 NAAQS; the area has never violated the annual PM10 NAAQS (CDPHE, 2001). Since 1993, there has only been one exceedance of the 24-hour standard (1999). During the 1990s, improvements in PM10 air quality occurred despite growth in population (~2 percent/year) and vehicle miles traveled (VMT) (8 percent from 1995-2000). The Colorado Department of Public Health and Environment (CDPHE) attributed the emission reductions to a mix of controls, including: • Paved road dust controls - One of the more important PM10 control measures for the Denver
metropolitan area is the restrictions on street sanding and required street sweeping as defined in Regulation No. 16. Street sand is required to meet stringent specifications to reduce the amount of fines and increase the durability of the sanding materials. Most metro-area governments were required to reduce the amount of street sand applied to their roadways by 20 percent from a base sanding amount; the City of Denver was required to reduce the amount of sand applied by 30-50 percent. Additionally, mandatory street sweeping is required in the central area after each sanding event.
Report No. 05.08.004/9429.000 21 Final Report

PECHAN August 5, 2005
Figure III-7. Denver Metropolitan NAA Boundaries and Monitoring Sites
(CDPHE, 2001)
Regulation No. 16 was revised in 2001 to require tighter control of paved road dust associated with street sanding. The new requirements below became effective in the 2001/2002 winter season:
- 30 percent emissions reduction region-wide (20 percent in the foothills); - 50 percent emissions reduction in the central Denver area (bounded by 38th Ave., Federal Blvd., Louisiana Ave., and Downing St.); - 54 percent reduction on I-25 between University and 6th Avenue; and - 72 percent emission reduction in the central business district (bounded by Colfax Avenue, Broadway, 20th Street, Wynkoop and Speer Boulevard).
• RWC – Wood burning has been restricted in the Denver metro area a number of different
ways. First, wood stoves have become cleaner as State and federal emission control requirements have been phased in beginning in the mid 1980’s. Since 1991, Colorado’s Regulation No. 4 requires that all new stoves meet “phase III” requirements for reduced
Report No. 05.08.004/9429.000 22 Final Report

PECHAN August 5, 2005
particulate emissions (phase III is equivalent to EPA’s national phase II requirements). Regulation No. 4 also prohibits conventional wood burning fireplaces in new construction (which became effective in 1993). This ban has dramatically slowed the growth in wood smoke emissions and has encouraged conversion of existing fireplaces to natural gas. Finally, and most significantly, Regulation No. 4 prohibits most wood burning activity on “high pollution days” between November 1 and March 31 throughout the metro area. This mandatory wood burning curtailment program began in the mid-1980s. In addition to Regulation No. 4, there are also a number of local wood burning ordinances. Information on these ordinances can be found at: http://www.cdphe.state.co.us/ap/woodlocal.asp;
• Vehicle exhaust - Colorado’s Automobile Inspection and Readjustment (AIR) Program is
described in Colorado Regulation No. 11 and has been applicable in the Denver area since 1981. The AIR Program works to reduce NOx pollutants from gasoline-powered motor vehicles by requiring them to meet emission standards through periodic tailpipe tests, maintenance, and specific repairs. The AIR Program was updated in 1994 to meet the requirements of the 1990 CAAA, and a more stringent and effective “enhanced” inspection program began in 1995. The enhanced program uses a loaded-mode dynamometer test called IM 240 for 1982 and newer vehicles and an idle test for older vehicles and heavy trucks; and
• Industrial sources - Colorado’s comprehensive permit rules, Regulations No. 1, 3, and 6,
control PM10, SO2, and NOx emissions from power plants and industrial facilities. These rules also cap PM10, SO2, and NOx emissions from new or modified major stationary sources. Colorado continues to enhance its permit and control programs, while simultaneously pursuing a strong inspection and enforcement presence.
The CDPHE (2001) identified onroad vehicles as the most important winter source of primary PM10 in the Denver Metro region (contributing ~62 percent in 1995). These contributions include both paved road dust, as well as primary PM from vehicle exhaust. Unpaved road dust contributed about 12 percent, while RWC and point sources contributed 9-10 percent each. Comparison of Control Program and Ambient Data History. The ambient monitoring record shown in Section II and Appendix A indicate negative trends in both winter season average and 24-hr 99th percentile values at the CAMP monitoring site. No significant trend is indicated for annual average readings. Significant decreases are shown in the winter season average and 24-hr 99th percentile values in the post-1994 time-frame. However, a lot of these differences result from the very high averages seen in 1987 and 1993. In 1995, the enhanced inspection and maintenance (I/M) program began in Denver and may have contributed to some of the reductions; however CDPHE indicates that paved road dust controls have been the most important program in reducing PM10 levels (Silverstein, 2005). Note that a positive trend appears to be emerging in the post-2000 time-frame 24-hr 99th percentile values. The CDPHE indicated that the recent increases are not thought to be indicative of higher winter season daily averages, but with occasional spikes in concentrations that occur from year to year (Silverstein, 2005). However, all of the seasonal values in the post-2000 time-frame are also higher than previous years, and, after excluding all 24-hr PM10 values
Report No. 05.08.004/9429.000 23 Final Report

PECHAN August 5, 2005
>100 µg/m3, the seasonal averages were only lowered by about 2 percent. Hence, the higher seasonal values do not appear to be driven by occasional high readings. F. Telluride, Colorado Telluride is a mountain resort community located in San Miguel County, CO. As with other similar resort communities covered in this report, PM10 problems occur in the winter as a result of poor mixing conditions and emissions primarily from RWC and paved road dust. Monitoring for TSP in Telluride began in March 1975 at the Sheridan Hotel. The monitor exceeded the 24-hour NAAQS of 260 µg/m3 and/or the annual NAAQS of 75 µg/m3 every year from 1976 through 1986. The historic TSP levels designated Telluride as a “Group I” area for the new PM10 standards, which were promulgated by the EPA in 1987. “Group I” locations were those areas estimated to have a greater than 95 percent probability of exceeding the new PM10 standards. TSP monitoring was discontinued on March 11, 1987 as PM10 monitoring was underway (CDPHE, 2000). Monitoring for PM10 began at the Sheridan Hotel in September 1985, and was discontinued in June 1990, when the site was moved to the 333 W. Colorado location. Both the Sheridan Hotel and the 333 W. Colorado locations were classified as middle-scale sites; a middle-scale site is designed to represent an area from 100 meters to 0.5 kilometers. The monitors have operated on various sampling schedules in Telluride, but everyday sampling has occurred since December 1988 (CDPHE, 2000). . The following list illustrates monitoring efforts that have occurred in the Telluride area (CDPHE, 2000). As shown in Section II, the PM10 monitoring at the Sheridan Hotel and the 333 W. Colorado location are the most pertinent to this study:
• TSP Sheridan Hotel - March 1976 through March 1987; • PM10 Sheridan Hotel - September 1985 through June 1990; • PM10 Mt. Village/Ski Area - December 1985 through December 1986; • PM10 Society Turn - December 1985 through December 1986; • PM10 333 W. Colorado Avenue - March 1990 to the present; and • PM10 Coonskin Parking Lot - September 1, 1995 through November 6, 1995 (these are the samplers from the W. Colorado site, which were moved to the Coonskin Parking Lot while the roof of the 333 W. Colorado Building was being resurfaced).
A review of the ambient monitoring data show that very few exceedances of the 24-hr standard have occurred in Telluride from 1990-2004. Because there has not been a violation of the PM10 standard in Telluride since the NAAQS were promulgated in 1987, and because there has only been two concentrations since 1987 that have exceeded the 24-hour PM10 NAAQS (153 ug/m3 in
Report No. 05.08.004/9429.000 24 Final Report

PECHAN August 5, 2005
1994 and 224 ug/m3 in 1999), CDPHE concluded that the improved air quality in the Telluride area is the result of the implementation of emission reduction measures. This occurred in spite of growth in population and vehicle activity. The high reading in 1999 was the result of a natural (high wind) event (CDPHE, 2000). PM10 trends have been strongly downward since 1990 (see Section II). The first PM10 SIP Element was adopted by the Colorado Air Quality Control Commission (AQCC) in July 1988, and the emission controls included road paving and coal/woodburning restrictions. EPA Region VIII intended to approve the SIP Element, though it eventually was rejected once the Clean Air Act was amended in 1990 and new, more stringent requirements were in place (CDPHE, 2000). A new Telluride SIP Element was adopted by the AQCC in January 1993 and supplemented in November 1993. The control measures included the paving and woodburning measures from the 1988 SIP Element and new road paving contingency measures. EPA partially/conditionally approved the SIP Element on September 19, 1994 (59 FR 47807). The Telluride SIP Element was revised by the AQCC in October 1994 and again in August of 1995. These revisions consisted of updating the technical and administrative information and the adoption of new street sanding requirements to satisfy the conditions of EPA’s September 1994 action. EPA provided full approval of the Telluride SIP Element on October 4, 1996 (61 FR 51784; CDPHE, 2000). The Town of Telluride and San Miguel County adopted wood and coal burning emission reduction measures. These wood and coal burning controls that were adopted and implemented throughout the 1980’s and early 1990’s and were approved by EPA in 1994 were:
1. Require the installation of cleaner-burning devices in existing dwellings, which have pre-existing solid fuel burning devices;
2. Prohibit solid fuel burning devices in new construction; 3. Ban coal burning; and 4. Limit the total number of fireplaces and woodstoves in the NAA.
There is a requirement that any user that applies street sanding material in the Telluride attainment/maintenance area must use materials containing less than two percent fines. This strategy was adopted in 1994 and approved by EPA in 1996. Also, during the late 1990s, the Town of Telluride periodically swept Colorado Avenue once after each street sanding event, as conditions permitted. Chemical deicers were also used on a portion of this road. During the late 1990s, several paving projects reduced the amount of unpaved roadways in the Telluride area. There is also a state-wide requirement that any owner/operator of an unpaved roadway with average daily traffic of greater than 200 vehicles must stabilize the roadway (e.g., using chemical stabilizers). Federal control programs covering onroad sources have also likely contributed to some of the ambient air quality improvements in Telluride. The 1996 base year emissions inventory indicated that winter daily PM10 emissions were dominated by geologic sources (paved and unpaved road dust contributed 96 percent of the
Report No. 05.08.004/9429.000 25 Final Report

PECHAN August 5, 2005
estimated emissions). Also, chemical mass balance (CMB) modeling attributed 80 percent of the measured PM10 to geologic sources. The inventory showed contributions from RWC and restaurants to be less than 3 percent, while the CMB results showed a 16 percent contribution. Comparison of Control Program and Ambient Data History. Strong negative trends are shown in the monitoring data provided in Section II and Appendix A for winter season averages, annual averages, and 24-hr 99th percentile values. Based on the progression of control implementation in Telluride, it appears as if the controls targeted at paved and unpaved road dust have contributed the most to the negative ambient trends shown in these charts. As mentioned above, RWC controls were implemented in the 1980s and early 1990s. Winter season averages show decreases in the 1993-1996 time-frame, and additional significant reductions are observed in the post-1996 period. This is consistent with the implementation of controls on paved and unpaved roads, and the significant contributions from these sources. In particular, from 1997 onward, the winter season average concentrations are less than half those measured in the pre-1997 time-frame. G. Crested Butte, Colorado Crested Butte is a mountain resort community much like Telluride and Mammoth Lakes. This area is not a PM10 NAA. As in these other areas, PM10 problems occur in the winter, and the primary sources are RWC and paved road dust. The primary reason that it was selected for further analysis is because of a special study conducted between 1988 and 1990 on the success of a wood stove change-out program (CDPHE, 1990). In this study, the Colorado Department of Public Health & Environment conducted ambient monitoring both before and after the program in order to quantify the benefits on both PM10 air quality and visibility. Emission rates in conventional woodstoves, certified woodstoves, and residential coal burning appliances were also measured. The results of the Crested Butte study showed significant reductions in both PM10 concentrations and visibility impairment following the change-out program. On average, CDPHE (1990) estimated 40 percent reductions in PM10 and 59 percent less light scattering (the instruments used in the study did not measure light absorption). CDPHE acknowledged several sources of uncertainty with these estimates. One was a slightly warmer season after change-out, which might have reduced the amount of wood-burning somewhat compared to the pre-change-out season (1988-89 was about 8 percent colder on average than 1989-90). There was no information provided on the level of resort activity between the two years, which could have also been a contributor to the observed reductions. Table III-2 provides a summary of the monitoring results before and after the change-out program. CMB modeling on the measure PM10 mass indicated that, although significant reductions had occurred in ambient levels, RWC remained the dominant source after the change-out program. RWC contributed 60-70 percent of the PM10 mass in both seasons. Geologic material (resuspended dust from road sanding operations) became an important contributor later in each season (contributing about 60 percent in February and March; CDPHE, 1990).
Report No. 05.08.004/9429.000 26 Final Report

PECHAN August 5, 2005
Table III-2. Monitoring Summary for RWC Change-Out Program in Crested Butte
PM10 Concentrations (µg/m3) 1988-1989 1989-1990 Month
mean std. error mean std. error Significance
(p value) November 24.9 3.1 19.8 1.6 0.356 December 57.4 7.2 30.8 6.0 0.029 January 66.6 7.4 28.1 3.0 0.000 February 35.9 5.4 26.8 3.4 0.178 March 44.3 6.2 27.9 3.0 0.020 Nov. - Mar. 46.3 3.4 27.4 1.7 <0.001
Light Scattering (106m-1) November 131.3 5.3 61.4 2.4 <0.001 December 219.3 6.6 89.9 4.2 <0.001 January 266.3 7.9 98.3 3.4 <0.001 February 178.5 6.8 76.4 2.9 <0.001 March 81.0 3.3 39.2 1.4 <0.001 Nov. - Mar. 174.2 3.0 71.7 1.3 <0.001 Source: CDPHE, 1990.
A testing program found that PM emission rates for certified woodstoves operated in Crested Butte were just over 50 percent lower than conventional woodstoves used in the area. The study also found that coal-fired equipment emitted about 54 to 84 percent less PM emissions than conventional woodstoves (Jaasma et al, 1991). Comparison of Control Program and Ambient Data History. The results of the change-out program are apparent by looking at the winter season averages for 1989 and 1990 in the summary data provided in Section II and Appendix A. Although there was an increase in winter season average during 1991 and 1992, the post-1993 winter season average is about 40 percent lower than the pre-1993 period. The annual PM10 averages also show a statistically-significant negative slope. The 24-hr 99th percentile readings, however did not produce a statistically-significant negative slope. CDPHE indicates that recent additional work with local officials on control programs (e.g., paved road dust) is expected to show better results in upcoming years (Silverstein, 2005). H. Boise, Idaho Boise, in northern Ada County, was designated a moderate PM10 NAA upon passage of the 1990 CAA amendments (EPA identified Boise as a “Group I” area of concern with a high likelihood of exceeding the new PM10 standard). The Idaho Department of Environmental Quality (IDEQ) submitted a SIP and two revisions in 1991, 1994 and 1995. EPA gave final approval of the Northern Ada County SIP in 1996. All PM10 exceedances except one have occurred in the winter months prior to 1991. The exception was an agriculturally-influenced exceedance that occurred in 1997. The annual standard has only been exceeded once (1986; ENVIRON, 2002). Important primary PM10 source categories are paved road dust and RWC. ENVIRON (2002) estimated that during the winter, about 88 percent of the primary PM10 was contributed by paved road dust, while RWC contributed about 7 percent. The primary control measures in the SIP targeted RWC, open burning and requirements on point sources (to reduce allowable or actual
Report No. 05.08.004/9429.000 27 Final Report

PECHAN August 5, 2005
emissions). Contingency measures in the SIP included controls on paved road dust, material transport load covering, expanding the vehicle I/M program in Ada County, RWC (additional controls), and unpaved roads. Ambient monitoring has been conducted at four primary sites in Boise (Mountain View School, Fire Station #5, Liberty Fire Station, and Meridian). Continuous real-time monitoring using Tapered Element Oscillating Microbalance (TEOM) monitoring has been conducted at the Fire Station #5 site and at the Nampa Fire Station in Canyon County to the west of Boise. The following list contains the most important control programs from Boise’s SIP (ENVIRON, 2002): • Air Quality Index Program – in this program, IDEQ provides a hotline and information on its
website on measured and predicted PM10 and CO levels in 14 different areas of the State, including Boise. Information on voluntary or mandatory wood burning curtailment (see below) is also provided;
• RWC Program – in the current program, voluntary wood burning equipment curtailment is
initiated when PM10 levels reach 64 µg/m3, and mandatory curtailment is initiated when levels reach 100 µg/m3. Use of woodstoves and fireplaces is prohibited when these levels are reached through local ordinances in Ada County. Other elements of the program have included a woodstove certification program, public education and awareness program, and a woodstove change-out program. New requirements for woodstove efficiency were put into the 1991 SIP, but the timing of each of the other elements of this program were not available;
• Open Burning Program – similar to the RWC program, a voluntary curtailment is initiated at
a concentration of 64 µg/m3. A mandatory ban is initiated when a Stage I Alert has been reached (24-hr average of 150 µg/m3). In 2001, the unincorporated portions of Ada County passed ordinances prohibiting open burning at PM10 levels above 70 µg/m3;
• Industrial Source Permits – permits were issued or revised to 13 facilities that lowered their
allowable emissions to their actual emissions, plus a small buffer. In addition, another facility in Canyon County was issued new permit conditions that required it to lower its actual emissions to levels that would not cause PM10 exceedances off-site; and
• Paved Road Dust – in the 1995 SIP revision, IDEQ signed an agreement with the Idaho
Transportation Department (ITD) for a street sweeping program designed to reduce emissions. In this program, ITD would perform street sweeping first on roadways that contributed the highest emissions and these roads would be swept more frequently.
CMB modeling was performed for high PM10 values monitored during December 1991 and 1999 at the Fire Station #5 site. The average PM10 mass measured for the two highest days in these two years was much different (163 µg/m3 in 1991 compared to 69.5 µg/m3 in 1999). This modeling showed that secondary PM contributed >50 percent of the PM10 mass on some days. RWC emissions contributed about 28 percent during both years analyzed, however paved road
Report No. 05.08.004/9429.000 28 Final Report

PECHAN August 5, 2005
dust varied dramatically (6 percent in 1991 versus 45 percent in 1999). Gasoline and diesel vehicle exhaust emissions were significant contributors in both years (ENVIRON, 2002). Comparison of Control Program and Ambient Data History. A review of the monitoring data shown in Section II and Appendix A shows significant negative trends in winter season average, annual average, and 24-hr 99th percentile PM10 values. The winter season average negative trend was strong (-1.9 µg/m3/yr). The annual and winter season averages indicate significant reductions occurring in the post-1994/95 time-frame. The 24-hr 99th percentile readings began to come down in the post 1991 period. Reductions occurring in the post-1991 time-frame are most likely associated with early RWC programs. In the post-1994/95 time-frame, reductions occur in conjunction with the street sweeping program described in the 1995 SIP revision. The implementation of vehicle inspection and maintenance programs and Federal vehicle emissions standards also contributed to emission reductions in Boise. During the last 10 years, Boise, like many western areas, experienced a large increase in vehicle miles traveled (Edwards, 2005b). I. Sandpoint, Idaho EPA identified the Sandpoint NAA in northern Idaho as a PM10 “Group I” area of concern (i.e., an area with a strong likelihood of violating the PM10 NAAQS. It therefore became a moderate PM10 NAA upon enactment of the 1990 CAA amendments. IDEQ submitted a SIP in 1993, which was replaced with a revised SIP in 1996. The Sandpoint NAA is located in Bonner County, and includes the communities of Sandpoint, Ponderay and Kootenai. PM10 attainment problems have occurred in the fall and winter months in Sandpoint. While the 24-hour standard has been exceeded on several occasions between 1986 and 1994, the annual standard was never exceeded (EPA, 2002). IDEQ began monitoring PM10 in Sandpoint in 1985. The monitor was originally located on top of the Sandpoint U.S. Post Office, but was removed in 2001 at the request of the U.S. Post Office. IDEQ installed a new site at the Sandpoint Middle School, which EPA approved as part of Idaho’s State and Local Air Monitoring Stations (SLAMS)/National Air Monitoring Stations (NAMS) Monitoring Network on January 30, 2002 (EPA, 2002). The initial schedule for the U.S. Post Office site was to monitor PM10 every sixth day. As concentrations exceeding the standards were measured during the winters of 1985-86 and 1987-88, the monitoring frequency was accelerated. From 1994-1997, the post office site operated every other day from October through March, and every sixth day from April through September. From 1998 through 2001, the site operated every three days throughout the year. Additional data support at the post office site was provided by a TEOM, which provides continuous “real time,” direct measurements of PM10 concentrations. The TEOM was installed at the post office site during the spring of 1993. The control measures in the Sandpoint attainment plan target RWC, paved road dust, and industrial plant emissions. For RWC, the plan uses public awareness, uncertified wood stove change-outs, and episodic curtailment programs to achieve the reductions. For paved road dust, the plan includes an anti-skid material ordinance, street-sweeping, and requirements for
Report No. 05.08.004/9429.000 29 Final Report

PECHAN August 5, 2005
alternative anti-skid materials. For industrial plants, the plan relies on revising and issuing operating permits to ensure that reasonably available control technology (RACT) is met. Most of the reductions are attributed to the RWC and paved road dust measures. The following are components of Sandpoint’s RWC control program (EPA, 2002): • Public Awareness Program - this program informs and educates citizens about stove sizing,
installation, proper operation and maintenance, general health risks of wood smoke, new technology stoves, and alternatives to wood heating. The program uses a wide variety of media, including brochures, radio advisories, newspaper advertisements, TV Public Service Announcements, TV advertisements, pay stub inserts, and utility inserts, to educate citizens on these topics. In addition, the Greater Sandpoint Chamber of Commerce developed and implemented an aggressive public awareness campaign in 1995 to initially kick-off its wood stove reduction efforts;
• Woodstove Change-Out Program – this program contains several elements. The first offered
homeowners incentive grants to replace their old (uncertified) wood stoves with cleaner burning heating systems. By the time it ended in September 1995, the replacement program had resulted in the removal of 84 wood stoves. These were replaced by 64 natural gas devices, 18 new wood stoves and 2 pellet stoves.
Another element of the change-out program is a revised State tax code that allows taxpayers to receive a tax reduction for replacing uncertified wood stoves with cleaner burning units. It was estimated that 70 change-outs occurred as a result of this tax deduction. Emissions were estimated for the 1994 pre-change-out year and the 1997 post change-out year. A PM10 reduction of 6 percent was calculated between the 2 years. The IDEQ also mentioned that another grant program occurred in 2002 that resulted in the change-out of another 56 uncertified wood stoves (Redline, 2005).
• Limits on Growth of Uncertified Units - in 1995, the City of Sandpoint adopted Ordinance No. 965 which, among other things, restricts the sale and installation of uncertified solid fuel heating appliances in the City of Sandpoint. More specifically, the ordinance prohibits any person in the City to advertise for sale, offer for sale, sell, or install in any new or existing building a solid fuel heating device that has not been certified by EPA. The ordinance also prohibits any person in the City of Sandpoint from installing a solid fuel heating appliance in any new or existing structure, until first procuring a permit from the building department. Note that Ordinance No. 965 applies only to the City of Sandpoint, which means that uncertified solid fuel heating appliances could be sold and installed in the nearby cities of Kootenai and Ponderay, which are part of the NAA;
• Episodic Curtailment Program - in 1995, the City of Sandpoint passed Ordinance No. 965
which, among other things, lays out a two-stage approach for wood smoke curtailment. The first stage calls for voluntary curtailment of the use of wood burning appliances if the PM10 concentration reaches 70 µg/m3. The second stage calls for mandatory curtailment if the concentration reaches 100 µg/m3. It was estimated that 85 percent of the stoves in the
Report No. 05.08.004/9429.000 30 Final Report

PECHAN August 5, 2005
Sandpoint NAA are subject to this measure since 85 percent of the NAA’s population resides within Sandpoint’s city limits. Violation of the mandatory curtailment requirements is a misdemeanor offense, and violators are subject to a monetary fine.
The IDEQ provides the City of Sandpoint with the daily air quality advisory status. Notification of a voluntary or mandatory curtailment is announced during regularly scheduled broadcasts on radio and television and published in all editions of the local newspaper. There is also a toll-free hotline and a phone tree run by the Sandpoint Chamber of Commerce to spread the notification throughout the community. EPA (2002) assumed an overall reduction of 52 percent for the episodic curtailment program.
The following are components of Sandpoint’s paved road dust control program (EPA, 2002): • Street Sanding Material Specifications - in 1994, the City of Sandpoint adopted Ordinance
939: Material Specifications for Street Sanding Material. This measure requires applicators of anti-skid materials to use only materials that meet certain standards for fines and durability. Historically, road maintenance departments for the Sandpoint NAA used anti-skid material that had a fines content ranging from 5-10 percent. The new measure allows a maximum of 2-5 percent fines, depending on the durability index. Lowering the percent of fines improves the abrasiveness of the material and, thus, results in lower silt loadings and, consequently, emissions.
While Ordinance 939 technically only applies to city-maintained roads in Sandpoint, for practical reasons, it also impacts State highways under ITD jurisdiction as well. In order to avoid having to maintain separate stockpiles of anti-skid materials, ITD has agreed to adhere to the City’s standard on all its highways within the NAA boundaries. EPA estimated a 55 percent reduction in paved road dust from this measure. IDEQ also noted that street sweeping is conducted by ITD. Deployment of street sweepers is done based on ambient PM10 readings that are accessed directly by ITD staff from the IDEQ Coeur d’Alene office (Redline, 2005).
• Reduced Volume of Anti-Skid Materials - The ITD has developed a maintenance program to limit the amount of anti-skid material applied to State highways in the City of Sandpoint. The adoption of sanding material specifications increased the cost of material from $0.50/yard to approximately $12.00/yard, providing a strong incentive for reducing the amount of material it applies. In addition, the regional ITD office has instituted a policy that establishes portions of state highways in downtown Sandpoint in which a liquid deicer is used instead of sand, when possible. Both ITD and the Sandpoint Independent Highway Department (SIHD) have acquired equipment to apply liquid deicer as an alternative to the anti-skid material. When road and weather conditions are appropriate, liquid deicer is used instead of anti-skid material to maintain traction. Finally, ITD has made improvements in the application of sand by installing ground speed control sensors that vary the application rate based on vehicle speed, preventing unnecessary deposition of material that could later become entrained as fugitive dust. No estimate of emission reductions resulting from this element of the program was made.
Report No. 05.08.004/9429.000 31 Final Report

PECHAN August 5, 2005
• Use of Liquid Deicer - Both SIHD and ITD acquired equipment to apply liquid deicer as an
alternative to anti-skid material. The use of liquid deicer enables the agencies to use less anti-skid material as well as improve the effectiveness of the anti-skid material by helping it stick to the road surface. An additional benefit is that when roads dry out, the liquid deicer also acts as a dust suppressant. Also, ITD developed an anti-skid material free zone to reduce fugitive road dust emissions in Sandpoint. Liquid deicer is used almost exclusively within this zone. IDEQ developed an estimate of 70 percent control for this measure.
IDEQ also implemented controls on five stationary sources within the NAA that emitted more than 1 ton/yr of PM10. Controls included paving/chemical treatment of unpaved roads and process controls. These controls were implemented through modifications to permits. After permit revision in 1997, the allowable emissions at these facilities were capped at levels slightly below actual 1993 levels. Comparison of Control Program and Ambient Data History. The ambient data provided in Section II and Appendix A show strong negative trends in winter season average, annual average, and 24-hr 99th percentile values. The seasonal data indicate significant reductions in the post-1994 time-frame. IDEQ estimated the following contributions to 1993/1994 winter-time PM10 daily emissions: RWC (45 percent); paved road dust (35 percent); and industrial sources (11 percent). It is difficult to distinguish the contributions in ambient PM10 reductions from the different programs implemented in Sandpoint. Both the RWC and paved road dust programs were being implemented during the 1995/96 time-frame. The episodic RWC reduction measure, as well as the paved road dust measures could have contributed significantly to the reductions in the 24-hr and winter season values. IDEQ staff indicated that the paved road dust measures might have contributed more to reducing PM10 concentrations in Sandpoint. During stagnant periods, emissions during the day primarily from paved road dust built up, and then emissions from RWC occurring primarily during the evening would add to the concentrations. Federal funding to the local transportation agencies as part of the CMAQ Program helped to fund the equipment purchases (street sweepers, deicers) needed to make the paved road dust control program a success (Redline, 2005). J. Clark County, Nevada The Las Vegas Valley of Clark County is a serious PM10 NAA. The NAA is 1,500 acres in size with most of this area under Federal control. Areas not controlled by the Federal government include the Cities of Las Vegas, North Las Vegas, Henderson, and unincorporated portions of Clark County (Clark County, 2001). The area is in nonattainment of both the annual and 24-hr average standards. The 2001 SIP indicated that the important PM10 sources were all fugitive dust sources including construction activities, wind-blown dust, paved road dust, and unpaved road dust (Clark County, 2001). The 2001 SIP replaced a 1997 SIP that was found to be deficient by EPA. The purpose of the 2001
Report No. 05.08.004/9429.000 32 Final Report

PECHAN August 5, 2005
SIP was to show that the annual standard would be achieved by 2001, and that the 24-hr standard would be achieved by 2006. A 1991 SIP for the then moderate PM10 NAA called for control of emissions from construction activities and wind-blown dust (from disturbed vacant land); however implementation of reasonably available control measures (RACM) did not reduce emissions sufficiently to prevent exceedances. In 1993, EPA reclassified the NAA to serious. A revised PM10 SIP was adopted by Clark County in 1994, which called for implementation of best available control measures (BACM) on area sources and best available control technology (BACT) on stationary point sources by 1997, as well as a most stringent measures (MSM) analysis. The PM10 SIP was revised again in 1997. This plan also failed to show attainment of both PM10 standards by 2001 (Clark County, 2001). The top PM10 emission sources were identified as wind-blown dust from vacant land (39 percent); paved road dust, including construction track out onto paved areas (26 percent); construction activity, including wind-blown dust at construction sites (23 percent); and unpaved roads (9 percent). For wind-blown dust from vacant lands, Clark County adopted rules in the 2001 to 2003 time-frame to limit motor vehicle use on open land; require stabilization of vacant land; weed abatement controls; and require dust management plans for large tracts of governmentally-owned lands. These rules are part of Clark County’s Section 90 Regulation covering ““Fugitive Dust from Open Areas and Vacant Lots” (http://www.co.clark.nv.us/air_quality/regs.htm). Sections 90-94 contain many of the newer fugitive dust control requirements in the Clark County air quality regulations. Of these, Section 94 is particularly important in that it covers emissions from a wide range of sources associated with construction. Section 94 specifies the use of the Construction Activities Dust Control Handbook, which is the reference manual used to complete a Dust Control Permit and a Dust Mitigation Plan (it also includes a listing of the Best Management Practices). The rule also requires that a Dust Control Monitor be on-site at areas of >50 acres of disturbed area. Track out controls are also included in the rule. For unpaved parking lots, Clark County established rules requiring either paving or stabilization for those in excess of 5,000 square feet. For paved roads, the track out provisions associated with construction activities apply. Paving or stabilizing 33 miles of paved road shoulders was to be completed by 2003, and the remaining shoulders were to be paved/stabilized by 2006. In addition, after January 2001, street sweepers had to be PM10-efficient sweepers and programs for frequent street sweeping were to be implemented by city, county, and state maintenance departments (Clark County, 2001). Comparison of Control Program and Ambient Data History. A review of the monitoring data shown in Section II and Appendix A does not show any significant trends in seasonal averages, annual average, or 24-hr 99th percentile readings. Notably, the 2004 seasonal averages and 24-hr 99th percentile values have begun to decline, however it is too early to determine whether the effects of the recent PM10 control programs have had a significant impact on ambient PM10 levels in Clark County.
Report No. 05.08.004/9429.000 33 Final Report

PECHAN August 5, 2005
K. Klamath Falls, Oregon Klamath Falls is located in south central Oregon at an elevation of 4,100 feet. It was classified as a moderate NAA upon enactment of the CAAA. PM10 is a wintertime problem in the Klamath Falls basin due to cold air inversions trapping emissions near the ground. The two predominant sources of particulate in Klamath Falls in the winter are RWC and road dust from motor vehicle travel. Remaining sources of PM10 emissions include fuel oil use, large and small industry, forest and agricultural fires, open burning and other fuel combustion sources (ODEQ, 2002). The Klamath Falls area violated both the federal 24-hour and annual standards in the late 1980s. PM10 concentrations have been measured at the same location in the Klamath Falls urban growth boundary (UGB) (Peterson School on Clinton Street) since 1987. Between 1987 and 1991 there were 120 days that exceeded the daily health standard in Klamath Falls. During that same time, there were three years that exceeded the annual average standard. The highest recorded 24-hour average PM10 concentration was 792 µg/m3 recorded on January 25, 1988 (ODEQ, 2002). Significant RWC related PM10 pollution occurred during this period due to wintertime inversions and high emissions. There were 22 recorded daily exceedances in 1987; 28 exceedances in 1988; and 45 recorded exceedances in 1989. In 1990 the number of daily exceedances dropped to 18 and in 1991 there were only 7. The last recorded exceedance of the standard was 196 µg/m3 on January 22, 1991, and 1991 was the last year in which the 24-hr standard was violated. The period 1989-94 was a transitional period when significant reductions in RWC emissions occurred. Since 1994, peak PM10 concentrations have been significantly below the standards (ODEQ, 2002). The highest annual average PM10 concentration was 73.5 µg/m3 in 1987. The annual average dropped steadily until 1990 when it was below the standard at 46.2 µg/m3. The annual average has remained below the annual standard, and in 2000, was at less than half the standard. Oregon Department of Environmental Quality (ODEQ) (2002) attributed the emission reductions to the following control programs:
• statewide woodstove certification program; • ban on the sale and installation of uncertified woodstoves; • woodstove removal and heating source replacement program for low income
households; • Klamath County mandatory woodstove and open burning curtailment ordinance; • winter road sanding controls; • public education programs; • industrial sources - significant emission rate requirement; and • Forestry slash burning emission reduction and restrictions.
Most of the emission reductions were attributed to the RWC programs noted above. The timing of important RWC program elements is as follows: woodstove certification program, requiring all new woodstoves sold in the State to be laboratory tested for emissions and efficiency prior to sale (mandatory since 1988); a Klamath County mandatory woodstove and open burning
Report No. 05.08.004/9429.000 34 Final Report

PECHAN August 5, 2005
ordinance (since 1991); and a ban on the sale and installation of uncertified woodstoves (since 1991). Except for the state-wide woodstove certification program, the rest of the RWC requirements are part of Klamath County Ordinance Chapter 406. The 1991 Klamath County mandatory woodstove curtailment ordinance features curtailment advisories during excessive pollution episodes and poor ventilation conditions. Advisories are issued at three levels, “green”, “yellow” and “red”. On days with high pollution (red days), all woodstove activity is curtailed. On days with moderate pollution (yellow days) that may have an impact on individuals’ health, uncertified woodstove activity is curtailed. Advisory calls are made on a daily basis in the winter to alert the public as to the level of pollution and the outlook for pollution levels and stagnant conditions that day (ODEQ, 2002). The woodstove replacement program for low-income households was effective in significantly reducing emissions in the early 1990’s. In a major one-time effort, several funding sources were combined to remove uncertified woodstoves from homes and replace them with a satisfactory heat source. Often these homes were poorly insulated and required major renovations, including weatherization, to improve the efficiency of heating the home. The “Particulate Urban Resources Effort” or the PURE project upgraded 134 heating systems. In that project, 102 noncertified woodstoves were destroyed and 90 percent of the homes received a natural gas heating system as a replacement system. Nearly 80 percent of the money spent on the project was spent to upgrade homeowner-heating systems and 18 percent of the money spent was on weatherization. This project spawned other uncertified stove removals inside the NAA and was a model for other programs in other cities (ODEQ, 2002). Emissions resulting from wintertime road sanding can be significant. The Oregon Department of Transportation, the County Public Works Department, and the City’s Public Works Department have made significant strides to reduce the amount of winter road sanding material placed on the roadway. By 1996, the Oregon Department of Transportation (ODOT) on state highways substantially reduced roadway sanding substituting crushed aggregate, a less brittle material than cinders. In recent years, ODOT has utilized magnesium chloride as an anti-icing agent on roadways, replacing sanding material almost completely. The County reduced sanding to only intersections and sweeps up cinders immediately following the storm event. The City of Klamath Falls uses salt and plows the roads during storms, virtually eliminating sanding. Comparison of Control Program and Ambient Data History. A review of the monitoring data shown in Section II and Appendix A indicates significant downward trends in winter season average, annual average and 24-hr 99th percentile values. Significant reductions are seen in the post-1991 time-frame, when most of the elements of the RWC program went into effect. The reductions in winter season average concentrations are the most dramatic of any of the PM10 areas reviewed during this project indicating both the success of the RWC program and the role of this source sector as the main PM10 contributor. As shown in Appendix A, the post-1991 winter season average is only about one-fourth of the 1986-1991 average. The paved road dust program appears to have played a much less significant role in bringing down PM10 levels.
Report No. 05.08.004/9429.000 35 Final Report

PECHAN August 5, 2005
L. King County, Washington The Duwamish Valley in Seattle (King County) was identified by EPA as a “Group I” area of concern and was designated as a moderate PM10 NAA upon enactment of the 1990 CAA amendments. The initial PM10 SIP was submitted to EPA in November 1990. Additional SIP supplements were submitted in 1991, 1994 and 1995. The SIP was approved in October 1995 (Sierra, 1997). One exceedance of the annual PM10 standard was measured at one monitoring site in 1985, although this was with a non-reference method monitor. Monitoring has been conducted at five different sites in the NAA, although two of these only operated during 1985. The data at the three other sites show decreasing annual trends. Exceedances of the 24-hr standard have not occurred since 1988. The principal control strategies (described more fully below) included an RWC control program, a fugitive dust control program, and industrial source controls (Sierra, 1997). The emissions inventory for Seattle showed that allowable industrial source emissions made up most of the daily emissions (over 80 percent). Vehicle emissions contributed another 11 percent (about two-thirds of this from diesel vehicles), and wood-burning and paved road dust contributed only about 2 percent each. CMB modeling indicated that these inventory estimates over-predicted the impacts from the industrial sector, since 40 percent of PM10 mass was attributed to vehicle exhaust, 37 percent to RWC, and 16 percent to paved road dust (Sierra, 1997). Unlike many of the other northern WRAP PM10 areas, paved road dust emissions in Seattle are not related to road sanding. Emissions in Seattle are from re-entrained dust that has settled onto roadways or from dirt/mud carried out from unpaved areas. Highlights of each of the primary control programs are as follows: • RWC Program – in 1987, provisions were added to WA State law to address RWC
[Washington Clean Air Act (RWC 70.94) and WA Administrative Code (Chapter 173-433 WAC)]. The provisions included a prohibition on the sale of uncertified woodstoves, a 40 percent opacity standard, prohibition on burning certain fuel types, and a curtailment program. During the 1987-1988 season, the Puget Sound Air Pollution Control Agency (PSAPCA) implemented a voluntary curtailment program with media notification and public education (there were 4 curtailment periods during that season).
In 1988, PSAPCA incorporated many of the provisions above into its Article 13 of Regulation I. Mandatory curtailment and enforcement were implemented. Notices of Violations (NOVs) were issued, but no financial penalties were levied (there were 7 curtailment periods during this season). During the 1989-1990 heating season, PSAPCA hired two full-time employees to handle enforcement and education. NOVs were issued and civil penalties were assessed to about 30 percent of violators. Difficulties in enforcing the ban included determining applicability of the exemption to households where RWC was the sole source of heat. Addresses were also difficult to determine during night-time surveys. Some violators also claimed that the
Report No. 05.08.004/9429.000 36 Final Report

PECHAN August 5, 2005
observed smoke was from a non-wood burning furnace. During this season, there were 4 curtailment periods. 1n 1990, the ambient concentration level triggering curtailment was lowered from 90 µg/m3 to 75 µg/m3. Also, a tax on new woodstove sales was instituted to provide funding for education and enforcement. Installation of uncertified woodstoves in the urban growth areas was prohibited. Also, a more stringent opacity limit of 20 percent was instituted and fines were increased. A measure to prohibit the use of woodstoves entirely was incorporated into local regulations (this was a contingency measure in the SIP). There were four curtailment periods during this season. During 1991-1992, PSAPCA enforced the 20 percent opacity limit and initiated a woodstove trade-in program (4 curtailment periods). During the 1993-1994 and 1994-1995 seasons, local public education programs were conducted, woodstove discount programs were offered, and inspectors targeted specific geographic sectors. There were two curtailment periods in 1993/94, and one in 1994/95. In 1995/96, paid advertisements were used to educate the public on the relationship between stagnant air conditions and air quality. Additional discount programs were offered by dealers to change-out old equipment. Only one curtailment period occurred in 1995/96. PSAPCA feels that a strong public education program was integral to the success of the RWC program. As of 1997, PSAPCA employed five full-time staff in its communication and education department. Prior to 1987, it had none. In two separate efforts aimed at quantifying the effectiveness of the RWC program, both showed significant improvements. The University of WA concluded that curtailments were responsible for reductions in light scattering of 25-35 percent. Lawrence Livermore National Laboratories concluded that wood smoke concentrations dropped by 37 percent in a residential neighborhood. PSAPCA was not able to quantify the effects of the public education program, but believes that part of the reduction of wood burning in the region is a result of the public education program (Sierra, 1997).
• Paved and Unpaved Road Dust Program – this program focused on the control of spillage and dirt/mud track-out onto public roadways. Landowners were prompted to stabilize unpaved roads and parking lots, while municipalities were prompted to improve public roadways by installing shoulders, curbs, and gutters. A requirement under PSAPCA Regulation I, Section 9.15(b) was adopted, which prevented vehicles from operating on public roads unless loads were prevented from spilling and mud/dirt was prevented from being deposited on the roadway.
Unpaved roadways and parking lots were also targeted as part of a larger fugitive dust program. A flyer was developed and distributed to property owners that provided examples of BACT for unpaved areas. Hundreds of property owners in the Seattle and nearby Tacoma NAAs were required to submit dust control plans.
• Industrial Source Program – Sierra (1997) noted that monitored exceedances had only occurred in the industrial areas of the NAA, and that the emission inventory also indicated
Report No. 05.08.004/9429.000 37 Final Report

PECHAN August 5, 2005
that industrial sources were a large contributor. Reductions in actual emissions occurred as a result of fuel conversion and opacity monitoring at two of the larger industrial sources in Seattle. For allowable emissions, banked emission reduction credits were retired and permitted allowable emissions were revised to be closer to actual emission levels. Reductions in fugitive dust emissions also occurred through enforcement of the BACT provision of PSAPCA Regulation I Section 9.15(a) and a prohibition of fugitive dust emissions from process equipment.
Other control programs that contributed to ambient PM10 reductions include Federal programs covering diesel vehicle emissions (lower sulfur fuel, engine standards). Washington law (Chapter 173-422 WAC) requires heavy-duty vehicles registered in the Puget Sound region to pass a snap-idle test. The impact of this program on emissions from the diesel vehicle sector were not quantified and incorporated into the emissions inventory (Sierra, 1997). There are also local and state regulations that cover open burning (land clearing debris and yard waste fires). Prohibitions on burning in areas of specified population density (>1,000/mile2) were paired with efforts to encourage alternatives to burning (chipping, composting, yard waste collection programs). These sources are not expected to contribute to ambient PM10 in the winter months; however, the reductions may have contributed to the negative trends shown in annual and spring season PM10 concentrations (see Section II).
Comparison of Control Program and Ambient Data History. The ambient data summarized in Section II and Appendix A indicate strong negative trends in winter season averages, annual averages, and the 99th percentile 24-hr values. The winter season averages in the post-1996 time-frame are about half those measured during previous years. Most of the reductions are believed to be associated with the implementation of controls on industrial sources, including the clean-up of industrial roadways (leading to lower paved/unpaved road emissions; Anderson, 2005a). The RWC program was fully-implemented by 1996; however, based on land use patterns in the area around the monitor, the reductions at nearby industrial plants are believed to be responsible for most of the measured reductions.
Work by the University of Washington on the trend in light scattering in the Puget Sound Airshed indicated that winter maxima decreased by two-thirds during the 1985 to 1994 time-frame (Sierra, 1997). This represented about a 7 percent/year reduction in light scattering. Over 5 percent/year was attributed to reduced emissions (the remainder to meteorology). Note that the Puget Sound Airshed covers an area larger than just the Duwamish Valley. Therefore, both the RWC program and industrial sources program contributed to these reductions. M. Wallula, Washington The Wallula NAA lies in eastern Washington just north of the Oregon border in the geographic area known as the Columbia Plateau. PM10 attainment problems in Wallula occur in the summer season. Exceedances have been for the 24-hr average, not the annual average standard. The Wallula NAA is generally rural and agricultural. Prominent land uses include dryland and irrigated cropland, industrial sites and native shrub-steppe vegetation. There is only one major
Report No. 05.08.004/9429.000 38 Final Report

PECHAN August 5, 2005
stationary source, a large pulp and paper mill. The NAA is estimated to be 144 square miles in size with a population of about 4,800 (Ecology, 2005). For almost all of the period since monitoring was first started in 1986, Ecology’s monitoring network for the Wallula NAA has consisted of a single monitoring site. This site is referred to in EPA’s AQS database as Nedrow Farm/Wallula Junction (AQS site ID no: 53-071-1001) and more commonly as the Wallula monitoring site. In anticipation of the closure of the Wallula monitoring site, Ecology established two sites as potential replacement sites in late 2002. Wallula Port (AQS site ID no.: 53-071-0003) began operation in November 2002. Burbank (AQS site ID no.: 53-071-0006) began operation in December 2002 (Ecology, 2005). The 2002 attainment emissions inventory for a typical PM10 season day, which occurs from June through September, indicates that most of the emissions come from agricultural tilling (51 percent), a pulp and paper mill (18 percent), small industrial sources (21 percent), paved road dust (6 percent), unpaved road dust (2 percent), and vehicle exhaust (1 percent). Note that these estimates exclude wind-blown dust, which is being covered in a Natural Events Action Plan (NEAP) for eastern Washington. Eight exceedances occurred between 1995 and 2004 that were considered to be natural events (Ecology, 2005). An evaluation of the PM constituents on the filters indicated that the primary sources contributing to the monitored concentrations were agricultural soils, unpaved road dust, and composting (from a pulp and paper mill; Ecology, 2004). The CMB analyses could not distinguish between agricultural soils and unpaved road dust. Ecology also performed BACM analyses on two other sources near the PM monitor – a cattle feedlot and a beef processing plant. EPA’s Natural Events Policy issued in 1996 allows exceedances due to dust raised by high winds to be treated as uncontrollable natural events when the dust originated from nonanthropogenic sources or from anthropogenic sources controlled with BACM. Agricultural BMPs were included in the NEAP as BACM to control wind-blown dust emissions. BACM were also included in the NEAP for controlling agricultural tilling emissions (Ecology, 2003). Details on the NEAP can be found on the Ecology website at http://www.ecy.wa.gov/biblio/0302014.html. For the feedlot operation, Ecology required a revision to the Fugitive Dust Control Plan for the facility. Major features of the revised Fugitive Dust Control Plan include (Ecology, 2004): • A computer-controlled sprinkler system that is operational from April 1 through October 15.
The system allows individual sprinkler run times to be adjusted to maximize water application to minimize dust emissions. The sprinkler system operational plan may use weather data from the U.S. Bureau of Reclamation’s Legrow remote station as a water application guide;
• Cattle pen maintenance performed throughout the year. As needed, excess manure is removed to maintain minimal loose manure;
• Filling of wallows with compacted clay soil and covering with manure; and • Water trucks to control roadway dust.
Report No. 05.08.004/9429.000 39 Final Report

PECHAN August 5, 2005
For unpaved roads, no controls were employed due to the small amount of activity in the vicinity of the monitor. For the pulp and paper mill composting operation, four areas of potential dust generation were identified: vehicle traffic, windrow turning, materials handling and conveyance, and wind. A dust control plan was developed and incorporated into the facility’s Title V operating permit. Comparison of Control Program and Ambient Data History. The ambient data shown in Section II and Appendix A do not show significant trends in PM10 concentrations with the exception of the winter and spring seasons. The negative trends in these seasons cannot be explained on the basis of PM10 SIP measures, since these measures were developed to reduce emissions during the summer season and have only been implemented within the last few years. The Wallula area is significantly impacted by wind-blown dust, and the data shown in Section II have not been corrected to remove values that were driven by wind-blown dust. Given the rather recent implementation of controls in this area, it isn’t possible to draw any conclusions regarding the effectiveness of control programs from the monitoring data at this time. A more detailed review of control program effectiveness was beyond the resources of this project. N. Sheridan, Wyoming Sheridan, WY is located in north-central Wyoming. It was designated as a moderate NAA upon enactment of the CAAA. PM10 is primarily a winter season issue in Sheridan; however only a single exceedance of the 24-hr standard has been monitored (November 1991). Therefore, the control plan focused on demonstrating attainment of the annual standard. The primary source of PM10 is paved road dust (from winter road sanding materials). The City of Sheridan AQMP was submitted to EPA in 1989 (Sheridan, 1989). Additional information was provided to EPA through 1992 and EPA approved the AQMP in June 1994 (59 FR 32360). The AQMP focused on control of emissions from paved road dust. Paved road dust was estimated to contribute 74 percent of the winter PM10 emissions in Sheridan. The only other significant source identified was RWC at 15 percent of the wintertime PM10 emissions. For paved road dust, the Sanding Winter Maintenance Program (SWMP) designated streets to be sanded during the winter season. Included were major streets, hills, school zones, and dangerous intersections. The plan specified limits on road sanding material application (1 ton/lane-mile). This level of sanding had been determined to provide adequate traction. Sanding material specifications were included, which insured use of clean and durable material. A comprehensive street sweeping and flushing program was included to remove material before dust problems occurred. Emission reductions associated with the paved road dust program were estimated to be 19 percent. The mayor of Sheridan approved and adopted the SWMP on February 21, 1989. According to the State’s Attorney General, the SWMP is enforceable by the State if the local agency fails to implement the program. The authority is derived directly from State statute (W.S. 35-11-201, 701 and 901). A contingency plan involving the use of deicing chemicals on certain roadways was also included in the AQMP, as well as a voluntary RWC curtailment program. Neither of these
Report No. 05.08.004/9429.000 40 Final Report

PECHAN August 5, 2005
contingency programs was needed to demonstrate attainment of the PM10 standards by December 1994; however, Wyoming Department of Environmental Quality (WYDEQ) staff mentioned that much of the street sanding materials have been replaced by liquid deicers (Anderson, 2005b). WYDEQ also mentioned that there was significant resentment by the public for certain elements of the SWMP (sanding of only certain areas; limitations on the amount of material applied; both of which affect driving conditions requiring lower speeds). Comparison of Control Program and Ambient Data History. The ambient data provided in Section II and Appendix A show significant downward PM10 trends in Sheridan. The data indicate that the SWMP was successful in achieving reductions in winter season average, annual average, and 24-hr average 99th percentile readings. Since the SWMP began in the post-1990 period, it isn’t clear why there is an apparent reduction in the winter season average concentrations in the post-1995 period. The winter season average in the post-1995 period is about 40 percent lower than previous years. WYDEQ suggested that a significant 7-year drought could also be influencing these measurements (decreased snow requiring less winter sanding; Anderson, 2005b). Also, there has been a trend toward the use of less sanding material and more chemical deicers in Sheridan. No other control measures are believed to be responsible for the measured reductions.
Report No. 05.08.004/9429.000 41 Final Report

PECHAN August 5, 2005
IV. ASSESSMENT OF THE SUCCESS AND LIMITATIONS OF PM10 PLANS FOR VISIBILITY CONTROL IN THE WRAP REGION
The focus of this chapter is to describe the applicability of PM10 SIP controls as visibility controls in the WRAP region. The summary table provided in Section II shows areas that have been successful in reducing ambient PM10 concentrations through the application of SIP measures. Section III provides information on the control measures applied in each area, and their apparent success in achieving reductions in ambient PM10. The material in this chapter provides the reader with additional information that should be helpful in identifying potential control measures for use in regional haze SIPs. The first section of this chapter provides a discussion on the applicability of PM10 control measures for use as regional haze controls. The second section contains two examples of how to use the information in this report in regional haze SIP planning. This information will help the reader to decide which parts of Chapter III to consult for more information on control measures of interest. A. Applicability of WRAP PM10 SIP Measures and Other Control Measures
as Regional Haze Controls The focus of the WRAP PM10 SIP controls has been limited to a relatively small number of primary PM combustion and fugitive dust sources. A notable exception is the SCAB, where controls on secondary PM were instituted in conjunction with their ozone control efforts. Also, although Salt Lake County, UT was not addressed in detail in this report, measures to reduce SO2 emissions were implemented in order to reduce PM10 concentrations. Table IV-1 provides a list of the common source categories addressed in the WRAP PM10 SIPs. Also included are the PM10 SIP areas that addressed each source category. Details and information sources on these control measures were provided in Chapter III. With the exception of the SCAB, WRAP PM10 SIPs have relied on Federal control programs to reduce emissions from mobile sources (e.g., vehicle standards), and. in some cases, state inspections and maintenance programs. For areas such as Phoenix, Wallula and Clark County, it is still somewhat early to determine the effectiveness of many of the programs, since they have only recently been implemented. However, the PM10 SIP measures developed for these areas are some of the best available for fugitive dust (e.g., construction operations, windblown dust, agricultural tilling).
Report No. 05.08.004/9429.000 42 Final Report

PECHAN August 5, 2005
Table IV-1. Common Source Categories Addressed in WRAP PM10 SIPs
Source Category PM10 Area Residential Wood Combustion Juneau, Mammoth Lakes, Denver, Telluride,
Crested Butte, Boise, Bonner, King County, Klamath Falls
Paved Road Dust – primarily resuspended road sanding materials
Mammoth Lakes, Denver, Telluride, Boise, Bonner, Klamath Falls, Sheridan
Paved Road Dust – primarily resuspended road dust
Clark County, Phoenix, King County
Unpaved Road/Parking Lot Dust Juneau, Clark County, King County Agricultural Tilling and Cultivation Phoenix Industrial Operations Denver, Boise, King County Open Burning Boise, Klamath Falls, King County Windblown Dust Clark County, Phoenix Construction Operations Clark County, Phoenix
Other important sources of control program information include a new report by the State and Territorial Air Pollution Program Administrators/Association of Local Air Pollution Control Officials (STAPPA/ALAPCO) on PM controls. As of the date of this report, the new STAPPA/ALAPCO report had not yet been released (the website is located at: http://www.cleanairworld.org). Another important source of information on PM control measures is the compilation developed by the California Air Resources Board (CARB), as required by California Senate Bill 656 (CARB, 2005). This list is provided as Appendix C to this report. The ARB approved this list of the most readily available, feasible, and cost-effective control measures that can be employed by air districts to reduce PM10 and PM2.5. The list is based on rules, regulations, and programs existing in California as of January 1, 2004, for stationary, area-wide, and mobile sources. Control measures cover both primary and secondary PM sources. The listing includes a description of each control measure, source type (existing, new or modified), and the applicable local district rule. The associated staff report also contains information on the cost effectiveness of the control measures (http://www.arb.ca.gov/pm/pmmeasures/pmmeasures.htm). With the exception of the SCAB, control programs aimed at sources of secondary PM have not been a significant part of most WRAP PM10 SIP programs (although RWC, open burning, and some industrial controls do have an impact on secondary PM). [A notable exception is the SO2 control programs implemented in Salt Lake County, UT to reduce ambient PM10.] However, work performed under the WRAP’s Attribution of Haze (AoH) project showed the importance of secondary PM to visibility impairment in the WRAP region. Figure IV-1, taken from the AoH Phase I Report, shows annual 2002 aerosol extinction (bext) by PM species for WRAP Class I areas (units are inverse megameters, Mm-1; ARS, 2005). This figure shows that a large contribution to visibility impairment in the west is made by sulfate, and nitrate, which are primarily secondary PM species (typically emitted from combustion sources). Elemental carbon (EC), also a product of combustion, is a primary species that also contributes significantly at many monitored Class I areas. For many WRAP Class I areas, fine soil and coarse mass (CM; which are both from primary PM sources) contribute less than 30 percent of bext on an annual
Report No. 05.08.004/9429.000 43 Final Report

PECHAN August 5, 2005
basis. Fine soil and CM are most important as regional haze contributors in the southern WRAP Class I areas. Regional haze SIP planners will need to carefully review the available emission inventory and ambient monitoring data to select appropriate control options for their Class I areas and those affected by their State’s emissions. The most current and comprehensive source of emission inventory data for the WRAP is the Emission Data Management System (EDMS): www.wrapedms.org. The system maintains data on point sources and county-level data for non-point sources (i.e., stationary area, nonroad mobile, and onroad mobile). Because the non-point sector data are provided at the county-level, their applicability to analyses for areas in and near Class I areas is limited. In a previous work effort, the Forum developed inventories for “Near Emissions” (emissions nearby Class I areas) based on the 1996 WRAP inventory. Non-point emissions were spatially allocated based on common surrogates (e.g., population, land use). Finally, the National Park Service (NPS) has developed emission inventories and some control recommendations for sources located in 20 national parks. A report for each park can be downloaded from: http://www2.nature.nps.gov/air/aqbasics/inparkemissions.cfm. In assessing control options, SIP planners should be aware that emissions from different source sectors are not equal in terms of their visibility impairing potential. Sources which emit PM precursors (such as SO2 and NOx) have a large potential to impair visibility, but the actual impairment can be highly variable and depends on meteorology and other factors that affect the transformation and transport of these pollutants to Class I areas. Sources which emit primary PM can have a more immediate, nearby, and consistent effect, but the relative impact of each major source sector will still depend on the size and chemical constituents of their primary PM emissions. Table IV-2 provides some examples of the relative visibility impact of primary PM emissions from several sectors. To develop these estimates of bext, Pechan used PM speciation data and PM2.5 fractions from ongoing work on EPA’s SPECIATE database. This database provides the speciation and fine fraction mass for primary emissions from a variety of emission source types. For each sector, these speciation data were applied to 1 µg/m3 of PM10. Methods prescribed by EPA (2003) to estimate bext were applied to estimate the relative visibility impact of introducing 1 µg/m3 of primary PM10 from each source sector. In developing these visibility-impairing potentials, a relative humidity adjustment factor [f(RH)] of 1.8 was applied (about the middle of the range for the summer season in the WRAP region). It is important to note that the additional visibility impact resulting from secondary formation of PM is not captured in this analysis. For example, some VOC emissions may undergo photochemical reactions, and their reaction products can condense to form additional OC. In addition, source sectors with a high relative impact may only be a small portion of the nearby emissions, whereas sources with a lower relative impact may nonetheless contribute more to impairment by being closer to the source. A good example of this would be unpaved road dust. Its relative impact, as shown in Table IV-2, is fairly low; however if the source is located near the monitoring site, its actual visibility impacts can be quite high (i.e., because it is contributing many more µg/m3 than other sources). Receptor modeling can be used to estimate source contributions to the measured ambient PM10 mass.
Report No. 05.08.004/9429.000 44 Final Report

PECHAN August 5, 2005
Table IV-2. Relative Visibility Impacts of Primary PM Emissions
from Several Source Sectors
Fine PM Weight Fractiona
Source Sector OC EC SO4 NO3 SoilbCoarse Mass
Relative Impact per µg/m3
(bext) Gasoline Vehicle Exhaust 0.594 0.164 0.005 0.0006 0.034 0.072 4.8Forest Fires/ Rx Burns 0.754 0.023 0.004 0.0157 0.002 0.111 4.2Diesel Vehicle Exhaust 0.197 0.308 0.010 0.0023 0.008 0.080 4.0RWC 0.529 0.024 0.003 0.0040 0.000 0.037 3.2Construction Soil 0.065 0.004 0.005 0.0006 0.348 0.394 1.0Agricultural Soils 0.043 0.005 0.005 0.0008 0.442 0.778 0.8Unpaved Road Dustc 0.054 0.003 0.007 0.0015 0.416 0.788 0.8Paved Road Dustd 0.123 0.019 0.007 0.0011 0.361 0.831 0.8a Fine and coarse mass fractions do not sum to one. Among the reasons for this – the fine PM species have not been transformed into their assumed chemical compounds (e.g., ammonium nitrate, ammonium sulfate, metal oxides, organic material). However, this transformation was performed to estimate the relative impact. b Soil elements include silicon, iron, titanium, calcium, and aluminum. c Composite PM profile based on profiles from several western States. d Composite of over 100 PM profiles; not specific to resuspension of winter sanding materials, construction track-out, or urban paved road dust.
B. Examples of How to Use this Report and Related Resources for Two
WRAP Class I Areas Regional haze SIP planners can best use the information provided in this report after completing the following steps:
• Review available emissions inventory data for the areas in and near the Class I area; • Review available source apportionment data for monitors in the Class I area; • Review the ambient monitoring data – e.g., assess the contributions to visibility
impairment from the individual PM species, assess the seasonality of visibility impairment, assess the contributions to regional haze on days influenced by natural events (e.g., wildfires, wind-blown dust);
• From the above information, assemble a list of sources contributing to visibility impairment;
• Assess the visibility impairment potential of the contributing source categories (see previous section) and prioritize these for control measure analysis; and
• Review the pertinent sections of Chapter III to gather more information on successful control strategies.
A full example evaluation including all of the elements above was beyond the scope of this project. However, two WRAP Class I areas were selected with differing annual aerosol species contributions to visibility extinction. Brief assessments of the available monitoring data were performed, and the results of these assessments are provided. The two sites are Yosemite NP in California and Saguaro NP (East) in Arizona. Charts showing the contributions of each aerosol species are shown in Figures IV-2 and IV-3.
Report No. 05.08.004/9429.000 45 Final Report

PECHAN August 5, 2005
1. Yosemite NP, CA As shown in Figures IV-1 and IV-2, the contribution of aerosol species to visibility extinction at Yosemite is similar to many areas of the WRAP where organic material (OM) dominates (OM is another measure of OC content; however it incorporates the mass of atoms other than carbon, such as hydrogen, oxygen, and nitrogen). Many Class I areas show a similar pattern of rising OM contributions (and to a lesser extent EC contributions) beginning in the early summer and continuing through most of the fall. As shown in the Phase I AoH report (ARS, 2005), the OC to EC ratio for Yosemite varies between being dominated by biomass burning sources (high ratio) and being dominated by fuel combustion (low ratio). This suggests that both biomass and fuel combustion are important contributors to OM (and EC). It should also be noted that biogenic contributions to OM could also be important during the summer and fall seasons. Figure IV-2 shows that geogenic sources have limited contributions to visibility extinction at Yosemite in 2002 [note that a similar review of aerosol species contribution should be performed for additional years, when data are available, in order to identify situations where episodic sources (e.g., fires) or other anomalies have contributed to very unrepresentative years]. Coarse material and soil contribute only 8 percent of extinction during the 20 percent worst days and 14 percent during the 20 percent best days. During the 20 percent worst visibility days, sulfate contributes 15 percent and nitrate contributes 17 percent to visibility reduction. There are several episodes of elevated extinction during the winter and spring months where nitrate is the dominant contributor. While much of this may be from mobile sources near the park, RWC and other biomass burning emissions could also be contributors. If the nitrate was primarily from biomass combustion, one would expect to see higher OM measurements than nitrate (the OM and EC ratios in these measurements are also about 1:1, which indicates that fossil fuel combustion is still the most important contributor). There are also episodes of elevated nitrate in the October-November time-frame. These may be nitrates associated with biomass burning, which could not form in the summer months since warmer temperatures inhibit the formation of particulate ammonium nitrate. Based on the information above on 2002 monitoring data, biomass burning sources, including RWC and open burning, should be further investigated for implementation of controls (e.g., during winter and spring seasons). Of the visibility baseline data available for Yosemite (2000-2003), 2002 was the year with the largest contribution from OC to the 20 percent worst visibility days, and it was the year with the smallest contribution from EC (recall higher OC/EC ratios imply larger effects from fire). Hence, other years should be examined, as the tendency may be for much of the OC and EC to be from mobile sources. Several of the PM10 areas addressed in the report have focused on biomass burning, but not on mobile sources (with the exception of paved and unpaved road dust, which contains relatively little carbonaceous matter). Therefore, other sources of control measure information, such as the CARB list of PM measures, should be consulted. The CARB list was developed from existing California air district measures. There might be limited applicability of some of the transportation control measures in Appendix C to areas in or
Report No. 05.08.004/9429.000 46 Final Report

PECHAN August 5, 2005
near Class I areas. SIP planners interested in assessing measures targeting the transportation sector should consider measures in the following areas:
• Reduced heavy-duty vehicle idling;
• Required use of ultra low-sulfur diesel fuel;
• Encouraging, and requiring to the extent authorized by law, fleet turnover or the pull-ahead of new technology;
• Using public funds, including, but not limited to, Congestion Mitigation and Air Quality
Improvement Program funds to upgrade, retrofit, or replace heavy-duty engines in local fleets with less polluting alternatives;
• Promoting increased purchase and use by local government agencies of low-emission
vehicles and equipment; and
• Other measures designed to reduce vehicle-miles traveled within and around Class I areas. 2. Saguaro NP (East), AZ The 2002 monitoring data shown in Figures IV-1 and IV-3 indicate that geogenic sources are much more important at Saguaro (East) than at Yosemite. Geogenic sources are sources of soil dust, including paved and unpaved road dust, wind-blown dust, agricultural cultivation, and certain industrial sources (e.g., mining). Geogenic sources contribute to the CM and soil PM fractions measured at monitoring sites. At Saguaro NP (East), CM and soil contribute about 30 percent to extinction on the 20 percent best and worst days. Sulfate is also important, as it contributes about another 30 percent. Although nitrate is shown to contribute 17 percent during the worst days, this appears to be largely influenced by a few days during the winter season. OM and EC contribute almost another third to visibility extinction during the best and worst days. Due to the importance of geogenic sources at Saguaro NP, emissions data for unpaved and paved roads, windblown dust, construction and agricultural activities, and important point source sectors (e.g., mining) should be reviewed. A number of control measures to address these sources have been developed for the Phoenix and Clark County SIPs. Additional control measure options can be found in the CARB measures list (Appendix C). The contributions of sulfate from the mobile and point source sectors needs further evaluation through an examination of available emissions and modeling data. Potentially important point source sectors include coal combustion, primary metals, and heavy-duty diesel engines. The WRAP PM10 SIPs have not addressed point source sulfate/SO2 emissions, but have concentrated on primary PM from point sources (some measures used to reduce PM, such as fuel switching, can also reduce SO2). The CARB list and other control measure information sources should be reviewed (e.g., STAPPA/ALAPCO).
Report No. 05.08.004/9429.000 47 Final Report

PECHAN August 5, 2005
Report No. 05.08.004/9429.000 48 Final Report
Mobile source contributions to sulfate, OM, and EC need further investigation. Figure IV-3 indicates elevated OM:EC ratios during some of the high measurements during the late spring and early summer months. Gasoline vehicles could be an important contributor during these periods. As noted above, the WRAP PM10 SIPs did not address this sector or secondary PM sources in general. Depending on the importance of mobile sources at Saguaro East, the CARB control measures list would serve as a starting point to evaluate control options. Because of the importance of sulfate, measures requiring the use of low sulfur diesel fuel could be important.

PECHAN August 5, 2005
Report No. 05.08.004/9429.000 49 Final Report
Figure IV-1. 2002 Annual Average Aerosol Extinction at WRAP Class I Areas (ARS, 2005)

PECHAN August 5, 2005
Report No. 05.08.004/9429.000 50 Final Report
Figure IV-2. 2002 Aerosol Species Contribution to Extinction at Yosemite NP

N August 5, 2005
Report No. 05.08.004/9429.000 51 Final Report
Figure IV-3. 2002 Aerosol Species Contribution to Extinction at Saguaro NP - East
PECHA

PECHAN August 5, 2005
V. REFERENCES ADEC, 1993. Control Plan for Mendenhall Valley of Juneau, Alaska Department of
Environmental Conservation, May 1993. Anderson, 2005a. J. Anderson, Puget Sound Clean Air Agency, personal communication with S.
Roe, E.H. Pechan & Associates, Inc., June 2005. Anderson, 2005b. T. Anderson, Wyoming Department of Environmental Quality, personal
communication with S. Roe, E.H. Pechan & Associates, Inc., June 2005. ARS, 2005. Attribution of Haze Report (Phase I) Geographic Attribution for the Implementation
of the Regional Haze Rule, Air Resource Specialists, Inc., March 14, 2005. CARB, 2005. Staff Report - Proposed Measures to Reduce Particulate Matter - PM10 and
PM2.5, California Air Resources Board, October 2004. downloaded June 2005 from: http://www.arb.ca.gov/pm/pmmeasures/pmmeasures.htm.
Cassmassi, 2005. J. Cassmassi, South Coast Air Quality Management District, personal
communication with S. Roe, E.H. Pechan & Associates, Inc., May 2005. CDPHE, 2001. PM10 Redesignation Request and Maintenance Plan for the Denver Metropolitan
Area, Air Pollution Control Division, Colorado Department of Public Health and Environment, April 19, 2001.
CDPHE, 2000. PM10 Redesignation Request and Maintenance Plan for the Telluride Area, Air
Pollution Control Division, Colorado Department of Public Health and Environment, March 16, 2000.
CDPHE, 1990. Crested Butte Woodstove Replacement Study Ambient Monitoring Report, Air
Pollution Control Division, Colorado Department of Public Health and Environment, October 31, 1990.
Clark County, 2001. PM10 State Implementation Plan for Clark County, prepared by Clark
County, NV, June 2001, accessed at: http://www.co.clark.nv.us/air_quality/PM10_SIP.htm. Cockrell, 2005. A. Cockrell, Arizona Department of Environmental Quality, personal
communication with S. Roe, E.H. Pechan & Associates, Inc., May 2005. Ecology, 2005. A Plan for Maintaining Particulate Matter (PM10) Ambient Air Quality
Standards in the Wallula PM10 Maintenance Area, Air Quality Program, Washington State Department of Ecology, January 2005.
Ecology, 2004. A Plan for Attaining Particulate Matter (PM10) Ambient Air Quality Standards
in the Wallula Serious Nonattainment Area, Air Quality Program, Washington State Department of Ecology, October 2004.
Report No. 05.08.004/9429.000 52 Final Report

PECHAN August 5, 2005
Ecology, 2003. Columbia Plateau Windblown Dust Natural Events Action Plan, Air Quality
Program, Washington State Department of Ecology, 2003. Edwards, 2005a. A. Edwards, Alaska Department of Environmental Conservation, personal
communication with S. Roe, June 2005. Edwards, 2005b. M. Edwards, Idaho Department of Environmental Quality, personal
communication with S. Roe, June 2005. ENVIRON, 2002. Northern Ada County PM10 SIP Maintenance Plan and Redesignation
Request, prepared by ENVIRON International Corporation, prepared for the Idaho Department of Environmental Quality, September 25, 2002.
EPA, 2002. Technical Support Document, PM10 SIP Revision for Sandpoint, Idaho, U.S.
Environmental Protection Agency, Region 10, May 28, 2002. GBUAPCD, 1995. Progress Report on the Implementation of the Mammoth Lakes Air Quality
Management Plan, Great Basin Unified Air Pollution Control District, April 1995. Jaasma et al, 1991. Jaasma, D.R., M.R. Champion, and M. Gundappa, Field Performance of
Woodburning and Coalburning Applicances in Crested Butte during the1989-1990 Heating Season, Department of Mechanical Engineering, Virginia Polytechnic Institute and State University, April 19, 1991.
Magliano, 2005. K. Magliano, California Air Resources Board, personal communication with S.
Roe, E.H. Pechan & Associates, Inc., May 2005. ODEQ, 2002. A Plan for Maintaining the National Ambient Air Quality Standards for
Particulate Matter (PM10) in Klamath Falls Urban Growth Boundary, Section 4.56 of the State Implementation Plan, Oregon Department of Environmental Quality, March 2002.
Ono, 2005. D. Ono, Great Basin Unified Air Pollution Control District, personal communication
with S. Roe, E.H. Pechan & Associates, Inc., June 2005. Redline, 2005. D. Redline, Idaho Department of Environmental Quality, personal
communication with S. Roe, E.H. Pechan & Associates, Inc., May 2005. SCAQMD, 2003. 2003 Air Quality Management Plan, South Coast Air Quality Management
District, http://www.aqmd.gov/aqmp/AQMD03AQMP.htm, accessed May 2005. Sheridan, 1989. City of Sheridan – Air Quality Maintenance Plan, City of Sheridan, WY,
February 1, 1989.
Report No. 05.08.004/9429.000 53 Final Report

PECHAN August 5, 2005
Sierra, 1997. Redesignation Request and Maintenance Plan for the Seattle, Kent, and Tacoma, Washington PM10 Nonattainment Areas, Sierra Research, Inc., prepared for the Puget Sound Air Pollution Control Agency, October 9, 1997.
Silverstein, 2005. M. Silverstein, Colorado Department of Public Health and Environment,
personal communication with S. Roe, E.H. Pechan & Associates, Inc., May 19, 2005.
Report No. 05.08.004/9429.000 54 Final Report

APPENDIX A. MONITORING DATA SUMMARY CHARTS