Embed Size (px)
Citation preview

Spatial and dietary overlap in the Georges Bankgroundfish community
Lance P. Garrison
Abstract: Patterns in spatial and trophic resource partitioning in the fish community of the Georges Bank region areidentified, accounting for size-based changes in diets. During autumn and spring, this community is divided into geo-graphic assemblages of species that have high spatial overlap. Similarity in spatial distribution is primarily related tosimilarity in depth preferences, and seasonal differences in species composition within assemblages are related to mi-grations. There is also important trophic structure within the Georges Bank community separating predators based uponprey size and location in the water column. Ontogenetic changes in diets are an important feature of the trophic struc-ture in this system, particularly in the major piscivores. Seasonal changes in trophic structure reflect both predator andprey migrations. Dietary overlap among predator types is independent of either spatial overlap or depth preferences.There is spatial segregation within trophic guilds, and this spatial partitioning reduces the potential for exploitativecompetition within this community. Given the observed spatial patterns in trophic structure, the geographic assemblageson Georges Bank may be considered ecologically distinct functional units within this ecosystem.
Résumé: J’ai identifié sur le banc Georges les modes de répartition spatiale et trophique de la communauté de pois-sons en tenant compte des changements dans le régime alimentaire en fonction de la taille. Pendant l’automne et leprintemps, cette communauté est divisée en assemblages géographiques d’espèces qui présentent un fort chevauchementspatial. La similarité dans la distribution spatiale est liée avant tout à la similarité dans les préférences de profondeur,et les différences saisonnières dans la composition spécifique des assemblages sont liées aux migrations. On note aussisur le banc Georges une forte structure trophique qui sépare les prédateurs en fonction de la taille de leurs proies et deleur place dans la colonne d’eau. Les changements ontogénétiques dans le régime alimentaire sont une caractéristiqueimportante de la structure trophique de ce système, particulièrement chez les grands piscivores. Les changements sai-sonniers dans la structure trophique reflètent les migrations à la fois des prédateurs et des proies. Le chevauchementtrophique entre les types de prédateurs est indépendant aussi bien du chevauchement spatial que des préférences deprofondeur. On observe une ségrégation spatiale à l’intérieur des guildes trophiques, et cette répartition spatiale réduitle potentiel d’exploitation concurrentielle au sein de cette communauté. Étant donné les modes spatiaux observés de lastructure trophique, les assemblages géographiques du banc Georges peuvent être considérés comme des unités fonc-tionnelles écologiquement distinctes au sein de ce système.
[Traduit par la Rédaction] Garrison 1691
Introduction
The global crisis in overexploitation of fisheries has re-sulted in calls for multispecies and (or) “ecosystem-based”assessment and management of fish stocks and assemblages(Jennings and Kaiser 1998; National Research Council1999). This stems from the perception that more effectivemanagement requires improved understanding of the ecolog-ical mechanisms controlling population dynamics of ex-ploited stocks (Larkin 1996; National Research Council1999). These include species interactions (e.g., predationand competition), changes in resource availability, or envi-ronmental variation (Fogarty and Murawski 1998; Jenningsand Kaiser 1998). Implementation of multispecies ap-proaches requires improved understanding of the communityecology of fish assemblages that has rarely been explicitlyincorporated into management practices.
Within the last three decades, the Georges Bank fish as-semblage has experienced major changes in species compo-sition associated with fishery exploitation (Fogarty andMurawski 1998). The most notable changes are significantdeclines in commercially exploited gadids and flatfish, an in-crease in elasmobranchs (particularly spiny dogfish), and re-cent dramatic increases in the biomass of small pelagic fish(e.g., Atlantic herring, Fogarty and Murawski 1998). Whilethe decline in heavily exploited species is generally attrib-uted to fishery practices, the concomitant increase in less ex-ploited groups is often associated with putative indirecteffects of fishing and species interactions (Fogarty andMurawski 1998). The hypotheses concerning species inter-actions have generally received little direct examination andremain largely untested.
Spatial and temporal patterns in species distributions me-diate potential trophic interactions. In continental shelf fishcommunities, environmental gradients (e.g., temperature anddepth) influence patterns of species codistribution(Murawski and Finn 1988) and result in regional and subre-gional geographic assemblages (Overholtz and Tyler 1985;Gabriel 1992; Gomes et al. 1995). Seasonal and interannualchanges in species distributions and abundances alter the
Can. J. Fish. Aquat. Sci.57: 1679–1691 (2000) © 2000 NRC Canada
1679
Received March 8, 2000. Accepted May 23, 2000.J15651
L.P. Garrison. Northeast Fisheries Science Center, NationalMarine Fisheries Service, 166 Water St., Woods Hole,MA 02543, U.S.A. e-mail: [email protected]
J:\cjfas\cjfas57\cjfas-08\F00-117.vpMonday, July 17, 2000 8:28:32 AM
Color profile: DisabledComposite Default screen

species composition within these assemblages; however, thegeographic boundaries are consistent over decadal timescales (Gabriel 1992; Gomes et al. 1995). Due to their asso-ciation in space, species in the same assemblages are likelyto interact strongly with one another. Spatial assemblages ofspecies are therefore potentially important ecological units,may have distinct trophic structure, and may respond differ-ently to human activities, environmental variation, orchanges in food resources.
Fish body sizes frequently span four orders of magnitudeacross life history, often resulting in discrete ontogeneticshifts in both habitat use and diet (Werner and Gilliam 1984;Ross 1986). The trophic relationship between species maytherefore change through ontogeny, and the degree of nicheoverlap between two species may also vary ontogenetically(Polis 1984; Piet et al. 1999). An explicit incorporation ofthese size-based differences in resource use is essential toevaluating the spatial and trophic structure of fish assem-blages (e.g., Piet et al. 1999).
In this study, I examined the spatial and trophic structurewithin the fish assemblage of the Georges Bank region andthe relationship between habitat, spatial, and dietary overlapaccounting for size-based changes in resource use. Resourcepartitioning along both spatial and trophic gradients wasevaluated as well as seasonal variation associated withchanges in species distributions and resource availability.Given the observed patterns in spatial and trophic structure, Iexplore the potential for strong competitive interactions inthis community and discuss the implications for ecosystem-based management and assessment on Georges Bank.
Methods
Data sourcesI utilized data from bottom trawl surveys conducted by the
Northeast Fisheries Science Center (NEFSC). The survey em-ployed a stratified random sampling design with strata defined bydepth and latitude. Sample depths ranged from 8 to 400 m. Foreach tow, catch at length (1 cm length-classes) was recorded for allcaptured species. Details of the survey sampling design, execution,and efficiency are available in Azarovitz (1981) and NEFSC (1988).
In addition to catch data, a subset of species were analysed forfood habits data during each cruise. In general, one individual fishfrom each 1-cm size-class of a given target species was examinedat each station. Fish were measured and weighed, total stomachvolume was measured, and the proportional volume of each preytype in the stomach was quantified. Prey items were identified atsea to the lowest possible taxonomic level, focusing on the identifi-cation of fish prey to species. Details of the food habits samplingmethodology are available in NEFSC (http://www.nefsc.nmfs.gov/pbio/fwpd). In the current analysis, fish and squid prey were re-tained at the species level, while invertebrate prey items were typi-cally lumped into family or order groups as appropriate.
The current study included the Georges Bank region as definedby boundaries in faunal assemblages (Gabriel 1992; L.P. Garrison,unpublished data) and included survey strata corresponding to theshelf region south of Cape Cod, Georges Bank, and StellwagenBank (Fig. 1). The time frame included spring (March–April) andautumn (September–October) from 1991 to 1997. These seasonswere best represented in the NEFSC surveys. During this period,865 trawls were collected during the autumn, while 781 trawlswere collected during spring.
Predator categoriesTwenty-seven predator species were evaluated, including two
squid species (Table 1). The predator species were divided intolength categories to account for ontogenetic shifts in diet basedupon historical data and previous analyses (Bowman and Michaels1984; Garrison and Link 2000a). Only those species/size-classeswith greater than 20 nonempty stomachs sampled were included inthe diet analyses.
Resource overlap indexOverlap in resource use along spatial, trophic, and environmen-
tal gradients in the Georges Bank fish community was examined.Schoener’s (1970) index of resource similarity was used for allthree gradients:
(1) Oij = 1 – 0.5(Σ|pik – pjk|)
wherep is the proportion of resource statek for predator typesiand j. In all cases, resource overlap was assessed between predatortypes as defined by the species/size-class combinations notedabove (Table 1).
Abundance data from the NEFSC bottom trawl surveys wereused to identify spatial assemblages in the Georges Bank fish com-munity. The mean biomass of each predator type (species/size-class combination) within 0.25° square grid cells (area = 588 km2)was calculated for each season. The spatial cells were then clus-tered based upon their similarity in species composition using hier-archical agglomerative clustering methods (Pielou 1984). Inaddition, spatial gradients in species composition were examinedusing a detrended correspondence analysis (DCA, Hill and Gauch1980) also based upon 0.25° cells. A spatial overlap matrix be-tween predators was also calculated using the Schoener index (seeeq. 1 above where each grid cell is a resource statek andpik is theproportion of the biomass of predatori in cell k).
Hierarchical agglomerative clustering methods were also used toidentify groups of species with similar diets (Pielou 1984). Re-source overlap was quantified using the Schoener index (eq. 1)wherepik was the mean proportional volume of a prey categorykin the diet of predator typei.
Finally, I calculated overlap in habitat similarity based upon thedepth of occurrence for each species/size-class. Depth is the pri-mary environmental factor driving spatial structure in fish commu-nities in northern habitats and Georges Bank (Overholtz and Tyler1985; Murawski and Finn 1988). Catch data was restratified into10-m depth intervals, and the mean biomass of each species/size-class within each depth interval was calculated. Overlap in habitatsimilarity was calculated as above (eq. 1) wherepik is the meanproportional biomass of predator typei within depth intervalk.
Partial Mantel regression and path analysisTo investigate the relationship between depth overlap (Zij), spa-
tial overlap (Sij), and diet overlap (Dij), I employed partial Mantelregressions after the method described in Smouse et al. (1986) andpath analysis described in Legendre and Legendre (1983) andLegendre and Troussellier (1988). The Mantel correlation indexbetween matrices (Mantel 1967) assesses the proportion of vari-ance in one overlap matrix that is explained by another in a manneranalogous to both Pearson correlation and linear regression meth-ods (Smouse et al. 1986). The partial Mantel regression evaluatesthe relationship between two matrices after accounting for the mu-tual correlation with a third. In the current application, this was ac-complished by first calculating the Mantel correlations between thediet (D), spatial (S), and depth (Z) overlap matrices. Then, the re-sidual matrices were calculated, e.g.,Z|S and D|S, which are theresidual values after the regression ofZ on S andD on S, respec-tively. Finally, the Mantel correlation (Rzd|s) of Z|S on D|S was
© 2000 NRC Canada
1680 Can. J. Fish. Aquat. Sci. Vol. 57, 2000
J:\cjfas\cjfas57\cjfas-08\F00-117.vpMonday, July 17, 2000 8:28:33 AM
Color profile: DisabledComposite Default screen

computed to evaluate the relationship between the depth and dietmatrices after accounting for the influence of the spatial matrix(Smouse et al. 1986).
The partial Mantel regression was used to conduct a path analy-sis of the relationships between the spatial, depth, and dietary over-lap matrices (Legendre and Legendre 1983; Legendre and
Troussellier 1988). Path analysis identifies the causal pathways be-tween multiple explanatory factors. The statistical significance ofthe Mantel coefficients was tested using permutation tests with5000 iterations (Mantel 1967). Due to multiple testing, all signifi-cance tests were assessed at a Bonferroni-corrected alpha value(initial α = 0.05, Legendre and Troussellier 1988).
© 2000 NRC Canada
Garrison 1681
Fig. 1. Map of Georges Bank region showing the bathymetry.
Length category (cm)
Scientific name Common name Small Medium Large Extra large
Squalus acanthias Spiny dogfish 10–36 37–80 >80 —Raja ocellata Winter skate 10–30 31–60 61–80 >80Raja erinacea Little skate 10–30 31–60 61–80 >80Raja radiata Thorny skate 10–30 31–60 61–80 >80Clupea harengus Atlantic herring 10–20 21–30 >30 —Merluccius bilinearis Silver hake 10–20 21–40 >40 —Gadus morhua Atlantic cod 10–20 21–50 51–80 >80Melanogrammus aeglefinus Haddock 10–20 21–50 51–80 >80Pollachius virens Pollock 10–20 21–50 51–80 >80Urophycis tenuis White hake 10–20 21–40 >40 —Urophycis chuss Red hake 10–20 21–40 >40 —Urophycis regia Spotted hake 10–20 21–40 >40 —Paralichthys dentatus Summer flounder 10–20 21–40 41–70 >70Paralichthys oblongus Fourspot flounder 10–20 21–40 41–70 >70Pleuronectes ferrugineus Yellowtail flounder 10–20 21–40 41–70 >70Pleuronectes americanus Winter flounder 10–20 21–40 41–70 >70Scophthalmus aquosus Windowpane 10–20 21–40 41–70 >70Scomber scombrus Atlantic mackerel 10–20 21–35 >35 —Peprilus triacanthus Butterfish 10–20 21–35 >35 —Pomatomus saltatrix Bluefish 10–30 31–70 >70 —Myoxocephalus octodecemspinosus Longhorn sculpin 10–25 26–50 >50 —Hemitripterus americanus Sea raven 10–25 26–50 >50 —Ammodytes dubius Northern sand lance — 10–25 >25 —Macrozoarces americanus Ocean pout 10–30 31–60 61–90 >90Lophius americanus Goosefish 10–30 31–60 61–90 >90Illex illecebrosus Shortfin squid 10–15 16–30 >30 —Loligo pealleii Longfin squid 10–15 16–30 >30 —
Table 1. Length categories for fish and squid species included in the current study.
J:\cjfas\cjfas57\cjfas-08\F00-117.vpMonday, July 17, 2000 8:28:40 AM
Color profile: DisabledComposite Default screen

Results
Spatial assemblages on Georges BankDuring autumn, there were five spatial assemblages on
Georges Bank indicated by both the cluster analysis andDCA (Figs. 2A and 3A). The assemblages included inshoreregions of southern New England (SNE), offshore habitatsof southern New England and south of Georges Bank (OFF),deep habitats on southern Georges Bank (SGB), the mainshallow portion of central Georges Bank (MGB), and thenortheast tip and northern flank of the Georges Bank alongwith the Stellwagen Bank region (NFS) (Fig. 2A). These as-semblage areas clustered together in the DCA space de-scribed by the first two ordination axes that explained 23.9%of the variance in the species abundance data (Fig. 3A). Thefirst axis corresponded to a latitudinal gradient from south-ern to northern areas, while the second axis described adepth gradient from deep to shallow habitats (Fig. 3A).
The SNE assemblage in the autumn was dominated bymedium and large spiny dogfish that together accounted for
80% of the captured biomass (Table 2). Spiny dogfish werenot abundant in the OFF assemblage that was dominated bypelagic species including longfin squid (23.9%), smallbutterfish (26.8%), and Atlantic mackerel (9.4%) along withseveral hakes (Table 2). The SGB assemblage was charac-terized by a mix of pelagic and demersal species includingmedium spiny dogfish (22.6%), small butterfish (16.3%),medium little skate (6.8%), medium red hake (7.4%), andmedium fourspot flounder (6.0%) along with demersal spe-cies such as longhorn sculpin, winter skate, and yellowtailflounder that were rare in the SNE and OFF assemblages(Table 2). In addition to medium spiny dogfish (12.6%), theMGB assemblage was dominated by primarily demersal spe-cies including medium, large, and extra large winter skate(totaling 28.2 %) and medium little skate (7.6%). The MGBassemblage was also characterized by northern species suchas Atlantic cod, winter skate, windowpane, winter flounder,and sea raven (Table 2). Finally, the NFS assemblage wasalso dominated by spiny dogfish (medium and large, total51.1%) but was characterized by high biomass of medium
© 2000 NRC Canada
1682 Can. J. Fish. Aquat. Sci. Vol. 57, 2000
Fig. 2. Map of spatial assemblage structure in the Georges Bank region during (A) autumn and (B) spring.
J:\cjfas\cjfas57\cjfas-08\F00-117.vpMonday, July 17, 2000 8:28:47 AM
Color profile: DisabledComposite Default screen

Atlantic herring (9.6%) along with medium and large had-dock (9.1%), in contrast with other assemblages (Table 2).
During spring, there were four spatial assemblages onGeorges Bank that were identified in both the cluster analy-sis and DCA (Figs. 2B and 3B). The autumn SGB assem-blage combined with the SNE assemblage during springreflecting seasonal movements of migratory species such asspiny dogfish and Atlantic herring. The first two DCA axesaccounted for 30.9% of the species variance. The first axisreflected a depth gradient from shallow to deep habitats,while the second axis reflected a latitudinal gradient fromsouthern to northern regions (Fig. 3B).
The spring SNE and OFF assemblages were both domi-nated by medium and large spiny dogfish, accounting for62.8 and 71.3% of captured biomass, respectively (Table 3).Small and medium Atlantic herring were also important inboth assemblages, accounting for a total of 8.1% of the bio-mass in SNE and 4.8% in OFF. However, the SNE assem-blage was also characterized by a high proportion ofmedium little skate (10.5%), while the OFF assemblage was
characterized by medium silver hake (5.2%), Atlantic mack-erel (medium and large, total 6.6%), small butterfish (2.3%),and longfin squid (total 2.5%). The MGB assemblage had arelatively low proportion of spiny dogfish (21.3%) and wascharacterized by northern demersal species including me-dium, large, and extra large winter skate (total 26%), largeand medium haddock (total 13.9%), and large cod (7.6%)(Table 3). Finally, the spring NFS assemblage was dominatedby medium and large spiny dogfish (total 34.9%) and the ga-dids including Atlantic cod (total of all size-classes 13.8%),haddock (total 7.8%), and pollock (total 13%) (Table 3).
Dietary guilds on Georges Bank
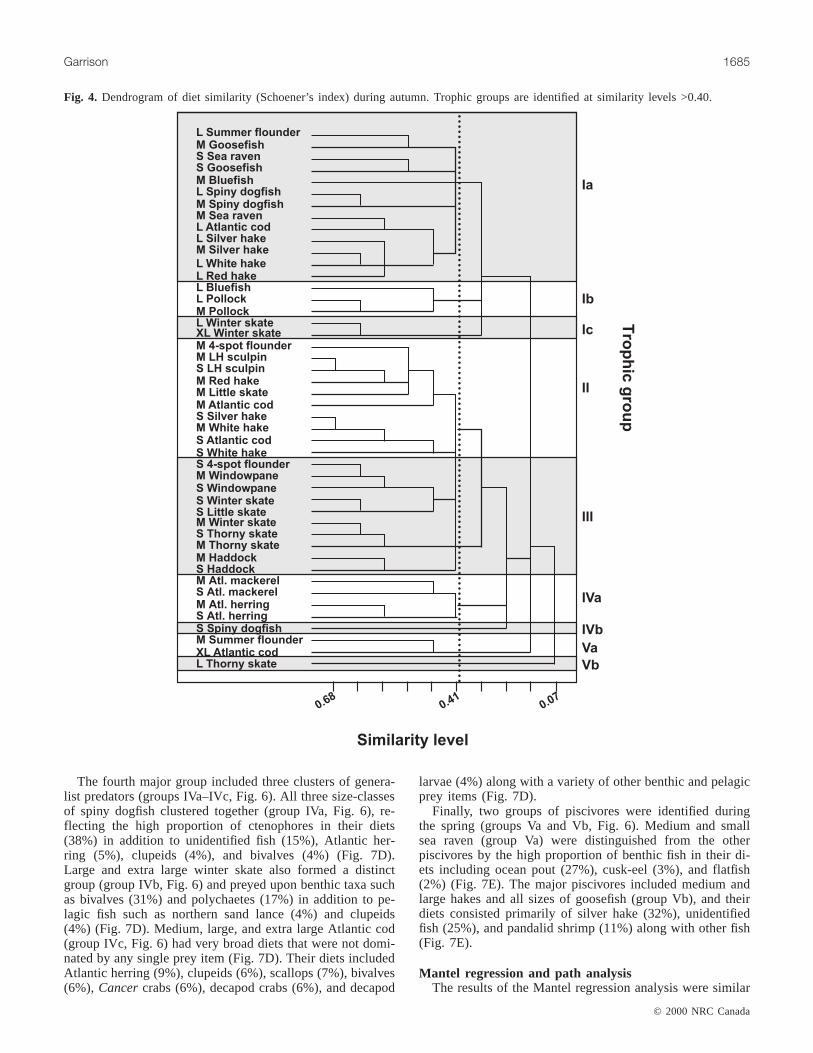
Autumn diet groupsThe autumn diet analysis identified nine species groups
that clustered together at similarity levels greater than 40%(Fig. 4). These groups were broadly categorized into five
© 2000 NRC Canada
Garrison 1683
Fig. 3. DCA identifying spatial patterns in species compositionon Georges Bank during (A) autumn and (B) spring. Each pointin the DCA plot represents a 0.25° square grid cell. Symbolscorrespond to assemblages identified in Fig. 2:m, SNE; r,OFF; ., SGB (autumn);j, MGB; d, NFS.
Species SNE OFF SGB MGB NFS
M spiny dogfish 54.4 T 22.6 12.6 40.3L spiny dogfish 23.8 T — 4.4 10.8M little skate 5.3 5.7 6.8 7.6 —S longfin squid 3.4 23.9 1.2 4.9 —S butterfish 2.7 26.8 16.3 4.6 TM winter flounder 2.0 — T 3.0 1.8M fourspot flounder 1.1 3.3 6.0 T —S Atlantic mackerel — 9.4 0.9 T —M shortfin squid — 4.9 2.5 0.8 TM silver hake 0.5 4.3 5.7 2.3 1.7M red hake T 3.9 7.4 1.5 2.7M longfin squid 0.9 2.7 T 1.4 —M goosefish T 2.4 T T TM spotted hake T 2.2 T — —S shortfin squid — 2.1 T T TM bluefish 0.7 1.4 — 1.1 —S longhorn sculpin — T 5.0 1.5 1.5M winter skate 0.7 T 4.2 9.1 1.1M longhorn sculpin — — 4.0 2.8 3.8M yellowtail flounder T T 3.0 2.2 0.7XL winter skate T — 2.6 11.0 TS spiny dogfish — T 2.4 — —L winter skate T — 2.0 8.1 0.8M Atlantic herring — T T 4.5 9.6L Atlantic cod — — T 2.2 3.2M windowpane T — — 2.1 —M Atlantic mackerel — 0.6 T 2.0 TS Atlantic herring T — — 1.5 TM sea raven T — 0.7 1.1 1.0L winter flounder — — T 1.1 TM haddock — — T T 6.7L haddock — — T — 2.3M Atlantic cod — — — T 2.0M pollock — — — — 1.0
Note: Size-classes: S, small; M, medium; L, large; XL, extra large (seeTable 1). Only species accounting for≥0.5 % of biomass in any assemblageare included. T, <0.5% biomass; missing value, <0.01% biomass.
Table 2. Species composition (percentage of biomass) in autumnspatial assemblages.
J:\cjfas\cjfas57\cjfas-08\F00-117.vpMonday, July 17, 2000 8:28:50 AM
Color profile: DisabledComposite Default screen

major trophic groups including piscivores, shrimp predators,demersal predators, planktivores, and crab predators (Fig. 4).
The piscivores included three groups (groups Ia–Ic). Themajor piscivores included large size-classes of spiny dogfish,Atlantic cod, several hake species, and all size-classes ofgoosefish and sea raven (group Ia) (Fig. 4). Their diets con-sisted primarily of unidentified fish (27%), Atlantic herring(11%), and silver hake (8%) (Fig. 5A). Large and mediumpollock and large bluefish formed a distinct cluster (groupIb, Fig. 4), and their diets had high proportions of Atlanticherring (31%) in addition to northern sand lance (7%),squids (totaling 10%), and euphausiids (5%) (Fig. 5A).Large and extra large winter skate were also piscivorous(group Ic, Fig. 4), consuming northern sand lance (10%), sil-ver hake (6%), and Atlantic herring (4%) in addition to ben-thic invertebrates including polychaetes (17%) and bivalves(16%) (Fig. 5A).
The shrimp predators included medium and small size-classes of demersal fish including hakes, little skate, long-horn sculpin, and Atlantic cod (group II, Fig. 4). These pred-ators fed primarily upon shrimp taxa including pandalids(14%) and crangonids (8%) as well as other small pelagic
prey such as silver hake (13%) and decapod larvae (5%).Their diets also included several benthic taxa such asCancercrabs (7%) and gammarid amphipods (5%) (Fig. 5B).
The demersal predators included skates, flatfish, and had-dock (group III, Fig. 4) that feed primarily upon benthicinvertebrates. Their diets were composed of gammarid am-phipods (16%) and polychaetes (10%) along with severalother benthic taxa including isopods, asteroides, andCancercrabs. These predators also consumed shrimp taxa, in partic-ular crangonids (10%) (Fig. 5C).
The pelagic predators included the primary planktivores,Atlantic herring and Atlantic mackerel, along with smallspiny dogfish (groups IVa and IVb, respectively, Fig. 4). Theplanktivores consumed a suite of small pelagic prey includ-ing larvaceans (17%), hyperiid amphipods (11%), eu-phausiids (10%), and mysids (9%) (Fig. 5D). Small spinydogfish was unique in that a high proportion of its diet com-prised ctenophores (42%) and cephalopods (16%) (Fig. 5D).
Finally, the crab predators included large demersal preda-tors in two small groups separating medium summer floun-der and extra large Atlantic cod (group Va) from largethorny skate (group Vb) (Fig. 4). Both Atlantic cod andsummer flounder diets included a large proportion ofCancercrabs (55%) along withLoligo squid (16%) and other taxa(Fig. 5E). Large thorny skate diets included a very high pro-portion of polychaetes (69%) along with decapod crabs(16%) (Fig. 5E).
Spring diet groupsDuring spring, 10 trophic groups were identified that clus-
tered together at a similarity level greater than 32% andwere broadly categorized as shrimp/amphipod predators(group I), pelagic predators (groups IIa and IIb), demersalpredators (groups IIIa and IIIb), generalists (groups IVa–IVc), and piscivores (groups Va and Vb) (Fig. 6).
The shrimp/amphipod predator group was a diverse suiteof predators including small hakes, small Atlantic cod, sev-eral skate species, and demersal taxa such as longhorn scul-pin and fourspot flounder (group I, Fig. 6). The diets ofthese species were very broad and included both benthic andpelagic invertebrates. Their diets primarily comprisedgammarid amphipods (23%), pandalid shrimp (10%),crangonid shrimp (8%), polychaetes (5%), andCancercrabs(5%) (Fig. 7A).
The second major group included both shrimp predators(group IIa) and planktivores (group IIb) that fed upon smallpelagic prey (Fig. 6). The shrimp predators includedwindowpane and medium and large pollock, and their dietsconsisted of primarily euphausiids (33%), mysids (15%),and pandalid shrimp (10%) (Fig. 7B). The planktivores in-cluded both Atlantic herring and Atlantic mackerel whoseprey were primarily copepods (21%) and larvaceans (11%)and included a high proportion of unidentified animal re-mains (34%) (Fig. 7B).
The demersal predators included flatfish, thorny skate,and haddock that fed primarily upon small benthic inverte-brates (groups IIIa and IIIb, Fig. 6). The flatfish and skate(group IIIa, Fig. 6) consumed polychaetes (59%) andgammarid amphipods (12%), and haddock (group IIIb,Fig. 6) diets consisted primarily of amphipods (69%) andpolychaetes (20%).
© 2000 NRC Canada
1684 Can. J. Fish. Aquat. Sci. Vol. 57, 2000
Species SNE OFF MGB NFS
M spiny dogfish 47.8 48.5 14.7 22.1L spiny dogfish 15.0 22.8 6.6 12.8M little skate 10.5 0.7 8.2 1.0M Atlantic herring 4.8 4.2 1.4 4.5S Atlantic herring 3.3 0.6 T TM ocean pout 2.5 T 0.8 2.6M winter skate 1.8 — 9.5 1.1M silver hake 1.4 5.2 T 0.6M longhorn sculpin 1.4 — 4.8 2.5S little skate 1.2 — T —L ocean pout 1.0 — 2.4 2.0M Atlantic mackerel 0.6 3.8 T TL Atlantic mackerel T 2.8 T TS butterfish T 2.3 — —S spiny dogfish — 1.9 — —M fourspot flounder T 1.7 — TS longfin squid — 1.5 — —M longfin squid T 1.0 — —XL winter skate T — 8.9 1.4L haddock T — 8.8 3.6L winter skate 0.6 — 7.6 0.7L Atlantic cod 0.6 — 7.0 5.5M haddock T — 5.1 4.2XL Atlantic cod T — 2.6 3.7S longhorn sculpin 0.7 — 2.0 2.6M yellowtail flounder 0.9 — 1.7 1.8M sea raven 0.7 — 1.4 3.0L pollock — — T 7.5M pollock — — T 5.5M Atlantic cod — — 0.8 4.6M winter flounder T — 0.7 1.5
Note: Size-classes: S, small; M, medium; L, large; XL, extra large (seeTable 1). Only species accounting for≥0.5 % of biomass in any assemblageare included. T, <0.5% biomass; missing value, <0.01% biomass.
Table 3. Species composition (percentage of biomass) in springspatial assemblages.
J:\cjfas\cjfas57\cjfas-08\F00-117.vpMonday, July 17, 2000 8:28:51 AM
Color profile: DisabledComposite Default screen
The fourth major group included three clusters of genera-list predators (groups IVa–IVc, Fig. 6). All three size-classesof spiny dogfish clustered together (group IVa, Fig. 6), re-flecting the high proportion of ctenophores in their diets(38%) in addition to unidentified fish (15%), Atlantic her-ring (5%), clupeids (4%), and bivalves (4%) (Fig. 7D).Large and extra large winter skate also formed a distinctgroup (group IVb, Fig. 6) and preyed upon benthic taxa suchas bivalves (31%) and polychaetes (17%) in addition to pe-lagic fish such as northern sand lance (4%) and clupeids(4%) (Fig. 7D). Medium, large, and extra large Atlantic cod(group IVc, Fig. 6) had very broad diets that were not domi-nated by any single prey item (Fig. 7D). Their diets includedAtlantic herring (9%), clupeids (6%), scallops (7%), bivalves(6%), Cancercrabs (6%), decapod crabs (6%), and decapod
larvae (4%) along with a variety of other benthic and pelagicprey items (Fig. 7D).
Finally, two groups of piscivores were identified duringthe spring (groups Va and Vb, Fig. 6). Medium and smallsea raven (group Va) were distinguished from the otherpiscivores by the high proportion of benthic fish in their di-ets including ocean pout (27%), cusk-eel (3%), and flatfish(2%) (Fig. 7E). The major piscivores included medium andlarge hakes and all sizes of goosefish (group Vb), and theirdiets consisted primarily of silver hake (32%), unidentifiedfish (25%), and pandalid shrimp (11%) along with other fish(Fig. 7E).
Mantel regression and path analysisThe results of the Mantel regression analysis were similar
© 2000 NRC Canada
Garrison 1685
Fig. 4. Dendrogram of diet similarity (Schoener’s index) during autumn. Trophic groups are identified at similarity levels >0.40.
J:\cjfas\cjfas57\cjfas-08\F00-117.vpMonday, July 17, 2000 8:28:54 AM
Color profile: DisabledComposite Default screen

for both seasons. In both autumn and spring, approximately58% of the variance in the spatial overlap matrix was ex-plained by similarity in depth preferences among predators,and this was a highly significant, positive relationship (Ta-ble 4). In both seasons, the diet overlap matrix was unrelatedto both the depth and spatial overlap matrices (Table 4).There was no correlation between similarity in the use ofspatial resources and that of trophic resources.
Spatial and trophic resource partitioningPatterns in spatial and trophic resource use were further
examined by assessing the relative abundance of majortrophic groups within spatial assemblages during each sea-son (Fig. 8). There were strong spatial differences in the pre-dominant trophic group within the Georges Bank region.During autumn, the SNE assemblage was dominated primar-ily piscivorous species (Fig. 8A), primarily large and me-dium spiny dogfish (Table 2). In contrast, the autumn OFF
assemblage was dominated by small pelagic predators(Fig. 8A), primarily longfin squid, butterfish, and Atlanticmackerel (Table 2). Note that while small sample sizes inthe current analysis precluded the inclusion of both squidsand butterfish in the diet analyses, these species are pelagicpredators feeding primarily upon small fish, squids, and zoo-plankton based upon data from earlier years where they wereadequately sampled (Garrison and Link 2000a). Both theMGB and SGB assemblages contained a more diverse suiteof predators including shrimp predators, piscivores, and pe-lagic predators (Fig. 8A). The SGB assemblage biomass wasevenly distributed among piscivores (spiny dogfish), shrimppredators (medium silver and red hake and longhorn sculpinand medium little skate), and pelagic predators (butterfish)(Table 3). The MGB assemblage had a higher proportion ofdemersal predators than other assemblages, primarily me-dium winter skate and flatfish (Fig. 8A). The MGB pisci-vores were dominated by large winter skate (Table 3), in
© 2000 NRC Canada
1686 Can. J. Fish. Aquat. Sci. Vol. 57, 2000
Fig. 5. Mean diet composition of five major trophic groups (Fig. 4) during autumn: (A) piscivores, (B) shrimp predators, (C) demersalpredators, (D) pelagic predators, and (E) crab predators.
J:\cjfas\cjfas57\cjfas-08\F00-117.vpMonday, July 17, 2000 8:29:00 AM
Color profile: DisabledComposite Default screen

contrast with the other assemblages. The NFS assemblagealso had a high proportion of piscivores, again reflectinghigh spiny dogfish biomass (Table 2), and it also had highbiomass of planktivores (primarily Atlantic herring, Table 2)and demersal predators (primarily haddock, Table 2; Fig. 8A).
During spring, patterns in spatial and trophic resource usewere different from those during autumn, and these gener-ally reflected seasonal changes in spatial distribution and di-ets of dominant species. Primarily, the generalist trophicguild replaced the piscivores as the dominant group and be-came the most important biomass component in both theSNE and OFF assemblages (Fig. 8B). This reflects both the
seasonal shift away from piscivory (Figs. 4 and 6) and asouthward and offshore migration of medium and largespiny dogfish (Table 3). The planktivores, primarily Atlanticherring (Table 3), were also important in the SNE assem-blage during spring. In addition to the generalist spinydogfish, the OFF assemblage was dominated by shrimp/amphipod predators (medium silver hake, Table 3) and theplanktivores including Atlantic herring, Atlantic mackerel,and butterfish (Fig. 8B; Table 3). The spring MGB assem-blage was also dominated by generalists, and these includedlarge winter skate (total 16.5%) and Atlantic cod (total 10%)in addition to medium and large spiny dogfish (total 21.3%)
© 2000 NRC Canada
Garrison 1687
Fig. 6. Dendrogram of diet similarity (Schoener’s index) during spring. Trophic groups are identified at similarity levels >0.34.
J:\cjfas\cjfas57\cjfas-08\F00-117.vpMonday, July 17, 2000 8:29:04 AM
Color profile: DisabledComposite Default screen

(Table 3). Both shrimp/amphipod feeders (medium winterand little skate, total 17.7%) and demersal predators (had-dock, total 13%) were more important on MGB than insouthern and deeper habitats (Fig. 8B). The spring NFS as-semblage also included a diverse suite of predators, againdominated primarily by spiny dogfish (35%) but includedAtlantic cod (9.2%) (Table 3). The pelagic predators wereprimarily the shrimp predator pollock (13%), while the de-mersal predators were represented by haddock (7.8%) (Ta-ble 3; Fig. 8B).
Discussion
Spatial structure on Georges BankDepth gradients strongly influence the spatial distribution
of fish taxa on Georges Bank and result in species co-distribution and geographic assemblages. In addition, thereis a latitudinal gradient in species composition, reflecting
both temperature gradients and the broader geographic dis-tribution of component species. These spatial patterns areconsistent with broad-scale regional assemblages in thenorthwest Atlantic (Gabriel 1992).
Despite the major changes in species composition, theboundaries of geographic assemblages on Georges Bank areremarkably similar to those observed in autumn during theperiod from 1963 to 1978 (Overholtz and Tyler 1985). How-ever, changes in species abundances and spatial distributionsthrough time have resulted in shifts in species compositionwithin assemblages. For example, haddock was a numericaldominant in four of five assemblages in the analysis ofOverholtz and Tyler (1985), but it is only present in the au-tumn NFS assemblage in the current study. In contrast, spinydogfish was never a numerical dominant in any assemblageduring the earlier time period (Overholtz and Tyler 1985),but it dominates the biomass of most assemblages duringboth seasons in the current study. These changes in spatial
© 2000 NRC Canada
1688 Can. J. Fish. Aquat. Sci. Vol. 57, 2000
Fig. 7. Mean diet composition of five major trophic groups (Fig. 6) during spring: (A) shrimp/amphipod predators, (B) pelagic preda-tors, (C) benthivores, (D) generalists, and (E) piscivores.
J:\cjfas\cjfas57\cjfas-08\F00-117.vpMonday, July 17, 2000 8:29:09 AM
Color profile: DisabledComposite Default screen

distribution are related to changes in population sizes. Ashaddock populations have declined through time, they havebecome more concentrated on the northeast peak of GeorgesBank. Conversely, the general increase in spiny dogfish pop-ulations over the last three decades has been accompaniedby an expansion of ranges (Garrison and Link 2000b). Thisis consistent with patterns observed in other continentalshelf fish assemblages where the geographic area covered bya stock is related to the stock size (Atkinson et al. 1997).Changes in spatial distribution may also be associated withgenerally warmer bottom temperatures in the northwest At-lantic during the 1990s relative to the 1960s (Holzwarth andMountain 1990).
The geographic boundaries of spatial assemblages onGeorges Bank are also consistent over seasonal time scales.The only major seasonal difference is the incorporation ofthe autumn southern flank assemblage into the spring south-ern New England assemblage. However, there were majorseasonal changes in species composition within assem-blages, reflecting the migration of dominant species.
During autumn, medium and large spiny dogfish wereabsent from the offshore assemblage and were by far thebiomass dominants in the SNE and NFB assemblages, ac-counting for 78 and 51% of the total biomass, respectively.During spring, spiny dogfish migrated south and offshore.They remained dominant in SNE and became the biomassdominant in the OFF assemblage, accounting for 71% of thetotal biomass. Given the extremely high biomass of this spe-cies and their predatory nature, these patterns impart a sig-nificant seasonal change in the predator field within thesegeographic regions.
Seasonal migrations also impact the prey field within spa-tial assemblages. During autumn, Atlantic herring is presentonly in the northern assemblages, while during spring, At-lantic herring expands its range south and becomes impor-tant in the SNE and OFF assemblages. Longfin squid andbutterfish are also only seasonally abundant in the GeorgesBank region. They are broadly distributed across GeorgesBank and southern New England during autumn and domi-
nate the biomass of the offshore and southern flank assem-blages. During spring, these species migrate to deeper habi-tats beyond the range of the survey and are present only inthe offshore assemblage. Seasonal migrations have a signifi-cant impact on the trophic structure within assemblages.
Trophic structure on Georges BankThe major trophic groups (piscivores, demersal predators,
shrimp predators, etc.) identified in the Georges Bank fishcommunity reflect broad patterns in prey preferences. Mem-bers of these groups consume similar prey at broad taxo-nomic levels (e.g., fish) or within a similar habitat type (e.g.,demersal predators feed upon a variety of benthic inverte-brates). These major groups reflect gradients in predatorfeeding and habitat. In general, there is segregation amongthe fish community between predators consuming small ver-sus large prey (e.g., invertebrates versus fish) and benthicversus pelagic prey (e.g., polychaetes versus euphausiids).These gradients are consistent with both patterns observed atlarger scales within the northwest Atlantic (Garrison andLink 2000a) and patterns of resource utilization for fishcommunities in general (Ross 1986).
At a lower hierarchical level, subgroups cluster together atsimilarity levels greater than 40% during autumn and 34%during spring. These reflect resource partitioning at a moredetailed taxonomic level. For example, within the piscivoresduring autumn, predators with a majority of their diet com-prising Atlantic herring are distinguished from the majorpiscivores that consume a broader suite of prey. The similar-ity levels that define these groups are comparable with thoseobserved both at a broader spatial scale including the entirenortheast U.S. continental shelf (Garrison and Link 2000a)and in different time periods on Georges Bank (Garrison andLink 2000b).
There are significant seasonal changes in the trophicstructure in this community associated with both predatorand prey movements. The most striking seasonal differenceis the addition of the generalist groups during spring. Duringautumn, the members of this group were piscivores (large
© 2000 NRC Canada
Garrison 1689
Regression Z SP β r Path
Fall surveysDepth (Z) × space (S) 39.42 13.71 0.37 0.58***Z × diet (D) 62.69 2.18 0.06 0.08 ns DepthS × D 25.14 0.22 0.01 0.01 ns(Z × S)|D 13.70 13.70 0.88 0.58*** Space(Z × D)|S 1.99 1.99 0.08 0.08 ns Diet(S × D)|Z 0.62 0.62 0.06 0.04 nsSpring surveysZ × S 30.89 11.52 0.32 0.57***Z × D 49.85 1.47 0.04 0.05 ns DepthS × D 17.59 0.38 0.03 0.02 ns(Z × S)|D 11.50 11.50 1.0 0.57*** Space(Z × D)|S 1.08 1.08 0.04 0.04 ns Diet(S × D)|Z 0.09 0.09 0.01 0.01 ns
Note: Forty-six predators were included in the autumn analysis, and 43 predators were included in the springanalysis.Z, Mantel correlation coefficient; SP, sum of products;β, regression parameter;r, standardized Mantelcoefficient. Statistical significance of Mantel coefficients tested by permutation tests (5000 permutations, Mantel 1967)at the Bonferroni-correctedα = 0.05/6 = 0.0083. ***p < 0.001; ns,p > 0.01.
Table 4. Partial Mantel regression and path analysis.
J:\cjfas\cjfas57\cjfas-08\F00-117.vpMonday, July 17, 2000 8:29:09 AM
Color profile: DisabledComposite Default screen

and extra large winter skate, large and medium spiny dog-fish, large Atlantic cod), crab predators (extra large Atlanticcod), shrimp predators (medium Atlantic cod), or plankti-vores (small spiny dogfish). The most notable change in thediets of the piscivores is a decline in the importance of fishprey. For example, large Atlantic cod diets were 67% fishprey during the autumn and only 24% during the spring.Large winter skate diets were 35% fish in the autumn and16% in the spring. Atlantic herring was the most importantprey item for the major piscivores aside from unidentifiedfish during autumn. However, in the spring, silver hake be-came the major prey. These seasonal changes in piscivorediets are related to seasonal movements of major prey. Forexample, Atlantic herring undergo seasonal migrations asnoted above.
With reduced availability of fish prey, the large predatorsin this system incorporate a broader range of prey into theirdiets. Atlantic cod, for example, has a very broad diet duringthe spring including both benthic and pelagic prey of allsizes. Predator movements have similar results, e.g., in-creases in the importance of ctenophores in large and me-dium spiny dogfish diets are associated with their southernand offshore migration during spring. Most predators in this
system exhibit highly plastic diets that appear to be stronglyrelated to patterns in prey availability.
Ontogenetic diet shifts are also a major feature of thetrophic structure in this community. The piscivores in thissystem, including spiny dogfish, silver hake, Atlantic cod,winter skate, and white hake, are piscivorous only in largersize-classes, while they prey upon shrimp-like taxa or smallbenthic invertebrates in small sizes. Size-based differencesin diets are less pronounced in predators feeding at lowertrophic levels (i.e., flatfish), and there are several importantpredators (e.g., goosefish and sea raven) that are piscivorousin all sizes. The ontogenetic shifts in diet are generally notrelated to major changes in habitat; all size-classes of mostof these species are found in the same assemblage. Rather,these shifts are likely related to changes in body size andpredator morphology. Shifts in diets with body size are a fre-quent occurrence in fish systems, particularly in piscivorousspecies (Werner and Gilliam 1984). Given that the speciesshowing strong ontogenetic diet shifts are also biomassdominants, the changes in the functional role of these spe-cies through life history are an important component of thetrophic dynamics of this system.
Resource partitioning on Georges BankFish communities typically partition resources across spa-
tial, temporal, and trophic dimensions (Ross 1986). Dif-fering patterns of resource use along multiple dimensionsmay reflect the influence of competition in structuring spe-cies assemblages (Schoener 1974; Pianka 1980; Ross 1986).Where competition is important (i.e., resources limit popula-tions), species with high overlap in resource use along onedimension (e.g., high dietary overlap) should have a lowoverlap in resource use along a second dimension (e.g., lowspatial overlap) to avoid the negative effects of interactions(Schoener 1974; Pianka 1980). Evidence of such “nichecomplimentarity” suggests the importance of competition(Ross 1986). In assemblages where species are from a broadrange of taxonomic histories, overlap should vary with re-source availability and the abundance of potential competi-tors (Ross 1986). Under these conditions, competition is anactive mechanism influencing spatial distributions, speciesinteractions, and population dynamics of component species.Such active shifts in resource overlap under varying resourceconditions were recently demonstrated by Piet et al. (1999)in an assemblage of tropical fish.
Although depth gradients are important in determining thespatial overlap between species on Georges Bank, the Man-tel regression analysis demonstrates that dietary overlap isindependent of spatial patterns. If competition were a strongfactor influencing spatial and trophic structure, then wewould expect a strong negative relationship between spatialand dietary overlap. Direct competition for food resourceshas been hypothesized as a cause for apparent indirect ef-fects of overexploitation in this system, specifically the in-crease in elasmobranchs during the decline in gadid andflatfish populations (Fogarty and Murawski 1998). Dietaryoverlap has been cited as evidence for a potential competi-tive interaction between these groups (Fogarty andMurawski 1998). The more detailed analysis in the currentstudy does not support this hypothesis and suggests that
© 2000 NRC Canada
1690 Can. J. Fish. Aquat. Sci. Vol. 57, 2000
Fig. 8. Proportion of total biomass in each spatial assemblage bymajor trophic group during (A) autumn and (B) spring.
J:\cjfas\cjfas57\cjfas-08\F00-117.vpMonday, July 17, 2000 8:29:12 AM
Color profile: DisabledComposite Default screen

strong exploitative competition is not an important factordriving spatial and trophic structure on Georges Bank.
Community structure and ecosystem managementThe strong spatial differences in trophic structure on
Georges Bank reflect differences in species membership andbiomass dominance among the spatial assemblages. Associ-ated with these patterns are differences in the complexity offood webs, the strength of species interactions, and the re-sulting energy and biomass flow in this system. For exam-ple, single trophic groups dominate the offshore andsouthern New England assemblages in the fall, whereas thetrophic complexity on the southern flank and main portionof Georges Bank is higher and includes a more diversegroup of species at multiple trophic levels. Along with thesespatial gradients in community structure, there is strong sea-sonal variation in both predator and prey spatial distributionsand the resulting interactions between species. While tradi-tional fisheries models typically aggregate single speciesstocks at regional or larger scales, the current analysis dem-onstrates that the ecological structure within this communityvaries at the subregional level. The spatial assemblages onGeorges Bank may be considered ecologically distinct func-tional units within the larger community. Ecosystem ap-proaches to fisheries assessment and management shouldexplicitly account for these spatial and temporal differencesin community structure.
Acknowledgements
The author recognizes the outstanding work of the staff ofthe Resource Survey Branch and the Food Web DynamicsProgram at the Northeast Fisheries Science Center in thecollection and maintenance of the NEFSC trawl survey andfood habits databases, particularly the past work of R. Roun-tree, K. Bolles, B. Kaminer, C. Milliken, and R. Yetter in theFood Web Dynamics Program. I thank J. Link and M.Tercerio for thoughtful reviews and K. Garrison for insightand support. Financial support for the author was providedby a National Research Council postdoctoral associateship.
References
Atkinson, D.B., Rose, G.A., Murphy, E.F., and Bishop, C.A. 1997.Distribution changes and abundance of northern cod (Gadusmorhua), 1981–1993. Can. J. Fish. Aquat. Sci.54(Suppl. 1):132–138.
Azarovitz, T.R. 1981. A brief historical review of the Woods HoleLaboratory trawl survey time series.In Bottom trawl surveys.Edited by W.G. Doubleday and D. Rivard. Can. Spec. Publ.Fish. Aquat. Sci. No. 58. pp. 62–67.
Bowman, R.E., and Michaels, W.L. 1984. Food of seventeen spe-cies of northwest Atlantic fish. NOAA Tech. Memo. NMFS-F/NEC-28.
Fogarty, M.J., and Murawski, S.A. 1998. Large-scale disturbanceand the structure of marine systems: fishery impacts on GeorgesBank. Ecol. Appl.8: S6–S22.
Gabriel, W. 1992. Persistence of demersal fish assemblages be-tween Cape Hatteras and Nova Scotia, Northwest Atlantic. J.Northwest Atl. Fish. Sci.14: 29–46.
Garrison, L.P., and Link, J.S. 2000a. Dietary guild structure in thefish community of the United States northeast continental shelfecosystem. Mar. Ecol. Prog. Ser. In press.
Garrison, L.P., and Link, J.S. 2000b. Fishing effects on spatial dis-tribution and trophic guild structure in the Georges Bank fishcommunity. ICES J. Mar. Sci.57. In press.
Gomes, M.C., Haedrich, R.L., and Villagarcia, M.G. 1995. Spatialand temporal changes on the north-east Newfoundland/LabradorShelf, north-west Atlantic, 1978–1991. Fish. Oceanogr.4: 85–101.
Hill, M.O., and Gauch, H.G. 1980. Detrended correspondence anal-ysis, an improved ordination technique. Vegetatio,42: 47–58.
Holzwarth, T., and Mountain, D.G. 1990. Surface and bottom tem-perature distributions from the Northeast Fisheries Science Cen-ter spring and fall bottom trawl survey program, 1963–1987.NEFSC CRD 90-03. Northeast Fisheries Science Center, WoodsHole, Mass.
Jennings, S., and Kaiser, M.J. 1998. The effects of fishing on ma-rine ecosystems. Adv. Mar. Biol.34: 203–352.
Larkin, P.A. 1996. Principles of ecosystem management of fisher-ies. Rev. Fish Biol. Fish.6: 139–164.
Legendre, P., and Legendre, L. 1983. Numerical ecology. Dev. En-viron. Model. Vol. 3. Elseiver, Berlin.
Legendre, P., and Troussellier, M. 1988. Aquatic heterotrophic bac-teria: modeling in the presence of spatial autocorrelation.Limnol. Oceanogr.33: 1055–1067.
Mantel, N. 1967. The detection of disease clustering and a general-ized regression approach. Cancer Res.27: 209–220.
Murawski, S.A., and Finn, J.T. 1988. Biological basis for mixed-species fisheries: species codistribution in relation to environmen-tal and biotic variables. Can. J. Fish. Aquat. Sci.45: 1720–1735.
National Research Council. 1999. Sustaining marine fisheries. Na-tional Academy Press, Washington, D.C.
NESFC. 1988. An evaluation of the bottom trawl survey programof the Northeast Fisheries Science Center. NOAA Tech. Memo.NMFS-F/NEC-52.
Overholtz, W.J., and Tyler, A.V. 1985. Long-term responses of thedemersal fish assemblages of Georges Bank. Fish. Bull. U.S.83:507–520.
Pianka, E.R. 1980. Guild structure in desert lizards. Oikos,35:194–201.
Pielou, E.C. 1984. The interpretation of ecological data: a primeron classification and ordination. John Wiley & Sons, New York.
Piet, G.J., Piet, J.S., Guruge, W.A.H.P., Vijverberg, J., and VanDensen, W.L.T. 1999. Resource partitioning along three nichedimensions in a size-structured tropical fish assemblage. Can. J.Fish. Aquat. Sci.56: 1241–1254.
Polis, G.A. 1984. Age structure component of niche width andintraspecific resource partitioning: can age groups function asecological species? Am. Nat.123: 541–546.
Ross, S.T. 1986. Resource partitioning in fish assemblages: a re-view of field studies. Copeia,1986: 352–368.
Schoener, T.W. 1970. Non-synchronous spatial overlap of lizardsin patchy habitats. Ecology,51: 408–418.
Schoener, T.W. 1974. Resource partitioning in ecological commu-nities. Science (Washington, D.C.),185: 27–39.
Smouse, P.E., Long, J.C., and Sokal, R.C. 1986. Multiple regres-sion and correlation extensions of the Mantel test of matrix cor-respondence. Syst. Zool.35: 627–632.
Werner, E.E., and Gilliam, J.F. 1984. The ontogenetic niche andspecies interactions in size-structured populations. Annu. Rev.Ecol. Syst.15: 393–425.
© 2000 NRC Canada
Garrison 1691
J:\cjfas\cjfas57\cjfas-08\F00-117.vpMonday, July 17, 2000 8:29:12 AM
Color profile: DisabledComposite Default screen