Embed Size (px)
Citation preview

y
'-~
~.
~~
""
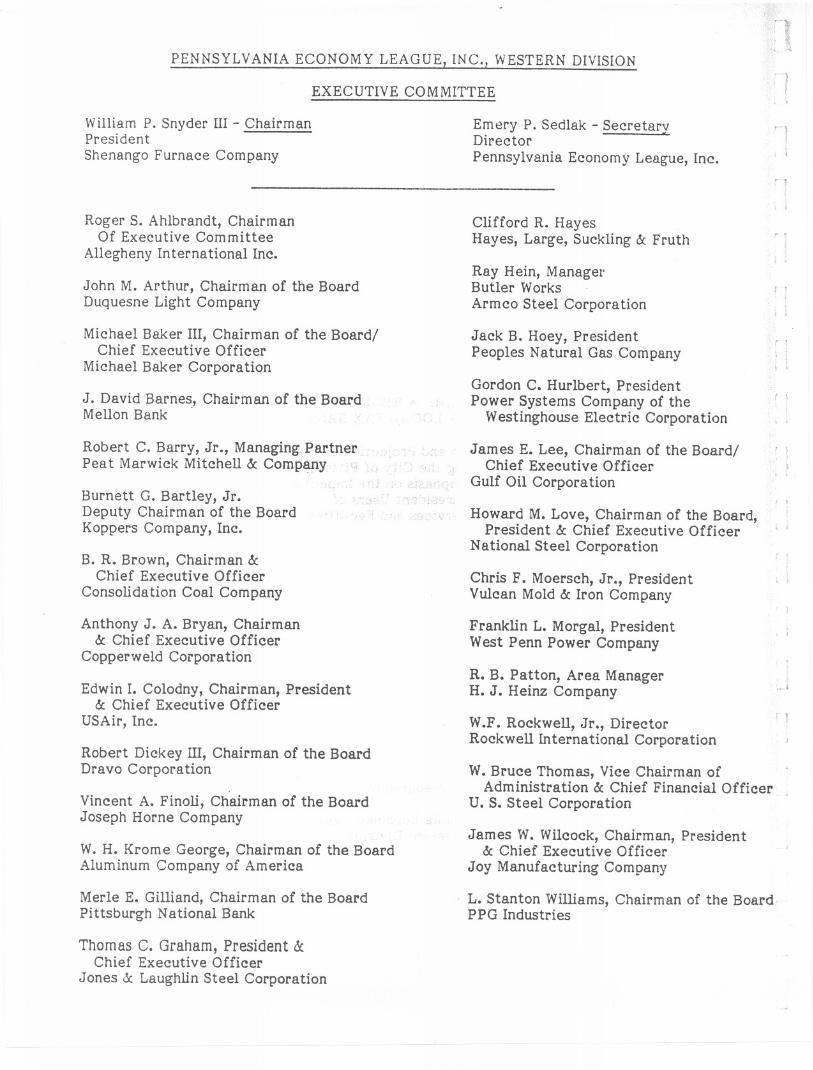
PENNSYLVANIA ECONOMY LEAGUE, INC., WESTERN DIVISION
EXECUTIVE COMMITTEE
William P. Snyder III - ChairmanPresident -Shenango Furnace Company
Emery P. Sedlak - SecretaryDirectorPennsylvania Economy League, Inc.
Roger S. Ahlbrandt, ChairmanOf Executive Committee
Allegheny International Inc.
John M. Arthur, Chairman of the BoardDuquesne Light Company
Michael Baker III, Chairman of the Board/Chief Executive Officer
Michael Baker Corporation
J. David Barnes, Chairman of the Board.Mellon Bank.
Robert C. Barry, Jr., Managing.Partner..Peat MarwickMitchell &:CompanY
Burnett G. Bartley, Jr.Deputy Chairman of the BoardKoppers Company,Inc.
B. R. Brown, Chairman &:Chief Executive Officer
Consolidation Coal Company
Anthony J. A. Bryan, Chairman&:Chief Executive Officer
Copperweld Corporation
EdwinI. Colodny,Chairman, President&:Chief Executive Officer
USAir,Inc.
Robert Dickey III, Chairman of the BoardDravo Corporation
Vincent A. Finoli, Chairman of the BoardJoseph Horne Company
W. H. Krome George, Chairman of the BoardAluminum Company of America
Merle E. Gilliand, Chairman of the BoardPittsburgh National Bank
Thomas C. Graham, President l(Chief Executive Officer
Jones &:Laughlin Steel Corporation
~-~
Clifford R. HayesHayes, Large, Suckling&:Fruth
Ray Hein, ManagerButler WorksArmco Steel Corporation
I '
Jack B. Hoey, PresidentPeoples Natural Gas Company
r
Gordon C. Hurlbert, PresidentPower Systems Companyof the
WestinghouseElectric Corporation
James E. Lee, Chairman of the Board/Chief Executive Officer
Gulf Oil Corporation
Howard M. Love, Chairman of the Board,President &:Chief Executive Officer
National Steel Corporation
Chris F. Moersch, Jr., PresidentVulcan Mold &:Iron Company
Franklin L. Morgal, PresidentWest Penn Power Company
R. B. Patton, Area ManagerH. J. Heinz Company
W.F. Rockwell, Jr., DirectorRockwell International Corporation
i !
W. Bruce Thomas, Vice Chairman ofAdministration &:Chief Financial Officer. ,
U. S. Steel Corporation
James W. Wilcock, Chairman, President&:Chief Executive Officer
Joy Manufacturing Company
L. Stanton Williams, Chairman of the Board.PPG Industries

PITTSBURGH: A REGIONAL CITYWITH A LOCAL TAX BASE
An Examination and Projection of the FiscalProblems Facing the City of Pittsburgh With
Special Emphasis on the Impact ofNonresident Users of
City Services and Facilities
i.
Prepared by
The Pennsylvania Economy League, Inc.Western Division
October 1982
~---~

~ '
l.
!it
I ,
PENNSYLVANIA ECONOMY LEAGUE, INC.WESTERN DIVISION
TAX STUDY COMMITTEE
PhillipD. McFarren - ChairmanStaff Tax Administrator
United States Steel Corporation
Phil A. Crawford, Area ManagerConsolidation Coal Company
James O. Ellenberger, Manager ofGeneral Accounting
Duquesne Light Company
John Foerster, Assistant Treasurerand Director of Taxes
Allegheny International, Inc.
Mark P. Lansinger, Tax ManagerPittsburgh National Bank
J. T. Lord, Tax Counsel- Stateand Local Taxes
Westinghouse Electric Corporation
Ted H. Miller, DirectorTaxes - CompliancePPG Industries, Inc.
Darius A. Nickerson, General Tax AttorneyJones & LaughlinSteel Corporation
Scott O'Mara, Tax OfficerMellon Bank
B. Frank Spicer, AdministratorSpecial Projections - Tax DepartmentAluminum Company of America

PENNSYLVANIA ECONOMY LEAGUE, INC.
WESTERN DIVISION
Emery P. Sedlak, Director
PROJECT STAFF
James W. Turner - Project ManagerDr. David K. Hamilton -Project Consultant
John J. Stickle - Research AssociateJudith A. Eves -Research Associate
Laura S. Simmons- Research Associate
,
-' ,
CLERICAL SUPPORT STAFF
Cecilia R. SeibertKatherine Y. Beitle
, -
r -
f .,
L
f 'L
I
L
l .!iL
L
I!t .
PENNSYLVANlA ECONOMY LEAGUE. INC.WESTERN DIVISION
TWO GATEWAY CENTERPITTSBURGH. PENNSYLVANIA 15222
412 - 471-1477
=MERY P. SEDLAK October, 1982DIRECTOR
The Honorable Richard S. CaliguiriMayor, City of PittsburghCity-County BuildingPittsburgh, Pennsylvania 15219
Dear ~ayor Caliguiri:
The Pennsylvania Economy League, Inc., is pleased to present the following three-part report which details some of the financial problems facing the City of Pittsburgh andrecommends a number of items for your consideration to keep Pittsburgh fiscally sound.
The first part of the report, Phase I, is a financial review and projection of theCity's operating funds. The League concluded that under the current revenue andexpenditure patterns, the City will face a cumulative deficit of $197 million by 1986.
The second part of the study, Phase IT, is a cost/revenue analysis of the impact ofnonresident workers, shoppers and users of City services and facilities. For the most part,this effort concentrated on three "regional areas" of the City (Downtown, Oakland, LowerNorth Side) used heavily by both residents and nonresidents.
The League undertook numerous surveys in order to develop a basis upon which bothcosts and revenues ~ould be allocated between residents and nonresidents. The surveysdocumented the extensive nonresident use of City services and facilities.
The League found that the maximum annual nonresident revenue contribution of$9.1 million was significantly less than the $15.8 million annual cost for services providedto nonresidents. It must be pointed out that the revenue estimate included both direct andindirect contributions while the expenditure calculation did not include the cost of manyservices financed from non-local funds such as Federal Highway aid.
In this second report the League also found that:
- Pittsburgh has an unusually large commuting workforce;
- of the 30 most populous cities, only Boston and San Francisco cover a smallergeographic area;
- a typical Pittsburgh family has a relatively high tax burden;
- Pittsburgh has unusually restrictive taxing powers with respect to nonresidents;
- a substantial amount of the City's most valuable property is tax-exempt.

The Honorable Richard S. Caliguiri Page 2 October, 1982
The third report, Phase ill, is an evaluation of selected ways to help resolve thefiscal problems facing the City. As a result of this analysis, the League has made fivebroad conclusions and recommendations for your consideration and review. Theseconclusions and recommendations cover the following areas:
1. Cost Control- A reduction in the annual growth rate of expenditures fromthe current 10.5 percent to a recommended 8 percent would still leave theCity facing a cumulative deficit of $96 million by 1986.
2. Increased Nonresident Revenue -The City will require broader taxingpowers to face its financial problems. The League's evaluation indicatedthat either a nonresident wage tax or the City's share of a local sales taxlevied on a County-wide or regional basis are reasonable means by which theCity can be reimbursed for services provided to nonresidents.
3. Tax-Exempt Property - City taxpayers suffer an unfair burden as a result ofthe tendency of tax-exempt facilities to concentrate in the Center City.Additional analysis is required to determine a reasonable way by which theCity can be equitably reimbursed for services renderea to tax-exemptfacilities.
4. Increased User Fees -Additional revenues can and should come from userfees. The League recommends that the City examine the user fee structurein the Water Department, the Department of Parks and Recreation, and theBureau of Building Inspection.
Transfer of Services - The League recommends that the City explore thefeasibility of transferring selected park facilities to the County oralternatively, having the County make a contribution to the City for themaintenance of regional park facilities. In addition, the feasibility of sellingthe water plant to either a private concern or an authority of some typeshould be explored.
5.
The majority of the research and writing of this report was carried out by James W.Turner, Project Manager. Dr. David K. Hamilton co-authored the writing and research ofthe second report dealing with the impact of nonresidents. The League research was ablyassisted through the extensive efforts of the League's Tax Study Committee.
The League is pleased to have had the opportunity to be of service to assist theCity in preparing to meet the financial challenges which loom ahead. It is hoped that thematerial presented in this report will assist the City in continuing its critical role as thecenter of the metropolitan area.
EPS/cs
!!gelY, Jb:!:H-£::i!1"-/.ki-r1gJ!:
Erne?:)'. Sedlak "
'""
'1,j
.- !i!
:1
["1
'j,I
, 1
!
qI
~l
. ,..1..
J
]'1,.1
, jj
.J
'-1j
ro,
~
r'!
f'j
1
J'
L
I:
L~
!L
irLA
!i.~
L
<, >
TABLE OF CONTENTS
LETTER OF TRANSMITTAL
PHASE I -
EXECUTIVE SUMMARY
PHASE II-
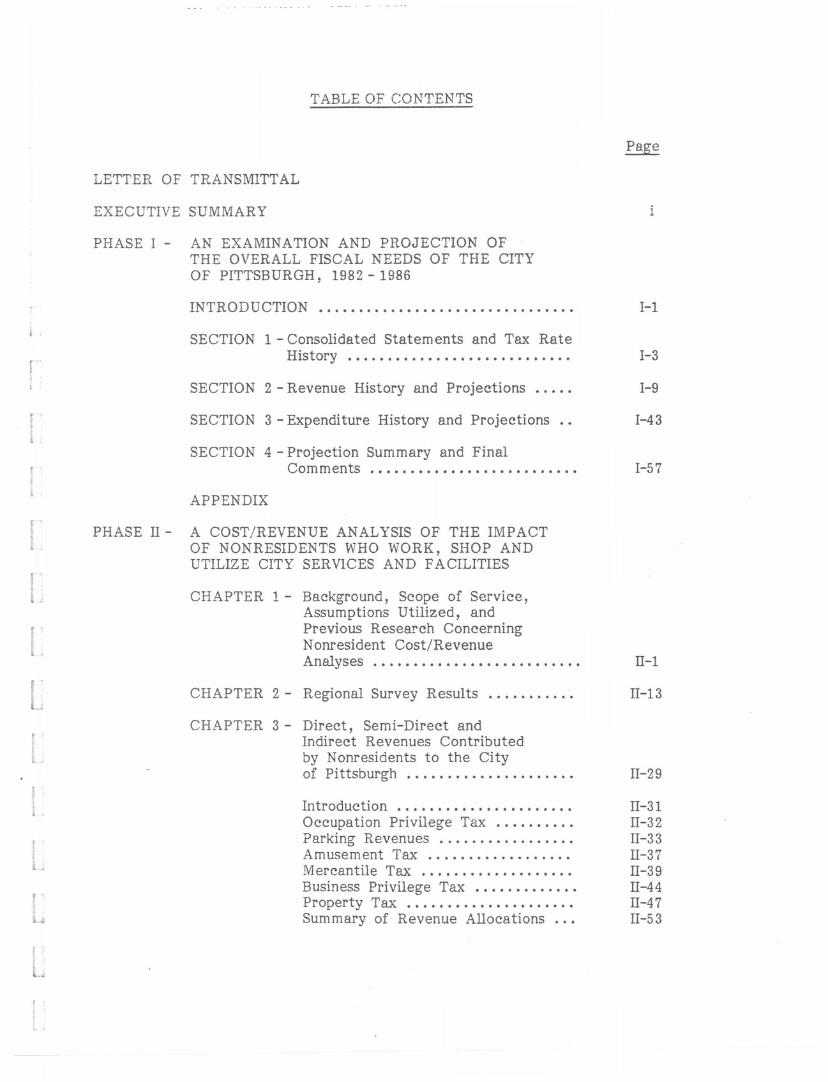
AN EXAMINATION AND PROJECTION OFTHE OVERALL FISCAL NEEDS OF THE CITYOF PITTSBURGH, 1982 - 1986
INTRODUCTION. . . . . . . . . . . . . . . . . . . . . . . . . . . . . . . .
SECTION 1 -Consolidated Statements and Tax RateHistory. . . . . . . . . . . . . . . . . . . . . . . . . . . .
SECTION 2 -Revenue History and Projections.....
SECTION 3 -Expenditure History and Projections..
SECTION 4 -Projection Summary and FinalComments. . . . . . . . . . . . . . . . . . . . . . . . . .
APPENDIX
A COST/REVENUE ANALYSIS OF THE IMPACTOF NONRESIDENTS WHO WORK, SHOP ANDUTILIZE CITY SERVICES AND FACILITIES
CHAPTER 1 - Background, Scope of Service,Assumptions Utilized, andPrevious Research ConcerningNonresident Cost/RevenueAnalyses. . . . . . . . . . . . . . . . . . . . . . . . . .
CHAPTER 2 - RegionalSurveyResults...........
CHAPTER 3 - Direct, Semi-Direct andIndirect Revenues Contributedby Nonresidents to the Cityof Pittsburgh.....................
Introduction. . . . . . . . . . . . . . . . . . . . . .OccupationPrivilege Tax..........Parking Revenues.................AmusementTax ..................Mercantile Tax ...................BusinessPrivilege Tax.............Property Tax .....................Summary of Revenue Allocations...
Page
I-I
1-3
1-9
1-43
I-57
II-I
II-13
II-29
II-31II-32II-33II-37II-39II-44II-47II-53

TABLE OF CONTENTS (Continued)
CHAPTER 4 - Costs Attributed to Nonresidentsas a Result of Services Providedby the City of Pittsburgh.........
Direct and Indirect Costs ofProvidingServices................Police Department................Fire Department :.................Public Works.....................Parks and Recreation.............EmergencyMedicalServices.......PlanningDepartment..............Street Lighting...................Carnegie Library..................City Development.................Commissionon HumanRelations...Capi tal Costs""""""""""""Summary of ?xpendi tures ..........
CHAPTER 5 - Other Considerations..............
Other Considerations..............FinalWord.......................
FOOTNOTESTO PHASE II......................
APPENDICES
PHASE III - AN EVALUATION OF SELECTED ALTERNATIVEMETHODS OF FINANCING THE FISCAL NEEDSOF THE CITY OF PITTSBURGH
INTRODUCTION. . . . . . . . . . . . . . . . . . . . . . . . . . . . . . . .
CHAPTER I - Review of Tax Criteria............
CHAPTER 2 - The Impact of a NonresidentWage Tax ........................
CHAPTER 3 - The Use of a Local Sales Tax .....CHAPTER 4 - The Impact of Tax-Exempt Real
Esta te ...........................CHAPTER 5 - User Fees........................
CHAPTER 6 - Transferring Functions.............
CHAPTER 7 - Conclusions and Recommendations..
FOOTNOTESTO PHASE III ......................",
~l, I
r~l!;
Page:1
!j.
II-55 "-1!I
II-57II-63II-69II-74II-82II-8SII-89II-92II-93II-94II-95II-96
II-lO5
. ;Ij,
~"Jj
. !,
,I
II-IO7
II-lO9II-U5
" ~
\. .1II-U6
-- 1
, it j
, J
III-I,..3
III-3
III-9
III-I 9
III-33
III-43
III-49
III-55
III-68

Executive Summary
, ;
PITTSBURGH: A REGIONAL CITYWITH A LOCAL TAX BASE
I .
An Examination and Projection of the FiscalProblems Facing the City of Pittsburgh With
Special Emphasis on the Impact ofNonresident Users of
City Services and Facilities
,E
i .
Prepared by
, . The Pennsylvania Economy League, Inc.Western Division
, .
. ~ October 1982
, ,
('
I
l .,IL'
Introduction
This report represents, in summary form, the findings of a three-part series which
examines the overall fiscal problems facing the City of Pittsburgh.
The first part, Phase I, examines and projects the expected revenue/expenditure
gap the City will face over the next five years.
The second report, Phase ll, is .a cost/revenue analysis of the impact of nonresident
workers, shoppers and users of City services and facilities.
The third report, Phase Ill, evaluates the impact of a number of alternatives which
the League recommends that the City should consider to help close the anticipated
revenue/expenditure gap.

Phase I - Fiscal Analysis and Projections
Phase I - Conclusion
The League's analysis of the City's operating funds indicates that if expenditures
continue to grow at their current rate of approximately 10.5 percent annually, the City
will face a cumulative deficit of $197 million by 1986. If the City is successful in
reducing its expenditure growth rate to 8.0 percent, it will still face a cumulative
revenue/expenditure gap of $96 million by 1986. However, if the City is not successful in
controlling costs, and the annual growth rate of expenditures increases to 13.0 percent,
the League projects a cumulative deficit in excess of $300 million by 1986.
Revenue AS2ects
The period from 1970 to 1978 represents a rather remarkable period of financial
stability for Pittsburgh. During this time, the real estate tax was reduced, the earned
income tax was eliminated for a period of three years and the retail trade component of
the mercantile tax was reduced. All other taxes remained constant.
Since 1978, however, a number of taxes have increased, including: the real estate
tax (from 31.5 to 55.0 mills); the earned income tax (from 1.0 percent to 2.125 percent);
the real estate transfer tax (from 1.0 percent to 1.5 percent); the business privilege tax
(from 5 to 6 mills); the retail trade tax (from 1 to 2 mills); and the parking tax (from 20
percent to 25 percent). The increase in these tax rates is at least partially explained by a
number of factors including: high inflation, cutbacks in Federal revenues and increased
capi tal spending.
Another reason for the increase in rates is that there is very little natural growth
in the tax revenue without changing the rates. The natural revenue growth has been only
about 3 percent annually since 1970. The growth in the real estate tax has been
particularly flat. Between 1970 and 1981, the assessed valuation of the City grew at an
ii
~J
!1, j)
~j
r1!!1
, 1
..~~!
. J
" .
. ~~!, I
,. .
. 1~
annual rate of less than 1 percent. This partially explains why the City has placed a
greater emphasis on the earned income tax, whose revenues tend to increase without a
rate increase.
Expenditure Trends
Overall, the City experienced an average annual growth of 10.5 percent in its
operating expenditures between 1976 and 1981. This is in sharp contrast to the natural
increase of approximately 3 percent in tax revenues.
Not surprisingly, the Police and Fire Departments' expenditures constitute the bulk
of the total departmental expenditures.. While the Police and Fire Departments are the
largest, their annual growth rates of 8.9 percent and 7.7 percent respectively are less than
many others. The fastest growing department has been the Planning Department (16.1
percent annually). This growth is primarily due to the increased responsibility and
increased funds associated with the Community Development Block Grant program. Other, '
major departments with a high growth rate of expenditures include the Controller's Office
! '!
(14.5 percent), the Supplies Department (11.5 percent), the Water Department (9.8
percent), and Council and City Clerk's Office (9.6 percent).
In addition to departmental expenditures, the fastest growing non-departmental
expenditures include Workers and Unemployment Compensation (17.7 percent annually),
Social Security (14.8 percent annually) and Group and Health Insurances (12.8 percent
annually).
Based upon this data, the League has projected revenues through 1986 using the
current 1982 tax rates. Against these revenue projections, the League has developed
three sets of expenditure projections as shown in Table 1.
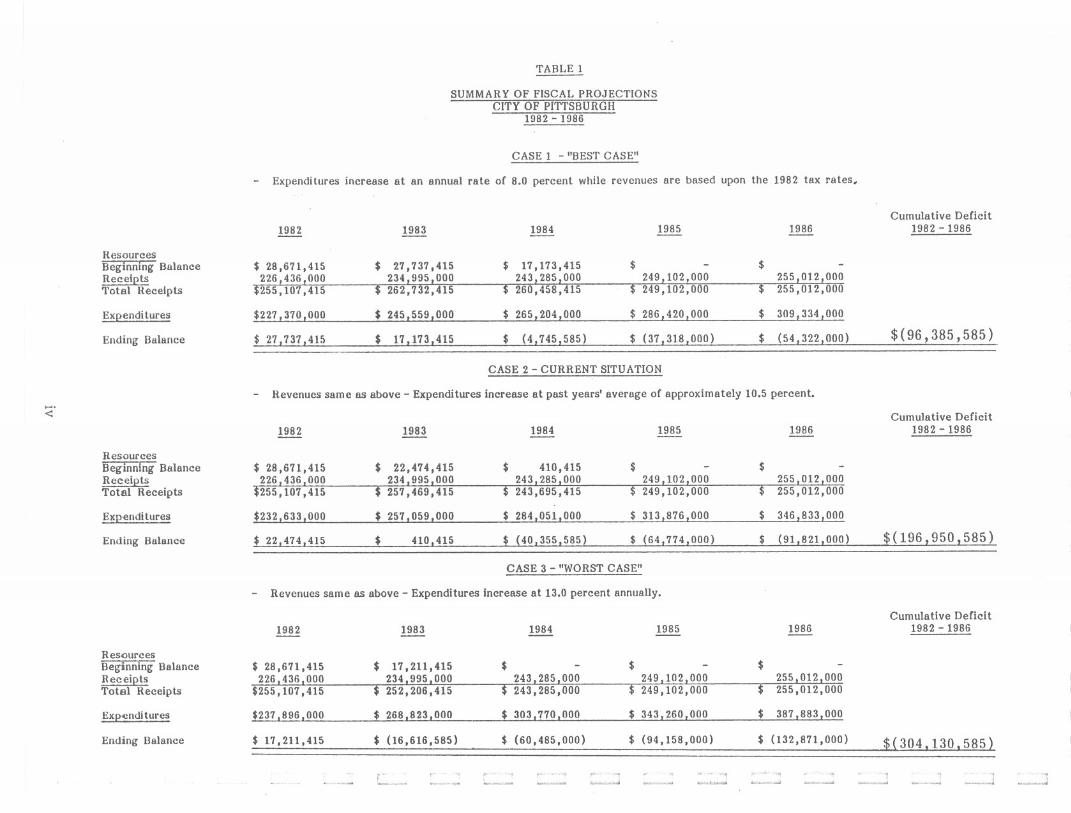
Case 1 of Table 1 represents, in many ways, a "best case" scenario. The revenues
are taken from the League's projections and are based upon the 1982 tax rates. On the
expenditure side, it is assumed that the City is able to reduce the annual growth rate in
Hi
ResourcesBeginning BalanceReceiptsTotal Receipts
EXQenditures
Ending Balance
......<:
ResourcesBeginning BalanceReceiptsTotal Receipts
E~QtJIIQi tll!"~
Ending Balance
ResourcesBeginning BalanceReceiptsTotal Receipts
Ex~Q!~ures
Ending Balance
TABLE 1
SUMMARY OF FISCAL PROJECTIONSCITY OF PITTSBURGH
1982 - 1986
CASE 1 - "BEST CASE"
- Expenditures increase at an annual rate of 8.0 percent while revenues are based upon the 1982 tax rates.
1982 1983 1984 1985 1986Cumulative Deficit
1982 - 1986
$ 28,671,415 $ 27,737,415 $ 17,173,415 $ - $226,436,000 234,995,000 243,285,000 249,102,000 255,012,000
$255,107,415 $ 262,732,415 $ 260,458,415 $ 249,102,000 $ 255,012,000
$227,370,000 $ 245,559,000 $ 265,204,000 $ 286,420,000 $ 309,334,000
$ 2711l71!!~ $ 17,173,415 $ (4,745,585) $ (37,318,000) $ (54,322,000) $(96,385,585)
CASE 2 -CURRENT SITUATION
- Revenues same as above - Expenditures increase at past years' average of approximately 10.5 percent.
~ 1983 1984 1986Cumulative Deficit
1982 - 19861985
$ 28,671,415 $ 22,474,415 $ 410,415 $ - $226,436,000 234,995,000 243,285,000 249,102,000 255,012,000
$255,107,415 $ 257,469,415 $ 243,695,415 $ 249,102,000 $ 255,012,000
$232,633,000 $ 257,059,000 $ 284,051,000 $ 313,876,000 $ 346,833,000
$ 22,474,415 $ 410,415 $ (40,355,585) $ (64,774,000) $ (91,821,000) $(196,950,585)
CASE 3 - "WORST CASE"
- Revenues same as above -Expenditures increase at 13.0 percent annually.
1982 1983 1984 1986Cumulative Deficit
1982 - 19861985
$ 28,671,415 $ 17,211,415 $ - $ - $226,436,000 234,995.000 243,285,000 249.102.000 255.012.000
$255,107,415 $ 252,206,415 $ 243,285,000 $ 249,102.000 $ 255,012,000
$237,896.000 $ 268.823,000 $ 303,770,000 $ 343,260.000 $ 387,883,000
$ 17.211,415 $ (16.616,585) $ (60,485,000) $ (94,158,000) $ (132,871,000) jl304.130.585)

expenditures from the 10.5 percent rate experienced during the past six years to 8.0
percent. Under this assumption, the City would experience surpluses for 1982 and 1983,
and a small deficit of $4.8 million by 1984. However, the expected deficits for 1985 and
1986 would be $37 and $54 million respectively. A cumulative deficit of $96 million would
be expected during the entire five-year period.
Case 2 represents the current situation. The projected revenues are the same as
above while the expenditures are projected to grow at the 10.5 percent annual rate
experienced between 1976 and 1981. Under these conditions, the City can expect a
surplus in 1982 and a break-even situation for 1983. However, during the period of 1984 to
1986, the City would face annual deficits of $40, $65 and $92 million respectively.
Overall, the City would have a cumulative revenue/expenditure gap of $197 million.
Case 3 indicates the impact when the expenditure growth rate increases to 13
percent. With high inflation, combined with the costs of maintaining and replacing an
aging water, sewer and bridge system", plus the unfunded pension liability problem, this
!!l ,
type of growth in expenses is not difficult to imagine. The effects of this growth rate are
felt by 1983 when a $17 million deficit is expected. This deficit situation grows worse
each year and a staggering cumulative deficit exceeding $300 million would occur during
the projected period.
v

Phase n - Nonresident Cost/Revenue Anal:r:sis
Phasen - Conclusion
The second component of this study consisted of a cost/revenue analysis on the
impact of nonresident workers, shoppers and users of City services and facilities. The
League's analysis concluded that while nonresidents contributed $9.1 million in 1980, the
City spent $15.8 million to provide services to nonresidents. Thus expenditures exceeded
revenues by $6.7 million.
League research also revealed a number of other factors:
-Pittsburgh has an unusually large nonresident commuting workforce; , ii
, j
-Of the 30 most populous cities, only San Francisco and Boston are smallergeographically;
-A substantial amount of the City's most valuable property is tax-exempt;
-Pittsburgh has unusually severe restrictions on its taxing powers with respect tononresidents;
-A typical family in Pittsburgh has a high tax burden whether compared with othermajor cities or surrounding municipalities.
]1,. ,
Methodology and Assumptions '. ,,;
The main emphasis in this study was to examine the costs and the revenues
associated with nonresidents within three selected areas of the City, i.e., areas used, ,1
heavily by both residents and nonresidents. The areas examined in this analysis, referred
to as regional areas, were the Downtown, Oakland and Lower North Side sections.
The methodology generally consisted of calculating the costs of services for these
regional areas and the tax revenues generated in them. These costs and revenues were
allocated between residents and nonresidents based upon the survey data collected and
discussed in the following section. Perhaps the single biggest difference between this
analysis and those done in other cities was the fact that extensive surveying was done to
gather data where none had existed previously.
vi

,l ,
f
! '
f .,
I
!. ;
LI
I ~.
L, ,!,i-
. ',iL
L
f -
L
\L
IiL..
The data is from the base year of 1980. All expenditures financed from non-local
funds except for Federal Revenue Sharing and State Liquid Fuels revenues were excluded.
In addition, expenditures for enterprise activities such as water and sewer were excluded.
Lastly, all costs were measured on an average costing basis, Le., each individual
benefiting from a specific service was allocated an equal share of the costs of providing
the service.
Survexs
Table 2 highlights the results of the surveys of employment, shopping, medical
facilities, educational facilities, cultural activities, recreational events, special events
and transportation. These survey results were used extensively in allocating the costs and
revenues associated with the regional areas between residents and nonresidents. From
this data, a composite regional factor of two-thirds nonresident to one-third resident was
determ ined. This generalized proportion was used to allocate regional costs in cases
where a specific survey did not apply.
Revenues
In this analysis, nonresidents were credited with total regional revenues of
$9,096,512 from the taxes as shown below:
TaxNonresidentContribution
Occupation PrivilegeParkingAmusementMercantileBusiness Privilege
$ 964,9924,439,6492,071 , 271
533,9281,086,672
$9,096,512
vii

Subject Area
Employment
Shopping
Education
Medical Center
Cultural Center
Recreation Center1. Sports
2. Family Activities
3. Park System
Special Events
Transporta tion
~ 1
TABLE 2
REGIONAL CENTER SURVEY DATA""]
Surve1 Results
56.9 percent of the workforce are nonresidents. , J
60.3 percent of the shoppers in the CBD arenonresidents.
, II
! j
67 .0 percent of the college students originatefrom outside the City limits.
,...,;,
, I66.8 percent of hospital patients are nonresidents. ""
i !; jApproximately 70 percent of those attending
major cultural activities at Heinz Hall and theStanley Theater are nonresidents. ~ 1
!
., i
Approximately 75 percent of Pirate, Penguinand Pitt Panther game at tenders and 80 percentof Steeler game attenders are nonresidents.
1 Ij,. i
85.1 percent of Zoo attenders, 67.4 percentof Aviary attenders and 62.9 percent ofConservatory attenders are nonresidents.
! !j, ,
, !
Approximately 25 percent of the users of majorCity parks are nonresidents.
Nonresidents attend major special events heldin the City in the following proportions:
-Three Rivers Arts Festival-70.1 %-Fourth of July Celebration-58. 2%-Three Rivers Regatta-66. 7%-The Great Race-72. 0%
c !
, J
,...J
Nonresidents account for 48.9 percent of theregular automobile vehicle miles traveled onCity-owned principal and minor arterials.
r,<-'
viii
r'ri
r .!.
f
Ii- '
,l .
t i.! ~I1~-
I.l .
1. .
il.
iiL..
! .J, .
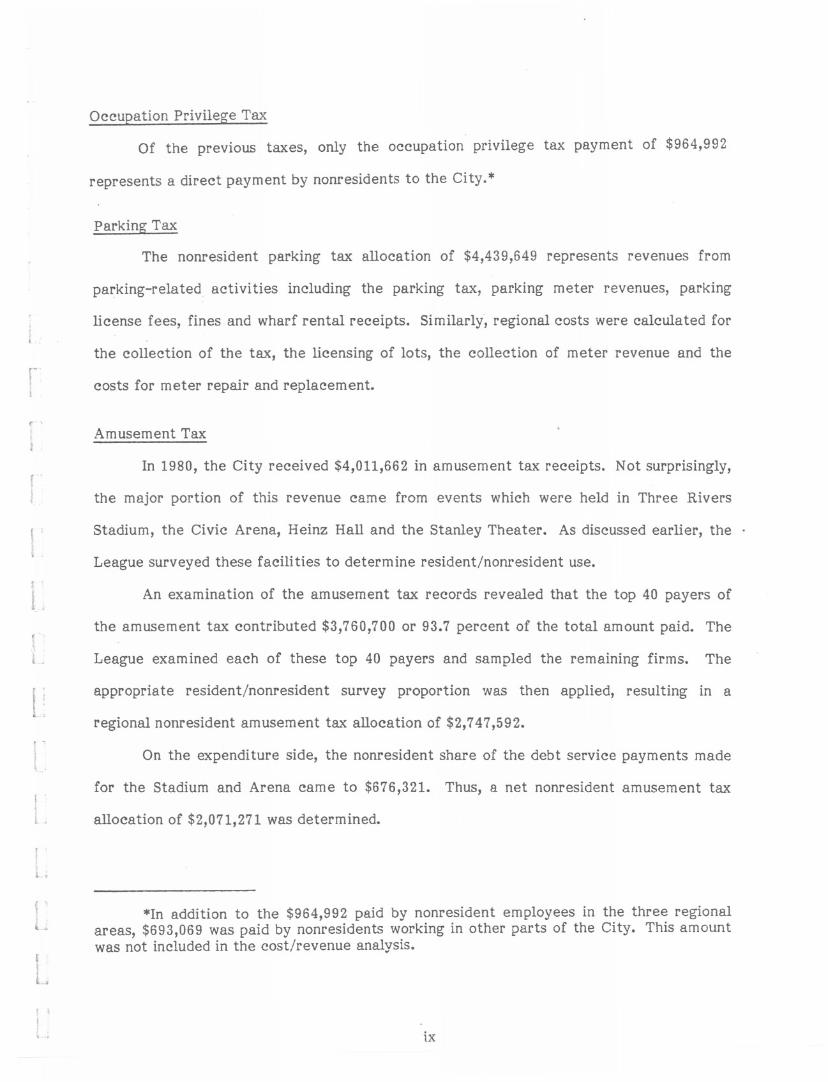
Occupation Privilege Tax
Of the previous taxes, only the occupation privilege tax payment of $964,992
represents a direct payment by nonresidents to the City.*
Parking Tax
The nonresident parking tax allocation of $4,439,649 represents revenues from
parking-related activities including the parking tax, parking meter revenues, parking
license fees, fines and wharf rental receipts. Similarly, regional costs were calculated for
the collection of the tax, the licensing of lots, the collection of meter revenue and the
costs for meter repair and replacement.
Amusement Tax
In 1980, the City received $4,011,662 in amusement tax receipts. Not surprisingly,
the major portion of this revenue came from events which were held in Three Rivers
Stadium, the Civic Arena, Heinz Hall and the Stanley Theater. As discussed earlier, the.
League surveyed these facilities to determine resident/nonresident use.
An examination of the amusement tax records revealed that the top 40 payers of
the amusement tax contributed $3,760,700 or 93.7 percent of the total amount paid. The
League examined each of these top 40 payers and sampled the remaining firms. The
appropriate resident/nonresident survey proportion was then applied, resulting in a
regional nonresident amusement tax allocation of $2,747,592.
On the expenditure side, the nonresident share of the debt service payments made
for the Stadium and Arena came to $676,321. Thus, a net nonresident amusement tax
allocation of $2,071,271 was determined.
*In addition to the $964,992 paid by nonresident employees in the three regionalareas, $693,069 was paid by nonresidents working in other parts of the City. This amountwas not included in the cost/revenue analysis.
IX

Mercantile Tax
In 1980, after refunds, the City received $2,847,566 in mercantile tax revenue from
some 4,600 firms. The League individually reviewed the tOI? 100 firms, which pay 46
percent of the total tax. A stratified saml?le was used to survey the remaining firms to
estimate the total mercantile tax originating from the regional areas. Applying the 60
percent nonresident sl?lit obtained from the shoPl?ing survey resulted in a nonresident
regional mercantile tax allocation of $533,928.I. I
Business Privilege Tax
The business privilege tax, like the mercantile tax, is a gross receil?ts tax I?aid
. IjIi
directly by the business concern and only indirectly by the purchaser of the service. The" ,
types of businesses paying the largest amounts of this tax included such types as: major
construction firms, corporate law offices, large office building owners, major advertising
firms, and consulting and engineering corporations.
The League develol?ed a sampling plan in which the first 400 accounts were
individually reviewed and only those regional accounts from parking garages, medical
, j
services and educational institutions were included. These amounts were allocated to
nonresidents on the basis of the surveys previously discussed. All other accounts in this , ,
group were excluded in an effort to exclude those firms which primarily pay this tax as a
result of their business dealings with other firms.I...:.;
The remainder of the accounts were sampled and all revenue originating from firms ! 1
located in the regional areas was included. This revenue was then split between residents
and nonresidents using the employment survey.
As a result, $1,086,672 was credited to nonresidents as their share of the business
privilege tax originating from the regional areas.
x

Property Tax
For 1980, the League estimates that approximately $16 million in property tax
revenues originated from the regional areas. Nonresidents were not credited with any
property tax, however, for three major reasons.
First, the League excluded from this analysis the costs for property-related
services such as building inspection, environmental services (refuse), land use control,
housing, two-thirds of fire protection, capital costs for water and sewage, etc. While it
would take a detailed study to calculate the exact costs of these excluded services, the
League's estimate indicates that the costs for excluded services comes close to matching
the property tax revenue.
Secondly, any allocation of the property tax revenues would have to consider the
property taxes lost as a result of tax-exempt property. The League's analysis revealed
that in the regional areas, two-thirds of the growth in assessed values between 1950 and
1980 was in tax-exempt property. By 1980, almost half of the assessed value in the
regional areas consisted of tax-exempt property.
Third, a review of the prevailing economic theories concerning the ultimate
incidence of the property tax revealed that very little could be assumed to be passed along
to the nonresidents being studied in this analysis. Since Pittsburgh is a major corporate
center, a large portion of the property tax would be passed along to customers all over the
nation and thus exported out of this area.
Expenditures
As a result of this analysis, nonresidents were allocated a cost of $15,810,558 for
the services provided by the departments shown below:
xi.

DeEartmentNonresidentAllocation
PoliceFirePublic WorksParks and RecreationCapi tal CostsAll Others
$ 5,531,525
863,8283,372,506
2,661,079
2,870,367
511,253
$15,810,558
These costs did not include water or sewage costs nor services financed from non-
local sources such as Federal Highway funds. The non-departmental fringe benefit costs
plus the indirect costs for those departments providing support services (e.g., Supplies,< 1
iJ
Personnel) were allocated back into the departments such as Police and Fire which provide
direct services. This was accomplished through the use of an indirect cost study that
Arthur Young &:Company completed in 1980.
Police Costs
Because police officers are assigned on an area basis to various precincts
throughout the City, the basic approach in allocating police costs was to calculate a cost
per officer and to. determine the number of officers serving the regional areas under
considera tion. Th~se regional police costs were then allocated between residents and
nonresidents on the basis of the composite regional survey discussed earlier.
This resulted in a regional nonresident allocation of $5,531,525 for police..1
protection services.
Fire Department
As was done with the Police Department, the basic strategy for the Fire
Department revolved around the calculation of a unit cost per fire fighter. The cost for
each fire company was then determined by applying the cost per fire fighter to the
number of fire fighters assigned to the company.
xii

r~',!
f-
! .
I
i -!t J
! -!. J
I '
~ J
- -- - - -- -- - - -
The regional costs for each company were then calculated based upon the number
of service calls to the region as a percent of their total service calls. This process
resulted in a regional cost of $3,885,284. However, since a primary focus of a fire
department is to protect property, only one-third of the regional costs, or $1,295,096,
were allocated between residents and nonresidents. Applying the composite regional
survey resulted in a nonresident regional charge of $863,828 for fire protection services.
Public Works Department
Unlike the methodology used for most other departments, where costs were
collected for the three regional areas, this methodology was not considered practical for
the Public Works Department. Obviously, the roadways utilized by nonresidents traveling
to the regional areas (or elsewhere) extend throughout the City. Therefore, this section
concentrated on calculating the costs associated with City-owned and maintained
principal and minor arterials such as Fifth Avenue and Smithfield Street. The costs for
the major thruways were included even if located outside of the three regional areas. On
the other hand, the costs for maintaining the local connector streets located within the
regional areas were excluded.
This Department was divided into the categories of Supervisory Offices, Traffic
Control, Painting and Signing, and Street Maintenance. The costs for each of these
categories applicable to the City-owned or maintained principal and minor arterial system
were determined.
As a result of this process, total eligible costs of $6,896,740 were calculated. The
road survey was used to allocate these costs, resulting in a nonresident charge of
$3,372,506 for the services provided by the Public Works Department.
Parks and Recreation
In examining the services provided by the Department of Parks and Recreation,
there were three major categories for which costs were estimated. The first category
xiii

included the three eastern parks (Schenley, Highland and Frick) which are utilized by both
residents and nonresidents. The second category included the major recreational facilities
(Zoo, Aviary and Conservatory). The last category included those costs associated with
the planning of major civic events such as the Arts Festival, Fourth of July Celebration,
Regatta and the Great Race.
These costs were then allocated between residents and nonresidents based upon the
appropriate survey, resulting in a nonresident allocation of $2,661,079.
Capital Costs
In 1980, the City paid $22,611,813 in debt service payments which represented that
year's share of the principal and interest payments for previous capital spending.
The League examined the projects financed from new project authorization bond
funds in this analysis. Because the types of capital projects can vary dramatically from~ i
year to year, the League utilized the three-year average figures from the 1979, 1980, and
1981 Capital Budgets. To allocate capital costs, each department was examined in a
manner similar to the method used with the operating costs. Each capital project for each
department was individually reviewed. In many cases, projects listed in the Capital
Budget were never undertaken. These projects were excluded.
As a result of this process, nonresidents were allocated $2,870,367 in capital costs.
The majority of these costs ($2,332,858) resulted from road projects of the Public Works
Department. The Parks Department accounted for $446,332 and miscellaneous activities
accounted for the remaining $91,177.
Other Costs
In a similar manner, nonresidents were allocated a total cost of $511,253 as a result
of services provided by the Departments of Emergency Medical Services, Planning, and
City Development, plus costs for Street Lighting, Carnegie Library and the Human
Relations Commission.
xiv

Total Costs
As a result of this process, nonresidents were allocated total costs of $15,810,558.
This figure exceeds the nonresident revenue calculation of $9,096,512 by $6,714,046, or 74
percent. In addition to the cost/revenue analysis discussed above, the League's research
revealed a number of other important considerations.
Large Commuting Workforce
While the census data for 1980 is not yet available, a review of the 1960 and 1970
figures for 30 of the largest cities in the United States revealed that Pittsburgh's
nonresident commuting workforce is one of the highest in the nation. Only six of the 30
cities reviewed had a higher percentage and Pittsburgh's 1970 percentage of 52.3 percent
was substantially above the median figure of 38.1 percent.
Small Size
Pittsburgh is also unusual in that the City limits encompass a relatively small area.
A review of the 30 most populous cities revealed that only San Francisco and Boston are
smaller geographically. Pittsburgh ranked last in terms of the percent of the SMSA
population residing within the Center City. In fact, Pittsburgh is the regional center of an
J . area over 50 times its size and more than five times its population.,iiL ' Tax-Exempt Property
As the hub of the Pittsburgh regional area, it is not surprising that Pittsburgh is
also the focal point for educational, medical, cultural and governmental facilities. All of
these facilities are tax-exempt, resulting in a much higher percentage of tax-exempt
property than in a typical, adjoining municipality.
This can result in a situation where a tax-exempt facility which is beneficial to the
entire region may be viewed critically by City officials for fear of further deteriorating
the tax base.
xv
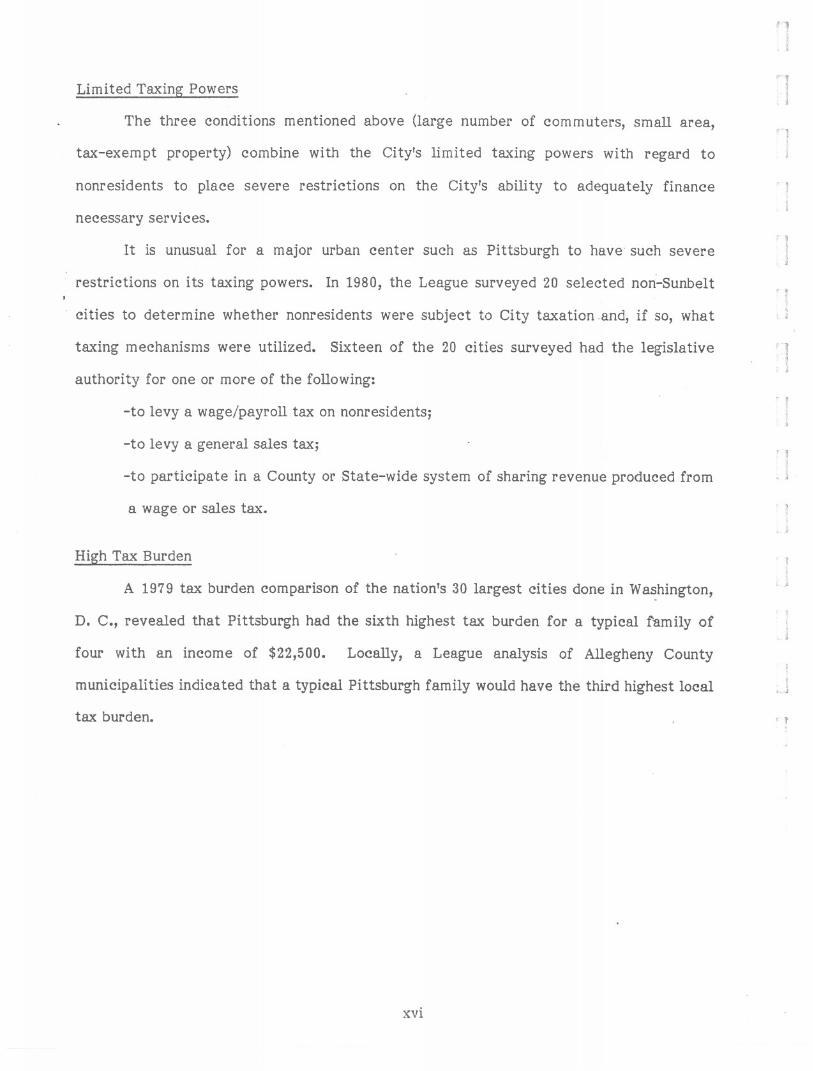
Limited Taxing' Powers
The three conditions mentioned above (large number of commuters, small area,
tax-exempt property) combine with the City's limited taxing powers with regard to
nonresidents to place severe restrictions on the City's ability to adequately finance
necessary services.
It is unusual for a major urban center such as Pittsburgh to have" such severe
restrictions on its taxing powers. In 1980, the League surveyed 20 selected non-Sunbelt
cities to determine whether nonresidents were subject to City taxation -and, if so, what
taxing mechanisms were utilized. Sixteen of the 20 cities surveyed had the legislative
authority for one or more of the following:
-to levy a wage/payroll tax on nonresidents;
-to levy a general sales tax;
-to participate in a County or State-wide system of sharing revenue produced from
a wage or sales tax.
High Tax Burden
A 1979 tax burden comparison of the nation's 30 largest cities done in Washington,
D. C., revealed that Pittsburgh had the sixth highest tax burden for a typical f-amily of
four with an income of $22,500. Locally, a League analysis of Allegheny County
municipalities indicated that a typical Pittsburgh family would have the third highest local
tax burden. t
xvi

Phase III - An Evaluation of Selected Alternatives
The third and last report reviews and evaluates a number of ways to improve the
Ci ty's finances. Each alternative is reviewed in conjunction with the major criteria
applied to tax/revenue proposals. The issues discussed in this last report are: a
nonresident wage tax, a local sales tax, tax-exempt property, user fees, and the transfer
of services.
Tax/Revenue Criteria
When reviewing any tax or revenue proposal, it is important to keep certain criteria
in mind. While there may be no such thing as a perfect tax, it is clear that some taxes are
much worse than others.
In general a "good tax" is one which is paid by those receiving services and by those
with the financial capacity to pay. A good tax should be equitable for those paying the
tax, it should not induce individuals or firms to locate elsewhere, and it should provide a
reasonably stable source of revenue with the capacity to increase as the economy expands.
In more technical terms, the above paragraph can be restated to indicate that a
good tax is one which is consistent with the principles of benefits received, ability to pay,
equity considerations, neutrality or economic efficiency, and revenue productivity and
growth. Each of these criteria was considered in the evaluation of new revenue ideas.
Nonresident Wage Tax
The League's examination of the use of a nonresident wage tax revealed that this is
no longer an unusual tax. Major cities such as New York, Cleveland, Detroit, St. Louis and
Philadelphia are permitted to tax a portion of the income earned by nonresidents working
within the City. In addition to the major municipalities, local jurisdictions in Alabama,
California, Indiana and Kentucky have the authority to levy nonresident wage taxes.
vuii
,
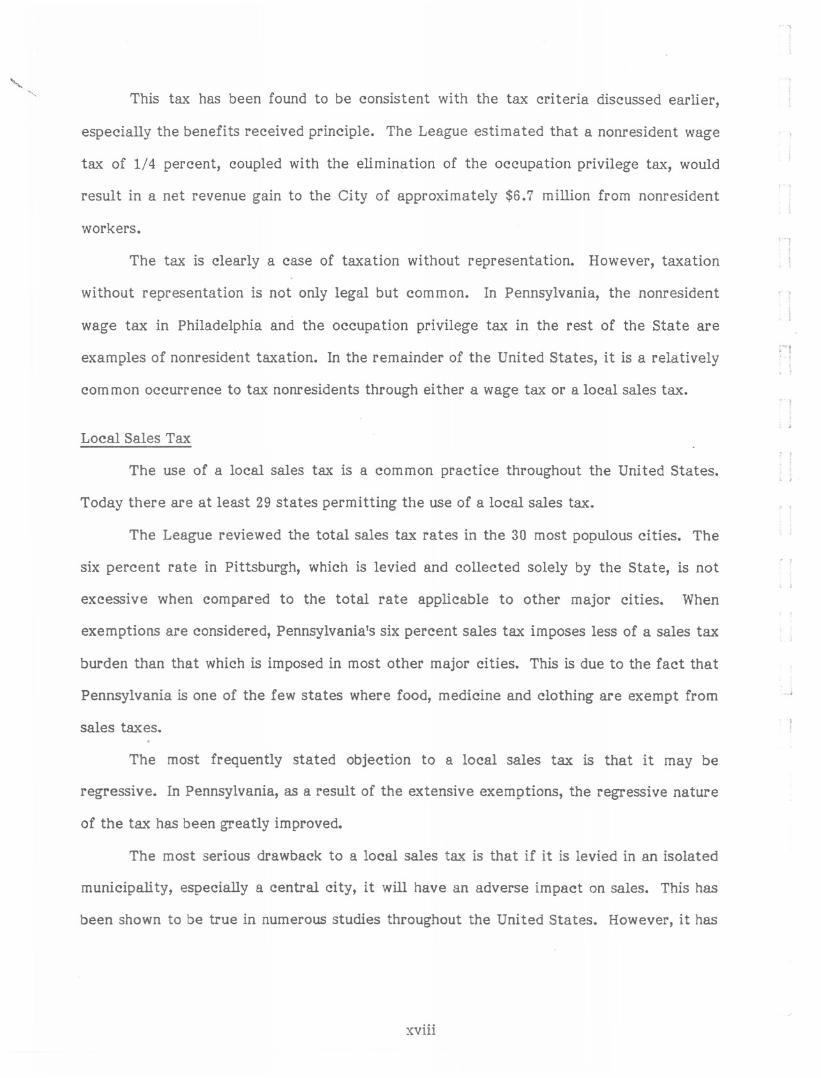
,. "This tax has been found to be consistent with the tax criteria discussed earlier,
especially the benefits received principle. The League estimated that a nonresident wage
tax of 1/4 percent, coupled with the elimination of the occupation privilege tax, would
result in a net revenue gain to the City of approximately $6.7 million from nonresident
workers.
The tax is clearly a case of taxation without representation. However, taxation
without representation is not only legal but common. In Pennsylvania, the nonresident
wage tax in Philadelphia and the occupation privilege tax in the rest of the State are
examples of nonresident taxation. In the remainder of the United States, it is a relatively,".. I; .
common occurrence to tax nonresidents through either a wage tax or a local sales tax.< !
Local Sales Tax
The use of a local sales tax is a common practice throughout the United States.
Today there are at least 29 states permitting the use of a local sales tax.
The League reviewed the total sales tax rates in the 30 most populous cities. The
six percent rate in Pittsburgh, which is levied and collected solely by the State, is not, ..
excessive when compared to the total rate applicable to other major cities. When
exemptions are considered, Pennsylvania's six percent sales tax imposes less of a sales tax
burden than that which is imposed in most other major cities. This is due to the fact that
Pennsylvania is one of the few states where food, medicine and clothing are exempt from--,
sales taxes.
The most frequently stated objection to a local sales tax is that it may be
regressive. In Pennsylvania, as a result of the extensive exemptions, the regressive nature
of the tax has been greatly improved.
The most serious drawback to a local sales tax is that if it is levied in an isolated
municipality, especially a central city, it will have an adverse impact on sales. This has
been shown to be true in numerous studies throughout the United States. However, it has
xviii

also been concluded that much of this loss can be reduced by enlarging the area of the tax.
The mimimum area in which this tax could be levied would be Allegheny County.
However, in an urbanized area like the Pittsburgh SMSA, it may be better to levy the tax
on a regional basis in an area which is larger than Allegheny County.
The League has estimated that the City of Pittsburgh would gain an additional
$16.7 million from City retail establishments if a one percent sales tax were levied in
Allegheny County. The use of either a nonresident wage tax or a local sales tax would
require State legislation.
Tax-Exempt Property
The growth of tax-exempt property has become a major problem in Pittsburgh.
City-wide, approximately 35 percent of the total assessed value is classified as tax-
exempt. In the three regional areas it is 46 percent and has been increasing steadily over
the last 25 years.
With the continuing evolution to a service-centered society, it is expected that the
amount and value of tax-exempt property will increase. The tax-exempt land alone
(excluding the buildings) represented lost revenues exceeding $11 million in 1982. It is
clear that tax-exempt institutions such as the universities and hospitals benefit the entire
metropolitan area. Unfortunately, the costs of servicing these facilities remains primarily
with the local government where they are located.
A survey from the League's Philadelphia office revealed that payments in lieu of
taxes are not yet commonplace. Boston recently imposed a fire service fee on exempt
properties and Detroit imposes special charges for police and fire services for certain
cultural institutions. California makes use of benefit assessments to finance certain
operating costs. Only a handful of states were found to have state programs which
provide for payments in lieu of taxes.
Under current State law, the City can levy a service fee only if it is applicable to
all property owners, both taxable and exempt. It may ultimately be necessary to levy
service fees on property-related services, such as fire protection, as the only means of
having exempt organizations directly contribute for City services.xix

"""-
It is clear t~~'t the City should be reimbursed in some manner for the expenses
associated with tax-exempt properties/facilities. However, until more and better data is
available, it not clear as to the best way in which to do this.
User Fees
User fees are becoming a popular alternative to general tax increases. While this
report did not examine Pittsburgh's user fees in any detail, it is clear that improvements
can be made.
The City must establish a water rate which covers all operating costs, both direct
and indirect, as well as the capital costs necessary to keep the system in good running
order.
The user fees collected by the Parks and Recreation Department may require a
close look. The Phase II report indicated that the total revenue from the Zoo, Aviary and
Conservatory was less than 25 percent of the total operating costs.
The Bureau of Building Inspection is another area where the permit fees do not
come close to matching costs.
User fees are in strict accordance with the benefits received principle. They are
also a~means by which the City can recover costs from nonresidents using such facilities
as the Zoo, Aviary and Conservatory.
Transferring Functions
Facilities, such as the Zoo, which are little-used by City residents, may more
appropriately belong at the County level of government. A major factor hindering this
type of administration relocation is the major financial problem facing Allegheny County.
Probably a less costly and more feasible alternative for the County would be to make a
contribution to the City because of the County-wide importance and use of these regional
facilities.
xx
;1I,, i
, ,!,, I
. }
n i
; j
1
I-_oj
, !

i
r .
f '
. '
f
r.!
L
L
The water plant is another facility which could possibly be transferred to the
private sector or to a governmental authority. The sale of this system could provide
capital to finance other major projects. In addition, the removal of the rate-making
process from political considerations may permit the rate to rise in a reasonable manner
to a level such that the system pays its own way and the capital infrastructure is placed
on a regular replacement cycle.
In both of the above cases, a significant amount of additional investigation and
research would be required to fully explore the feasibility of either option. Nonetheless,
~ach option, if successfully completed, would improve the City's fiscal situation.
Conclusions and Recommendations
The League has developed five major conclusions and recommendations as a result
of its efforts in all three phases of this project.
First, it is extremely important for the City to control the growth rate of its
operating expenditures. THEREFORE, THE LEAGUE RECOMMENDS THAT the City
establish a goal of limiting the overall annual growth in operating expenditures to 8
percent or less. The successful implementation of this recommendation will still leave a
cumulative revenue/expenditure gap of $96 million to be financed over the next five
years.
Second, additional revenues should equitably come from the nonresidents who work,
shop and utilize City services and facilities. The nonresident cost/revenue analysis
indicated that nonresidents benefit extensively from the services provided by the City.
Furthermore, the revenues derived from nonresident users of services and facilities are
much less than the costs of providing services to them. THEREFOREz THE LEAGUE
RECOMMENDSTHAT the City be given broader taxing powers. League policy does not
permit it to recommend which taxes should be sought. However, the League has evaluated
two likely sources, namely, a nonresident wage tax and a local sales tax. Either of these
taxes could provide the City with a significant increase in revenues and help ease the
xxi

'-"'-approaching financial problems. These taxes also represent reasonable means by which
nonresidents can contribute towards the costs of services from which they benefit.
Both of these taxes would require State approval. In the case of a local sales tax,
it should be levied on a County-wide or regional basis to minimize the loss of sales which
would occur if a City-only sales tax were levied.
Third, City taxpayers are saddled with an unfair burden as a result of the tax-
exempt status enjoyed by a significant portion of properties and facilities within the
Center City. THEREFORE, THE LEAGUE RECOMMENDS THAT the City thoroughly
examine the role and impact of the tax-exempt properties. This analysis should include a
categorization of the types of tax-exempt properties, a review of the growth of exempt
properties, an examination of the feasibility of using a fee system for property-related
services such as fire protection, and an analysis of the impact of having nongovernmental
tax-exempt institutions pay a tax on the land they own (not the buildings) or pay a portion
of the total tax liability.
Fourth, additional revenues can be obtained from user fees. THEREFORE,THE
LEAGUE RECOMMENDS THAT the City examine its entire user fee structure. This
analysis would examine fees currently assessed by Parks and Recreation, the Water..
Department, Building Inspection, and other departments.
Fifth, there is justification for the transfer of City-provided services to other
agencies. THEREFORE, THE LEAGUE RECOMMENDSTHAT the City explore with the
County the possibility of either transferring selected park facilities to the County or,
alternatively, having the County make a contribution to the City for the maintenance of
regional facilities. IN ADDITION, THE LEAGUE RECOMMENDS THAT the City explore
the long range implications and possibilities of selling the water system to either a private
concern or an authority of some type.
xxii
-1
.,
, i
. 1
. !
. jj
. ;;,,, i
. !
. I
. Ii
, i
,.I
!. .J
.~J
. !

Financial Im.Q.actof Selected Alternative Revenue Combinations
Table 3 illustrates the impact that the implementation of selected combinations of
the above-stated recommendations would have on the City!s fiscal situation. The first
example, Case 1, assumes that a nonresident wage tax at 1/4 percent is levied in 1983, and
that by 1984 a service fee applicable to tax-exempt properties and increased user fees are
available. These three items would result in increased revenues of $59.8 million by 1986.
This would still leave a projected revenue/expenditure gap of $36.6 million to be funded
either by reducing the growth rate in expenditures below the eight percent level used in
this table or by increasing existing revenues. To finance this $36.6 million gap from real
estate taxes would require an almost 50 percent increase in the current rates over the
next five years.
Case 2 assumes that a local sales tax is enacted instead of a nonresident wage tax.
Because of the complexity involved in establishing this tax, it is assumed that it would not
be implemented prior to 1984. The sales tax plus the tax-exempt property fee and
increased user fees would result in increased revenues of $89.4 million. This would leave
an unfilled revenue/expenditure gap of $7.0 million to be financed from current sources.
1 .I
Case 3 assumes that the City is not granted increased taxing power. Under this
situation the only new revenue would come from the tax-exempt property fee and
increased user fees. Both of these items would require a great deal of research before\i ,
they could be implemented, and therefore, it is expected that the new revenue would not
be available prior to 1984. The total revenue of $27.9 million is $68.5 million short of the
projected gap of $96.4 million. To fund this deficit from the real estate tax would require
an increase of approximately 90 percent over the 1982 rates.
This table illustrates the three critical components necessary to keep the City's
fiscal house in order. First and foremost, it is essential that the City keep a tight rein on
the growth rate of its expenditures. The past years' annual growth rate trend of 10.5
percent must be reduced to 8.0 percent or less to prevent the projected deficits from
becoming beyond control.
xxiii

,.Secondly, it is important that the City's taxing powers be broadened. The L~ague's
".
second report, Phase II, reviewed the financial problems associated with providing services
to a large nonresident population. The availability of a nonresident wage tax would help
Pittsburgh as well as many of the older industrial communities which have a large
nonresident worker population. Alternatively, a local sales tax would also improve the
City's finances and would provide a means by which nonresidents contribute for services
received. To avoid major dislocations, however, a local sales tax would have to be levied
on a County-wide or regional basis. Depending upon the manner of. distribution, this tax
could form the basis of providing fiscal relief to the City, the County and the smaller
municipalities in Allegheny County.
Third, it is important for the City to explore other ways to improve their financial
situation. This includes the expanded use of user fees, the possible use of fees for
property-related services which would apply to both taxable and exempt properties, and
the feasibility of transferring services to non-City agencies.
In this report, the League has reviewed a number of ways to improve the City's
finances. While there are undoubtedly many other possibilities which can and should be
examined, it is hoped that the material presented in this report will assist the City in
continuing its critical role as the center of the metropolitan area.'-
xxiv
, -,j
: II
< i
-,J,i
, j
. j
. ,

TABLE 3
ALTERNATIVE REVENUE COMBINATIONS(Millions)
Case 1 - Nonresident Wage Tax
Cumulative Deficit (8.0%) - New Revenue = Remaining Revenue/Expenditure Gap$96.39 million - $59.76 million =$36.63 million
Case 2 - Local Sales Tax
;I ,
Cumulative Deficit (8.0%) - New Revenue = Remaining Revenue/Expenditure Gap$96.39 million - $89.4 million =$6.99 million
.L.
Case 3 - Neither a Nonresident Wage or a Local Sales Tax
Cumulative Deficit (8.0%) - New Revenue =Remaining Revenue/Expenditure Gap$96.39 million - $27.93 million =$68.46 million
LJ
xxv
New Revenue Item 1983 1984 1985 1986 Total
Nonresident Wage Tax $7 .17 $ 7.67 $ 8.21 $ 8.78 $31.83i Tax-Exempt Property Fee (Fire) - 5.83 6.30 6.80 18.93\ . User Fees - 3.00 3.00 3.00 9.00
Total $7.17 $16.50 $17.51 $18.58 $59.76
! New Revenue Item 1983 1984 1985 1986 Total
iLocal Sales Tax $ - $19.12 $20.46 $21.89 $61.47
I ,Tax-Exempt Property Fee (Fire)- 5.83 6.30 6.80 18.93
I User Fees - 3.00 3.00 3.00 9.00i Total $ $27.95 $29.76 $31.69 $89.40-
., ,New Revenue Item 1983 1984 1985 1986 Total
III Tax-Exempt Property Fee (Fire) $ - $ 5.83 $ 6.30 $ 6.80 $18.93
User Fees - 3.00 3.00 3.00 9.00Total $ - $ 8.83 $ 9.30 $ 9.80 $27.93