Embed Size (px)
Citation preview
Peaslake Biomass Boiler Air Quality Assessment
Report to Guildford Borough Council
Unrestricted
AEAT/ENV/R/2930 Issue 1
December 2009
Unrestricted AEAT/ENV/R/2930 Issue 1.
ii AEA
Title Guildford Borough Council: Peaslake Biomass Boiler Air Quality Assessment
Customer Guildford Borough Council
Customer reference AEA/BIOMASS/PEASLAKE
Confidentiality, copyright and reproduction
This report is the Copyright of AEA Technology plc and has been prepared by AEA Technology plc under contract to Guildford Borough Council. The contents of this report may not be reproduced in whole or in part, nor passed to any organisation or person without the specific prior written permission of the Commercial Manager, AEA Technology plc. AEA Technology plc accepts no liability whatsoever to any third party for any loss or damage arising from any interpretation or use of the information contained in this report, or reliance on any views expressed therein.
File reference ED47883
Reference number AEAT/ENV/R/2930 Issue 1
AEA Glengarnock Technology Centre Caledonian Road Glengarnock Ayrshire KA14 3DD
t: 0870 190 6574 f: 0870 190 5151 AEA is a business name of AEA Technology plc AEA is certificated to ISO9001
and ISO14001 Author Name David Monaghan
Approved by Name Dr Scott Hamilton
Signature
Date December 2009

Unrestricted AEAT/ENV/R/2930 Issue 1.
AEA iii
Executive Summary
AEA have been commissioned by Guildford Borough Council to investigate the air quality impact of an existing biomass boiler installation adjacent to Peaslake School at Peaslake, Guildford. The main pollutants assessed were particulate material with aerodynamic diameter of 10 microns or less (PM10) and nitrogen dioxide (NO2). The results indicate that the boiler emissions will not result in any exceedences of the AQS objectives for NO2 and PM10, indeed the process contributions are typically a small percentage of the overall AQS objectives. For example, the worst case result modelled during this exercise was modelled at the 1
st floor of Peaslake
School for annual mean objectives for NO2 (5.5 g.m-3
) and PM10.(0.7 g.m-3
). These modelled concentrations
represent 13.8 % and 1.8% of the annual mean objective (40 g/m3) for PM10 and NO2 respectively. Modelled
results for discrete receptors are shown in Table 4.1, Section 4.1. It should also be noted that the results shown in this table are extremely conservative as it assumed that NOx converts entirely to NO2. Additionally, it is assumed that the biomass boiler is running 24 hours per day, 365 days per year. The assessment has been carried out based on a boiler stack height of 4.6 m above ground level. Air quality impacts were calculated using Atmospheric Dispersion Modelling System (ADMS 4.1) – a dispersion model developed by the UK consultancy CERC. The most recent version of the model was used in conjunction with one year of hourly sequential meteorological data. For the purposes of this study we have considered a number of receptors located in the vicinity of the existing biomass boiler stack.
Unrestricted AEAT/ENV/R/2930 Issue 1.
iv AEA
Table of contents
1 Introduction 1
1.1 Purpose of the study 1
1.2 General approach taken 1
1.3 Numbering of figures and tables 1
1.4 Units of concentration 1
1.5 Structure of the report 1
1.6 Explanation of the modelling output 2
2 Air quality standards and guidelines 3
2.1 Air Quality Strategy and objectives 3
2.2 Sensitive locations 5
2.3 Combustion plant emissions 5
2.4 Background air quality in Guildford 6
3 Modelling methodology 7
3.1 Mapping 7
3.2 Meteorology 7
3.3 Building parameters 8
3.4 Terrain and land use 8
3.5 Addition of background concentrations to modelled contribution 9
3.6 Model domain 9
3.7 Boiler specifications 10
3.8 Stack parameters 11
4 Dispersion Modelling Results 12
4.1 Results 12
4.2 Dispersion Contour Plots 14
5 Conclusions 18
Unrestricted AEAT/ENV/R/2930 Issue 1.
AEA 1
1 Introduction
1.1 Purpose of the study
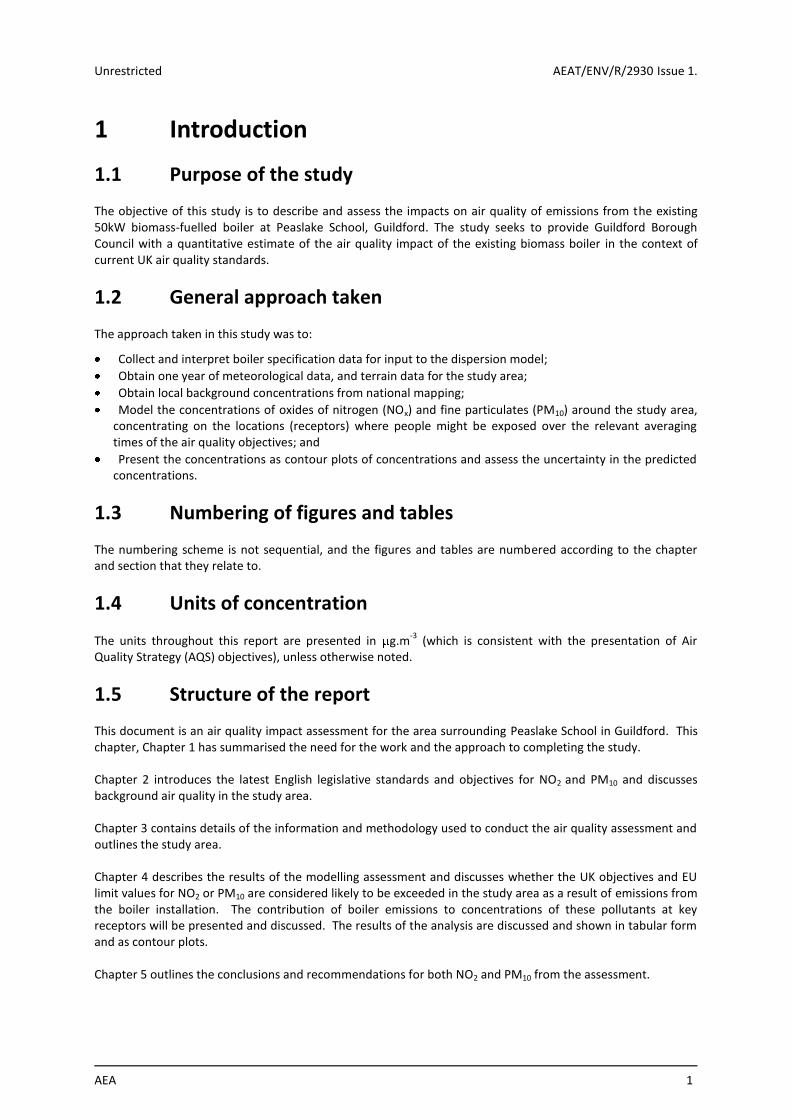
The objective of this study is to describe and assess the impacts on air quality of emissions from the existing 50kW biomass-fuelled boiler at Peaslake School, Guildford. The study seeks to provide Guildford Borough Council with a quantitative estimate of the air quality impact of the existing biomass boiler in the context of current UK air quality standards.
1.2 General approach taken
The approach taken in this study was to:
Collect and interpret boiler specification data for input to the dispersion model;
Obtain one year of meteorological data, and terrain data for the study area;
Obtain local background concentrations from national mapping;
Model the concentrations of oxides of nitrogen (NOx) and fine particulates (PM10) around the study area, concentrating on the locations (receptors) where people might be exposed over the relevant averaging times of the air quality objectives; and
Present the concentrations as contour plots of concentrations and assess the uncertainty in the predicted concentrations.
1.3 Numbering of figures and tables
The numbering scheme is not sequential, and the figures and tables are numbered according to the chapter and section that they relate to.
1.4 Units of concentration
The units throughout this report are presented in g.m-3
(which is consistent with the presentation of Air Quality Strategy (AQS) objectives), unless otherwise noted.
1.5 Structure of the report
This document is an air quality impact assessment for the area surrounding Peaslake School in Guildford. This chapter, Chapter 1 has summarised the need for the work and the approach to completing the study.
Chapter 2 introduces the latest English legislative standards and objectives for NO2 and PM10 and discusses background air quality in the study area. Chapter 3 contains details of the information and methodology used to conduct the air quality assessment and outlines the study area. Chapter 4 describes the results of the modelling assessment and discusses whether the UK objectives and EU limit values for NO2 or PM10 are considered likely to be exceeded in the study area as a result of emissions from the boiler installation. The contribution of boiler emissions to concentrations of these pollutants at key receptors will be presented and discussed. The results of the analysis are discussed and shown in tabular form and as contour plots. Chapter 5 outlines the conclusions and recommendations for both NO2 and PM10 from the assessment.
Unrestricted AEAT/ENV/R/2930 Issue 1.
2 AEA
1.6 Explanation of the modelling output
The contour maps generated in the modelling for this report are an indication of the predicted pollutant concentrations around the area modelled. They are not lines of absolute values and should not be considered as such. Care should also be taken, in cases where contours join up as enclosed loops. No assumptions of pollutant concentrations can be made on locations outside of the area being modelled.
Unrestricted AEAT/ENV/R/2930 Issue 1.
AEA 3
2 Air quality standards and guidelines
2.1 Air Quality Strategy and objectives
Biomass burners emit PM10 and oxides of nitrogen NOx Local Authorities are required under the Environment Act 1995 to assess air quality in their areas from time to time against air quality objectives set out in regulation; both of these pollutants are normally included in such assessments. Local Authorities are required to declare an Air Quality Management Area (AQMA) where it is likely that these objectives will not be achieved and to prepare an Action Plan to set out proposed measures to be taken to achieve the air quality objectives. There are no AQMAs throughout Guildford Borough. The latest Air Quality Strategy for England, Wales and Northern Ireland was published on 17
th July 2007. The
objectives, that mirror limit values required by EU Framework and Daughter Directives on Air Quality, have been transposed into UK law through the Air Quality Standards Regulations 2007 which came into force on 15
th
February 2007. A new EU Directive has recently been published which consolidates the Framework and first three Daughter Directives, but this has yet to be transposed into UK Regulations. Table 2.1 shows an outline of the current UK Air Quality Objectives. NO2 andPM10 are considered in this report in relation to the annual average and short-term objectives for each pollutant.
Experience from monitoring shows that if the 40 g.m-3
annual mean value is achieved, for NO2, there is normally no risk of the hourly mean objective being breached. The relationship between annual and daily mean for PM10 is less predictable, and exceedences of the short term objective can still be observed even where the annual mean complies with the objective. The other Air Quality Strategy pollutants do not need to be considered in this assessment. The Air Quality Strategy’s standards and objectives are shown in Table 2.1. The table shows the standards in
g.m-3
(mg.m-3
for CO) with the number of exceedences that are permitted (where applicable).
Unrestricted AEAT/ENV/R/2930 Issue 1.
4 AEA
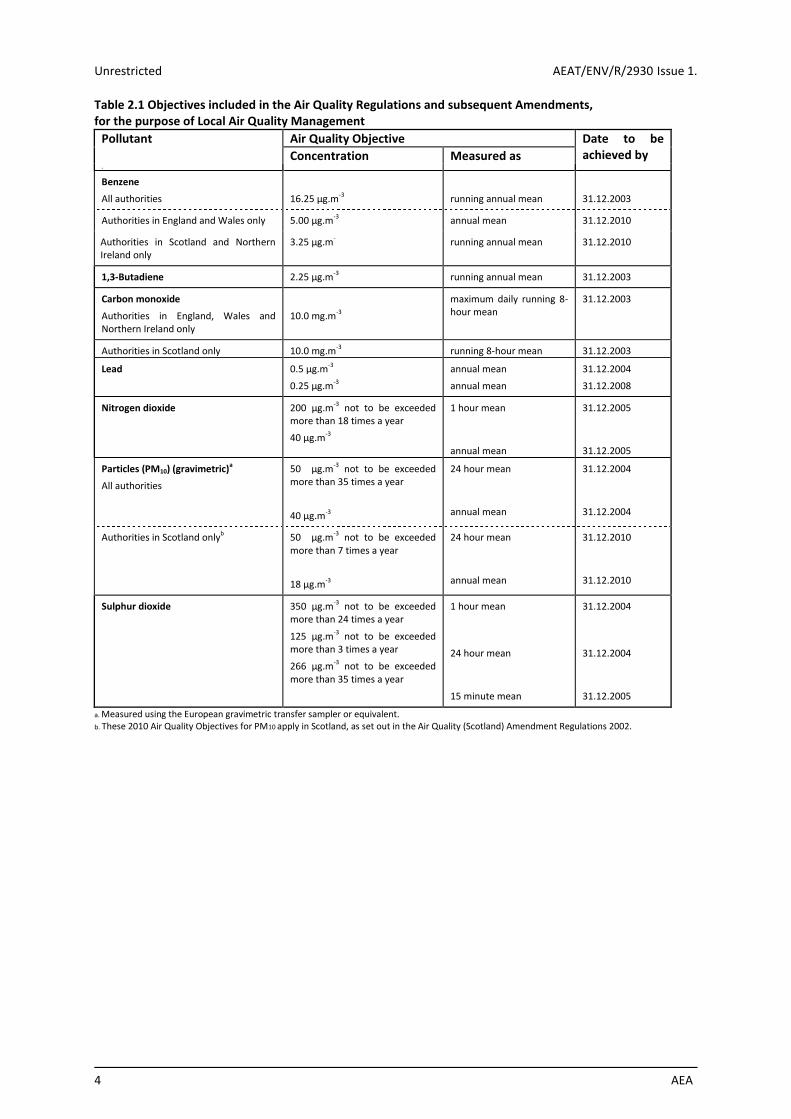
Table 2.1 Objectives included in the Air Quality Regulations and subsequent Amendments, for the purpose of Local Air Quality Management
Pollutant
Air Quality Objective Date to be achieved by Concentration Measured as
.
Benzene
All authorities
16.25 µg.m-3
running annual mean
31.12.2003
Authorities in England and Wales only 5.00 µg.m-3 annual mean 31.12.2010
Authorities in Scotland and Northern Ireland only
3.25 µg.m- running annual mean 31.12.2010
1,3-Butadiene 2.25 µg.m-3 running annual mean 31.12.2003
Carbon monoxide
Authorities in England, Wales and Northern Ireland only
10.0 mg.m-3
maximum daily running 8-hour mean
31.12.2003
Authorities in Scotland only 10.0 mg.m-3 running 8-hour mean 31.12.2003
Lead 0.5 µg.m-3
0.25 µg.m-3
annual mean
annual mean
31.12.2004
31.12.2008
Nitrogen dioxide 200 µg.m-3 not to be exceeded more than 18 times a year
40 µg.m-3
1 hour mean
annual mean
31.12.2005
31.12.2005
Particles (PM10) (gravimetric)a
All authorities
50 µg.m-3 not to be exceeded more than 35 times a year
40 µg.m-3
24 hour mean
annual mean
31.12.2004
31.12.2004
Authorities in Scotland onlyb 50 µg.m-3 not to be exceeded more than 7 times a year
18 µg.m-3
24 hour mean
annual mean
31.12.2010
31.12.2010
Sulphur dioxide 350 µg.m-3 not to be exceeded more than 24 times a year
125 µg.m-3 not to be exceeded more than 3 times a year
266 µg.m-3 not to be exceeded more than 35 times a year
1 hour mean
24 hour mean
15 minute mean
31.12.2004
31.12.2004
31.12.2005
a. Measured using the European gravimetric transfer sampler or equivalent. b. These 2010 Air Quality Objectives for PM10 apply in Scotland, as set out in the Air Quality (Scotland) Amendment Regulations 2002.
Unrestricted AEAT/ENV/R/2930 Issue 1.
AEA 5
2.2 Sensitive locations
The locations where objectives apply are defined in the AQS as locations outside buildings or other natural or man-made structures above or below ground where members of the public are regularly present and might reasonably be expected to be exposed over the relevant averaging period of the objectives. Typically, these include residential properties, hospitals and schools for the longer averaging periods (i.e. annual mean) pollutant objectives and residential dwellings for short-term (i.e. 1-hour and 24 hour) pollutant objectives.
2.3 Combustion plant emissions
The utilisation of biomass for energy can affect air quality in a variety of ways. A large proportion of the total air pollutants of a bioenergy production chain are released during combustion of biomass or biomass-derived fuels. Emission levels of some of these pollutants, such as NOx and oxides of sulphur (SOx) depend heavily on the chemical composition of individual fuels while emission levels of other pollutants such as particulates (PM), PAHs and carbon monoxide depend on the completeness of the combustion process. The sulphur and nitrogen content of wood biomass is low but higher than for gas and hence displacement of gas may lead to a modest increase in SO2 and NOx emission. The emissions to atmosphere from combustion can cause impact on the environment at a local, national and transboundary scale. However, the pollutants associated with biomass combustion are also associated with other combustion processes (including transport) and the use of biomass can lead to an increase or decrease in emission. The relative contribution will depend on the type of fuel and combustion technology displaced. Some of these pollutants (e.g. PM, SO2 and NOx) are regulated by British and European legislation on air quality. The subject of this assessment is the dispersion of PM10 and NOx resulting from the current Peaslake biomass boiler. The relevant pollutants are described below.
Particulates (PM10)
Particle pollution is one of the most difficult measurements but most widely understood by the public as it is visible through its effects on soiling and nasal passages. The quantification of particulate material (PM) is
defined by its effective aerodynamic diameter i.e. PM10 is all material up to aerodynamic diameter of 10 m. This size fraction represents the depth particles travel into the respiratory system. Particles arise from both combustion processes such as coal, biomass or traffic and from abrasive processes such as construction, vehicle movement, grinding and cutting operations. These are both regarded a primary particles. Secondary PM results from atmospheric reactions between other pollutants emitted such as sulphur, nitrogen oxides and ammonia, and consists of a mix of compounds but to a large degree is composed of ammonium nitrate, chloride and sulphate. Exposure to fine particles is associated with respiratory and cardiovascular illnesses, as these particle sizes are likely to be inhaled into the thoracic region of the respiratory tract.
Oxides of nitrogen (NOx)
As part of combustion using air as the source of oxygen, oxides of nitrogen are produced as a result of the reaction between the nitrogen present in the air. Oxides of nitrogen include nitric oxide (NO) and NO2. In addition to these species, nitrous oxide (N2O) can be produced under certain conditions and within certain processes e.g. fluidised bed combustion. Road transport is the main source of NOX associated with the air quality issues but power and industrial sectors using combustion make appreciable contributions. High levels of NOx are associated with damage to lung function and enhancement of the response to allergens in sensitive individuals. In addition, NOX contributes to acidification and/or eutrophication of habitats. This affect does not necessarily impact on the local environment but can impact great distances from the source. N2O has a contribution to global warming and hence climate change as it acts as a greenhouse gas and is 290 times more effective as a greenhouse gas than methane. NOX also contributes to ground level ozone via reactions with volatile organic compounds and sunlight.
Unrestricted AEAT/ENV/R/2930 Issue 1.
6 AEA
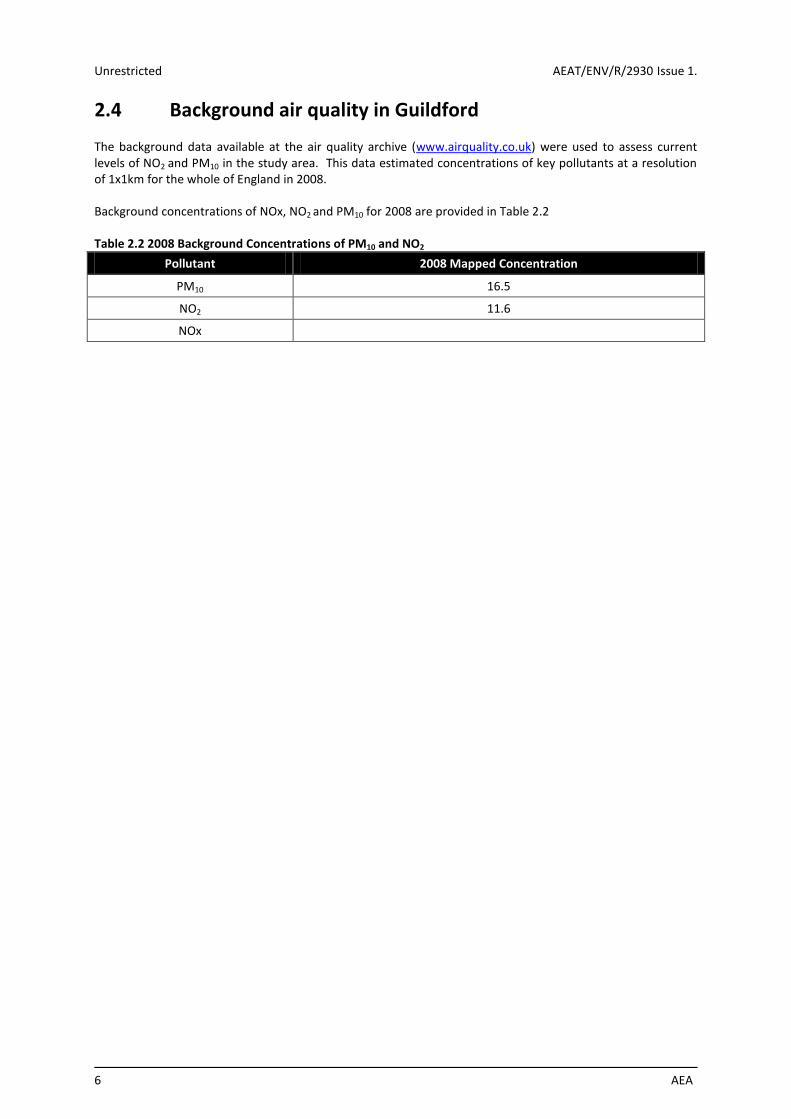
2.4 Background air quality in Guildford
The background data available at the air quality archive (www.airquality.co.uk) were used to assess current levels of NO2 and PM10 in the study area. This data estimated concentrations of key pollutants at a resolution of 1x1km for the whole of England in 2008.
Background concentrations of NOx, NO2 and PM10 for 2008 are provided in Table 2.2
Table 2.2 2008 Background Concentrations of PM10 and NO2
Pollutant 2008 Mapped Concentration
PM10 16.5
NO2 11.6
NOx
Unrestricted AEAT/ENV/R/2930 Issue 1.
AEA 7
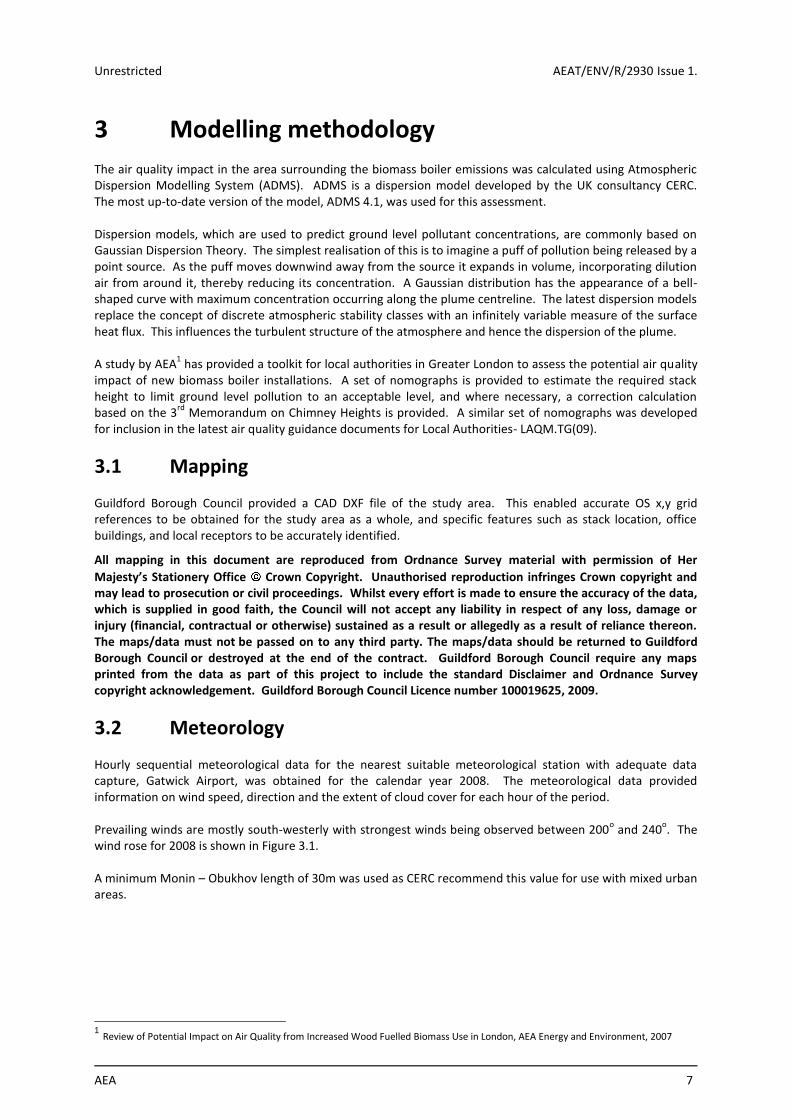
3 Modelling methodology
The air quality impact in the area surrounding the biomass boiler emissions was calculated using Atmospheric Dispersion Modelling System (ADMS). ADMS is a dispersion model developed by the UK consultancy CERC. The most up-to-date version of the model, ADMS 4.1, was used for this assessment. Dispersion models, which are used to predict ground level pollutant concentrations, are commonly based on Gaussian Dispersion Theory. The simplest realisation of this is to imagine a puff of pollution being released by a point source. As the puff moves downwind away from the source it expands in volume, incorporating dilution air from around it, thereby reducing its concentration. A Gaussian distribution has the appearance of a bell-shaped curve with maximum concentration occurring along the plume centreline. The latest dispersion models replace the concept of discrete atmospheric stability classes with an infinitely variable measure of the surface heat flux. This influences the turbulent structure of the atmosphere and hence the dispersion of the plume. A study by AEA
1 has provided a toolkit for local authorities in Greater London to assess the potential air quality
impact of new biomass boiler installations. A set of nomographs is provided to estimate the required stack height to limit ground level pollution to an acceptable level, and where necessary, a correction calculation based on the 3
rd Memorandum on Chimney Heights is provided. A similar set of nomographs was developed
for inclusion in the latest air quality guidance documents for Local Authorities- LAQM.TG(09).
3.1 Mapping
Guildford Borough Council provided a CAD DXF file of the study area. This enabled accurate OS x,y grid references to be obtained for the study area as a whole, and specific features such as stack location, office buildings, and local receptors to be accurately identified.
All mapping in this document are reproduced from Ordnance Survey material with permission of Her
Majesty’s Stationery Office Crown Copyright. Unauthorised reproduction infringes Crown copyright and may lead to prosecution or civil proceedings. Whilst every effort is made to ensure the accuracy of the data, which is supplied in good faith, the Council will not accept any liability in respect of any loss, damage or injury (financial, contractual or otherwise) sustained as a result or allegedly as a result of reliance thereon. The maps/data must not be passed on to any third party. The maps/data should be returned to Guildford Borough Council or destroyed at the end of the contract. Guildford Borough Council require any maps printed from the data as part of this project to include the standard Disclaimer and Ordnance Survey copyright acknowledgement. Guildford Borough Council Licence number 100019625, 2009.
3.2 Meteorology
Hourly sequential meteorological data for the nearest suitable meteorological station with adequate data capture, Gatwick Airport, was obtained for the calendar year 2008. The meteorological data provided information on wind speed, direction and the extent of cloud cover for each hour of the period. Prevailing winds are mostly south-westerly with strongest winds being observed between 200
o and 240
o. The
wind rose for 2008 is shown in Figure 3.1. A minimum Monin – Obukhov length of 30m was used as CERC recommend this value for use with mixed urban areas.
1 Review of Potential Impact on Air Quality from Increased Wood Fuelled Biomass Use in London, AEA Energy and Environment, 2007

Unrestricted AEAT/ENV/R/2930 Issue 1.
8 AEA
Figure 3.1 Gatwick Wind Roses for 2008 C:\Guildford Biomass Assessment\met data\GKK08.ADM
0
0
3
1.5
6
3.1
10
5.1
16
8.2
(knots)
(m/s)
Wind speed
0° 10°20°
30°
40°
50°
60°
70°
80°
90°
100°
110°
120°
130°
140°
150°
160°170°180°190°
200°
210°
220°
230°
240°
250°
260°
270°
280°
290°
300°
310°
320°
330°
340°350°
200
400
600
800
3.3 Building parameters
Nearby buildings and complex topography can have a significant effect on the dispersion characteristics of a stack plume. The main effect can be to increase concentrations in the immediate vicinity of the building, while reducing concentrations further away. The estimated dimensions of the idealised buildings (Peaslake School, local out buildings etc) were input to the model to assess the effect of on-site buildings on dispersion. ADMS contains algorithms that account for these effects and these have been included in this exercise. Building locations and dimensions were added using the ADMS Mapper utility using a DXF base map to ensure correct location and orientation. The utility calculates the width, length and rotation of the buildings from the graphical input of the user. ADMS Mapper cannot model complex building shapes so the idealised buildings are rectangular. The building input data used in the assessment is provided in Table 3.1 below. Table 3.1 Building Parameters as defined in ADMS
Building Grid Reference at Centre
Height (m) Length (m) Width (m) X Y
Biomass Unit Housing 509020.1 145158.9 3.95 4.28 11.17
Peaslake School 509012.7 145141.8 8.50 13.24 28.88
Overlea Section 1 508970.8 145159.4 6.00 6.71 12.89
Overlea Section 2 508962.0 145157.5 6.00 10.77 4.25
Windy 508996.9 145121.8 6.00 9.97 15.89
Outbuilding Section 1 509064.3 145111.0 2.50 5.35 15.76
Out Building Section 2 509073.6 145104.0 2.50 6.96 16.31
Hurst/ Autumn Section 1 509082.4 145135.2 10.00 6.61 4.64
Hurst/ Autumn Section 2 509088.3 145132.9 10.00 23.34 7.48
3.4 Terrain and land use
The site is located in a flat area of Guildford and has a typical elevation of around 140 m above sea level. The boiler house is partially bounded by residential and commercial buildings to the north and west, and mainly open to the south and east. A surface roughness value of 0.5m was used as CERC suggest this is appropriate for open suburbia and parkland. Model default values were used for surface albedo (0.23) and the Priestley Taylor parameter (1).
Unrestricted AEAT/ENV/R/2930 Issue 1.
AEA 9
3.5 Addition of background concentrations to modelled contribution
In order to assess the impact of emissions on local air quality using dispersion models it is necessary to add the modelled concentrations to background concentrations. If the impact on air quality is assessed in terms of pollutant concentrations averaged over a year, then the total concentration is the sum of the source and background averaged concentrations. However, serious effects of many air pollutants on human health arise from short-term peak concentrations rather than longer term averages. This is reflected in the AQS objectives, which, in terms of NO2, are set in terms of the highest percentiles of hourly concentrations experienced in a year. For impacts assessed in this way, it is not appropriate to add the maximum-modelled source concentrations to the maximum background concentrations because they are unlikely to occur simultaneously. Research carried out by the Environment Agency provided a method for addition of these components
2. It was
found that simple addition can overestimate the source contribution by a factor of up to two and that in general the overestimate is more severe for higher percentiles. Two additional methods were proposed- with the one used in this assessment being the twice-annual mean method. This takes the form:
mqq AST 2
S is the source concentration, A is the background concentration, T is the sum of the two, q is the required percentile, and m is the annual mean.
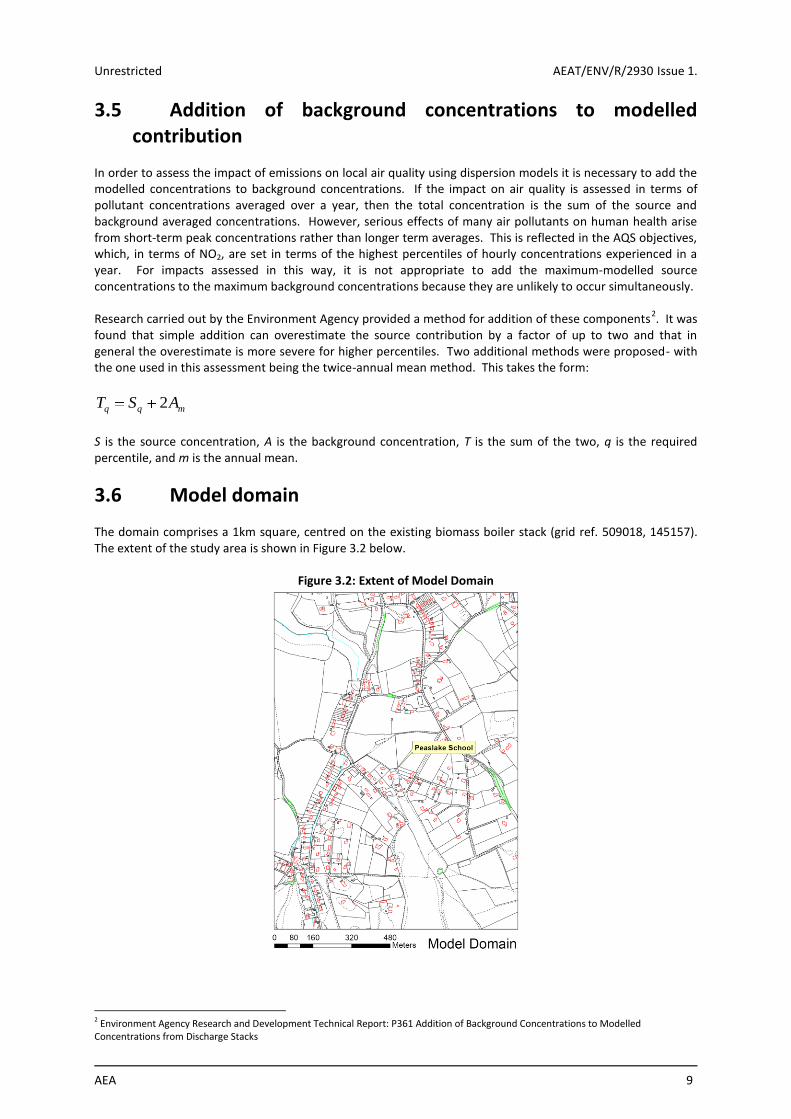
3.6 Model domain
The domain comprises a 1km square, centred on the existing biomass boiler stack (grid ref. 509018, 145157). The extent of the study area is shown in Figure 3.2 below.
Figure 3.2: Extent of Model Domain
2 Environment Agency Research and Development Technical Report: P361 Addition of Background Concentrations to Modelled Concentrations from Discharge Stacks
Unrestricted AEAT/ENV/R/2930 Issue 1.
10 AEA
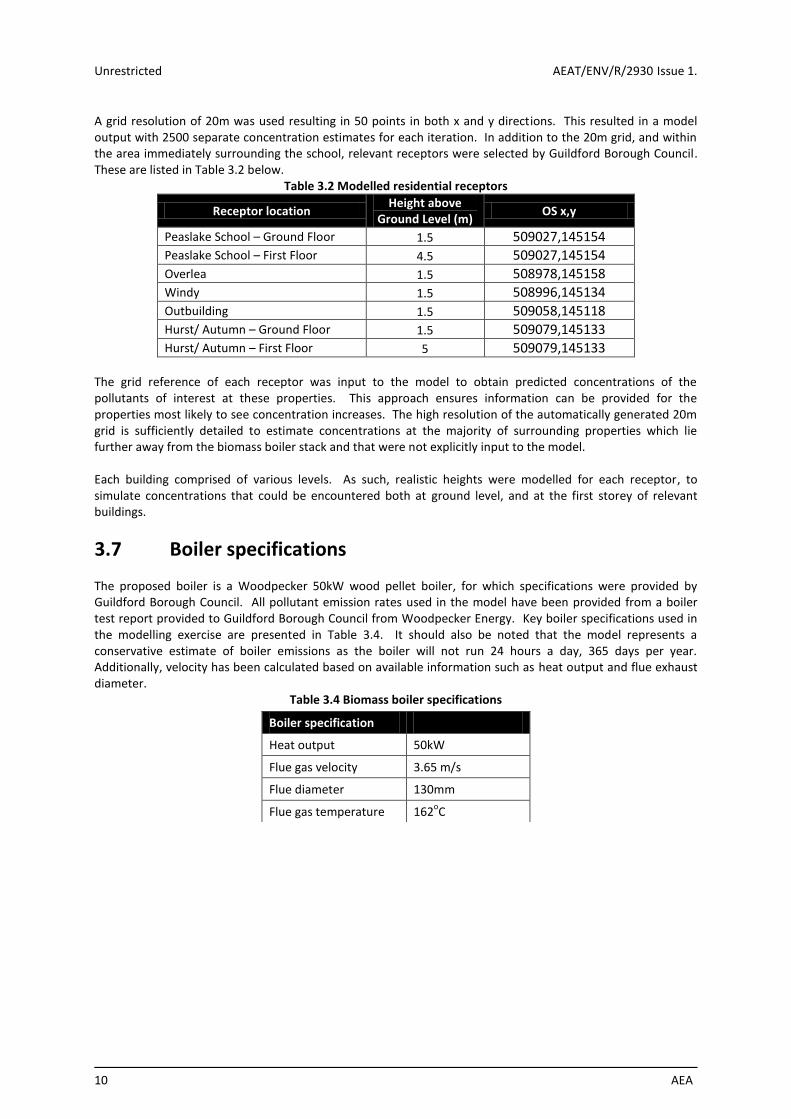
A grid resolution of 20m was used resulting in 50 points in both x and y directions. This resulted in a model output with 2500 separate concentration estimates for each iteration. In addition to the 20m grid, and within the area immediately surrounding the school, relevant receptors were selected by Guildford Borough Council. These are listed in Table 3.2 below.
Table 3.2 Modelled residential receptors
Receptor location Height above
Ground Level (m) OS x,y
Peaslake School – Ground Floor 1.5 509027,145154 Peaslake School – First Floor 4.5 509027,145154
Overlea 1.5 508978,145158 Windy 1.5 508996,145134 Outbuilding 1.5 509058,145118 Hurst/ Autumn – Ground Floor 1.5 509079,145133 Hurst/ Autumn – First Floor 5 509079,145133
The grid reference of each receptor was input to the model to obtain predicted concentrations of the pollutants of interest at these properties. This approach ensures information can be provided for the properties most likely to see concentration increases. The high resolution of the automatically generated 20m grid is sufficiently detailed to estimate concentrations at the majority of surrounding properties which lie further away from the biomass boiler stack and that were not explicitly input to the model. Each building comprised of various levels. As such, realistic heights were modelled for each receptor, to simulate concentrations that could be encountered both at ground level, and at the first storey of relevant buildings.
3.7 Boiler specifications
The proposed boiler is a Woodpecker 50kW wood pellet boiler, for which specifications were provided by Guildford Borough Council. All pollutant emission rates used in the model have been provided from a boiler test report provided to Guildford Borough Council from Woodpecker Energy. Key boiler specifications used in the modelling exercise are presented in Table 3.4. It should also be noted that the model represents a conservative estimate of boiler emissions as the boiler will not run 24 hours a day, 365 days per year. Additionally, velocity has been calculated based on available information such as heat output and flue exhaust diameter.
Table 3.4 Biomass boiler specifications
Boiler specification
Heat output 50kW
Flue gas velocity 3.65 m/s
Flue diameter 130mm
Flue gas temperature 162oC
Unrestricted AEAT/ENV/R/2930 Issue 1.
AEA 11
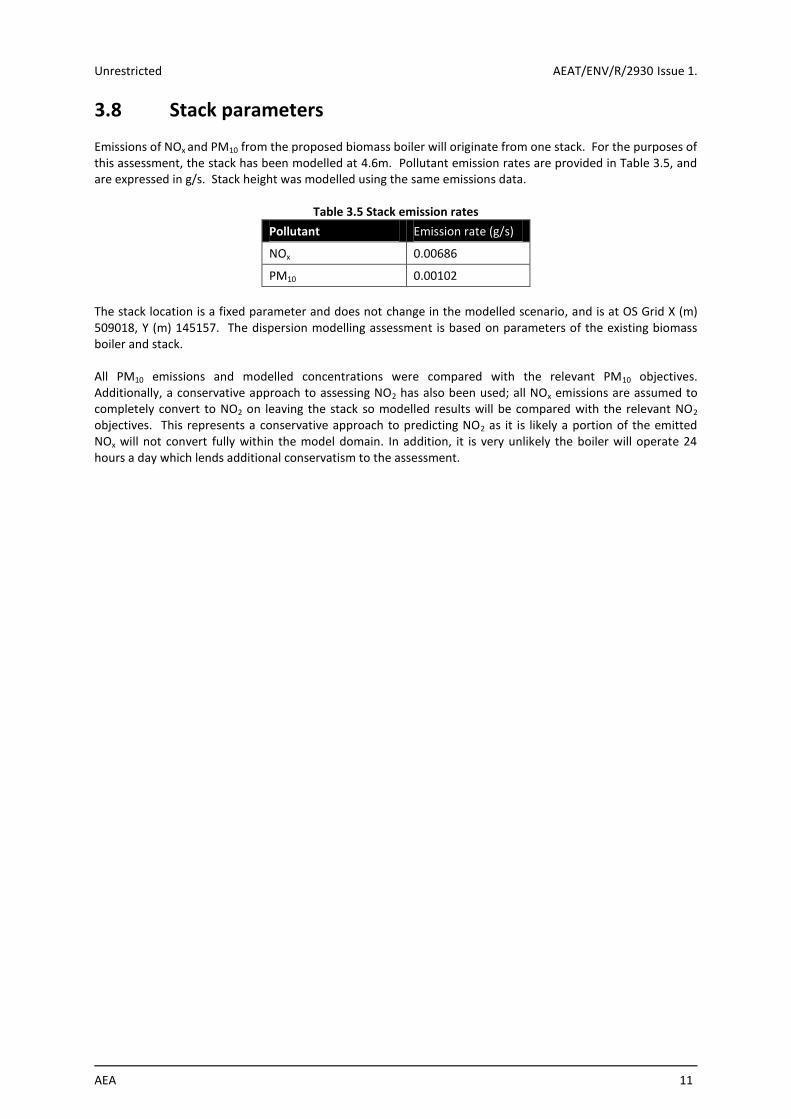
3.8 Stack parameters
Emissions of NOx and PM10 from the proposed biomass boiler will originate from one stack. For the purposes of this assessment, the stack has been modelled at 4.6m. Pollutant emission rates are provided in Table 3.5, and are expressed in g/s. Stack height was modelled using the same emissions data.
Table 3.5 Stack emission rates
Pollutant Emission rate (g/s)
NOx 0.00686
PM10 0.00102
The stack location is a fixed parameter and does not change in the modelled scenario, and is at OS Grid X (m) 509018, Y (m) 145157. The dispersion modelling assessment is based on parameters of the existing biomass boiler and stack. All PM10 emissions and modelled concentrations were compared with the relevant PM10 objectives. Additionally, a conservative approach to assessing NO2 has also been used; all NOx emissions are assumed to completely convert to NO2 on leaving the stack so modelled results will be compared with the relevant NO2 objectives. This represents a conservative approach to predicting NO2 as it is likely a portion of the emitted NOx will not convert fully within the model domain. In addition, it is very unlikely the boiler will operate 24 hours a day which lends additional conservatism to the assessment.

Unrestricted AEAT/ENV/R/2930 Issue 1.
12 AEA
4 Dispersion Modelling Results
The dispersion model has been used to predict ground level concentrations across the domain providing concentration estimates for 2500 points. In addition to their ground level concentrations being modelled explicitly, nearby residential receptors were also assigned a height relative to the number of storeys for each building to assess the concentrations that could be encountered on the (where relevant) first floor of these properties. Results are presented for the highest predicted concentrations across the domain and at designated receptors for the modelled stack height of 4.6m. See table 4.1 for details. Additionally, contour maps showing the contribution of the boiler to local concentrations of PM10 and NO2 are provided in Figures 4.1-4.4.
4.1 Results
PM10 Annual Mean
For the PM10 annual mean, the maximum stack contribution predicted at any ground level location within the
grid of receptor points (1,000,000m3) is 0.8 g.m
-3 located at an area immediately to the east of the Biomass
Boiler House. This equates to 2.0% of the PM10 objective. When background for PM10 (16.5 g.m-3
) is added to
the stack contribution, a value of 17.3 g.m-3
is derived. This equates to 43.3% of the annual mean objective for PM10. This is not an area where continuous exposure is expected. The maximum stack contribution predicted at any of the receptors was observed at the 4.5m level (1
st Floor) of
Peaslake School, and is around 0.7 g.m-3
. This equates to 1.8% of the PM10 objective. When combined with
the 2008 annual background, a value of 17.7 g.m-3
is derived, which equates to 44.3% of the PM10 objective. Details of concentrations at other receptors are shown in Table 4.1. Annual mean PM10 predictions for this stack height are presented spatially in the contour plot in Figure 4.1.
PM10 Short Term 24hr Mean
For the particulate 24 hr mean, the maximum 90th
%ile stack contribution predicted at any ground level
location within the grid of receptor points (1,000,000m3) is 2.0 g.m
-3 located at an area immediately to the
east of the Biomass Boiler House. This is equivalent to 4.0% of the 24 hour mean objective. When this is added
to twice the annual background for 2008 (33.0 g.m-3
) a value of 35.0 g.m-3
is derived which is equivalent to 70.0% of the objective. The maximum stack contribution predicted at any of the additional receptors was observed at the 4.5m level of
Peaslake School, and is around 2.5 g.m-3
. This is equivalent to 5.0% of the 24 hr mean objective. When this is
added to twice the annual background for 2008 (33.0 g.m-3
) a value of 35.5 g.m-3
is derived which is equivalent to 71.0% of the objective. Details of concentrations at other receptors are shown in Table 4.1. 24 hour mean PM10 predictions for this stack height are presented spatially in the contour plot in Figure 4.2.
NO2 Annual Mean
For the NO2 annual mean, the maximum stack contribution predicted at any ground level location within the
grid of receptor points (1,000,000m3) is 5.7 g.m
-3 located at an area immediately to the east of the Biomass
Boiler House. This equates to 14.3% of the NO2 objective. When the 2008 background concentration (11.6
g.m-3
) is added to the stack contribution, a value of 17.3 g/m3
is derived. This equates to 43.3% of the annual mean objective for NO2. This is not an area where continuous exposure is expected.

Unrestricted AEAT/ENV/R/2930 Issue 1.
AEA 13
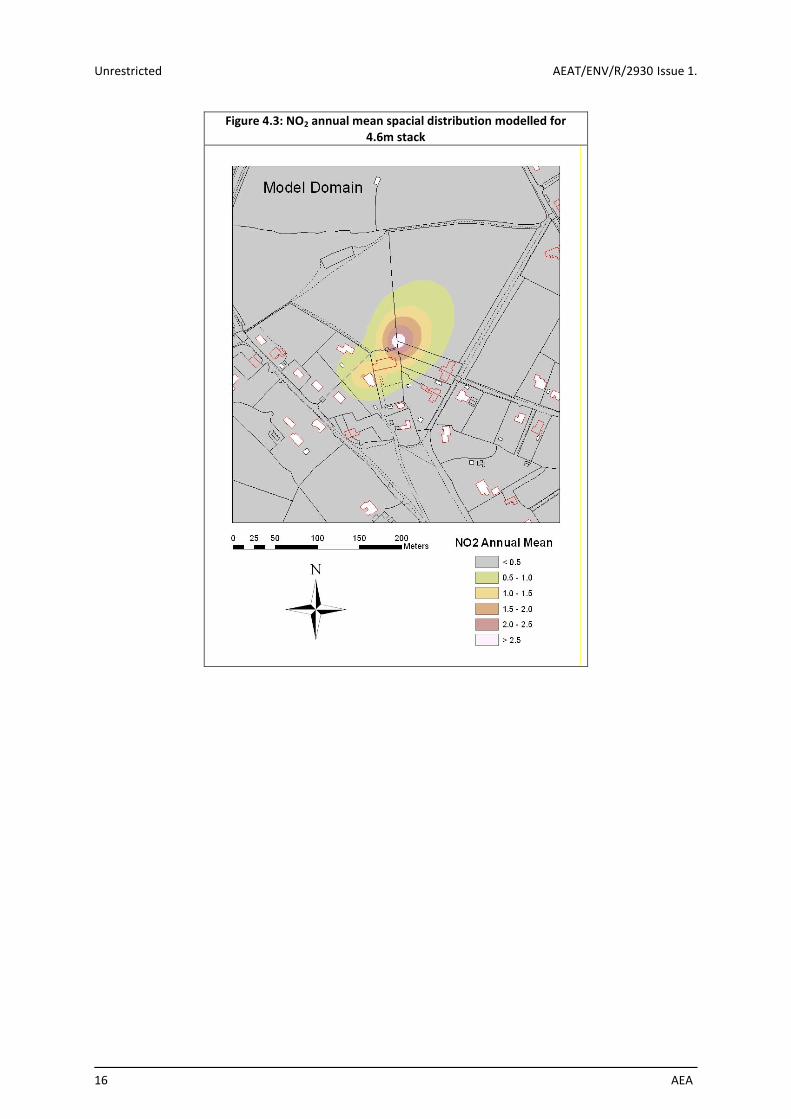
The maximum stack contribution predicted at any of the receptors was observed at the 4.5m level of Peaslake
School, and is around 5.5 g.m-3
. This equates to 13.8% of the NO2 objective. When combined with the 2008
annual background, a value of 17.1 g.m-3
is derived, this equates to 42.3% of the NO2 objective. Details of concentrations at other receptor are shown in Table 4.1. Annual mean NO2 predictions for this stack height are presented spatially in the contour plot in Figure 4.3.
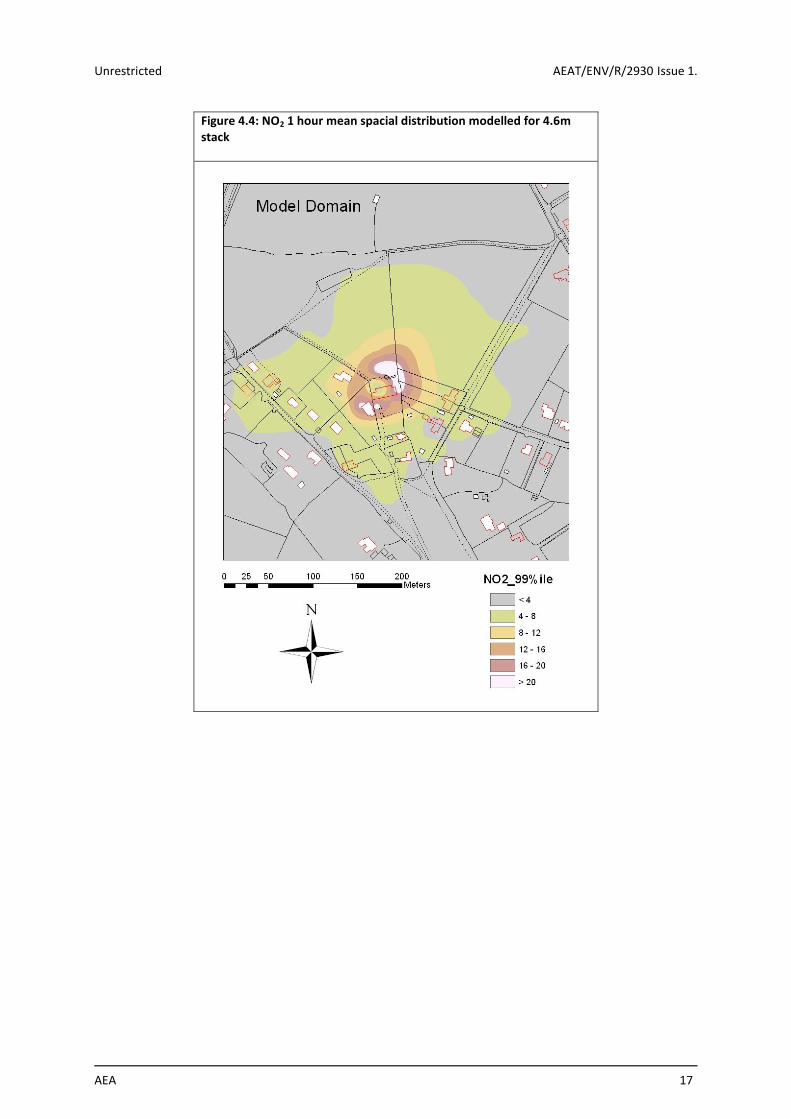
NO2 Short Term 1hr Mean
For the NO2 1 hour mean, the maximum 99th
%ile stack contribution predicted at any ground level location
within the grid of receptor points (1,000,000m3) is 24.4 g.m
-3 located west of the Biomass Boiler House. This
is equivalent to 12.2% of the 1 hour mean objective. When this is added to twice the annual background for
2008 (23.2 g.m-3
) a value of 47.5 g.m-3
is derived which is equivalent to 23.8% of the objective. The maximum stack contribution predicted at any of the additional receptors was observed at the 4.5m level of
Peaslake School, and is around 84.1 g.m-3
. This is equivalent to 42.1% of the 1 hour mean objective. When
this is added to twice the annual background for 2008 a value of 107.3 g.m-3
is derived which is equivalent to 53.7% of the objective. It should be noted that a very conservative assessment technique has been used so it is likely that the NO2 concentrations described will be overestimates as some proportion of the released NOx will not convert to NO2 in the domain. Details of concentrations at other receptor are shown in Table 4.1. 1 hour mean NO2 predictions for this stack height are presented spatially in the contour plot in Figure 4.4. Table 4.1: Details and Concentrations at various specified receptors based on 4.6m-stack height
Receptor Name
Approx height above
ground (m) Background NO2 (µg.m-3)
Background PM10 (µg.m-3)
Process contribution NO2 Annual
Mean (µg.m-3)
Process contribution
NO2 99th %ile (µg.m-3)
Process contribution PM10 Annual Mean (µg.m-3)
Process contribution PM10 90th
%ile (µg.m-3)
Peaslake School Gnd Floor
1.5 11.60 16.50 4.60 25.29 0.64 1.35
Peaslake School First Floor
4.5 11.60 16.50 5.55 84.13 0.71 2.45
Overlea 1.5 11.60 16.50 0.56 11.33 0.09 0.31
Windy 1.5 11.60 16.50 3.25 21.91 0.48 1.08
Outbuilding 1.5 11.60 16.50 0.35 8.25 0.05 0.20
Hurst/ Autumn Gnd Floor
1.5 11.60 16.50 0.31 7.80 0.04 0.15
Hurst/ Autumn First Floor
5 11.60 16.50 0.29 9.71 0.04 0.14
Results are presented in terms of the emissions contribution to the annual, 1-hour and 24-hour Air Quality Standards for both NO2 and PM10. Currently, the annual and 1-hour mean objectives for NO2 are set at 40
g.m-3
and 200 g.m-3
, respectively. For PM10 the annual and 24-hour mean objectives are 40 g.m-3
and 50
g.m-3
. The annual mean standard (the average of all hourly concentrations in the year) is an absolute value which should not be exceeded at locations with relevant exposure, whereas the NO2 1-hour standard represents a value which can be exceeded no more than 18 times in a calendar year and the PM10 24-hour standard can be exceeded no more than 35 times per calendar year.

Unrestricted AEAT/ENV/R/2930 Issue 1.
14 AEA
4.2 Dispersion Contour Plots
The results of the modelling exercise for PM10 and NOx (NOx has been conservatively assumed to completely convert to NO2) are presented spatially for the base case stack height of 10m (from ground level) in Figures 4.1-
4.4. Results are presented as process contribution in g.m-3
.
Figure 4.1: PM10 annual mean spacial distribution modelled for 4.6m stack

Unrestricted AEAT/ENV/R/2930 Issue 1.
AEA 15
Figure 4.2: PM10 24 hour mean spacial distribution modelled for 4.6m stack
Unrestricted AEAT/ENV/R/2930 Issue 1.
16 AEA
Figure 4.3: NO2 annual mean spacial distribution modelled for 4.6m stack
Unrestricted AEAT/ENV/R/2930 Issue 1.
AEA 17
Figure 4.4: NO2 1 hour mean spacial distribution modelled for 4.6m stack
Unrestricted AEAT/ENV/R/2930 Issue 1.
18 AEA
5 Conclusions
Atmospheric Dispersion Modelling System (ADMS) Version 4.1 was used to predict the air quality impact of the existing Woodpecker 50kW biomass burning boiler on the locality surrounding Peaslake Infant School, in Guildford. A constant emission scenario has been assumed to produce a conservative assessment of air quality impact. Concentrations of NO2 and PM10 have been predicted for an existing stack height of 4.6 m above ground level. The results indicate that the boiler emissions will not result in any exceedences of the AQS objectives for NO2 and PM10, indeed the process contributions are typically a small percentage of the overall AQS objectives. The worst case result modelled during this exercise was modelled at the 1
st floor of Peaslake School for annual
mean objectives for NO2 (5.5 g.m-3
) and PM10.(0.7 g.m-3
). These modelled concentrations represent 13.8 %
and 1.8% of the annual mean objective (40 g/m3) for PM10 and NO2 respectively.
Unrestricted AEAT/ENV/R/2930 Issue 1.
AEA 19
Glengarnock Technology Centre Caledonian Rd Lochshore Business Park Glengarnock Ayrshire KA14 3DD Tel: 0845 345 3302 Fax: 0870 190 5051 E-mail: [email protected],uk
www.aeat.co.uk