Embed Size (px)
Citation preview
Pearson Edexcel Level 3 Advanced Subsidiary and Advanced GCE
Mathematics and
Further Mathematics
Mathematical formulae and statistical tables
For first certification from June 2018 for:
Advanced Subsidiary GCE in Mathematics (8MA0)
Advanced GCE in Mathematics (9MA0)
Advanced Subsidiary GCE in Further Mathematics (8FM0)
For first certification from June 2019 for:
Advanced GCE in Further Mathematics (9FM0)
This copy is the property of Pearson. It is not to be removed from the
examination room or marked in any way.


Contents
1 Introduction 1
2 AS Level in Mathematics 2
Pure Mathematics 2
Statistics 2
Mechanics 3
3 A Level in Mathematics 4
Pure Mathematics 4
Statistics 6
Mechanics 7
4 AS Level in Further Mathematics 8
Pure Mathematics 8
Statistics 12
Mechanics 14
5 A Level in Further Mathematics 15
Pure Mathematics 15
Statistics 21
Mechanics 25
6 Statistical Tables 26
Binomial Cumulative Distribution Function 26
Percentage Points Of The Normal Distribution 31
Poisson Cumulative Distribution Function 32
Percentage Points of the 2 Distribution 33
Critical Values for Correlation Coefficients 34
Random Numbers 35
Percentage Points of Student’s t Distribution 36
Percentage Points of the F Distribution 37


Pearson Edexcel Level 3 Advanced Subsidiary and Advanced GCE in Mathematics and Further Mathematics – 1
Mathematical Formulae and Statistical Tables – Version 1.0 – Accredited pre-publication – March 2017
© Pearson Education Limited 2017
1 Introduction The formulae in this booklet have been arranged by qualification. Students sitting AS or A Level
Further Mathematics papers may be required to use the formulae that were introduced in AS or
A Level Mathematics papers.
It may also be the case that students sitting Mechanics and Statistics papers will need to use
formulae introduced in the appropriate Pure Mathematics papers for the qualification they are
sitting.

2 Pearson Edexcel Level 3 Advanced Subsidiary and Advanced GCE in Mathematics and Further Mathematics
– Mathematical Formulae and Statistical Tables – Version 1.0 – Accredited pre-publication – March 2017
© Pearson Education Limited 2017
2 AS Level in Mathematics
Pure Mathematics
Mensuration
Surface area of sphere = 4 r 2
Area of curved surface of cone = r slant height
Binomial series
1 2 2
2( )
1 n n n r r nn n
n na b a b a b b
r
na b a
(n ℕ)
where C( )
n
r
n n!
r r ! n r !
Logarithms and exponentials
loglog
log
ba
b
xx
a
lnex a xa
Differentiation
First Principles
0
f ( ) f ( )f ( ) = lim
h
x h xx
h
Statistics
Probability
P(A) = 1 – P(A)
Standard deviation
Standard deviation = (Variance)
Interquartile range = IQR = Q3 – Q1
For a set of n values 1 2, ,... ,...i nx x x x
22 2 ( )
S ( ) ixx i i
xx x x
n
Standard deviation =
2
2or
S xx
xx
n n

Pearson Edexcel Level 3 Advanced Subsidiary and Advanced GCE in Mathematics and Further Mathematics – 3Mathematical Formulae and Statistical Tables – Version 1.0 – Accredited pre-publication – March 2017
© Pearson Education Limited 2017
Statistical tables
The following statistical tables are required for A Level Mathematics:
Binomial Cumulative Distribution Function (see page 25)
Random Numbers (see page 34)
Mechanics
Kinematics
For motion in a straight line with constant acceleration:
v = u + at
s = ut + ½ at2
s = vt - ½ at2
v2 = u2 + 2as
s = ½ (u + v)t
4 Pearson Edexcel Level 3 Advanced Subsidiary and Advanced GCE in Mathematics and Further Mathematics
– Mathematical Formulae and Statistical Tables – Version 1.0 – Accredited pre-publication – March 2017
© Pearson Education Limited 2017
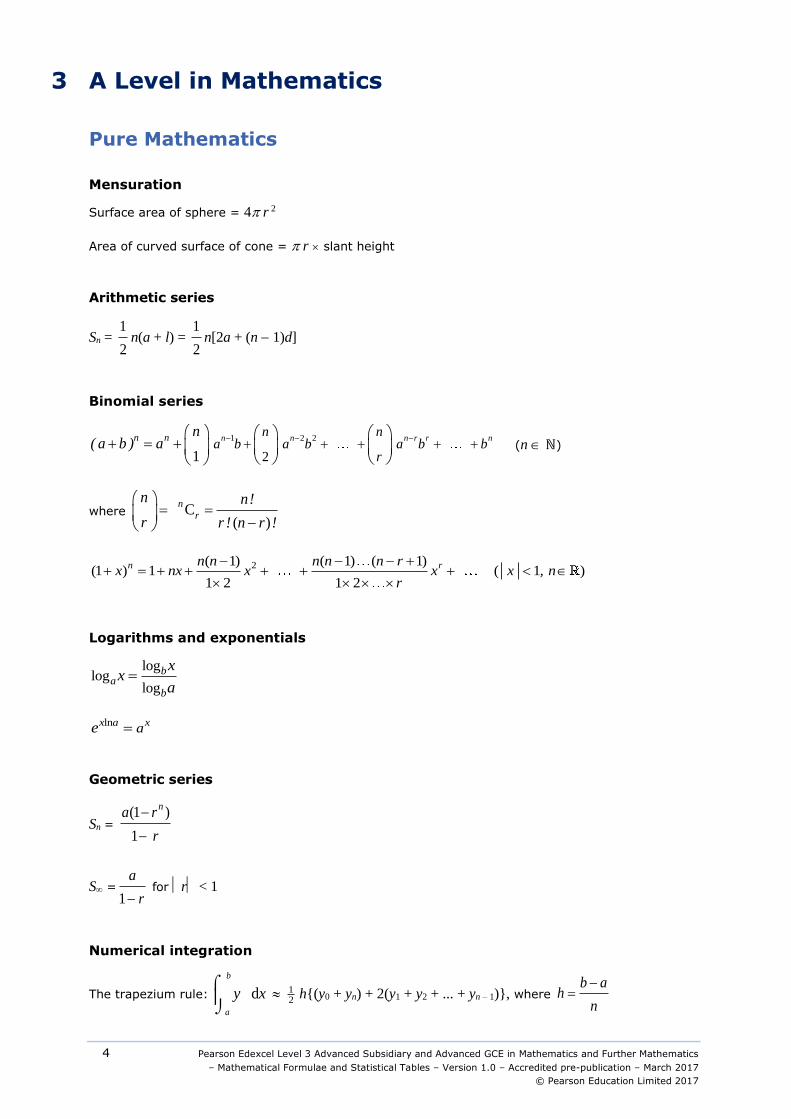
3 A Level in Mathematics
Pure Mathematics
Mensuration
Surface area of sphere = 4 r 2
Area of curved surface of cone = r slant height
Arithmetic series
Sn = 1
2n(a + l) =
1
2n[2a + (n 1)d]
Binomial series
1 2 2
21 n n n r r nn n
n na b a b a b b
r
n( a b ) a
(n ℕ)
where C( )
n
r
n n!
r r ! n r !
2( 1) ( 1) ( 1)(1 ) 1 ( 1 )
1 2 1 2
n rn n n n n rx nx x x x , n
r
Logarithms and exponentials
loglog
log
ba
b
xx
a
lnx a xae
Geometric series
Sn = (1 )
1
na r
r
S =1
a
r for r < 1
Numerical integration
The trapezium rule:
b
a
xy d 21 h{(y0 + yn) + 2(y1 + y2 + ... + yn – 1)}, where
b ah
n

Pearson Edexcel Level 3 Advanced Subsidiary and Advanced GCE in Mathematics and Further Mathematics – 5
Mathematical Formulae and Statistical Tables – Version 1.0 – Accredited pre-publication – March 2017
© Pearson Education Limited 2017
Trigonometric identities
sin ( ) sin cos cos sinA B A B A B
cos( ) cos cos sin sinA B A B A B
1
2
tan tantan ( ) ( ( ) )
1 tan tan
A BA B A B k
A B
sin sin 2sin cos2 2
A B A BA B
sin sin 2cos sin2 2
A B A BA B
cos cos 2cos cos2 2
A B A BA B
cos cos 2sin sin2 2
A B A BA B
Differentiation
First Principles
0
f ( ) f ( )f ( ) = lim
h
x h xx
h
f(x) f (x)
tan kx k sec2 kx
seckx kseckx tankx
cotkx – kcosec2kx
cosec kx – kcosec kx cot kx
f( )
g( )
x
x
2
f ( ) g( ) f( ) g ( )
(g( ))
x x x x
x

6 Pearson Edexcel Level 3 Advanced Subsidiary and Advanced GCE in Mathematics and Further Mathematics
– Mathematical Formulae and Statistical Tables – Version 1.0 – Accredited pre-publication – March 2017
© Pearson Education Limited 2017
Integration (+ constant)
f(x) f( ) d
x x
sec2 kx k
1 tan kx
tankx k
1ln seckx
cot kx k
1ln sin kx
coseckx 12
1 1ln cosec cot , ln tan( )kx kx kx
k k
seckx 1 12 4
1 1ln sec tan , ln tan( )kx kx kx
k k
xx
uvuvx
x
vu d
d
dd
d
d
Numerical solution of equations
The Newton-Raphson iteration for solving 0)f( x : )(f
)f(1
n
n
nnx
xxx
Statistics
Probability
P(A) = 1 – P(A)
P( ) P( ) P( ) P( )A B A B A B
P( ) P( )P( )A B A B | A
)P()|P()P()|P(
)P()|P()|P(
AABAAB
AABBA
For independent events A and B,
P(BA) = P(B), P(AB) = P(A),
P(A B) = P(A) P(B)

Pearson Edexcel Level 3 Advanced Subsidiary and Advanced GCE in Mathematics and Further Mathematics – 7Mathematical Formulae and Statistical Tables – Version 1.0 – Accredited pre-publication – March 2017
© Pearson Education Limited 2017
Standard deviation
Standard deviation = (Variance)
Interquartile range = IQR = Q3 – Q1
For a set of n values 1 2, ,... ,...i nx x x x
n
xxxxS i
iixx
2
22)(
)(
Standard deviation =
2
2xxxS
xn n
or Discrete distributions
Distribution of X P(X = x) Mean Variance
Binomial ),B( pn (1 )x n xnp p
x
np )1( pnp
Sampling distributions
For a random sample of n observations from 2N( , )
~ N(0, 1)/
X
n
Statistical tables
The following statistical tables are required for A Level Mathematics:
Binomial Cumulative Distribution Function (see page 25)
Percentage Points Of The Normal Distribution (30)
Critical Values for Correlation Coefficients: Product Moment Coefficient (see page 33)
Random Numbers (see page 34)
Mechanics
Kinematics
For motion in a straight line with constant acceleration:
v = u + at
s = ut + ½ at2
s = vt - ½ at2
v2 = u2 + 2as
s = ½ (u + v)t
8 Pearson Edexcel Level 3 Advanced Subsidiary and Advanced GCE in Mathematics and Further Mathematics
– Mathematical Formulae and Statistical Tables – Version 1.0 – Accredited pre-publication – March 2017
© Pearson Education Limited 2017
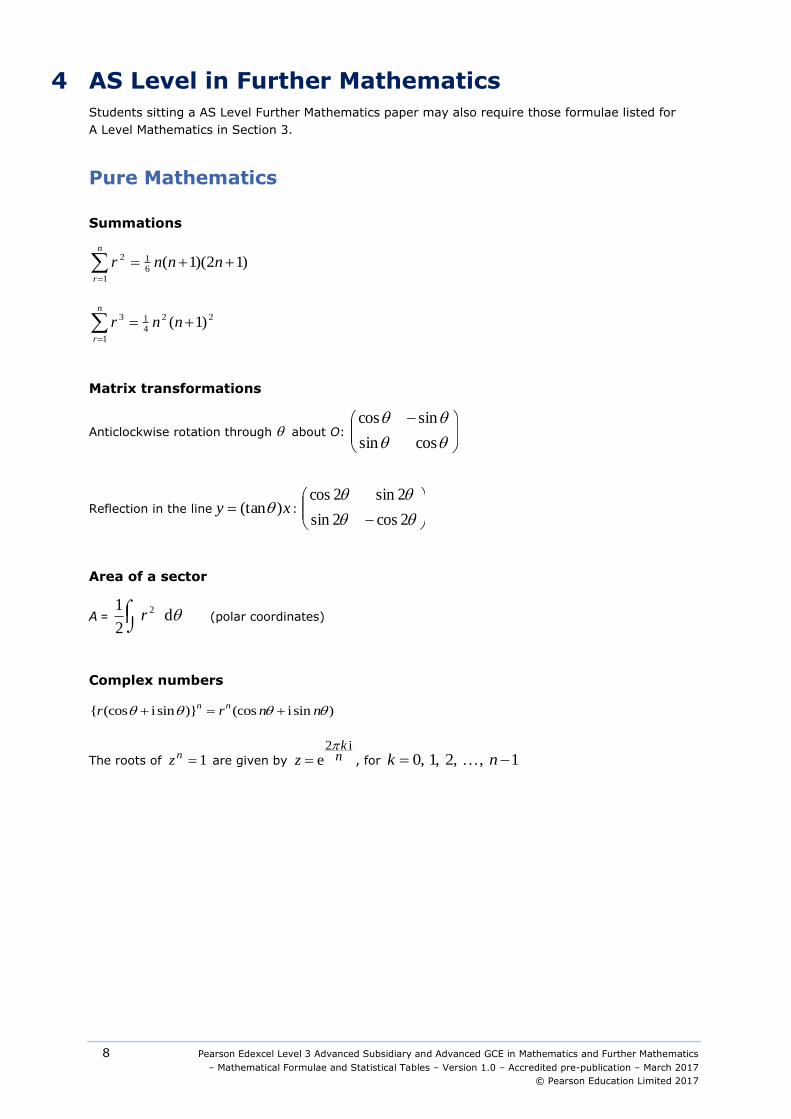
4 AS Level in Further Mathematics
Students sitting a AS Level Further Mathematics paper may also require those formulae listed for
A Level Mathematics in Section 3.
Pure Mathematics
Summations
)12)(1(6
1
1
2
nnnrn
r
22
4
1
1
3 )1(
nnrn
r
Matrix transformations
Anticlockwise rotation through about O:
cos sin
sincos
Reflection in the line xy )(tan :
2cos2sin
2sin 2cos
Area of a sector
A = d
2
1 2r (polar coordinates)
Complex numbers
{ (cos isin )} (cos i sin )n n
r r n n
The roots of 1nz are given by
2 i
ek
nz
, for 1 , ,2 ,1 ,0 nk
Pearson Edexcel Level 3 Advanced Subsidiary and Advanced GCE in Mathematics and Further Mathematics – 9
Mathematical Formulae and Statistical Tables – Version 1.0 – Accredited pre-publication – March 2017
© Pearson Education Limited 2017
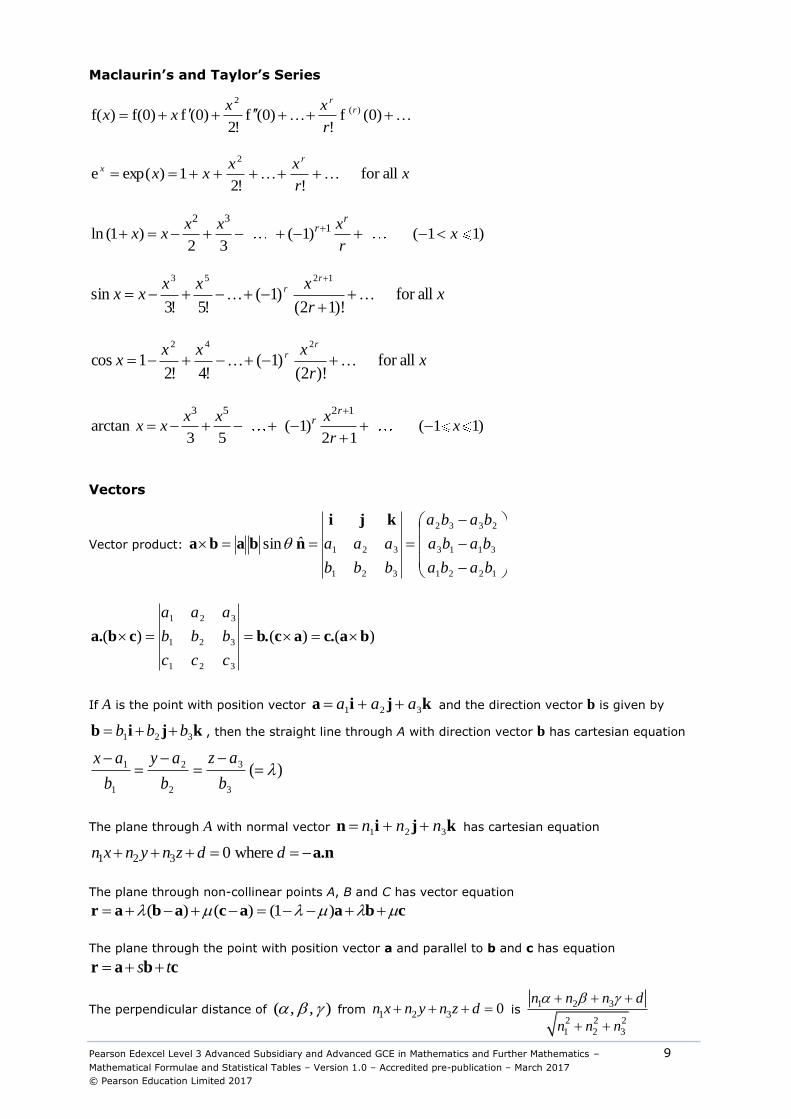
Maclaurin’s and Taylor’s Series
)0(f!
)0(f!2
)0(f)0f()f( )(2
rr
r
xxxx
xr
xxxx
rx allfor
!
!21)exp(e
2
2 31ln (1 ) ( 1) ( 1 1)
2 3
rrx x x
x x xr
xr
xxxxx
rr allfor
)!12()1(
!5!3sin
1253
xr
xxxx
rr allfor
)!2()1(
!4!21cos
242
3 5 2 1
arctan ( 1) ( 1 1)3 5 2 1
rrx x x
x x xr
Vectors
Vector product:
1221
3113
2332
321
321ˆ sin
baba
baba
baba
bbb
aaa
kji
nbaba
)()()(
321
321
321
bac.acb.cba.
ccc
bbb
aaa
If A is the point with position vector kjia 321 aaa and the direction vector b is given by
kjib 321 bbb , then the straight line through A with direction vector b has cartesian equation
)( 3
3
2
2
1
1
b
az
b
ay
b
ax
The plane through A with normal vector kjin 321 nnn has cartesian equation
1 2 3 0 where n x n y n z d d a.n
The plane through non-collinear points A, B and C has vector equation
cbaacabar )1()()(
The plane through the point with position vector a and parallel to b and c has equation
cbar ts
The perpendicular distance of ) , ,( from 1 2 3 0n x n y n z d is 1 2 3
2 2 2
1 2 3
n n n d
n n n

10 Pearson Edexcel Level 3 Advanced Subsidiary and Advanced GCE in Mathematics and Further Mathematics
– Mathematical Formulae and Statistical Tables – Version 1.0 – Accredited pre-publication – March 2017
© Pearson Education Limited 2017
Hyperbolic functions
1sinhcosh 22 xx
xxx coshsinh22sinh
xxx 22 sinhcosh2cosh
)1( 1lnarcosh }{ 2 xxxx
}{ 1lnarsinh 2 xxx
12
1artanh ln ( 1)
1
xx x
x
Differentiation
f(x) f(x)
xarcsin 21
1
x
xarccos 21
1
x
xarctan 21
1
x
xsinh xcosh
xcosh xsinh
xtanh x2sech
xarsinh 21
1
x
xarcosh 1
1
2 x
artanh x 21
1
x
Pearson Edexcel Level 3 Advanced Subsidiary and Advanced GCE in Mathematics and Further Mathematics – 11Mathematical Formulae and Statistical Tables – Version 1.0 – Accredited pre-publication – March 2017
© Pearson Education Limited 2017
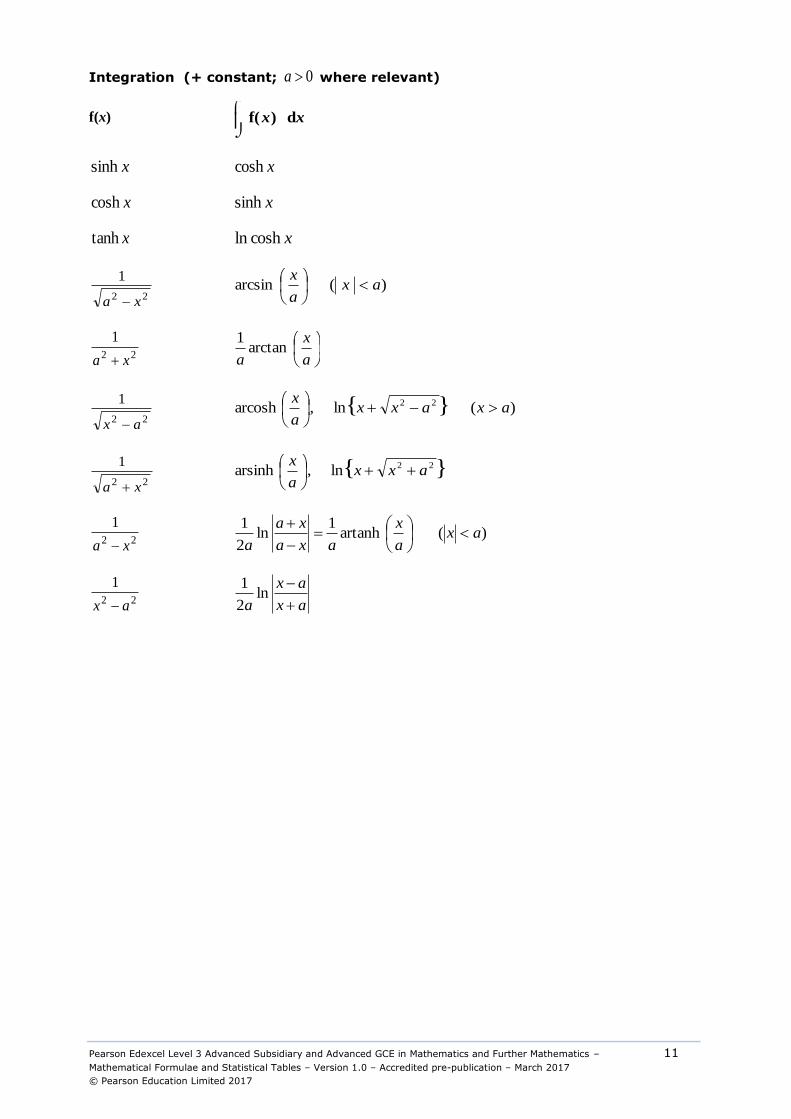
Integration (+ constant; 0a where relevant)
f(x)
xx d)f(
xsinh xcosh
xcosh xsinh
xtanh xcoshln
22
1
xa
)( arcsin axa
x
22
1
xa
a
x
aarctan
1
22
1
ax
)( ln,arcosh }{ 22 axaxxa
x
22
1
xa
}{ 22ln,arsinh axxa
x
22
1
xa )( artanh
1ln
2
1ax
a
x
axa
xa
a
22
1
ax ax
ax
a
ln
2
1

12 Pearson Edexcel Level 3 Advanced Subsidiary and Advanced GCE in Mathematics and Further Mathematics
– Mathematical Formulae and Statistical Tables – Version 1.0 – Accredited pre-publication – March 2017
© Pearson Education Limited 2017
Statistics
Discrete distributions
For a discrete random variable X taking values ix with probabilities P(X = xi)
Expectation (mean): E(X) = = ix P(X = ix )
Variance: Var(X) = 2 = ( ix – )2 P(X = ix ) = 2
ix P(X = ix ) – 2
Discrete distributions
Standard discrete distributions:
Distribution of X P(X = x) Mean Variance
Binomial B(n, p) 1n xx
np p
x
np np(1 – p)
Poisson Po ( ) e!
x
x
Continuous distributions
For a continuous random variable X having probability density function f
Expectation (mean): xxxX d)f()E(
Variance: 2222 d)f(d)f()()Var( xxxxxxX
For a function )g( X : xxxX d)f()g())E(g(
Cumulative distribution function:
0
0 0F( ) P( ) f ( ) d
x
x X x t t
Standard continuous distribution:
Distribution of X P.D.F. Mean Variance
Normal ) ,N( 2
2
21
e2
1
x
2
Uniform (Rectangular) on [a, b] ab
1
1
2( )a b
2
12
1 )( ab

Pearson Edexcel Level 3 Advanced Subsidiary and Advanced GCE in Mathematics and Further Mathematics – 13
Mathematical Formulae and Statistical Tables – Version 1.0 – Accredited pre-publication – March 2017
© Pearson Education Limited 2017
Correlation and regression
For a set of n pairs of values ) ,(ii
yx
22 2 ( )
S ( ) ixx i i
xx x x
n
22 2 ( )
S ( ) iyy i i
yy y y
n
( )( )S ( )( ) i i
xy i i i i
x yx x y y x y
n
The product moment correlation coefficient is:
2 2 2 22 2
( )( )S ( )( )
S S ( ) ( ) ( ) ( )
{ }{ }
i ii i
xy i i
xx yy i i i ii i
x yx y
x x y y nrx x y y x y
x yn n
The regression coefficient of y on x is 2
S ( )( )
S ( )
xy i i
xx i
x x y yb
x x
Least squares regression line of y on x is bxay where xbya
Residual Sum of Squares (RSS) =
2
2S
S S 1S
xy
yy yy
xx
r
Spearman’s rank correlation coefficient is
2
2
61
( 1)s
d
n nr
Non-parametric tests
Goodness-of-fit test and contingency tables: 2
2
~)(
i
ii
E
EO
Statistical tables
The following statistical tables are required for AS Level Further Mathematics:
Binomial Cumulative Distribution Function (see page 25)
Poisson Cumulative Distribution Function (see page 31)
Percentage Points of the 2 Distribution (see page 32)
Critical Values for Correlation Coefficients: Product Moment Coefficient and Spearman’s Coefficient
(see page 33)
Random Numbers (see page 34)

14 Pearson Edexcel Level 3 Advanced Subsidiary and Advanced GCE in Mathematics and Further Mathematics
– Mathematical Formulae and Statistical Tables – Version 1.0 – Accredited pre-publication – March 2017
© Pearson Education Limited 2017
Mechanics
Centres of mass
For uniform bodies:
Triangular lamina: 23
along median from vertex
Circular arc, radius r, angle at centre 2 :
sinr from centre
Sector of circle, radius r, angle at centre 2 : 2 sin
3
r
from centre
Pearson Edexcel Level 3 Advanced Subsidiary and Advanced GCE in Mathematics and Further Mathematics – 15Mathematical Formulae and Statistical Tables – Version 1.0 – Accredited pre-publication – March 2017
© Pearson Education Limited 2017
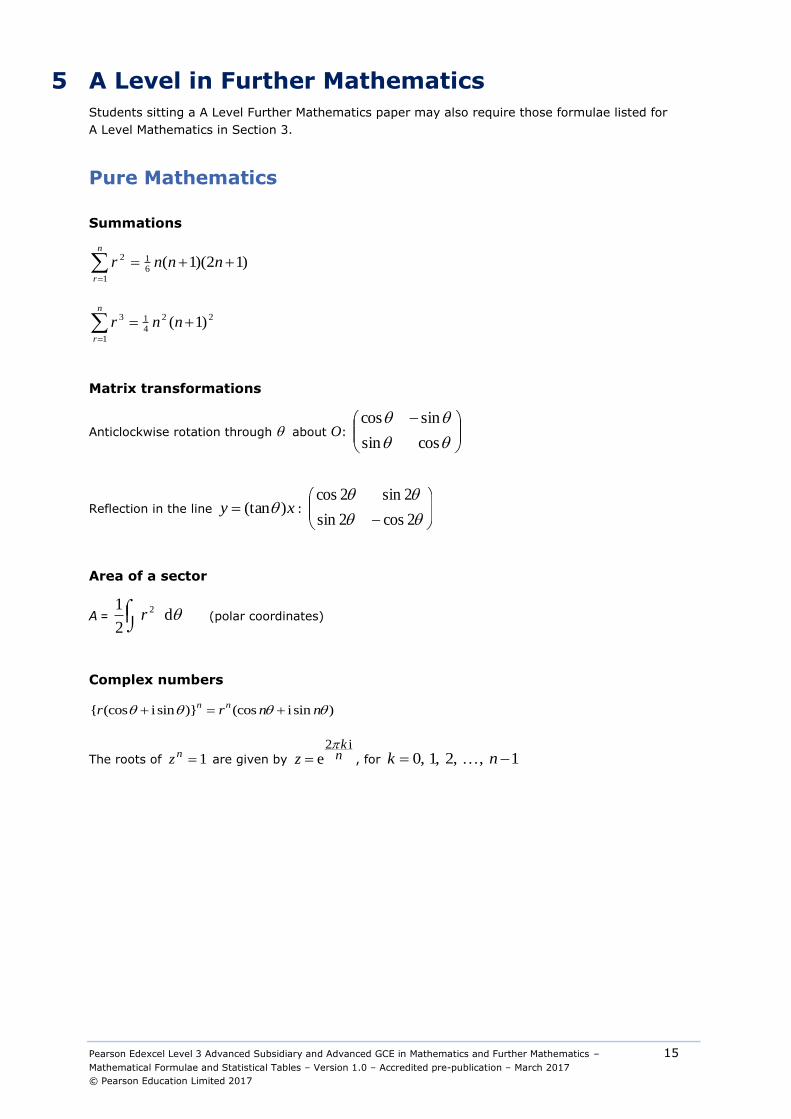
5 A Level in Further Mathematics
Students sitting a A Level Further Mathematics paper may also require those formulae listed for
A Level Mathematics in Section 3.
Pure Mathematics
Summations
)12)(1(6
1
1
2
nnnrn
r
22
4
1
1
3 )1(
nnrn
r
Matrix transformations
Anticlockwise rotation through about O:
cos sin
sincos
Reflection in the line xy )(tan :
2cos2sin
2sin 2cos
Area of a sector
A = d
2
1 2r (polar coordinates)
Complex numbers
{ (cos isin )} (cos i sin )n n
r r n n
The roots of 1nz are given by
2 i
ek
nz
, for 1 , ,2 ,1 ,0 nk

16 Pearson Edexcel Level 3 Advanced Subsidiary and Advanced GCE in Mathematics and Further Mathematics
– Mathematical Formulae and Statistical Tables – Version 1.0 – Accredited pre-publication – March 2017
© Pearson Education Limited 2017
Maclaurin’s and Taylor’s Series
)0(f!
)0(f!2
)0(f)0f()f( )(2
rr
r
xxxx
xr
xxxx
rx allfor
!
!21)exp(e
2
2 31ln (1 ) ( 1) ( 1 1)
2 3
rrx x x
x x xr
xr
xxxxx
rr allfor
)!12()1(
!5!3sin
1253
xr
xxxx
rr allfor
)!2()1(
!4!21cos
242
3 5 2 1
arctan ( 1) ( 1 1)3 5 2 1
rrx x x
x x xr
Vectors
Vector product:
1221
3113
2332
321
321ˆ sin
baba
baba
baba
bbb
aaa
kji
nbaba
)()()(
321
321
321
bac.acb.cba.
ccc
bbb
aaa
If A is the point with position vector kjia 321 aaa and the direction vector b is given by
kjib 321 bbb , then the straight line through A with direction vector b has cartesian equation
)( 3
3
2
2
1
1
b
az
b
ay
b
ax
The plane through A with normal vector kjin 321 nnn has cartesian equation
1 2 3 0 where n x n y n z d d a.n
The plane through non-collinear points A, B and C has vector equation
cbaacabar )1()()(
The plane through the point with position vector a and parallel to b and c has equation
cbar ts The perpendicular distance of ) , ,( from 1 2 3 0n x n y n z d is
1 2 3
2 2 2
1 2 3
n n n d
n n n

Pearson Edexcel Level 3 Advanced Subsidiary and Advanced GCE in Mathematics and Further Mathematics – 17Mathematical Formulae and Statistical Tables – Version 1.0 – Accredited pre-publication – March 2017
© Pearson Education Limited 2017
Hyperbolic functions
1sinhcosh 22 xx
xxx coshsinh22sinh
xxx 22 sinhcosh2cosh
)1( 1lnarcosh }{ 2 xxxx
}{ 1lnarsinh 2 xxx
12
1artanh ln ( 1)
1
xx x
x
Conics
Ellipse Parabola Hyperbola Rectangular
Hyperbola
Standard
Form 1
2
2
2
2
b
y
a
x axy 42 1
2
2
2
2
b
y
a
x
2cxy
Parametric
Form )sin ,cos( ba )2 ,( 2 atat
(a sec , b tan )
(a cosh , b sinh )
t
cct,
Eccentricity 1e
)1( 222 eab 1e
1e
)1( 222 eabe = 2
Foci )0 ,( ae )0 ,(a )0 ,( ae ( 2c , 2c )
Directrices e
ax ax
e
ax x + y = 2c
Asymptotes none none b
y
a
x 0 ,0 yx

18 Pearson Edexcel Level 3 Advanced Subsidiary and Advanced GCE in Mathematics and Further Mathematics
– Mathematical Formulae and Statistical Tables – Version 1.0 – Accredited pre-publication – March 2017
© Pearson Education Limited 2017
Differentiation
f(x) f(x)
xarcsin 21
1
x
xarccos 21
1
x
xarctan 21
1
x
xsinh xcosh
xcosh xsinh
xtanh x2sech
xarsinh 21
1
x
xarcosh 1
1
2 x
artanh x 21
1
x

Pearson Edexcel Level 3 Advanced Subsidiary and Advanced GCE in Mathematics and Further Mathematics – 19Mathematical Formulae and Statistical Tables – Version 1.0 – Accredited pre-publication – March 2017
© Pearson Education Limited 2017
Integration (+ constant; 0a where relevant)
f(x)
xx d)f(
xsinh xcosh
xcosh xsinh
xtanh xcoshln
22
1
xa
)( arcsin axa
x
22
1
xa
a
x
aarctan
1
22
1
ax
)( ln,arcosh }{ 22 axaxxa
x
22
1
xa
}{ 22ln,arsinh axxa
x
22
1
xa )( artanh
1ln
2
1ax
a
x
axa
xa
a
22
1
ax ax
ax
a
ln
2
1
Arc length
xx
ys d
d
d1
2
(cartesian coordinates)
tt
y
t
xs d
d
d
d
d22
(parametric form)
2
2 drd
ds r
(polar form)

20 Pearson Edexcel Level 3 Advanced Subsidiary and Advanced GCE in Mathematics and Further Mathematics
– Mathematical Formulae and Statistical Tables – Version 1.0 – Accredited pre-publication – March 2017
© Pearson Education Limited 2017
Surface area of revolution
Sx =
2d
2 1 dd
yy x
x
(cartesian coordinates)
Sx =
2 2d d
2 dd d
x yy t
t t
(parametric form)
Sx =
2
2 dr2 sin d
dr r
(polar form)

Pearson Edexcel Level 3 Advanced Subsidiary and Advanced GCE in Mathematics and Further Mathematics – 21Mathematical Formulae and Statistical Tables – Version 1.0 – Accredited pre-publication – March 2017
© Pearson Education Limited 2017
Statistics
Discrete distributions
For a discrete random variable X taking values ix with probabilities P(X = xi)
Expectation (mean): E(X) = = xi P(X = xi)
Variance: Var(X) = 2 = (xi – )2 P(X = xi) = 2
ix P(X = xi) – 2
For a function )g( X : E(g(X)) = g(xi) P(X = xi)
The probability generating function of X is G ( ) EX
Xt t and
2
E( ) G (1) and Var( ) G (1) G (1) G (1)X X X X
X X
For Z = X + Y, where X and Y are independent: G ( ) G ( ) G ( )Z X Y
t t t
Discrete distributions
Standard discrete distributions:
Distribution of X P(X = x) Mean Variance P.G.F.
Binomial B(n, p) 1n xx
np p
x
np np(1 – p) 1
np pt
Poisson Po ( ) e!
x
x
1e
t
Geometric Geo(p)
on 1, 2, …
11
xp p
1
p 2
1 p
p
1 (1 )
pt
p t
Negative binomial
on r, r + 1, …
1(1 )
1
r x rx
p pr
r
p 2
(1 )r p
p
1 (1 )
r
pt
p t
Continuous distributions
For a continuous random variable X having probability density function f
Expectation (mean): xxxX d)f()E(
Variance: 2222 d)f(d)f()()Var( xxxxxxX
For a function )g( X : xxxX d)f()g())E(g(
Cumulative distribution function:
0
0 0F( ) P( ) f ( ) d
x
x X x t t
22 Pearson Edexcel Level 3 Advanced Subsidiary and Advanced GCE in Mathematics and Further Mathematics
– Mathematical Formulae and Statistical Tables – Version 1.0 – Accredited pre-publication – March 2017
© Pearson Education Limited 2017
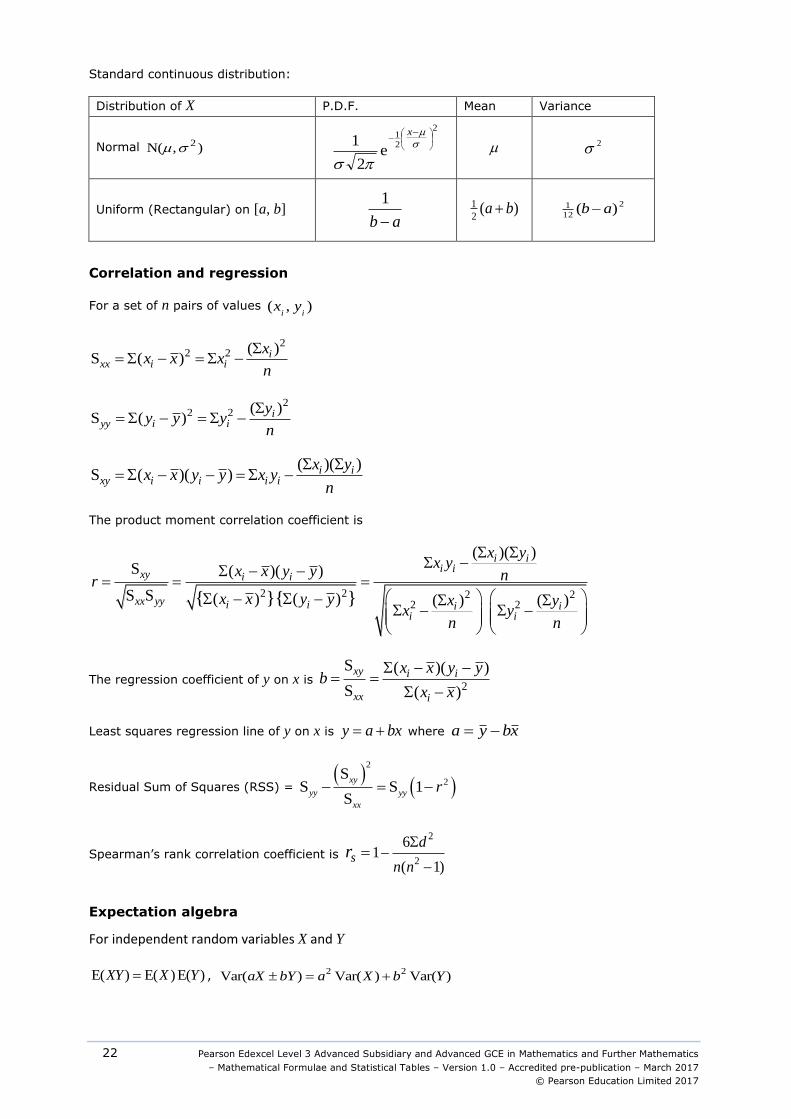
Standard continuous distribution:
Distribution of X P.D.F. Mean Variance
Normal ) ,N( 2
2
21
e2
1
x
2
Uniform (Rectangular) on [a, b] ab
1
1
2( )a b
2
12
1 )( ab
Correlation and regression
For a set of n pairs of values ) ,(ii
yx
22 2 ( )
S ( ) ixx i i
xx x x
n
22 2 ( )
S ( ) iyy i i
yy y y
n
( )( )S ( )( ) i i
xy i i i i
x yx x y y x y
n
The product moment correlation coefficient is
2 2 2 22 2
( )( )S ( )( )
S S ( ) ( ) ( ) ( )
{ }{ }
i ii i
xy i i
xx yy i i i ii i
x yx y
x x y y nrx x y y x y
x yn n
The regression coefficient of y on x is 2
S ( )( )
S ( )
xy i i
xx i
x x y yb
x x
Least squares regression line of y on x is bxay where xbya
Residual Sum of Squares (RSS) =
2
2S
S S 1S
xy
yy yy
xx
r
Spearman’s rank correlation coefficient is
2
2
61
( 1)s
d
n nr
Expectation algebra
For independent random variables X and Y
E( ) E( ) E( )XY X Y , 2 2Var( ) Var( ) Var( )aX bY a X b Y

Pearson Edexcel Level 3 Advanced Subsidiary and Advanced GCE in Mathematics and Further Mathematics – 23Mathematical Formulae and Statistical Tables – Version 1.0 – Accredited pre-publication – March 2017
© Pearson Education Limited 2017
Sampling distributions
(i) Tests for mean when is known
For a random sample n
XXX , , ,21 of n independent observations from a distribution having
mean and variance 2
:
X is an unbiased estimator of , with n
X2
)Var(
2S is an unbiased estimator of 2 , where
1
)( 2
2
n
XXS i
For a random sample of n observations from 2N( , ) , ~ N(0, 1)
/
X
n
For a random sample of xn observations from ) ,N( 2
xx and, independently, a random
sample of yn observations from ) ,N( 2
yy , )1 ,0N(~
)()(
22
y
y
x
x
yx
nn
YX
(ii) Tests for variance and mean when is not known
For a random sample of n observations from ) ,N( 2 :
2
12
2
~)1(
n
Sn
1~
/
n
tnS
X (also valid in matched-pairs situations)
For a random sample of xn observations from ) ,N( 2
xx and, independently, a random
sample of y
n observations from ) ,N( 2
yy
1 ,122
22
~/
/ ynxn
yy
xx FS
S
If 222
yx (unknown) then
2
2
( ) ( )~
1 1
x y
n nx y
p
x y
X Yt
Sn n
where
2 2
2( 1) ( 1)
2
x x y y
p
x y
n S n SS
n n
24 Pearson Edexcel Level 3 Advanced Subsidiary and Advanced GCE in Mathematics and Further Mathematics
– Mathematical Formulae and Statistical Tables – Version 1.0 – Accredited pre-publication – March 2017
© Pearson Education Limited 2017
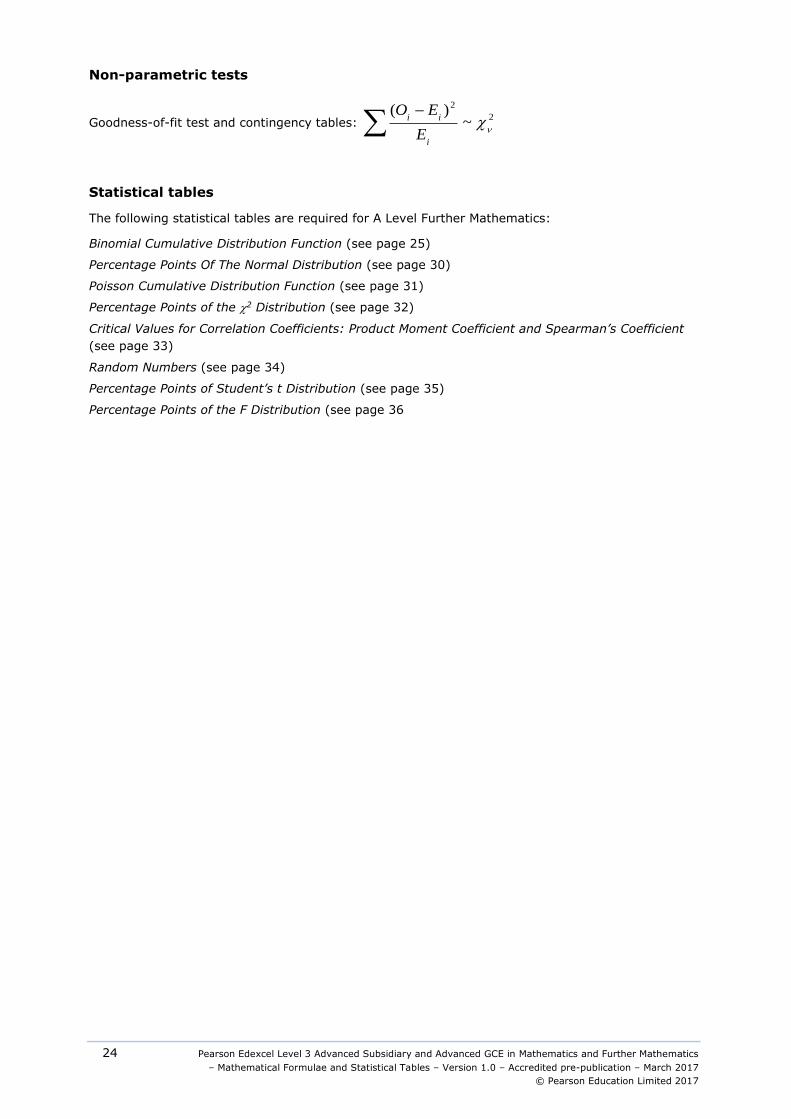
Non-parametric tests
Goodness-of-fit test and contingency tables: 2
2
~)(
i
ii
E
EO
Statistical tables
The following statistical tables are required for A Level Further Mathematics:
Binomial Cumulative Distribution Function (see page 25)
Percentage Points Of The Normal Distribution (see page 30)
Poisson Cumulative Distribution Function (see page 31)
Percentage Points of the 2 Distribution (see page 32)
Critical Values for Correlation Coefficients: Product Moment Coefficient and Spearman’s Coefficient
(see page 33)
Random Numbers (see page 34)
Percentage Points of Student’s t Distribution (see page 35)
Percentage Points of the F Distribution (see page 36

Pearson Edexcel Level 3 Advanced Subsidiary and Advanced GCE in Mathematics and Further Mathematics – 25
Mathematical Formulae and Statistical Tables – Version 1.0 – Accredited pre-publication – March 2017
© Pearson Education Limited 2017
Mechanics
Centres of mass
For uniform bodies:
Triangular lamina: 32
along median from vertex
Circular arc, radius r, angle at centre 2 :
sinr from centre
Sector of circle, radius r, angle at centre 2 : 2 sin
3
r
from centre
Solid hemisphere, radius r: r8
3 from centre
Hemispherical shell, radius r: r21
from centre
Solid cone or pyramid of height h: 14
h above the base on the line from centre of base to vertex
Conical shell of height h: 13
h above the base on the line from centre of base to vertex
Motion in a circle
Transverse velocity: rv
Transverse acceleration: rv
Radial acceleration: r
vr
22

26 Pearson Edexcel Level 3 Advanced Subsidiary and Advanced GCE in Mathematics and Further Mathematics
– Mathematical Formulae and Statistical Tables – Version 1.0 – Accredited pre-publication – March 2017
© Pearson Education Limited 2017
6 Statistical Tables
Binomial Cumulative Distribution Function
The tabulated value is P(X x), where X has a binomial distribution with index n and parameter p.
p = 0.05 0.10 0.15 0.20 0.25 0.30 0.35 0.40 0.45 0.50
n = 5, x = 0 0.7738 0.5905 0.4437 0.3277 0.2373 0.1681 0.1160 0.0778 0.0503 0.0312
1 0.9774 0.9185 0.8352 0.7373 0.6328 0.5282 0.4284 0.3370 0.2562 0.1875
2 0.9988 0.9914 0.9734 0.9421 0.8965 0.8369 0.7648 0.6826 0.5931 0.5000
3 1.0000 0.9995 0.9978 0.9933 0.9844 0.9692 0.9460 0.9130 0.8688 0.8125
4 1.0000 1.0000 0.9999 0.9997 0.9990 0.9976 0.9947 0.9898 0.9815 0.9688
n = 6, x = 0 0.7351 0.5314 0.3771 0.2621 0.1780 0.1176 0.0754 0.0467 0.0277 0.0156
1 0.9672 0.8857 0.7765 0.6554 0.5339 0.4202 0.3191 0.2333 0.1636 0.1094
2 0.9978 0.9842 0.9527 0.9011 0.8306 0.7443 0.6471 0.5443 0.4415 0.3438
3 0.9999 0.9987 0.9941 0.9830 0.9624 0.9295 0.8826 0.8208 0.7447 0.6563
4 1.0000 0.9999 0.9996 0.9984 0.9954 0.9891 0.9777 0.9590 0.9308 0.8906
5 1.0000 1.0000 1.0000 0.9999 0.9998 0.9993 0.9982 0.9959 0.9917 0.9844
n = 7, x = 0 0.6983 0.4783 0.3206 0.2097 0.1335 0.0824 0.0490 0.0280 0.0152 0.0078 1 0.9556 0.8503 0.7166 0.5767 0.4449 0.3294 0.2338 0.1586 0.1024 0.0625
2 0.9962 0.9743 0.9262 0.8520 0.7564 0.6471 0.5323 0.4199 0.3164 0.2266
3 0.9998 0.9973 0.9879 0.9667 0.9294 0.8740 0.8002 0.7102 0.6083 0.5000
4 1.0000 0.9998 0.9988 0.9953 0.9871 0.9712 0.9444 0.9037 0.8471 0.7734
5 1.0000 1.0000 0.9999 0.9996 0.9987 0.9962 0.9910 0.9812 0.9643 0.9375
6 1.0000 1.0000 1.0000 1.0000 0.9999 0.9998 0.9994 0.9984 0.9963 0.9922
n = 8, x = 0 0.6634 0.4305 0.2725 0.1678 0.1001 0.0576 0.0319 0.0168 0.0084 0.0039 1 0.9428 0.8131 0.6572 0.5033 0.3671 0.2553 0.1691 0.1064 0.0632 0.0352
2 0.9942 0.9619 0.8948 0.7969 0.6785 0.5518 0.4278 0.3154 0.2201 0.1445
3 0.9996 0.9950 0.9786 0.9437 0.8862 0.8059 0.7064 0.5941 0.4770 0.3633
4 1.0000 0.9996 0.9971 0.9896 0.9727 0.9420 0.8939 0.8263 0.7396 0.6367
5 1.0000 1.0000 0.9998 0.9988 0.9958 0.9887 0.9747 0.9502 0.9115 0.8555
6 1.0000 1.0000 1.0000 0.9999 0.9996 0.9987 0.9964 0.9915 0.9819 0.9648
7 1.0000 1.0000 1.0000 1.0000 1.0000 0.9999 0.9998 0.9993 0.9983 0.9961
n = 9, x = 0 0.6302 0.3874 0.2316 0.1342 0.0751 0.0404 0.0207 0.0101 0.0046 0.0020 1 0.9288 0.7748 0.5995 0.4362 0.3003 0.1960 0.1211 0.0705 0.0385 0.0195
2 0.9916 0.9470 0.8591 0.7382 0.6007 0.4628 0.3373 0.2318 0.1495 0.0898
3 0.9994 0.9917 0.9661 0.9144 0.8343 0.7297 0.6089 0.4826 0.3614 0.2539
4 1.0000 0.9991 0.9944 0.9804 0.9511 0.9012 0.8283 0.7334 0.6214 0.5000
5 1.0000 0.9999 0.9994 0.9969 0.9900 0.9747 0.9464 0.9006 0.8342 0.7461
6 1.0000 1.0000 1.0000 0.9997 0.9987 0.9957 0.9888 0.9750 0.9502 0.9102
7 1.0000 1.0000 1.0000 1.0000 0.9999 0.9996 0.9986 0.9962 0.9909 0.9805
8 1.0000 1.0000 1.0000 1.0000 1.0000 1.0000 0.9999 0.9997 0.9992 0.9980
n = 10, x = 0 0.5987 0.3487 0.1969 0.1074 0.0563 0.0282 0.0135 0.0060 0.0025 0.0010 1 0.9139 0.7361 0.5443 0.3758 0.2440 0.1493 0.0860 0.0464 0.0233 0.0107
2 0.9885 0.9298 0.8202 0.6778 0.5256 0.3828 0.2616 0.1673 0.0996 0.0547
3 0.9990 0.9872 0.9500 0.8791 0.7759 0.6496 0.5138 0.3823 0.2660 0.1719
4 0.9999 0.9984 0.9901 0.9672 0.9219 0.8497 0.7515 0.6331 0.5044 0.3770
5 1.0000 0.9999 0.9986 0.9936 0.9803 0.9527 0.9051 0.8338 0.7384 0.6230
6 1.0000 1.0000 0.9999 0.9991 0.9965 0.9894 0.9740 0.9452 0.8980 0.8281
7 1.0000 1.0000 1.0000 0.9999 0.9996 0.9984 0.9952 0.9877 0.9726 0.9453
8 1.0000 1.0000 1.0000 1.0000 1.0000 0.9999 0.9995 0.9983 0.9955 0.9893
9 1.0000 1.0000 1.0000 1.0000 1.0000 1.0000 1.0000 0.9999 0.9997 0.9990

Pearson Edexcel Level 3 Advanced Subsidiary and Advanced GCE in Mathematics and Further Mathematics – 27
Mathematical Formulae and Statistical Tables – Version 1.0 – Accredited pre-publication – March 2017
© Pearson Education Limited 2017
p = 0.05 0.10 0.15 0.20 0.25 0.30 0.35 0.40 0.45 0.50
n = 12, x = 0 0.5404 0.2824 0.1422 0.0687 0.0317 0.0138 0.0057 0.0022 0.0008 0.0002 1 0.8816 0.6590 0.4435 0.2749 0.1584 0.0850 0.0424 0.0196 0.0083 0.0032
2 0.9804 0.8891 0.7358 0.5583 0.3907 0.2528 0.1513 0.0834 0.0421 0.0193
3 0.9978 0.9744 0.9078 0.7946 0.6488 0.4925 0.3467 0.2253 0.1345 0.0730
4 0.9998 0.9957 0.9761 0.9274 0.8424 0.7237 0.5833 0.4382 0.3044 0.1938
5 1.0000 0.9995 0.9954 0.9806 0.9456 0.8822 0.7873 0.6652 0.5269 0.3872
6 1.0000 0.9999 0.9993 0.9961 0.9857 0.9614 0.9154 0.8418 0.7393 0.6128
7 1.0000 1.0000 0.9999 0.9994 0.9972 0.9905 0.9745 0.9427 0.8883 0.8062
8 1.0000 1.0000 1.0000 0.9999 0.9996 0.9983 0.9944 0.9847 0.9644 0.9270
9 1.0000 1.0000 1.0000 1.0000 1.0000 0.9998 0.9992 0.9972 0.9921 0.9807
10 1.0000 1.0000 1.0000 1.0000 1.0000 1.0000 0.9999 0.9997 0.9989 0.9968
11 1.0000 1.0000 1.0000 1.0000 1.0000 1.0000 1.0000 1.0000 0.9999 0.9998
n = 15, x = 0 0.4633 0.2059 0.0874 0.0352 0.0134 0.0047 0.0016 0.0005 0.0001 0.0000 1 0.8290 0.5490 0.3186 0.1671 0.0802 0.0353 0.0142 0.0052 0.0017 0.0005
2 0.9638 0.8159 0.6042 0.3980 0.2361 0.1268 0.0617 0.0271 0.0107 0.0037
3 0.9945 0.9444 0.8227 0.6482 0.4613 0.2969 0.1727 0.0905 0.0424 0.0176
4 0.9994 0.9873 0.9383 0.8358 0.6865 0.5155 0.3519 0.2173 0.1204 0.0592
5 0.9999 0.9978 0.9832 0.9389 0.8516 0.7216 0.5643 0.4032 0.2608 0.1509
6 1.0000 0.9997 0.9964 0.9819 0.9434 0.8689 0.7548 0.6098 0.4522 0.3036
7 1.0000 1.0000 0.9994 0.9958 0.9827 0.9500 0.8868 0.7869 0.6535 0.5000
8 1.0000 1.0000 0.9999 0.9992 0.9958 0.9848 0.9578 0.9050 0.8182 0.6964
9 1.0000 1.0000 1.0000 0.9999 0.9992 0.9963 0.9876 0.9662 0.9231 0.8491
10 1.0000 1.0000 1.0000 1.0000 0.9999 0.9993 0.9972 0.9907 0.9745 0.9408
11 1.0000 1.0000 1.0000 1.0000 1.0000 0.9999 0.9995 0.9981 0.9937 0.9824
12 1.0000 1.0000 1.0000 1.0000 1.0000 1.0000 0.9999 0.9997 0.9989 0.9963
13 1.0000 1.0000 1.0000 1.0000 1.0000 1.0000 1.0000 1.0000 0.9999 0.9995
14 1.0000 1.0000 1.0000 1.0000 1.0000 1.0000 1.0000 1.0000 1.0000 1.0000
n = 20, x = 0 0.3585 0.1216 0.0388 0.0115 0.0032 0.0008 0.0002 0.0000 0.0000 0.0000 1 0.7358 0.3917 0.1756 0.0692 0.0243 0.0076 0.0021 0.0005 0.0001 0.0000
2 0.9245 0.6769 0.4049 0.2061 0.0913 0.0355 0.0121 0.0036 0.0009 0.0002
3 0.9841 0.8670 0.6477 0.4114 0.2252 0.1071 0.0444 0.0160 0.0049 0.0013
4 0.9974 0.9568 0.8298 0.6296 0.4148 0.2375 0.1182 0.0510 0.0189 0.0059
5 0.9997 0.9887 0.9327 0.8042 0.6172 0.4164 0.2454 0.1256 0.0553 0.0207
6 1.0000 0.9976 0.9781 0.9133 0.7858 0.6080 0.4166 0.2500 0.1299 0.0577
7 1.0000 0.9996 0.9941 0.9679 0.8982 0.7723 0.6010 0.4159 0.2520 0.1316
8 1.0000 0.9999 0.9987 0.9900 0.9591 0.8867 0.7624 0.5956 0.4143 0.2517
9 1.0000 1.0000 0.9998 0.9974 0.9861 0.9520 0.8782 0.7553 0.5914 0.4119
10 1.0000 1.0000 1.0000 0.9994 0.9961 0.9829 0.9468 0.8725 0.7507 0.5881
11 1.0000 1.0000 1.0000 0.9999 0.9991 0.9949 0.9804 0.9435 0.8692 0.7483
12 1.0000 1.0000 1.0000 1.0000 0.9998 0.9987 0.9940 0.9790 0.9420 0.8684
13 1.0000 1.0000 1.0000 1.0000 1.0000 0.9997 0.9985 0.9935 0.9786 0.9423
14 1.0000 1.0000 1.0000 1.0000 1.0000 1.0000 0.9997 0.9984 0.9936 0.9793
15 1.0000 1.0000 1.0000 1.0000 1.0000 1.0000 1.0000 0.9997 0.9985 0.9941
16 1.0000 1.0000 1.0000 1.0000 1.0000 1.0000 1.0000 1.0000 0.9997 0.9987
17 1.0000 1.0000 1.0000 1.0000 1.0000 1.0000 1.0000 1.0000 1.0000 0.9998
18 1.0000 1.0000 1.0000 1.0000 1.0000 1.0000 1.0000 1.0000 1.0000 1.0000

28 Pearson Edexcel Level 3 Advanced Subsidiary and Advanced GCE in Mathematics and Further Mathematics
– Mathematical Formulae and Statistical Tables – Version 1.0 – Accredited pre-publication – March 2017
© Pearson Education Limited 2017
p = 0.05 0.10 0.15 0.20 0.25 0.30 0.35 0.40 0.45 0.50
n = 25, x = 0 0.2774 0.0718 0.0172 0.0038 0.0008 0.0001 0.0000 0.0000 0.0000 0.0000 1 0.6424 0.2712 0.0931 0.0274 0.0070 0.0016 0.0003 0.0001 0.0000 0.0000
2 0.8729 0.5371 0.2537 0.0982 0.0321 0.0090 0.0021 0.0004 0.0001 0.0000
3 0.9659 0.7636 0.4711 0.2340 0.0962 0.0332 0.0097 0.0024 0.0005 0.0001
4 0.9928 0.9020 0.6821 0.4207 0.2137 0.0905 0.0320 0.0095 0.0023 0.0005
5 0.9988 0.9666 0.8385 0.6167 0.3783 0.1935 0.0826 0.0294 0.0086 0.0020
6 0.9998 0.9905 0.9305 0.7800 0.5611 0.3407 0.1734 0.0736 0.0258 0.0073
7 1.0000 0.9977 0.9745 0.8909 0.7265 0.5118 0.3061 0.1536 0.0639 0.0216
8 1.0000 0.9995 0.9920 0.9532 0.8506 0.6769 0.4668 0.2735 0.1340 0.0539
9 1.0000 0.9999 0.9979 0.9827 0.9287 0.8106 0.6303 0.4246 0.2424 0.1148
10 1.0000 1.0000 0.9995 0.9944 0.9703 0.9022 0.7712 0.5858 0.3843 0.2122
11 1.0000 1.0000 0.9999 0.9985 0.9893 0.9558 0.8746 0.7323 0.5426 0.3450
12 1.0000 1.0000 1.0000 0.9996 0.9966 0.9825 0.9396 0.8462 0.6937 0.5000
13 1.0000 1.0000 1.0000 0.9999 0.9991 0.9940 0.9745 0.9222 0.8173 0.6550
14 1.0000 1.0000 1.0000 1.0000 0.9998 0.9982 0.9907 0.9656 0.9040 0.7878
15 1.0000 1.0000 1.0000 1.0000 1.0000 0.9995 0.9971 0.9868 0.9560 0.8852
16 1.0000 1.0000 1.0000 1.0000 1.0000 0.9999 0.9992 0.9957 0.9826 0.9461
17 1.0000 1.0000 1.0000 1.0000 1.0000 1.0000 0.9998 0.9988 0.9942 0.9784
18 1.0000 1.0000 1.0000 1.0000 1.0000 1.0000 1.0000 0.9997 0.9984 0.9927
19 1.0000 1.0000 1.0000 1.0000 1.0000 1.0000 1.0000 0.9999 0.9996 0.9980
20 1.0000 1.0000 1.0000 1.0000 1.0000 1.0000 1.0000 1.0000 0.9999 0.9995
21 1.0000 1.0000 1.0000 1.0000 1.0000 1.0000 1.0000 1.0000 1.0000 0.9999
22 1.0000 1.0000 1.0000 1.0000 1.0000 1.0000 1.0000 1.0000 1.0000 1.0000
n = 30, x = 0 0.2146 0.0424 0.0076 0.0012 0.0002 0.0000 0.0000 0.0000 0.0000 0.0000 1 0.5535 0.1837 0.0480 0.0105 0.0020 0.0003 0.0000 0.0000 0.0000 0.0000
2 0.8122 0.4114 0.1514 0.0442 0.0106 0.0021 0.0003 0.0000 0.0000 0.0000
3 0.9392 0.6474 0.3217 0.1227 0.0374 0.0093 0.0019 0.0003 0.0000 0.0000
4 0.9844 0.8245 0.5245 0.2552 0.0979 0.0302 0.0075 0.0015 0.0002 0.0000
5 0.9967 0.9268 0.7106 0.4275 0.2026 0.0766 0.0233 0.0057 0.0011 0.0002
6 0.9994 0.9742 0.8474 0.6070 0.3481 0.1595 0.0586 0.0172 0.0040 0.0007
7 0.9999 0.9922 0.9302 0.7608 0.5143 0.2814 0.1238 0.0435 0.0121 0.0026
8 1.0000 0.9980 0.9722 0.8713 0.6736 0.4315 0.2247 0.0940 0.0312 0.0081
9 1.0000 0.9995 0.9903 0.9389 0.8034 0.5888 0.3575 0.1763 0.0694 0.0214
10 1.0000 0.9999 0.9971 0.9744 0.8943 0.7304 0.5078 0.2915 0.1350 0.0494
11 1.0000 1.0000 0.9992 0.9905 0.9493 0.8407 0.6548 0.4311 0.2327 0.1002
12 1.0000 1.0000 0.9998 0.9969 0.9784 0.9155 0.7802 0.5785 0.3592 0.1808
13 1.0000 1.0000 1.0000 0.9991 0.9918 0.9599 0.8737 0.7145 0.5025 0.2923
14 1.0000 1.0000 1.0000 0.9998 0.9973 0.9831 0.9348 0.8246 0.6448 0.4278
15 1.0000 1.0000 1.0000 0.9999 0.9992 0.9936 0.9699 0.9029 0.7691 0.5722
16 1.0000 1.0000 1.0000 1.0000 0.9998 0.9979 0.9876 0.9519 0.8644 0.7077
17 1.0000 1.0000 1.0000 1.0000 0.9999 0.9994 0.9955 0.9788 0.9286 0.8192
18 1.0000 1.0000 1.0000 1.0000 1.0000 0.9998 0.9986 0.9917 0.9666 0.8998
19 1.0000 1.0000 1.0000 1.0000 1.0000 1.0000 0.9996 0.9971 0.9862 0.9506
20 1.0000 1.0000 1.0000 1.0000 1.0000 1.0000 0.9999 0.9991 0.9950 0.9786
21 1.0000 1.0000 1.0000 1.0000 1.0000 1.0000 1.0000 0.9998 0.9984 0.9919
22 1.0000 1.0000 1.0000 1.0000 1.0000 1.0000 1.0000 1.0000 0.9996 0.9974
23 1.0000 1.0000 1.0000 1.0000 1.0000 1.0000 1.0000 1.0000 0.9999 0.9993
24 1.0000 1.0000 1.0000 1.0000 1.0000 1.0000 1.0000 1.0000 1.0000 0.9998
25 1.0000 1.0000 1.0000 1.0000 1.0000 1.0000 1.0000 1.0000 1.0000 1.0000

Pearson Edexcel Level 3 Advanced Subsidiary and Advanced GCE in Mathematics and Further Mathematics – 29Mathematical Formulae and Statistical Tables – Version 1.0 – Accredited pre-publication – March 2017
© Pearson Education Limited 2017
p = 0.05 0.10 0.15 0.20 0.25 0.30 0.35 0.40 0.45 0.50
n = 40, x = 0 0.1285 0.0148 0.0015 0.0001 0.0000 0.0000 0.0000 0.0000 0.0000 0.0000
1 0.3991 0.0805 0.0121 0.0015 0.0001 0.0000 0.0000 0.0000 0.0000 0.0000
2 0.6767 0.2228 0.0486 0.0079 0.0010 0.0001 0.0000 0.0000 0.0000 0.0000
3 0.8619 0.4231 0.1302 0.0285 0.0047 0.0006 0.0001 0.0000 0.0000 0.0000
4 0.9520 0.6290 0.2633 0.0759 0.0160 0.0026 0.0003 0.0000 0.0000 0.0000
5 0.9861 0.7937 0.4325 0.1613 0.0433 0.0086 0.0013 0.0001 0.0000 0.0000
6 0.9966 0.9005 0.6067 0.2859 0.0962 0.0238 0.0044 0.0006 0.0001 0.0000
7 0.9993 0.9581 0.7559 0.4371 0.1820 0.0553 0.0124 0.0021 0.0002 0.0000
8 0.9999 0.9845 0.8646 0.5931 0.2998 0.1110 0.0303 0.0061 0.0009 0.0001
9 1.0000 0.9949 0.9328 0.7318 0.4395 0.1959 0.0644 0.0156 0.0027 0.0003
10 1.0000 0.9985 0.9701 0.8392 0.5839 0.3087 0.1215 0.0352 0.0074 0.0011
11 1.0000 0.9996 0.9880 0.9125 0.7151 0.4406 0.2053 0.0709 0.0179 0.0032
12 1.0000 0.9999 0.9957 0.9568 0.8209 0.5772 0.3143 0.1285 0.0386 0.0083
13 1.0000 1.0000 0.9986 0.9806 0.8968 0.7032 0.4408 0.2112 0.0751 0.0192
14 1.0000 1.0000 0.9996 0.9921 0.9456 0.8074 0.5721 0.3174 0.1326 0.0403
15 1.0000 1.0000 0.9999 0.9971 0.9738 0.8849 0.6946 0.4402 0.2142 0.0769
16 1.0000 1.0000 1.0000 0.9990 0.9884 0.9367 0.7978 0.5681 0.3185 0.1341
17 1.0000 1.0000 1.0000 0.9997 0.9953 0.9680 0.8761 0.6885 0.4391 0.2148
18 1.0000 1.0000 1.0000 0.9999 0.9983 0.9852 0.9301 0.7911 0.5651 0.3179
19 1.0000 1.0000 1.0000 1.0000 0.9994 0.9937 0.9637 0.8702 0.6844 0.4373
20 1.0000 1.0000 1.0000 1.0000 0.9998 0.9976 0.9827 0.9256 0.7870 0.5627
21 1.0000 1.0000 1.0000 1.0000 1.0000 0.9991 0.9925 0.9608 0.8669 0.6821
22 1.0000 1.0000 1.0000 1.0000 1.0000 0.9997 0.9970 0.9811 0.9233 0.7852
23 1.0000 1.0000 1.0000 1.0000 1.0000 0.9999 0.9989 0.9917 0.9595 0.8659
24 1.0000 1.0000 1.0000 1.0000 1.0000 1.0000 0.9996 0.9966 0.9804 0.9231
25 1.0000 1.0000 1.0000 1.0000 1.0000 1.0000 0.9999 0.9988 0.9914 0.9597
26 1.0000 1.0000 1.0000 1.0000 1.0000 1.0000 1.0000 0.9996 0.9966 0.9808
27 1.0000 1.0000 1.0000 1.0000 1.0000 1.0000 1.0000 0.9999 0.9988 0.9917
28 1.0000 1.0000 1.0000 1.0000 1.0000 1.0000 1.0000 1.0000 0.9996 0.9968
29 1.0000 1.0000 1.0000 1.0000 1.0000 1.0000 1.0000 1.0000 0.9999 0.9989
30 1.0000 1.0000 1.0000 1.0000 1.0000 1.0000 1.0000 1.0000 1.0000 0.9997
31 1.0000 1.0000 1.0000 1.0000 1.0000 1.0000 1.0000 1.0000 1.0000 0.9999
32 1.0000 1.0000 1.0000 1.0000 1.0000 1.0000 1.0000 1.0000 1.0000 1.0000

30 Pearson Edexcel Level 3 Advanced Subsidiary and Advanced GCE in Mathematics and Further Mathematics
– Mathematical Formulae and Statistical Tables – Version 1.0 – Accredited pre-publication – March 2017
© Pearson Education Limited 2017
p = 0.05 0.10 0.15 0.20 0.25 0.30 0.35 0.40 0.45 0.50
n = 50, x = 0 0.0769 0.0052 0.0003 0.0000 0.0000 0.0000 0.0000 0.0000 0.0000 0.0000
1 0.2794 0.0338 0.0029 0.0002 0.0000 0.0000 0.0000 0.0000 0.0000 0.0000
2 0.5405 0.1117 0.0142 0.0013 0.0001 0.0000 0.0000 0.0000 0.0000 0.0000
3 0.7604 0.2503 0.0460 0.0057 0.0005 0.0000 0.0000 0.0000 0.0000 0.0000
4 0.8964 0.4312 0.1121 0.0185 0.0021 0.0002 0.0000 0.0000 0.0000 0.0000
5 0.9622 0.6161 0.2194 0.0480 0.0070 0.0007 0.0001 0.0000 0.0000 0.0000
6 0.9882 0.7702 0.3613 0.1034 0.0194 0.0025 0.0002 0.0000 0.0000 0.0000
7 0.9968 0.8779 0.5188 0.1904 0.0453 0.0073 0.0008 0.0001 0.0000 0.0000
8 0.9992 0.9421 0.6681 0.3073 0.0916 0.0183 0.0025 0.0002 0.0000 0.0000
9 0.9998 0.9755 0.7911 0.4437 0.1637 0.0402 0.0067 0.0008 0.0001 0.0000
10 1.0000 0.9906 0.8801 0.5836 0.2622 0.0789 0.0160 0.0022 0.0002 0.0000
11 1.0000 0.9968 0.9372 0.7107 0.3816 0.1390 0.0342 0.0057 0.0006 0.0000
12 1.0000 0.9990 0.9699 0.8139 0.5110 0.2229 0.0661 0.0133 0.0018 0.0002
13 1.0000 0.9997 0.9868 0.8894 0.6370 0.3279 0.1163 0.0280 0.0045 0.0005
14 1.0000 0.9999 0.9947 0.9393 0.7481 0.4468 0.1878 0.0540 0.0104 0.0013
15 1.0000 1.0000 0.9981 0.9692 0.8369 0.5692 0.2801 0.0955 0.0220 0.0033
16 1.0000 1.0000 0.9993 0.9856 0.9017 0.6839 0.3889 0.1561 0.0427 0.0077
17 1.0000 1.0000 0.9998 0.9937 0.9449 0.7822 0.5060 0.2369 0.0765 0.0164
18 1.0000 1.0000 0.9999 0.9975 0.9713 0.8594 0.6216 0.3356 0.1273 0.0325
19 1.0000 1.0000 1.0000 0.9991 0.9861 0.9152 0.7264 0.4465 0.1974 0.0595
20 1.0000 1.0000 1.0000 0.9997 0.9937 0.9522 0.8139 0.5610 0.2862 0.1013
21 1.0000 1.0000 1.0000 0.9999 0.9974 0.9749 0.8813 0.6701 0.3900 0.1611
22 1.0000 1.0000 1.0000 1.0000 0.9990 0.9877 0.9290 0.7660 0.5019 0.2399
23 1.0000 1.0000 1.0000 1.0000 0.9996 0.9944 0.9604 0.8438 0.6134 0.3359
24 1.0000 1.0000 1.0000 1.0000 0.9999 0.9976 0.9793 0.9022 0.7160 0.4439
25 1.0000 1.0000 1.0000 1.0000 1.0000 0.9991 0.9900 0.9427 0.8034 0.5561
26 1.0000 1.0000 1.0000 1.0000 1.0000 0.9997 0.9955 0.9686 0.8721 0.6641
27 1.0000 1.0000 1.0000 1.0000 1.0000 0.9999 0.9981 0.9840 0.9220 0.7601
28 1.0000 1.0000 1.0000 1.0000 1.0000 1.0000 0.9993 0.9924 0.9556 0.8389
29 1.0000 1.0000 1.0000 1.0000 1.0000 1.0000 0.9997 0.9966 0.9765 0.8987
30 1.0000 1.0000 1.0000 1.0000 1.0000 1.0000 0.9999 0.9986 0.9884 0.9405
31 1.0000 1.0000 1.0000 1.0000 1.0000 1.0000 1.0000 0.9995 0.9947 0.9675
32 1.0000 1.0000 1.0000 1.0000 1.0000 1.0000 1.0000 0.9998 0.9978 0.9836
33 1.0000 1.0000 1.0000 1.0000 1.0000 1.0000 1.0000 0.9999 0.9991 0.9923
34 1.0000 1.0000 1.0000 1.0000 1.0000 1.0000 1.0000 1.0000 0.9997 0.9967
35 1.0000 1.0000 1.0000 1.0000 1.0000 1.0000 1.0000 1.0000 0.9999 0.9987
36 1.0000 1.0000 1.0000 1.0000 1.0000 1.0000 1.0000 1.0000 1.0000 0.9995
37 1.0000 1.0000 1.0000 1.0000 1.0000 1.0000 1.0000 1.0000 1.0000 0.9998
38 1.0000 1.0000 1.0000 1.0000 1.0000 1.0000 1.0000 1.0000 1.0000 1.0000
Pearson Edexcel Level 3 Advanced Subsidiary and Advanced GCE in Mathematics and Further Mathematics – 31Mathematical Formulae and Statistical Tables – Version 1.0 – Accredited pre-publication – March 2017
© Pearson Education Limited 2017
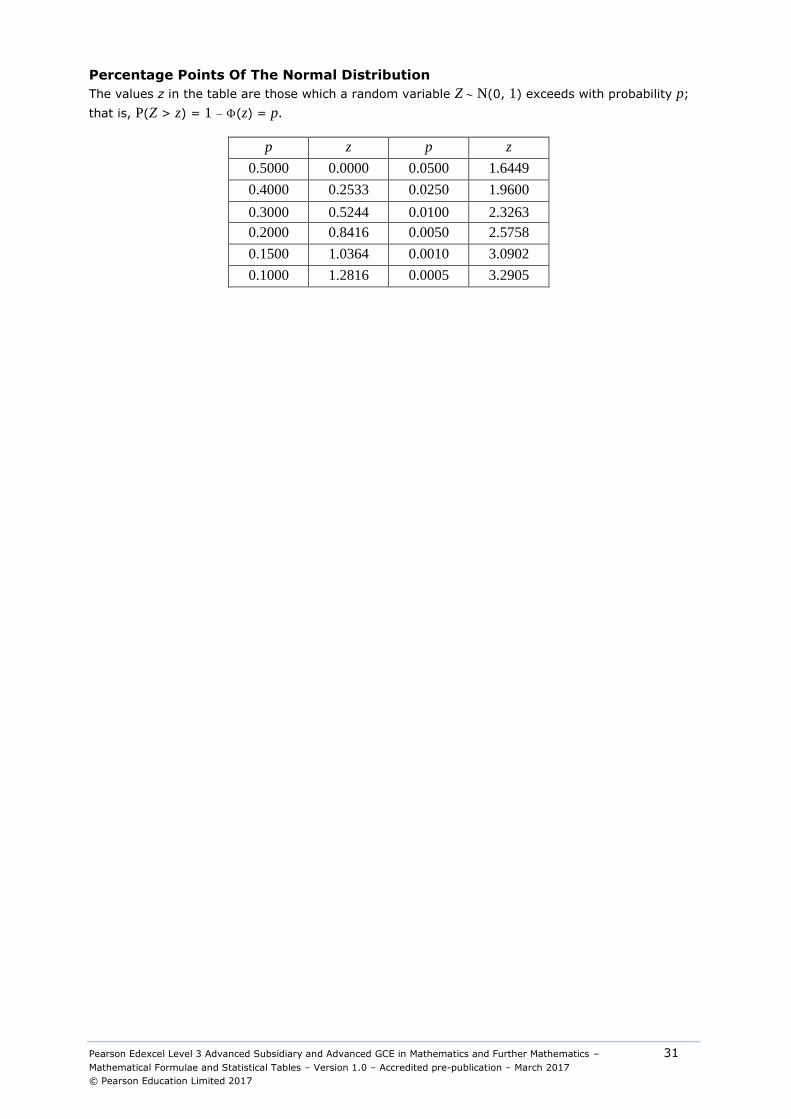
Percentage Points Of The Normal Distribution
The values z in the table are those which a random variable Z N(0, 1) exceeds with probability p;
that is, P(Z > z) = 1 (z) = p.
p z p z
0.5000 0.0000 0.0500 1.6449
0.4000 0.2533 0.0250 1.9600
0.3000 0.5244 0.0100 2.3263
0.2000 0.8416 0.0050 2.5758
0.1500 1.0364 0.0010 3.0902
0.1000 1.2816 0.0005 3.2905
32 Pearson Edexcel Level 3 Advanced Subsidiary and Advanced GCE in Mathematics and Further Mathematics
– Mathematical Formulae and Statistical Tables – Version 1.0 – Accredited pre-publication – March 2017
© Pearson Education Limited 2017
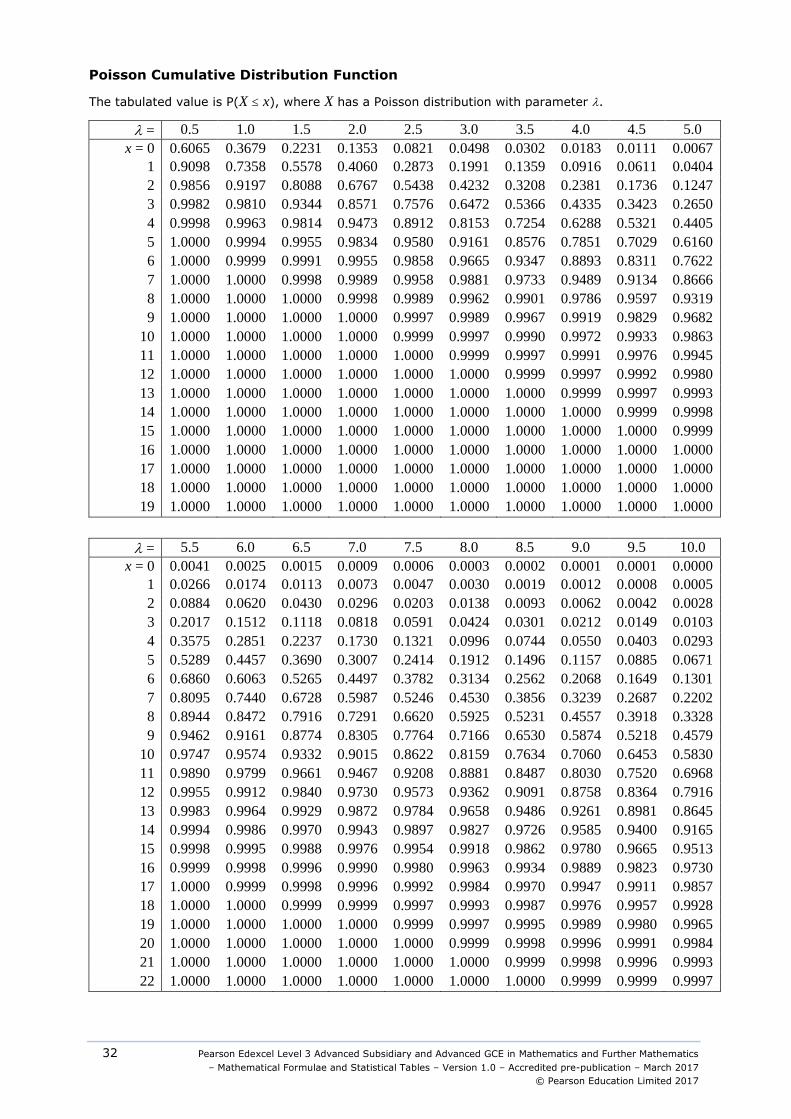
Poisson Cumulative Distribution Function
The tabulated value is P(X x), where X has a Poisson distribution with parameter .
= 0.5 1.0 1.5 2.0 2.5 3.0 3.5 4.0 4.5 5.0
x = 0 0.6065 0.3679 0.2231 0.1353 0.0821 0.0498 0.0302 0.0183 0.0111 0.0067
1 0.9098 0.7358 0.5578 0.4060 0.2873 0.1991 0.1359 0.0916 0.0611 0.0404
2 0.9856 0.9197 0.8088 0.6767 0.5438 0.4232 0.3208 0.2381 0.1736 0.1247
3 0.9982 0.9810 0.9344 0.8571 0.7576 0.6472 0.5366 0.4335 0.3423 0.2650
4 0.9998 0.9963 0.9814 0.9473 0.8912 0.8153 0.7254 0.6288 0.5321 0.4405
5 1.0000 0.9994 0.9955 0.9834 0.9580 0.9161 0.8576 0.7851 0.7029 0.6160
6 1.0000 0.9999 0.9991 0.9955 0.9858 0.9665 0.9347 0.8893 0.8311 0.7622
7 1.0000 1.0000 0.9998 0.9989 0.9958 0.9881 0.9733 0.9489 0.9134 0.8666
8 1.0000 1.0000 1.0000 0.9998 0.9989 0.9962 0.9901 0.9786 0.9597 0.9319
9 1.0000 1.0000 1.0000 1.0000 0.9997 0.9989 0.9967 0.9919 0.9829 0.9682
10 1.0000 1.0000 1.0000 1.0000 0.9999 0.9997 0.9990 0.9972 0.9933 0.9863
11 1.0000 1.0000 1.0000 1.0000 1.0000 0.9999 0.9997 0.9991 0.9976 0.9945
12 1.0000 1.0000 1.0000 1.0000 1.0000 1.0000 0.9999 0.9997 0.9992 0.9980
13 1.0000 1.0000 1.0000 1.0000 1.0000 1.0000 1.0000 0.9999 0.9997 0.9993
14 1.0000 1.0000 1.0000 1.0000 1.0000 1.0000 1.0000 1.0000 0.9999 0.9998
15 1.0000 1.0000 1.0000 1.0000 1.0000 1.0000 1.0000 1.0000 1.0000 0.9999
16 1.0000 1.0000 1.0000 1.0000 1.0000 1.0000 1.0000 1.0000 1.0000 1.0000
17 1.0000 1.0000 1.0000 1.0000 1.0000 1.0000 1.0000 1.0000 1.0000 1.0000
18 1.0000 1.0000 1.0000 1.0000 1.0000 1.0000 1.0000 1.0000 1.0000 1.0000
19 1.0000 1.0000 1.0000 1.0000 1.0000 1.0000 1.0000 1.0000 1.0000 1.0000
= 5.5 6.0 6.5 7.0 7.5 8.0 8.5 9.0 9.5 10.0
x = 0 0.0041 0.0025 0.0015 0.0009 0.0006 0.0003 0.0002 0.0001 0.0001 0.0000
1 0.0266 0.0174 0.0113 0.0073 0.0047 0.0030 0.0019 0.0012 0.0008 0.0005
2 0.0884 0.0620 0.0430 0.0296 0.0203 0.0138 0.0093 0.0062 0.0042 0.0028
3 0.2017 0.1512 0.1118 0.0818 0.0591 0.0424 0.0301 0.0212 0.0149 0.0103
4 0.3575 0.2851 0.2237 0.1730 0.1321 0.0996 0.0744 0.0550 0.0403 0.0293
5 0.5289 0.4457 0.3690 0.3007 0.2414 0.1912 0.1496 0.1157 0.0885 0.0671
6 0.6860 0.6063 0.5265 0.4497 0.3782 0.3134 0.2562 0.2068 0.1649 0.1301
7 0.8095 0.7440 0.6728 0.5987 0.5246 0.4530 0.3856 0.3239 0.2687 0.2202
8 0.8944 0.8472 0.7916 0.7291 0.6620 0.5925 0.5231 0.4557 0.3918 0.3328
9 0.9462 0.9161 0.8774 0.8305 0.7764 0.7166 0.6530 0.5874 0.5218 0.4579
10 0.9747 0.9574 0.9332 0.9015 0.8622 0.8159 0.7634 0.7060 0.6453 0.5830
11 0.9890 0.9799 0.9661 0.9467 0.9208 0.8881 0.8487 0.8030 0.7520 0.6968
12 0.9955 0.9912 0.9840 0.9730 0.9573 0.9362 0.9091 0.8758 0.8364 0.7916
13 0.9983 0.9964 0.9929 0.9872 0.9784 0.9658 0.9486 0.9261 0.8981 0.8645
14 0.9994 0.9986 0.9970 0.9943 0.9897 0.9827 0.9726 0.9585 0.9400 0.9165
15 0.9998 0.9995 0.9988 0.9976 0.9954 0.9918 0.9862 0.9780 0.9665 0.9513
16 0.9999 0.9998 0.9996 0.9990 0.9980 0.9963 0.9934 0.9889 0.9823 0.9730
17 1.0000 0.9999 0.9998 0.9996 0.9992 0.9984 0.9970 0.9947 0.9911 0.9857
18 1.0000 1.0000 0.9999 0.9999 0.9997 0.9993 0.9987 0.9976 0.9957 0.9928
19 1.0000 1.0000 1.0000 1.0000 0.9999 0.9997 0.9995 0.9989 0.9980 0.9965
20 1.0000 1.0000 1.0000 1.0000 1.0000 0.9999 0.9998 0.9996 0.9991 0.9984
21 1.0000 1.0000 1.0000 1.0000 1.0000 1.0000 0.9999 0.9998 0.9996 0.9993
22 1.0000 1.0000 1.0000 1.0000 1.0000 1.0000 1.0000 0.9999 0.9999 0.9997

Pearson Edexcel Level 3 Advanced Subsidiary and Advanced GCE in Mathematics and Further Mathematics – 33
Mathematical Formulae and Statistical Tables – Version 1.0 – Accredited pre-publication – March 2017
© Pearson Education Limited 2017
Percentage Points of the 2 Distribution
The values in the table are those which a random variable with the 2 distribution on degrees of
freedom exceeds with the probability shown.
0.995 0.990 0.975 0.950 0.900 0.100 0.050 0.025 0.010 0.005
1 0.000 0.000 0.001 0.004 0.016 2.705 3.841 5.024 6.635 7.879
2 0.010 0.020 0.051 0.103 0.211 4.605 5.991 7.378 9.210 10.597
3 0.072 0.115 0.216 0.352 0.584 6.251 7.815 9.348 11.345 12.838
4 0.207 0.297 0.484 0.711 1.064 7.779 9.488 11.143 13.277 14.860
5 0.412 0.554 0.831 1.145 1.610 9.236 11.070 12.832 15.086 16.750
6 0.676 0.872 1.237 1.635 2.204 10.645 12.592 14.449 16.812 18.548
7 0.989 1.239 1.690 2.167 2.833 12.017 14.067 16.013 18.475 20.278
8 1.344 1.646 2.180 2.733 3.490 13.362 15.507 17.535 20.090 21.955
9 1.735 2.088 2.700 3.325 4.168 14.684 16.919 19.023 21.666 23.589
10 2.156 2.558 3.247 3.940 4.865 15.987 18.307 20.483 23.209 25.188
11 2.603 3.053 3.816 4.575 5.580 17.275 19.675 21.920 24.725 26.757
12 3.074 3.571 4.404 5.226 6.304 18.549 21.026 23.337 26.217 28.300
13 3.565 4.107 5.009 5.892 7.042 19.812 22.362 24.736 27.688 29.819
14 4.075 4.660 5.629 6.571 7.790 21.064 23.685 26.119 29.141 31.319
15 4.601 5.229 6.262 7.261 8.547 22.307 24.996 27.488 30.578 32.801
16 5.142 5.812 6.908 7.962 9.312 23.542 26.296 28.845 32.000 34.267
17 5.697 6.408 7.564 8.672 10.085 24.769 27.587 30.191 33.409 35.718
18 6.265 7.015 8.231 9.390 10.865 25.989 28.869 31.526 34.805 37.156
19 6.844 7.633 8.907 10.117 11.651 27.204 30.144 32.852 36.191 38.582
20 7.434 8.260 9.591 10.851 12.443 28.412 31.410 34.170 37.566 39.997
21 8.034 8.897 10.283 11.591 13.240 29.615 32.671 35.479 38.932 41.401
22 8.643 9.542 10.982 12.338 14.042 30.813 33.924 36.781 40.289 42.796
23 9.260 10.196 11.689 13.091 14.848 32.007 35.172 38.076 41.638 44.181
24 9.886 10.856 12.401 13.848 15.659 33.196 36.415 39.364 42.980 45.558
25 10.520 11.524 13.120 14.611 16.473 34.382 37.652 40.646 44.314 46.928
26 11.160 12.198 13.844 15.379 17.292 35.563 38.885 41.923 45.642 48.290
27 11.808 12.879 14.573 16.151 18.114 36.741 40.113 43.194 46.963 49.645
28 12.461 13.565 15.308 16.928 18.939 37.916 41.337 44.461 48.278 50.993
29 13.121 14.256 16.047 17.708 19.768 39.088 42.557 45.722 49.588 52.336
30 13.787 14.953 16.791 18.493 20.599 40.256 43.773 46.979 50.892 53.672

34 Pearson Edexcel Level 3 Advanced Subsidiary and Advanced GCE in Mathematics and Further Mathematics
– Mathematical Formulae and Statistical Tables – Version 1.0 – Accredited pre-publication – March 2017
© Pearson Education Limited 2017
Critical Values for Correlation Coefficients
These tables concern tests of the hypothesis that a population correlation coefficient is 0. The values
in the tables are the minimum values which need to be reached by a sample correlation coefficient in order to be significant at the level shown, on a one-tailed test.
Product Moment Coefficient Sample Level
Spearman’s Coefficient
0.10 0.05 Level
0.025 0.01 0.005 0.05
Level
0.025 0.01
0.8000 0.9000 0.9500 0.9800 0.9900 4 1.0000 - -
0.6870 0.8054 0.8783 0.9343 0.9587 5
0.9000 1.0000 1.0000
0.6084 0.7293 0.8114 0.8822 0.9172 6 0.8286 0.8857 0.9429
0.5509 0.6694 0.7545 0.8329 0.8745 7 0.7143 0.7857 0.8929
0.5067 0.6215 0.7067 0.7887 0.8343 8 0.6429 0.7381 0.8333
0.4716 0.5822 0.6664 0.7498 0.7977 9 0.6000 0.7000 0.7833
0.4428 0.5494 0.6319 0.7155 0.7646 10
0.5636 0.6485 0.7455
0.4187 0.5214 0.6021 0.6851 0.7348 11 0.5364 0.6182 0.7091
0.3981 0.4973 0.5760 0.6581 0.7079 12 0.5035 0.5874 0.6783
0.3802 0.4762 0.5529 0.6339 0.6835 13 0.4835 0.5604 0.6484
0.3646 0.4575 0.5324 0.6120 0.6614 14 0.4637 0.5385 0.6264
0.3507 0.4409 0.5140 0.5923 0.6411 15
0.4464 0.5214 0.6036
0.3383 0.4259 0.4973 0.5742 0.6226 16 0.4294 0.5029 0.5824
0.3271 0.4124 0.4821 0.5577 0.6055 17 0.4142 0.4877 0.5662
0.3170 0.4000 0.4683 0.5425 0.5897 18 0.4014 0.4716 0.5501
0.3077 0.3887 0.4555 0.5285 0.5751 19 0.3912 0.4596 0.5351
0.2992 0.3783 0.4438 0.5155 0.5614 20
0.3805 0.4466 0.5218
0.2914 0.3687 0.4329 0.5034 0.5487 21 0.3701 0.4364 0.5091
0.2841 0.3598 0.4227 0.4921 0.5368 22 0.3608 0.4252 0.4975
0.2774 0.3515 0.4133 0.4815 0.5256 23 0.3528 0.4160 0.4862
0.2711 0.3438 0.4044 0.4716 0.5151 24 0.3443 0.4070 0.4757
0.2653 0.3365 0.3961 0.4622 0.5052 25
0.3369 0.3977 0.4662
0.2598 0.3297 0.3882 0.4534 0.4958 26 0.3306 0.3901 0.4571
0.2546 0.3233 0.3809 0.4451 0.4869 27 0.3242 0.3828 0.4487
0.2497 0.3172 0.3739 0.4372 0.4785 28 0.3180 0.3755 0.4401
0.2451 0.3115 0.3673 0.4297 0.4705 29 0.3118 0.3685 0.4325
0.2407 0.3061 0.3610 0.4226 0.4629 30
0.3063 0.3624 0.4251
0.2070 0.2638 0.3120 0.3665 0.4026 40 0.2640 0.3128 0.3681
0.1843 0.2353 0.2787 0.3281 0.3610 50 0.2353 0.2791 0.3293
0.1678 0.2144 0.2542 0.2997 0.3301 60 0.2144 0.2545 0.3005
0.1550 0.1982 0.2352 0.2776 0.3060 70 0.1982 0.2354 0.2782
0.1448 0.1852 0.2199 0.2597 0.2864 80
0.1852 0.2201 0.2602
0.1364 0.1745 0.2072 0.2449 0.2702 90 0.1745 0.2074 0.2453
0.1292 0.1654 0.1966 0.2324 0.2565 100 0.1654 0.1967 0.2327

Pearson Edexcel Level 3 Advanced Subsidiary and Advanced GCE in Mathematics and Further Mathematics – 35Mathematical Formulae and Statistical Tables – Version 1.0 – Accredited pre-publication – March 2017
© Pearson Education Limited 2017
Random Numbers
86 13 84 10 07 30 39 05 97 96 88 07 37 26 04 89 13 48 19 20
60 78 48 12 99 47 09 46 91 33 17 21 03 94 79 00 08 50 40 16
78 48 06 37 82 26 01 06 64 65 94 41 17 26 74 66 61 93 24 97
80 56 90 79 66 94 18 40 97 79 93 20 41 51 25 04 20 71 76 04
99 09 39 25 66 31 70 56 30 15 52 17 87 55 31 11 10 68 98 23
56 32 32 72 91 65 97 36 56 61 12 79 95 17 57 16 53 58 96 36
66 02 49 93 97 44 99 15 56 86 80 57 11 78 40 23 58 40 86 14
31 77 53 94 05 93 56 14 71 23 60 46 05 33 23 72 93 10 81 23
98 79 72 43 14 76 54 77 66 29 84 09 88 56 75 86 41 67 04 42
50 97 92 15 10 01 57 01 87 33 73 17 70 18 40 21 24 20 66 62
90 51 94 50 12 48 88 95 09 34 09 30 22 27 25 56 40 76 01 59
31 99 52 24 13 43 27 88 11 39 41 65 00 84 13 06 31 79 74 97
22 96 23 34 46 12 67 11 48 06 99 24 14 83 78 37 65 73 39 47
06 84 55 41 27 06 74 59 14 29 20 14 45 75 31 16 05 41 22 96
08 64 89 30 25 25 71 35 33 31 04 56 12 67 03 74 07 16 49 32
86 87 62 43 15 11 76 49 79 13 78 80 93 89 09 57 07 14 40 74
94 44 97 13 77 04 35 02 12 76 60 91 93 40 81 06 85 85 72 84
63 25 55 14 66 47 99 90 02 90 83 43 16 01 19 69 11 78 87 16
11 22 83 98 15 21 18 57 53 42 91 91 26 52 89 13 86 00 47 61
01 70 10 83 94 71 13 67 11 12 36 54 53 32 90 43 79 01 95 15
36 Pearson Edexcel Level 3 Advanced Subsidiary and Advanced GCE in Mathematics and Further Mathematics
– Mathematical Formulae and Statistical Tables – Version 1.0 – Accredited pre-publication – March 2017
© Pearson Education Limited 2017
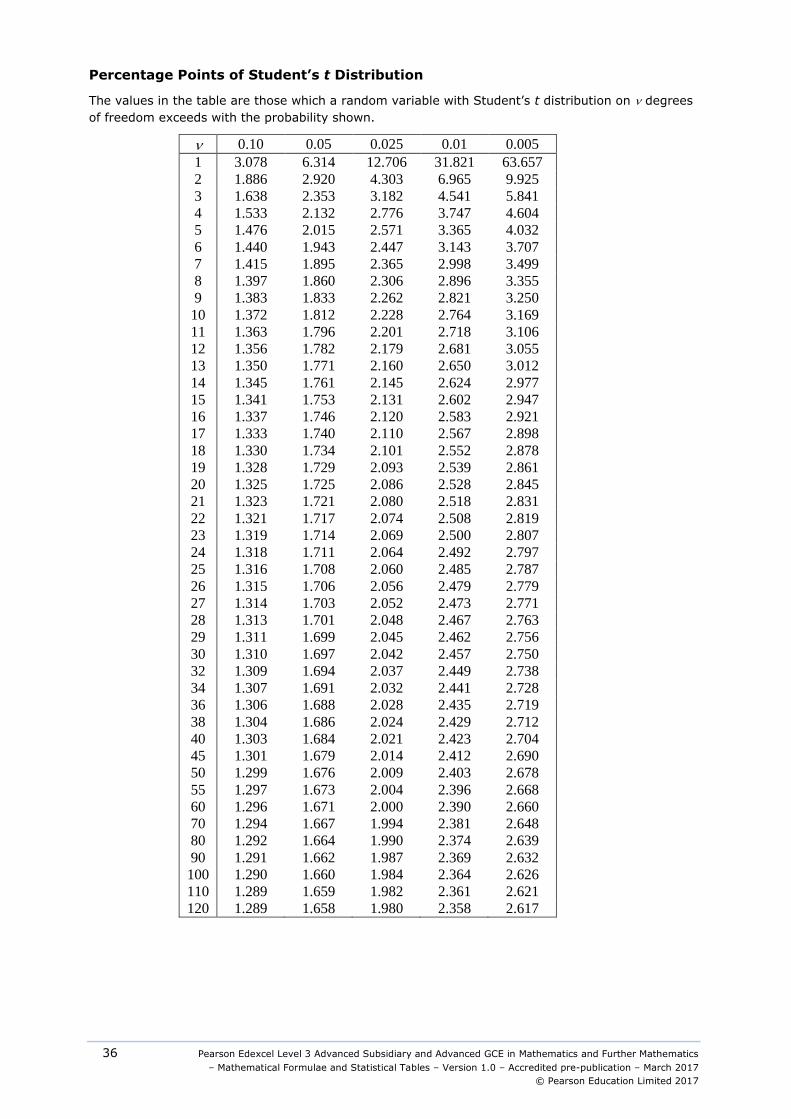
Percentage Points of Student’s t Distribution
The values in the table are those which a random variable with Student’s t distribution on degrees
of freedom exceeds with the probability shown.
0.10 0.05 0.025 0.01 0.005
1 3.078 6.314 12.706 31.821 63.657
2 1.886 2.920 4.303 6.965 9.925
3 1.638 2.353 3.182 4.541 5.841
4 1.533 2.132 2.776 3.747 4.604
5 1.476 2.015 2.571 3.365 4.032
6 1.440 1.943 2.447 3.143 3.707
7 1.415 1.895 2.365 2.998 3.499
8 1.397 1.860 2.306 2.896 3.355
9 1.383 1.833 2.262 2.821 3.250
10 1.372 1.812 2.228 2.764 3.169
11 1.363 1.796 2.201 2.718 3.106
12 1.356 1.782 2.179 2.681 3.055
13 1.350 1.771 2.160 2.650 3.012
14 1.345 1.761 2.145 2.624 2.977
15 1.341 1.753 2.131 2.602 2.947
16 1.337 1.746 2.120 2.583 2.921
17 1.333 1.740 2.110 2.567 2.898
18 1.330 1.734 2.101 2.552 2.878
19 1.328 1.729 2.093 2.539 2.861
20 1.325 1.725 2.086 2.528 2.845
21 1.323 1.721 2.080 2.518 2.831
22 1.321 1.717 2.074 2.508 2.819
23 1.319 1.714 2.069 2.500 2.807
24 1.318 1.711 2.064 2.492 2.797
25 1.316 1.708 2.060 2.485 2.787
26 1.315 1.706 2.056 2.479 2.779
27 1.314 1.703 2.052 2.473 2.771
28 1.313 1.701 2.048 2.467 2.763
29 1.311 1.699 2.045 2.462 2.756
30 1.310 1.697 2.042 2.457 2.750
32 1.309 1.694 2.037 2.449 2.738
34 1.307 1.691 2.032 2.441 2.728
36 1.306 1.688 2.028 2.435 2.719
38 1.304 1.686 2.024 2.429 2.712
40 1.303 1.684 2.021 2.423 2.704
45 1.301 1.679 2.014 2.412 2.690
50 1.299 1.676 2.009 2.403 2.678
55 1.297 1.673 2.004 2.396 2.668
60 1.296 1.671 2.000 2.390 2.660
70 1.294 1.667 1.994 2.381 2.648
80 1.292 1.664 1.990 2.374 2.639
90 1.291 1.662 1.987 2.369 2.632
100 1.290 1.660 1.984 2.364 2.626
110 1.289 1.659 1.982 2.361 2.621
120 1.289 1.658 1.980 2.358 2.617

Pearson Edexcel Level 3 Advanced Subsidiary and Advanced GCE in Mathematics and Further Mathematics – 37Mathematical Formulae and Statistical Tables – Version 1.0 – Accredited pre-publication – March 2017
© Pearson Education Limited 2017
Percentage Points of the F Distribution
The values in the table are those which a random variable with the F distribution on 1 and 2
degrees of freedom exceeds with probability 0.05 or 0.01.
Probability
1
2
1 2 3 4 5 6 8 10 12 24
0.05
1 161.4 199.5 215.7 224.6 230.2 234.0 238.9 241.9 243.9 249.1 254.3
2 18.51 19.00 19.16 19.25 19.30 19.33 19.37 19.40 19.41 19.46 19.50
3 10.13 9.55 9.28 9.12 9.01 8.94 8.85 8.79 8.74 8.64 8.53
4 7.71 6.94 6.59 6.39 6.26 6.16 6.04 5.96 5.91 5.77 5.63
5 6.61 5.79 5.41 5.19 5.05 4.95 4.82 4.74 4.68 4.53 4.37
6 5.99 5.14 4.76 4.53 4.39 4.28 4.15 4.06 4.00 3.84 3.67
7 5.59 4.74 4.35 4.12 3.97 3.87 3.73 3.64 3.57 3.41 3.23
8 5.32 4.46 4.07 3.84 3.69 3.58 3.44 3.35 3.28 3.12 2.93
9 5.12 4.26 3.86 3.63 3.48 3.37 3.23 3.14 3.07 2.90 2.71
10 4.96 4.10 3.71 3.48 3.33 3.22 3.07 2.98 2.91 2.74 2.54
11 4.84 3.98 3.59 3.36 3.20 3.09 2.95 2.85 2.79 2.61 2.40
12 4.75 3.89 3.49 3.26 3.11 3.00 2.85 2.75 2.69 2.51 2.30
14 4.60 3.74 3.34 3.11 2.96 2.85 2.70 2.60 2.53 2.35 2.13
16 4.49 3.63 3.24 3.01 2.85 2.74 2.59 2.49 2.42 2.24 2.01
18 4.41 3.55 3.16 2.93 2.77 2.66 2.51 2.41 2.34 2.15 1.92
20 4.35 3.49 3.10 2.87 2.71 2.60 2.45 2.35 2.28 2.08 1.84
25 4.24 3.39 2.99 2.76 2.60 2.49 2.34 2.24 2.16 1.96 1.71
30 4.17 3.32 2.92 2.69 2.53 2.42 2.27 2.16 2.09 1.89 1.62
40 4.08 3.23 2.84 2.61 2.45 2.34 2.18 2.08 2.00 1.79 1.51
60 4.00 3.15 2.76 2.53 2.37 2.25 2.10 1.99 1.92 1.70 1.39
120 3.92 3.07 2.68 2.45 2.29 2.18 2.02 1.91 1.83 1.61 1.25
3.84 3.00 2.60 2.37 2.21 2.10 1.94 1.83 1.75 1.52 1.00
0.01
1 4052. 5000. 5403. 5625. 5764. 5859. 5982. 6056. 6106. 6235. 6366.
2 98.50 99.00 99.17 99.25 99.30 99.33 99.37 99.40 99.42 99.46 99.50
3 34.12 30.82 29.46 28.71 28.24 27.91 27.49 27.23 27.05 26.60 26.13
4 21.20 18.00 16.69 15.98 15.52 15.21 14.80 14.55 14.37 13.93 13.45
5 16.26 13.27 12.06 11.39 10.97 10.67 10.29 10.05 9.89 9.47 9.02
6 13.70 10.90 9.78 9.15 8.75 8.47 8.10 7.87 7.72 7.31 6.88
7 12.20 9.55 8.45 7.85 7.46 7.19 6.84 6.62 6.47 6.07 5.65
8 11.30 8.65 7.59 7.01 6.63 6.37 6.03 5.81 5.67 5.28 4.86
9 10.60 8.02 6.99 6.42 6.06 5.80 5.47 5.26 5.11 4.73 4.31
10 10.00 7.56 6.55 5.99 5.64 5.39 5.06 4.85 4.17 4.33 3.91
11 9.65 7.21 6.22 5.67 5.32 5.07 4.74 4.54 4.40 4.02 3.60
12 9.33 6.93 5.95 5.41 5.06 4.82 4.50 4.30 4.16 3.78 3.36
14 8.86 6.51 5.56 5.04 4.70 4.46 4.14 3.94 3.80 3.43 3.00
16 8.53 6.23 5.29 4.77 4.44 4.20 3.89 3.69 3.55 3.18 2.75
18 8.29 6.01 5.09 4.58 4.25 4.01 3.71 3.51 3.37 3.00 2.57
20 8.10 5.85 4.94 4.43 4.10 3.87 3.56 3.37 3.23 2.86 2.42
25 7.77 5.57 4.68 4.18 3.86 3.63 3.32 3.13 2.99 2.62 2.17
30 7.56 5.39 4.51 4.02 3.70 3.47 3.17 2.98 2.84 2.47 2.01
40 7.31 5.18 4.31 3.83 3.51 3.29 2.99 2.80 2.66 2.29 1.80
60 7.08 4.98 4.13 3.65 3.34 3.12 2.82 2.63 2.50 2.12 1.60
120 6.85 4.79 3.95 3.48 3.17 2.96 2.66 2.47 2.34 1.95 1.38
6.63 4.61 3.78 3.32 3.02 2.80 2.51 2.32 2.18 1.79 1.00
If an upper percentage point of the F distribution on 1 and 2 degrees of freedom is f , then the corresponding
lower percentage point of the F distribution on 2 and 1 degrees of freedom is 1/ f.