Embed Size (px)
Citation preview

PEAK TO AVERAGE POWER RATIO (PAPR) REDUCTION IN
OFDM BASED RADIO SYSTEMS
Mohammad Zavid Parvez
Md. Abdullah Al Baki
This thesis is presented as part of Degree of Master of Science in Electrical Engineering
Blekinge Institute of Technology
May 2010
Blekinge Institute of Technology School of Engineering Department of Signal Processing Supervisor : Professor Abbas Mohammed Examiner : Professor Abbas Mohammed
MEE10:12

Blekinge Institute of Technology (BTH), Sweden Page 2
Dedication To
Our Parents And
Teachers

Blekinge Institute of Technology (BTH), Sweden Page 3
Abstract
High data rate wireless access is demanded by many applications. Usually,
more bandwidth is required for higher data rate transmission in any of the
system. With promising technology and ever-increasing wireless devices, the
spectrum is becoming scarcer day by day. In this case, using Orthogonal
Frequency Division Multiplexing (OFDM) and Cognitive Radio (CR) for
spectrally efficient transmission are an alternative solution.
OFDM is a bandwidth efficient multicarrier modulation where the available
spectrum is divided into subcarriers, with each subcarrier containing a low rate
data stream. OFDM has gained a tremendous interest in recent years because
of its robustness in the presence of severe multipath channel conditions with
simple equalization, robustness against Inter-symbol Interference (ISI),
multipath fading, in addition to its high spectral efficiency. However, the Peak-
to-Average Power Ratio (PAPR) is a major drawback of multicarrier
transmission system such as OFDM.
CR can be defined as an intelligent wireless system that is always alert about its
surrounding environment through sensing and should have ability to
dynamically adjust its radio operation parameters. The CR demands that the
physical layer (PHY) needs to be adaptable and flexible.
For flexibility and adaptability, the OFDM is an attractive candidate for CR
systems. This dissertation proposes a novel non-contiguous OFDM (NC-
OFDM) technique, where the implementation achieves high data rates of non-
contiguous subcarriers while simultaneously avoiding any interference to the
transmissions.
In this dissertation we apply different modulation techniques to reduce high
PAPR for non-contiguous bands spectrum of OFDM based CR. The simulation
results for PAPR reduction shows that higher modulation techniques are better
compared to lower modulation techniques.

Blekinge Institute of Technology (BTH), Sweden Page 4
Acknowledgement
All praises to almighty ALLAH who give us strength and abilities to complete
this thesis work successfully.
We would like to give our sincere gratitude to our honourable supervisor Prof.
Abbas Mohammed for his assistance and good guidance time after time which
made our thesis work become more precise and attractive. He supervises us and
gives his spare time to discuss more about the problem of thesis work.
We are grateful to our beloved parents for their love and continuous support
during the thesis work at BTH until finish.
Finally, we would like to thanks again to almighty ALLAH, for keeping us good
understanding and relationship in between us through this thesis work that is
more improved and constructive to do better.

Blekinge Institute of Technology (BTH), Sweden Page 5
Table of Contents
Abstract ................................................................................................................................................... 3
Acknowledgement .................................................................................................................................. 4
Table of Contents .................................................................................................................................... 5
List of Figures .......................................................................................................................................... 8
List of Tables ........................................................................................................................................... 9
List of Abbreviations ............................................................................................................................. 10
Chapter One: Introduction .................................................................................................................... 14
1.1 Motivation ................................................................................................................................... 14
1.2 Thesis out Lines .......................................................................................................................... 15
Chapter Two: Orthogonal Frequency Division Multiplexing (OFDM) ................................................... 16
2.1 Introduction ................................................................................................................................. 16
2.2 Advantages and Disadvantages of OFDM System ..................................................................... 17
2.2.1 Advantages of OFDM .......................................................................................................... 17
2.2.2 Disadvantages of OFDM ..................................................................................................... 18
2.3 OFDM System Model ................................................................................................................. 18
2.4 Mathematical Definition of OFDM Signal ................................................................................. 20
2.5 NC-OFDM System Model .......................................................................................................... 21
2.6 Why PAPR reduction in OFDM system ..................................................................................... 22
2.7 Mathematical Definition of PAPR .............................................................................................. 23
2.8 PAPR Techniques ....................................................................................................................... 23
2.8.1 Signal Scrambling Techniques ............................................................................................. 24
2.8.1.1 Block Coding Techniques ............................................................................................. 24
2.8.1.2 Block Coding Scheme with Error Correction ............................................................... 24
2.8.1.3 Selected Mapping (SLM) .............................................................................................. 25
2.8.1.4 Partial Transmit Sequence (PTS) .................................................................................. 25
2.8.1.5 Interleaving Technique ................................................................................................. 25
2.8.1.6 Tone Reservation (TR) .................................................................................................. 26
2.8.1.7 Tone Injection (TI) ........................................................................................................ 26
2.8.2 Signal Distortion Techniques ............................................................................................... 27
2.8.2.1 Peak Windowing ........................................................................................................... 27

Blekinge Institute of Technology (BTH), Sweden Page 6
2.8.2.2 Envelope Scaling........................................................................................................... 27
2.8.2.3 Peak Reduction Carrier ................................................................................................. 27
2.8.2.4 Clipping and Filtering ................................................................................................... 28
2.9 Overall Analysis of Different Techniques .................................................................................. 29
2.10 Conclusion ................................................................................................................................ 30
Chapter Three: Cognitive Radio ............................................................................................................ 31
3.1 Introduction ................................................................................................................................. 31
3.2 The Features of CR ..................................................................................................................... 32
3.3 The Evolution of Radio Technology ........................................................................................... 33
3.4 Software Defined Radio (SDR) .................................................................................................. 34
3.4.1 Benefits of SDR ................................................................................................................... 34
3.4.2 Relationship between SDR and CR ..................................................................................... 35
3.4.3 Ideal SDR Architecture for CRs .......................................................................................... 36
3.5 Spectrum Sensing ........................................................................................................................ 37
3.5.1 Different Techniques of Spectrum Sensing in CR ............................................................... 37
3.5.1.1 Primary Transmitter Detection ...................................................................................... 38
3.5.1.1.1 Matched Filter Detection ....................................................................................... 39
3.5.1.1.2 Energy Detection .................................................................................................... 39
3.5.1.1.3 Cyclostationary Detection ...................................................................................... 40
3.5.1.2 Cooperative Detection ................................................................................................... 42
3.5.1.3 Primary Receiver Detection .......................................................................................... 42
3.5.1.4 Interference Temperature Management ........................................................................ 43
Chapter Four: OFDM Based Cognitive Radio ........................................................................................ 44
4.1 Merits and Challenges for OFDM Based CR ............................................................................. 44
4.2 OFDM Based CR Architecture ................................................................................................... 44
4.3 Proposed System ......................................................................................................................... 47
Chapter Five: Channel Models .............................................................................................................. 49
5.1 Introduction ................................................................................................................................. 49
5.2 Additive White Gaussian Noise (AWGN) Channel .................................................................... 49
5.3 Rayleigh fading channel.............................................................................................................. 50
5.3.1 Mathematical Expression ..................................................................................................... 51
Chapter Six: Simulation and Results ..................................................................................................... 53
6.1 Introduction ................................................................................................................................. 53
6.2 Mathematical Definitions ............................................................................................................ 53

Blekinge Institute of Technology (BTH), Sweden Page 7
6.3 PAPR Reduction ......................................................................................................................... 54
6.4 BER calculation for AWGN channel .......................................................................................... 57
6.5 BER calculation for Rayleigh fading channel ............................................................................. 59
6.6 BER calculation for Different channels ...................................................................................... 61
Chapter Seven: Conclusion ................................................................................................................... 63
References ............................................................................................................................................ 64

Blekinge Institute of Technology (BTH), Sweden Page 8
List of Figures
Figure 2. 1-OFDM subcarriers in frequency domain ......................................................... 17
Figure 2. 2-A basic diagram of OFDM Transceiver ........................................................... 19
Figure 2. 3 NC-OFDM Transceiver ..................................................................................... 22
Figure 3. 1-SDR intensity ...................................................................................................... 33
Figure 3. 2 -The relationship of SDR and Cognitive Radio ............................................... 35
Figure 3. 3 -Ideal software defined radio architecture ....................................................... 36
Figure 3. 4 -Primary transmitter detection ......................................................................... 38
Figure 3. 5 -Implementation of an energy detector using Welch Periodgram averaging40
Figure 3. 6 -Implementation of a cyclostationary feature detector ................................... 41
Figure 4. 1- Research challenges in Cognitive Radio and OFDM [10] ............................. 45
Figure 4. 2- OFDM base Cognitive Radio system block diagram [10] ............................. 46
Figure 4. 3 -Proposed block diagram of NC-OFDM based Cognitive Radio ................... 47
Figure 5. 1- AWGN channel .................................................................................................. 50
Figure 6. 1- PAPR reduction using BPSK with clipping and filtering .............................. 54
Figure 6. 2- PAPR reduction using QPSK with clipping and filtering ............................. 55
Figure 6. 3- PAPR reduction using QAM16 with clipping and filtering .......................... 56
Figure 6. 4- BER Vs SNR using BPSK through AWGN channel ...................................... 57
Figure 6. 5- BER Vs SNR using QPSK through AWGN channel ..................................... 58
Figure 6. 6- BER Vs SNR using BPSK through Rayleigh fading channel ....................... 59
Figure 6. 7- BER Vs SNR using QPSK through Rayleigh fading channel ....................... 60
Figure 6. 8- BER Vs SNR using BPSK through two different channels ........................... 61
Figure 6. 9- BER Vs SNR using QPSK through two different channels .......................... 62

Blekinge Institute of Technology (BTH), Sweden Page 9
List of Tables
Table 2. 1-Comparison of PAPR Reduction Techniques ................................................... 29
Table 3. 1- Comparison different techniques of spectrum sensing ................................... 42
Table 4. 1- OFDM Based Wireless Standards ..................................................................... 46

Blekinge Institute of Technology (BTH), Sweden Page 10
List of Abbreviations
A
AWGN Additive White Gaussian Noise ATSC Advanced Television Systems Committee ADSL Asymmetric Digital Subscriber Line AI Adaptive Interleave ADC Analog to Digital Converter DAC Digital to Analog Converter
B
BPSK Binary Phase Shift Keying BER Bit Error Rate BSC Binary Symmetric Channel BO Back Off
C
CR Cognitive Radio COBSC Combination Optimized Sub-Block Coding Scheme CDMA Code Division Multiple Access CP Cyclic Prefix CDF Cumulative Distribution Function
D
DSP Digital Signal Processing DVB Digital Video Broadcasting DFS Dynamic Frequency Selection DARPA Defense Advanced Research Project Agency DFT Discrete Fourier Transform DTV Digital Television
E

Blekinge Institute of Technology (BTH), Sweden Page 11
EDGE Enhance Data GSM Environment
F
FFT Fast Fourier Transform FDM Frequency Division Multiplexing FDMA Frequency division Multiple Access FCC Federal Communication Commission FPGA Field Programmable Gate Arrays FEC Forward Error Correction
G
GPP General Purpose Processors GSM Global System for Mobile Communication
H
HiperLAN High Performance Radio LAN
I
ISI Inter Symbol Interference ICI Inter Carrier Interference IEEE Institute of Electrical and Electronic Engineers IFFT Inverse Fast Fourier Transform IDFT Inverse Discrete Fourier Transform
L
LTE Long Term Evolution LAN Local Area Network LO Local Oscillator LOS Line Of Sight

Blekinge Institute of Technology (BTH), Sweden Page 12
M
MIMO Multiple Input Multiple Output MISO Multiple Input Single Output MAC Media Access Control
N
NPRM Notice of Proposed Rule Making
O
OFDM Orthogonal Frequency Division Multiplexing OFDMA Orthogonal Frequency Division Multiple Access
P
PHY Physical Layer PTS Partial Transmit Sequences PSK Phase Shift Keying PEPs Peak Envelope Powers PA Power Amplifier LNA Low Noise Amplifiers PAPR Peak to Average Power Ratio
Q
QPSK Quadrature Phase Shift Keying QAM Quadrature Amplitude Modulation
R RBLO-SBC Redundant Bit Location Optimized Sub-Block Coding RF Radio Frequency

Blekinge Institute of Technology (BTH), Sweden Page 13
S
SDR Software Defined Radio SNR Signal to Noise Ratio SLM Selective Level Mapping SoC System on Chip SISO Single Input Single Output SIMO Single Input Multiple Output
T
TR Tone Reservation TI Tone Injection TDMA Time Division Multiple Access
U
UWB Ultra Wide Band U-NII Unlicensed National Information Infrastructure
V
VLSI Very Large Scale Integration
W
WiMAX Worldwide Interoperability for Microwave Access Wi-Fi Wireless Fidelity WLAN Wide Area Network WRAN Wireless Regional Area Network WMAN Wireless Metropolitan Area Network WLAN Wireless Local Area Network WCDMA Wide Code Division Multiple Access WSS Wide Sense Stationary WLAN Wireless Local Area Network

Blekinge Institute of Technology (BTH), Sweden Page 14
Chapter One: Introduction
1.1 Motivation
With the advent of new high data rate wireless applications, demand of the spectrum is
rapidly increasing. Communications governmental and regulatory agencies impose
regulations on spectrum usage, such as control of allocations and priorities, as well as its
features. At this time, most of the prime spectrum has been assigned and it is difficult to find
spectrum for the new wireless applications. It can be made available for either expand
existing infrastructures or invent new services. Even though much of the spectrum has been
allocated and preliminary measurement is that the spectrum is unutilized by primary users.
There exist a lot of spectrums holes, which can be easily used by secondary users. FCC is
currently working on the concept of dynamic spectrum access, where secondary users can
borrow un-used portions of the spectrum from primary users. Cognitive Radio (CR) is
employing on proper spectrum utilization because of their rapid adaptability and flexibility.
Orthogonal Frequency Division Multiplexing (OFDM) is promising candidate for flexible
spectrum pooling in communication systems [31].
CR is an emerging technology, which intelligently detects a particular segment of the radio
spectrum currently in use and selects unused spectrum without interfering to licensed users.
One of the challenges of the OFDM is high peak-to-average power ratio (PAPR). A high
PAPR brings disadvantages like an increased complexity of the A/D and D/A converters and
reduced efficiency of radio frequency (RF) power amplifier [53]. OFDM signal consists of a
number of independent modulated subcarriers that leads to the problem of PAPR. If all
subcarriers come with same phase, the peak power is N times the average power of the signal
where N is the total number of symbols in an OFDM signal. Thus, it is not possible to send
this high peak amplitude signals to the transmitter without reducing peaks. Because power
amplifier used for the transmission has non-linear nature which causing inter-modulation and
out-of-band radiation. The high peak of OFDM signal can be reduced in several ways.
The focus of this dissertation is on OFDM based CR, which can handle the apparent spectrum
scarcity and enable high data rate communications. The proposed system exhibits high PAPR
reduction for non-contiguous bands spectrum of OFDM based CR.

Blekinge Institute of Technology (BTH), Sweden Page 15
1.2 Thesis out Lines
This thesis is organized as follows:
Chapter 2: Presents an introduction of OFDM and describe its principles, advantages and
disadvantages, the basic OFDM transceiver model, different techniques of PAPR reduction
and finally the comparison of PAPR reduction techniques in theoretical aspect.
Chapter 3: Presents the introduction of Cognitive Radio (CR), background, spectrum
sensing, licensed and unlicensed spectrum in CR. It also presents an introduction to software
defined radio (SDR), background, benefits, architectures, and the relationship between SDR
and CR.
Chapter 4: Presents the merits and challenge architectures of OFDM based CR and analysis
of its system block diagram.
Chapter 5: Presents in the different kinds of channel model; including AWGN, Rayleigh
fading channel.
Chapter 6: Presents the simulation results by using MATLAB simulator that is implemented
in different channels with BPSK, QPSK, and QAM16 modulation schemes and also BER
calculation.
Chapter 7: Presents the main objective of thesis with concluding remarks and proposes the
future work of this thesis for advance research.

Blekinge Institute of Technology (BTH), Sweden Page 16
Chapter Two: Orthogonal Frequency
Division Multiplexing (OFDM)
2.1 Introduction
Orthogonal Frequency Division Multiplexing (OFDM) is a multicarrier modulation technique
that divides the available spectrum into subcarriers, with each subcarrier containing a low rate
data stream. The subcarriers have proper spacing and pass-band filter shape to satisfy
orthogonality as shown in Figure 2.1. OFDM will play an important role in realizing
Cognitive Radio (CR) concept by providing a proven, scalable, adaptive technology for
wireless communications [10]. Inter-symbol interference (ISI) is reduced completely by using
a guard band in every OFDM symbol. In OFDM, using guard band is cyclically extended in
order to avoid inter-carrier interference (ICI). The advantage of OFDM system is robustness
to channel fading in wireless communication environment. Frequency selective fading is
reduced by increasing the number of subcarriers. By choosing the coherence bandwidth is
greater than the subcarrier spacing of the channel, each subcarrier is going to be affected by a
flat channel and thus no or simple channel equalizer is needed.
OFDM is used in many wireless applications today. Already it is used in different WLAN
standards (e.g. HIPERLAN-2, IEEE 802.11a), Wireless Metropolitan Area Networks
(WMAN), Digital Video Broadcasting (DVB), 3GPP-LTE, Asymmetric Digital Subscriber
Line (ADSL) and power line communications.
Despite of OFDM advantages, it has a major potential drawback in the form of high Peak-to-
Average Power Ratio (PAPR). The high PAPR has nonlinear nature in the transmitter and it
degrades the power efficiency of the system.

Blekinge Institute of Technology (BTH), Sweden Page 17
+∆f +∆f
f
Figure 2. 1-OFDM subcarriers in frequency domain
2.2 Advantages and Disadvantages of OFDM System
There are some advantages and disadvantages of OFDM are summarized below:
2.2.1 Advantages of OFDM
Some of the advantages of an OFDM system are as follows:-
OFDM is computationally efficient to employ the modulation and demodulation
techniques by using FFT.
The OFDM signal is robustness in multipath propagation environment and more
tolerant of delay spread.
1 Subcarrier
(f) ∆f=1/Ts
(f)
(f)
()
8 Subcarriers

Blekinge Institute of Technology (BTH), Sweden Page 18
OFDM is more resistant to frequency selective fading than single carrier transmission
systems.
OFDM system gives good protection against co-channel interference and impulsive
parasitic noise.
Pilot subcarriers are used in OFDM system to prevent frequency and phase shift
errors.
It is possible to use maximum likelihood detection with reasonable complexity.
OFDM is a good candidate for CR because of its flexibility and adaptability [10].
The orthogonality preservation procedures in OFDM are much simpler compared to
CDMA/TDMA technique in multipath conditions [8].
2.2.2 Disadvantages of OFDM
Some of the disadvantages of an OFDM system are as follows:-
The OFDM signal suffers high peak to average power ratios (PAPR) of transmitted
signal.
OFDM is very sensitive to carrier frequency offset.
It is difficult to synchronize when subcarriers are shared among different transmitters.
2.3 OFDM System Model
A Basic OFDM system is described in Figure 2.2. Here an input data symbols are supplied
into a channel encoder that data are mapped onto BPSK/QPSK/QAM constellation.
The data symbols are converted from serial to parallel and using Inverse Fast Fourier
Transform (IFFT) to achieve the time domain OFDM symbols. Time domain symbols can be
represented as:
(2.1)
where,
is the transmitted symbol on the subcarriers
N is the number of subcarriers
Blekinge Institute of Technology (BTH), Sweden Page 19
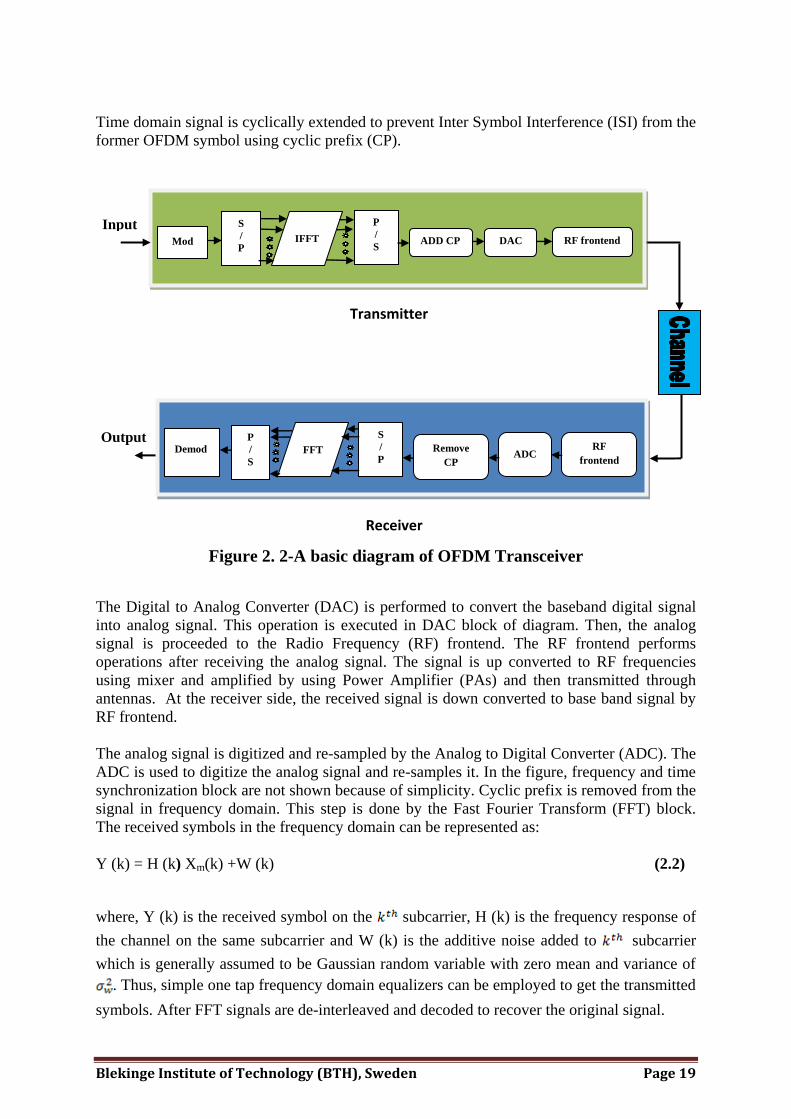
Time domain signal is cyclically extended to prevent Inter Symbol Interference (ISI) from the
former OFDM symbol using cyclic prefix (CP).
Figure 2. 2-A basic diagram of OFDM Transceiver
The Digital to Analog Converter (DAC) is performed to convert the baseband digital signal
into analog signal. This operation is executed in DAC block of diagram. Then, the analog
signal is proceeded to the Radio Frequency (RF) frontend. The RF frontend performs
operations after receiving the analog signal. The signal is up converted to RF frequencies
using mixer and amplified by using Power Amplifier (PAs) and then transmitted through
antennas. At the receiver side, the received signal is down converted to base band signal by
RF frontend.
The analog signal is digitized and re-sampled by the Analog to Digital Converter (ADC). The
ADC is used to digitize the analog signal and re-samples it. In the figure, frequency and time
synchronization block are not shown because of simplicity. Cyclic prefix is removed from the
signal in frequency domain. This step is done by the Fast Fourier Transform (FFT) block.
The received symbols in the frequency domain can be represented as:
Y (k) = H (k) Xm(k) +W (k) (2.2)
where, Y (k) is the received symbol on the subcarrier, H (k) is the frequency response of
the channel on the same subcarrier and W (k) is the additive noise added to , subcarrier
which is generally assumed to be Gaussian random variable with zero mean and variance of
. Thus, simple one tap frequency domain equalizers can be employed to get the transmitted
symbols. After FFT signals are de-interleaved and decoded to recover the original signal.
Input
Output
Transmitter
Receiver
IFFT S
/
P
RF frontend
DAC ADD CP Mod
P
/
S
ADC RF
frontend
Remove
CP
Demod
S
/
P FFT
P
/
S

Blekinge Institute of Technology (BTH), Sweden Page 20
2.4 Mathematical Definition of OFDM Signal
OFDM consists of multiple carriers. Each carrier can be presented as a complex waveform
like:
,
(2.3)
where,
is the amplitude of the signal
(t) is the phase of the signal
The complex signal can be described by
, (2.4)
This is a continuous signal. Each component of the signal over one symbol period can take
fixed values of the variables like:
,
,
where,
n is the number of OFDM block.
T is a time interval and the signal is sampled by 1/T then it can be represented by:
, (2.5)
Let ω0=0 then the signal becomes:
, (2.6)
The signal is compared with general Inverse Fourier Transform (IFT):
(2.7)
Here, is time frequency domain.

Blekinge Institute of Technology (BTH), Sweden Page 21
Both are equivalent if
∆f = = =
where,
τ is symbol duration period (2.8)
The OFDM signal can be defined by Fourier Transform. The Fast Fourier Transform (FFT)
can obtained frequency domain OFDM symbols and Inverse Fast Fourier Transform (IFFT)
can obtain time domain symbols. They can be written as:
Fast Fourier Transform
(2.9)
Inverse Fast Fourier Transform
(2.10)
where,
2.5 NC-OFDM System Model
In OFDM system, the achievement of large number of non-contiguous subcarriers by
collective usage for the high data rate transmission is referred as Non-Contiguous OFDM
(NC-OFDM) [31]. NC-OFDM can provide the necessary agile spectrum usage for the target
licensed spectrum if spectrum can be occupied by primary and secondary users. The spectrum
sensing measurements are deactivated during the subcarriers corresponding to the spectrum
occupied by primary user. Moreover, dynamic spectrum sensing can be determined when the
active subcarriers are located in the unoccupied spectrum bands.
Fundamentals of the NC-OFDM signal transmission and reception are quite similar to that of
the OFDM signal explained in Section 2.7.1. However, NC-OFDM techniques offer very
important advantage for growing scarcity of the large contiguous frequency spectrum, i.e. it
can support dynamic spectrum pooling for high data rate transmissions.

Blekinge Institute of Technology (BTH), Sweden Page 22
Figure 2. 3 NC-OFDM Transceiver [31]
2.6 Why PAPR reduction in OFDM system
The OFDM technique divides the total bandwidth into many narrow sub-channels and sends
data in parallel. It has various advantages, such as high spectral efficiency, immunity to
impulse interference and, frequency selective fading without having powerful channel
equalizer.
But one of the major drawbacks of the OFDM system is high PAPR. OFDM signal consists
of lot of independent modulated subcarriers, which are created the problem of PAPR. It is
impossible to send this high peak amplitude signals to the transmitter without reducing peaks.
So we have to reduce high peak amplitude of the signals before transmitting.
Input
Output
Null subcarrier
selection
Spectrum sensing measurement
Subcarrier ON/OFF information
Transmitter
Receiver
Subcarrier ON/OFF information
P
/
S IFFT
S
/
P
RF
frontend
DAC ADD CP Mod
ADC RF
frontend
Remove
CP
Demod
S
/
P FFT
P
/
S

Blekinge Institute of Technology (BTH), Sweden Page 23
2.7 Mathematical Definition of PAPR
The PAPR of the OFDM signal can be written as:
PAPR{ , τ} = (2.11)
where,
s(t) is the original signal
τ is the time interval
is the peak signal power
is the average signal power
2.8 PAPR Techniques
There have been many new approaches developed during the last few years. Several PAPR
reduction techniques have been proposed in the literature. These techniques are divided into
two groups. These are signal scrambling techniques and signal distortion techniques. The
signal scrambling techniques are:
Block coding
Selective Level Mapping (SLM)
Partial Transmit Sequences (PTS)
Signal scrambling techniques work with side information which minimized the effective
throughput since they commence redundancy. Signal distortion techniques introduce band
interference and system complexity also. Signal distortion techniques minimize high peak
dramatically by distorting signal before amplification.
The signal distortion techniques are:
Clipping
Peak windowing
Peak cancellation
Peak power suppression
Weighted multicarrier transmission

Blekinge Institute of Technology (BTH), Sweden Page 24
2.8.1 Signal Scrambling Techniques
2.8.1.1 Block Coding Techniques
Coding techniques can be applied for signal scrambling, M sequences, Golay complementary
sequences, Shapiro-Rudin sequences codes can be used to reduce the PAPR efficiently.
This Block coding technique has been proposed by Wilkinson and Jones in 1965 for the
minimization of the peak to mean envelope power ratio of multicarrier communication
system [1]. The key object in this paper is that PAPR can be minimized by block coding the
data. The block coding techniques have three stages for the development. The first stage
works with the collection of appropriate sets of code words for any number of carriers, any
M-ary phase modulation method, and any coding rate. The second stage works with the
collection of the sets of code words which enable proficient implementation of the
encoding/decoding. The third stage offers error deduction and correction potential.
There different methods for the collection of the sets of code words. The mainly insignificant
method, order to search the peak envelope power (PEP) for all possible code words for a
certain length of given number of carriers. This technique is simple and accurate for short
codes because it needs extreme computation. Natural algorithms are mainly sophisticated
searching techniques. It can be used for the collection of longer code words. A selection of
code words select from searches for encoding and decoding can be performed with a look up
table or using combinatorial logic exploiting the mathematical structure of the codes
minimization when the frame sixe is bigger.
Large PAPR reduction can be achieved if the long information sequence is separated into
different sub blocks, and all sub block encoded with System on a Programmable Chip
(SOPC). There are many likely spaces, where the odd parity checking bits can be put into
each frame to minimize PAPR. For further minimization of PAPR, redundant bit location
optimized sub-block coding (RBLO-SBC) optimizes these locations redundant Combination
optimized sub-block coding scheme (COSBC) optimizes the combination of the coded sub-
blocks, where two coding schemes instead of one is used to encode the same information
source.
2.8.1.2 Block Coding Scheme with Error Correction
This Block coding scheme with Error Correction has been proposed by Ahn and et.al in [12]
to introduce a new block coding proposal for minimization of peak to average power ratio
(PAPR) of an Orthogonal Frequency Division Multiplexing (OFDM) system. Block coding
has error correction capability. In block coding method, the OFDM symbol can be reduced by
selecting only those code words with lower PAPR. In this paper, the key object of the method
is proposed that properly designed block codes can not only minimize the PAPR, but also
give error correction capability. A k bit data block (e.g. 4-bit data) is encoded by a (n, k)
block code with a generator matrix ‘G’ in the transmitter of the system. Followed by the
phase rotator vector b to produce the encoded output x=a.G+b(mod 2).

Blekinge Institute of Technology (BTH), Sweden Page 25
To achieve the accurate generator matrix and phase rotator vector that make sure the
minimum PAPR for the OFDM system, check all the 2n codes and choose only 2k codes that
obtain the minimum PAPR. After that generator matrix ‘G’ and the phase rotator vector ‘b’
are produced; which are used mapping between these symbols combination and input data
vector ‘a’. The converse functions of the transmitter are executed in the receiver system. The
parity check matrix ‘H’ is achieved from the generator matrix ‘G’, with an exception that the
effect of the phase rotator vector b is removed before calculations of syndromes.
Contrasting the method in [1], which only presents error detection; this method can improve
the overall system performance and provides error correction capability.
2.8.1.3 Selected Mapping (SLM)
Selective Mapping (SLM) approaches have been proposed by Bauml in 1965 [13]. This
method is used for minimization of peak to average transmit power of multicarrier
transmission system with selected mapping. A complete set of candidate signal is generated
signifying the same information in selected mapping, and then concerning the most favorable
signal is selected as consider to PAPR and transmitted. In the SLM, the input data structure is
multiplied by random series and resultant series with the lowest PAPR is chosen for
transmission. To allow the receiver to recover the original data to the multiplying sequence
can be sent as ‘side information’.
One of the preliminary probabilistic methods is SLM method for reducing the PAPR
problem. The good side of selected mapping method is that it doesn’t eliminate the peaks,
and can handle any number of subcarriers. The drawback of this method is the overhead of
side information that requires to be transmitted to the receiver of the system in order to
recover information.
2.8.1.4 Partial Transmit Sequence (PTS)
Partial Transmit Sequence (PTS) technique has been proposed by Muller and Hubber in 1997
[14]. This proposed method is based on the phase shifting of sub-blocks of data and
multiplication of data structure by random vectors. This method is flexible and effective for
OFDM system. The main purpose behind this method is that the input data frame is divided
into non-overlapping sub blocks and each sub block is phase shifted by a constant factor to
reduce PAPR.
PTS is probabilistic method for reducing the PAPR problem. It can be said that PTS method
is a modified method of SLM. PTS method works better than SLM method. The main
advantage of this scheme is that there is no need to send any side information to the receiver
of the system, when differential modulation is applied in all sub blocks.
2.8.1.5 Interleaving Technique
Interleaving technique has been proposed by Jayalath and Tellambura [2], for reduction peak
to average power ratio of an OFDM transmission. A data randomization technique has
proposed for the minimization of the PAPR in this paper.

Blekinge Institute of Technology (BTH), Sweden Page 26
The notion that highly correlated data structures have large PAPR can be reduced, if long
correlation pattern is broken down. Also, this paper proposes an additive method to minimize
the complexity.
The basic idea in adaptive interleaving is to set up an initial terminating threshold. PAPR
value goes below the threshold rather than seeking each interleaved sequences. The minimal
threshold will compel the adaptive interleaving (AL) to look for all the interleaved sequences.
The main important of the scheme is that it is less complex than the PTS technique but
obtains comparable result. This method does not give the assurance result for PAPR
reduction. In this circumstance, higher order error correction method could be used in
addition to this method.
2.8.1.6 Tone Reservation (TR)
Tone Reservation (TR) method is proposed for PAPR reduction [15]. The main idea of this
method is to keep a small set of tones for PAPR reduction. This can be originated as a convex
problem and this problem can be solved accurately. The amount of PAPR reduction depends
on some factors such as number of reserved tones, location of the reserved tones, amount of
complexity and allowed power on reserved tones.
This method explains an additive scheme for minimizing PAPR in the multicarrier
communication system. It shows that reserving a small fraction of tones leads to large
minimization in PAPR ever using with simple algorithm at the transmitter of the system
without any additional complexity at the receiver end. Here, N is the small number of tones,
reserving tones for PAPR reduction may present a non–negligible fraction of the available
bandwidth and resulting in a reduction in data rate. The advantage of TR method is that it is
less complex, no side information and also no additional operation is required at the receiver
of the system. Tone reservation method is based on adding a data block and time domain
signal. A data block is dependent time domain signal to the original multicarrier signal to
minimize the high peak. This time domain signal can be calculated simply at the transmitter
of system and stripped off at the receiver.
2.8.1.7 Tone Injection (TI)
Tone Injection (TI) method has been recommended by Muller, S.H., and Huber, J.B. [14].
This technique is based on general additive method for PAR reduction. Using an additive
method achieves PAPR reduction of multicarrier signal without any data rate loss. Note that
Tone injection (TI) uses a set of equivalent constellation points for an original constellation
points to reduce PAPR. The main idea behind this method is to increase the constellation
size. Then, each point in the original basic constellation can be mapped into several
equivalent points in the extended constellation, since all information elements can be mapped
into several equivalent constellation points. These additional amounts of freedom can be
utilized for PAPR reduction. This method is called Tone Injection method because of
replacing the points in the basic constellation for the new points in the larger constellation
which corresponds to injecting a tone of the proper phase and frequency in the multi-carrier
symbol. The drawbacks of this method are; need to side information for decoding signal at
the receiver side, and cause extra IFFT operation which is more complex.

Blekinge Institute of Technology (BTH), Sweden Page 27
2.8.2 Signal Distortion Techniques
2.8.2.1 Peak Windowing
The peak windowing method has been suggested by Van Nee and Wild [17]. This method,
proposes that it is possible to remove large peaks at the cost of a slight amount of self
interference when large peaks arise infrequently. Peak windowing reduces PAPRs at the cost
of increasing the BER and out-of-band radiation. Clipping is a one kind of simple introduces
PAPR reduction technique which is self interference. The technique of peak windowing
offers better PAPR reduction with better spectral properties. (Peak Windowing technique
provides better PAPR reduction with better spectral properties than clipping).
In peak windowing method we multiply large signal peak with a specific window, for
example; Gaussian shaped window, cosine, Kaiser and Hamming window. In view of the fact
that the OFDM signal is multiplied with several of these windows, consequential spectrum is
a convolution of the original OFDM spectrum with the spectrum of the applied window.
Thus, the window should be as narrow band as possible, conversely the window should not
be too long in the time domain because various signal samples are affected, which results an
increase in bit error rate (BER). Windowing method, PAPRs can be obtained to 4dB which
from the number of independent subcarriers. The loss in signal-to-noise ratio (SNR) due to
the signal distortion is limited to about 0.3dB. A back off relative to maximum output power
of about 5.5dB is needed in spectra distortion at least 30dB below the in-band spectral
density.
2.8.2.2 Envelope Scaling
The Envelope Scaling technique has been proposed by Foomooljareon and Fernando in [18].
They proposed a new algorithm to reduce PAPR by scaling the input envelope for some
subcarriers before they are sent to IFFT. In this paper, they used 256 subcarriers with QPSK
modulation technique, so that envelopes of all the subcarriers are equal. The key idea of this
scheme is that the input envelope in some sub carrier is scaled to achieve the smallest amount
of PAPR at the output of the IFFT. Thus, the receiver of the system doesn’t need any side
information for decoding the receiver sequence.
This scheme is appropriate for QPSK modulation; the envelopes of all subcarriers are equal.
Results show that PAPR can be reduced significantly at around 4 dB. Finally the system of
single scaling factor and number of clusters equal to number of sub carriers is recommended.
2.8.2.3 Peak Reduction Carrier
Peak Reduction Carrier has been proposed by Tan and Wassell to use of the data bearing
peak reduction carriers (PRCs) to reduce the effective PAPR in the OFDM system [19].
This scheme includes the use of a higher order modulation scheme to represent a lower order
modulation symbol. This permits the amplitude and phase of the PRC to be positioned within
the constellation region symbolizing the data symbol to be transmitted.

Blekinge Institute of Technology (BTH), Sweden Page 28
For example, to use a PRC that employs a 16-PSK constellation to carry QPSK data symbol,
the 16-phases of the 16-PSK constellations are divided into four regions to represent the four
different values of the QPSK symbol.
This scheme is appropriate for PSK modulation; where the envelopes of all subcarriers are
equal. When the QAM modulation scheme will be implemented in the OFDM system, the
carrier envelope scaling will result in the serious BER degradation. To limit the bit error rate
(BER) degradation, amount of the side information would also be excessive when the number
of subcarriers is large.
2.8.2.4 Clipping and Filtering
High PAPR is one of the most common problems in OFDM. A high PAPR brings
disadvantages like increased complexity of the ADC and DAC and also reduced efficiency of
radio frequency (RF) power amplifier.
One of the simple and effective PAPR reduction techniques is clipping, which cancels the
signal components that exceed some unchanging amplitude called clip level. However,
clipping yields distortion power, which called clipping noise, and expands the transmitted
signal spectrum, which causes interfering [20]. Clipping is nonlinear process and causes in-
band noise distortion, which causes degradation in the performance of bit error rate (BER)
and out-of-band noise, which decreases the spectral efficiency [21].
Clipping and filtering technique is effective in removing components of the expanded
spectrum. Although filtering can decrease the spectrum growth, filtering after clipping can
reduce the out-of-band radiation, but may also cause some peak re-growth, which the peak
signal exceeds in the clip level [22]. The technique of iterative clipping and filtering reduces
the PAPR without spectrum expansion. However, the iterative signal takes long time and it
will increase the computational complexity of an OFDM transmitter [20].
But without performing interpolation before clipping causes it out-of-band. To avoid out-of-
band, signal should be clipped after interpolation. However, this causes significant peak re-
growth. So, it can use iterative clipping and frequency domain filtering to avoid peak re-
growth.
In the system used, serial to parallel converter converts serial input data having different
frequency component which are base band modulated symbols and apply interpolation to
these symbols by zero padding in the middle of input data. Then clipping operation is
performed to cut high peak amplitudes and frequency domain filtering is used to reduce the
out of band signal, but caused peak re-growth [22]. This consists of two FFT operations.
Forward FFT transforms the clipped signal back to discrete frequency domain. The in-band
discrete components are passed unchanged to inputs of second IFFT while out of band
components are null. The clipping and filtering process is performed iteratively until the
amplitude is set to the threshold value level to avoid the peak out-of band and peak re-
growth.
Blekinge Institute of Technology (BTH), Sweden Page 29
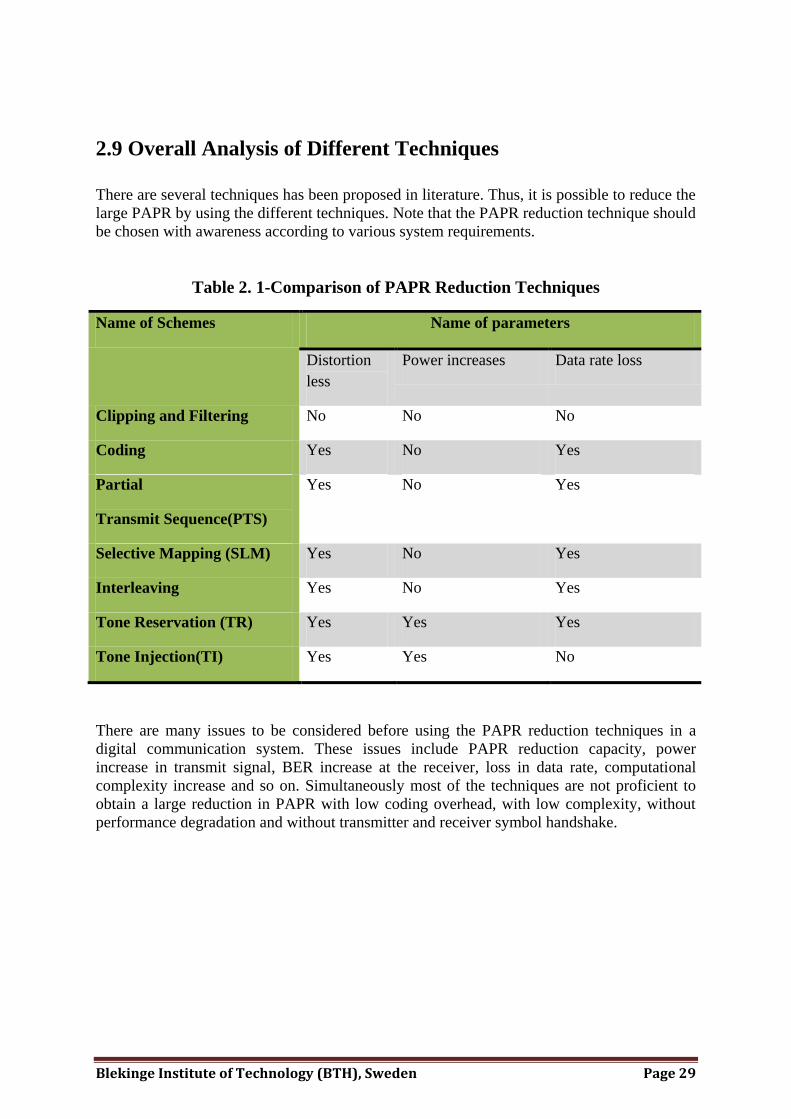
2.9 Overall Analysis of Different Techniques
There are several techniques has been proposed in literature. Thus, it is possible to reduce the
large PAPR by using the different techniques. Note that the PAPR reduction technique should
be chosen with awareness according to various system requirements.
Table 2. 1-Comparison of PAPR Reduction Techniques
Name of Schemes Name of parameters
Distortion
less
Power increases Data rate loss
Clipping and Filtering No No No
Coding Yes No Yes
Partial
Transmit Sequence(PTS)
Yes No
Yes
Selective Mapping (SLM) Yes No Yes
Interleaving Yes No Yes
Tone Reservation (TR) Yes Yes Yes
Tone Injection(TI) Yes Yes No
There are many issues to be considered before using the PAPR reduction techniques in a
digital communication system. These issues include PAPR reduction capacity, power
increase in transmit signal, BER increase at the receiver, loss in data rate, computational
complexity increase and so on. Simultaneously most of the techniques are not proficient to
obtain a large reduction in PAPR with low coding overhead, with low complexity, without
performance degradation and without transmitter and receiver symbol handshake.

Blekinge Institute of Technology (BTH), Sweden Page 30
2.10 Conclusion
OFDM is a promising technique for wireless communication systems although it has some
drawbacks which are given below:
High PAPR
Frequency offset
High PAPR is one of the major problems of OFDM system. There are several techniques to
reduce the PAPR in OFDM transmission system. All PAPR reduction techniques have some
advantages and disadvantages. These PAPR reduction techniques should be chosen carefully
for getting the desirable minimum PAPR. All PAPR reduction techniques are based on
particular situation of system. This section describes and summarizes several techniques of
PAPR and proposes repeated clipping and frequency domain filtering technique which is the
best solution for PAPR.

Blekinge Institute of Technology (BTH), Sweden Page 31
Chapter Three: Cognitive Radio
3.1 Introduction
Cognitive Radio (CR) is an intelligent wireless communication system that is self-aware of
its surrounding environment and identifies unused portion of radio spectrum on the basis of
observed spectrum usage and able to make decision itself and efficiently uses spectrum in a
dynamically adaptive way.
The demand of spectrum is increasing day by day. A CR is an emerging technology for the
efficient use of the spectrum. It can discover unused spectrum by spectrum sensing and can
adjust its transmission setting accordingly without causing interference to licensed users. The
inconsistency between allocation and use of spectrum leads to need for the development of
intelligent radios. The regulation and more flexible spectrum management techniques are
required to increase the efficient use of our natural spectrum resources.
The Federal Communication Commission (FCC) has started considering dynamic approaches
for spectrum sharing. The IEEE 802.22 standards have launched the process to use TV band
spectrum holes for enabling wide area Internet service. The IEEE 802.22 working group is
developing a standard for cognitive wireless regional area networks (WRAN) for use by
license-exempt devices on a non-interfering basis in spectrum that is allocated to the TV
Broadcast Service [24].
The CR has the ability to dynamically adjust its certain operating parameters (e.g. transmit
power, carrier frequency, and modulation strategy) in real-time, with two primary objects in
mind: to provide highly reliable communications and efficient utilization of the radio
spectrum.

Blekinge Institute of Technology (BTH), Sweden Page 32
3.2 The Features of CR
CRs enable a more efficient and flexible usage of spectrum. The Federal Communication
Commission FCC has been identified in [27] the following features of CRs as given below:
Frequency Agility: The radio is capable of modifying its operating frequency in
adapting to the environment.
Dynamic Frequency Selection (DFS): The Radio can sense signals from
neighboring transmitter to select a most desirable operation environment.
Adaptive Modulation: The transmission waveforms and characteristics can
automatic modulation adjustment to utilize for the usage of spectrum.
Transmit Power Control: It is adapted to full power limits when required on the one
side and to lower levels on the other hand to permit greater sharing of spectrum.
Location Awareness: The radio is capable to identify in its location. In the same
location, other devices operate using the same spectrum to make as effective use of
transmission parameters.
Negotiated Use: The CR can have algorithms for allowing the sharing of spectrum
usage. So, they must have some terms and conditions between a licensed and a third
party or an ad hoc in real time.

Blekinge Institute of Technology (BTH), Sweden Page 33
L
ow
m
ediu
m
H
igh
(matu
re)
(
Sta
te o
f th
e sh
elf)
(S
tate
of
the
art
)
3.3 The Evolution of Radio Technology
A CR is an extension of modern Software Defined Radio (SDR). The evolution of radio
technology is shown in Figure 3.1.
Software Software Software Aware Adaptive Cognitive
Capable Programmable Defined Radio Radio Radio
Radio Radio Radio
A SDR is a Communications device whose attributes and capabilities are developed and or
implemented in Software (Based on the FCC’s notice of Proposed Rule Making (NPRM)
8/12/2000).
Suo-SAS CSEL
MBMMR MBITR DMR
MIDDS Falcon PSC-5 ICNIA
Jaguar JIT NTDR
Leprechaun EPLRS PRC-117
LST-5 SINCGARS ASIP
VRC-99 Racal 25
ARC-220 ARC-210
ARC-164
PLRS
SINGARS WSC-3
Software-Capable Software Programmable Software Defined Cognitive Radio
Figure 3. 1-SDR intensity [28]
Increasing Technology/Software Maturity
Cognitive
Radio
JTRS

Blekinge Institute of Technology (BTH), Sweden Page 34
3.4 Software Defined Radio (SDR)
A Radio in which some or all of the physical layer functions are software defined is known as
Software Radio or Software Defined Radio (SDR). The term SDR was first proposed in 1991
by Joseph Mitola. SDR is considered as a wireless device that is fully controlled or
reconfigured by software [33].The first software radio technical paper was published at the
IEEE National Tele Systems Conference in the united state in 1992.The European
Commission sponsored the first International Workshop on Software Radio. The SDR
Forum, working in collaboration with IEEE group, has provided definition of SDR [54].
A radio is a one kind of electronic device that transmits or receives signal through the radio
frequency (RF).A radio frequency is a part of electromagnetic spectrum. Radio exits in many
items for instance; television, cell phones, vehicles, car door openers and computer.
Traditionally, Radio is hardware based radio device. It can only be possible to modify radio
through the physical intervention. On the other hand, A SDR permits multi-band, multi-mode
and multi-functional wireless devices that can perform in an efficient way and comparatively
inexpensive.
A set of hardware and software technologies where all of the radio’s operating functions are
implemented through modifiable software or firmware operating on programmable
processing technologies. These sort of devices include field general purpose processors
(GPP), programmable System on Chip (SoC), programmable gate arrays (FPGA), digital
signal processors (DSP), or other application specific programmable processors. These
technologies provide a degree of freedom that allows new wireless features and capabilities
and can be enhanced using software upgrades to existing radio systems without requiring new
hardware devices.
All transmit or receive frequencies parameters are fixed in hardware based radio where
hardware design can’t be changed.
Example: A 800 MHz cellular phone can’t work in 1900 MHz PCS band without adding
additional hardware devices.
Example: A dual mode phone can operate in both the GSM and PCS worlds over both the US
and the EU frequency bands.
3.4.1 Benefits of SDR
An SDR is an enabling technology in a wide range within wireless communication systems.
To replace as many analog components and digital VLSI devices of the transceiver as
possible with programmable devices is the main goal of SDR. Benefits of SDR are given
below [33]:
Flexibility and Adaptability.
Subscriber: easy international roaming, more flexible and improved services.
Mobile network operator: provided adds value services.

Blekinge Institute of Technology (BTH), Sweden Page 35
SDR
Handset and base station manufacturers: increase production flexibility and new scale
of economies.
Flexibility means able to change modulation and to switch the channel depending on its
surrounding environment. Adaptability means having capable of adaptation. SDR can adapt
itself according to the parameters information.
3.4.2 Relationship between SDR and CR
The most popular definition of CR and SDR that is aware of its environment, internal state
and location, and autonomously adjust its operation to achieved designed objectives. There is
one simple conceptual method that represents the relation between SDR and CR as shown in
Figure 3.2.
Cognitive Radio
Figure 3. 2 -The relationship of SDR and CR [10]
Cognitive engine is responsible for controlling the SDR based on parameters learned from
environment. Cognitive engine is always alert to the radios’ hardware resources and
capabilities.
Cognitive
Engine
Internal
and
External
Sensing
Upper Layer
Functionalities

Blekinge Institute of Technology (BTH), Sweden Page 36
Compared to hardware radio where radio can operate single or limited radio functionality.
The SDR creates software based digital signal processing with software tuneable Radio
Frequency (RF) components. Thus, SDR is capable of operating with different bandwidths
over wide range of frequencies and using many different modulations. As a consequence,
SDR can support multiple standards e.g. WCDMA, EDGE, GSM, CDMA2000, WiMAX,
Wi-Fi and multiple access technologies such as Code Division Multiple Access (CDMA),
Time Division Multiplexing (TDMA), Space Division Multiple Access (SDMA) and
Orthogonal Frequency Division Multiple Access (OFDMA). Sensing device needs to sense
the spectrum; Sensing is most important part of CR. Sensing devices can sense the spectrum
which can be implanted into SDR internally or externally. A SDR may have spectrum
analyzer which can provide spectrum information to cognitive engine [10].
3.4.3 Ideal SDR Architecture for CRs
The ideal architecture of SDR shown in Figure 3.3 consists of three main units which are
reconfigurable such as digital radio, software tunable radio along with fixed impedance
synthesizer, and software tunable antenna systems [36]. The reconfigurable digital radio
function is responsible to perform digital functionalities such as various waveforms
generation, antenna units and optimization algorithms for software tunable radio, and also
controls all units. Software tunable analog front-end system can’t perform digitally because
those are restricted such as RF filters, combiners/splitters, data converter, power amplifier
(PA) and Low Noise Amplifiers (LNA). Impedance synthesizer is a sub-system of this
scheme. Impedance synthesizer is a vital section to optimize the performance of software
tunable analog radio system. For example, the software tunable antenna system for a random
frequency plan is specified by cognitive engine. Depending on system requirements,
reconfigurable digital radio system monitors and controls the software tunable radio system
[10].
Figure 3. 3 -Ideal SDR architecture [10]
Antenna Control Signal
Feedback information
Radio Control Signal
Reconfigurable
Digital Radio
Software Tunable
Analog Radio
Impedance
Synthesizer

Blekinge Institute of Technology (BTH), Sweden Page 37
The key relationship between the main units of SDR is explained as follows. The cognitive
engine is crucial unit that transmits radio configuration parameters to reconfigurable digital
radio unit. As a result it can easily reconfigure the entire radio. The reconfigurable digital
radio unit can calculate some parameters such as location information of a specific user for
cognitive engine. The unit of reconfigurable digital radio can configure itself with antenna
systems and software tunable radio elements to optimize these unit performances. There is
feedback option which is utilized by reconfigurable digital radio unit from software tunable
radio (mainly impedance). The reconfigurable digital radio unit can adjust the parameters of
software tunable radio.
3.5 Spectrum Sensing
Spectrum Sensing is used to detect the under-utilized portion of spectrum. Spectrum sensing
is key object that makes possible to opportunistic spectrum access in CR networks. However,
spectrum sensing can give error result in the form of false alarm and misdetection.
The key object is to offer more spectrum opportunities to Secondary Users (SUs) without
causing any interference to the Primary Users (PUs). CR hardware should be able to detect
the vacant portion of the spectrum. The accurate sensing of the wireless spectrum is a key
challenge in realizing CR technology. The individual cognitive devices can sense the
environment and sent the sensing information to the base station. The base station has to
adapt a common set of channels that do not conflict with PU throughout its coverage area.
The necessity supports from the physical layer (PHY) of the CR architectures as well as
intelligent algorithms that are implemented in software. Various sensing techniques exist in
the literature are described in Section 3.5.1.1.
3.5.1 Different Techniques of Spectrum Sensing in CR
A CR be conscious about changes of the environment in which spectrum sensing plays
important role by identifying unused spectrum portions called spectrum ‘holes’ without
causing interference to the PU. Spectrum sensing plays important role in future wireless
communication systems to provide high performance services. The aims of CR are to enforce
the efficient use of resources as including spectrum, frequency, transmitted energy, and time.
Spectrum sensing has two important roles:
Firstly, sensing should provide guaranty of interference free communication for PU.
Secondly, it can indentify spectrum opportunistic for increasing capacity of cognitive
networks.
The detection should be very short time that can avoid weak signals in a noisy environment,
as result there will be very small probability of miss detection.

Blekinge Institute of Technology (BTH), Sweden Page 38
Usually, Spectrum sensing techniques can be classified into four groups:
Primary Transmitter detection
Cooperative detection
Primary receiver detection
Interference temperature management
3.5.1.1 Primary Transmitter Detection
Generally, Cognitive users do not have any real time interaction with primary transmitter and
receiver. They do not have prior information about PUs. So, the transmitter is to find out the
used and unused spectrum bands of CR users. CR users should have the capability to detect
the signal from the primary transmitter on the basis of local observation of CR users in shown
Figure 3.4. The basic hypothesis scheme of transmitter detection can be presents as follows:
, (3.1)
where, x(t) signal is received by the CR user. s(t) signal is the transmitted signal of primary
user, n(t) is a zero-mean Additive White Gaussian Noise (AWGN) and b is the amplitude
gain of the ideal channel. is a null hypothesis that represents no licensed user in a specific
spectrum. Conversely, is an alternative hypothesis that denotes there exits some signals
of PUs. These proposed systems are generally used for the transmitter detection: matched
filter, energy detection, and features detection.
Figure 3. 4 -Primary transmitter detection
No intersection
between CR user and
Primary Tx/Rx
Primary Transmitter
Primary
Transmitter
CR user must rely on locally sensed
signals from the Primary transmitter to
infer user activity to infer primary user
activity.

Blekinge Institute of Technology (BTH), Sweden Page 39
3.5.1.1.1 Matched Filter Detection
Matched filter is a filter that is obtained by correlating a known signal with an unknown
signal to detect the presence of AWGN. A known signal X(t)has an impulse response equal to
a conjugated time-reversed version of X(t).This filter can provide a maximum Signal to Noise
Ratio (SNR) output when a signal X(t) is AWGN. This matched filter is appropriate for
random signal when they have some periodically repeated elements. There are some
applications of matched filter to spectrum sensing in CR which includes the known elements
of ATSC, GSM, DTV, IS-54/136, 802.11a/g, OFDM, etc. The filter can be matched in GSM
system to 26-bit midamble (code) in the centre of each 156-bit traffic time slot. In EEE
802.11a/g standard, OFDM can be matched to the 127-bit repeated pilot subcarrier
synchronization sequence. The matched filter has some merits include simplicity, optimally
computational for AWGN. This filter has one serious demerit; it provides poor performance
in non-AWGN channels and sensitivity to deficient synchronization.
The matched filtering is an optimal way for detection of PU [36].A matched filter needs
demodulation of PUs signal that means a CR has a pre-knowledge of PU at both PHY and
MAC layers such as bandwidth, modulation, order, packet format, and pulse shape. This type
of information might be pre-stored in memory of CR. The most of PUs have preambles,
pilots, spreading codes, training sequences and synchronization words that can be used for
the coherent detection. The narrow band TV signal has pilots for audio and video carriers.
CDMA systems have devoted synchronization channels and spreading codes for pilots. In
OFDM system, it has preambles for packet acquisition.
The main advantage of matched filter is only samples to achieve detection error
probability constraints [37]. The main drawback of matched filter is that a CR needs special
receivers for every PU.
3.5.1.1.2 Energy Detection
Energy detector is a sub-optimal non coherent receiver. The energy detector is a sub-optimal
way for detecting the unknown signal. The energy detector is also known as periodogram or
radiometry. An energy detector can be implemented by averaging frequency bins of a Fast
Fourier Transform (FFT) like a spectrum analyzer as represented in Figure 3.5 [38].
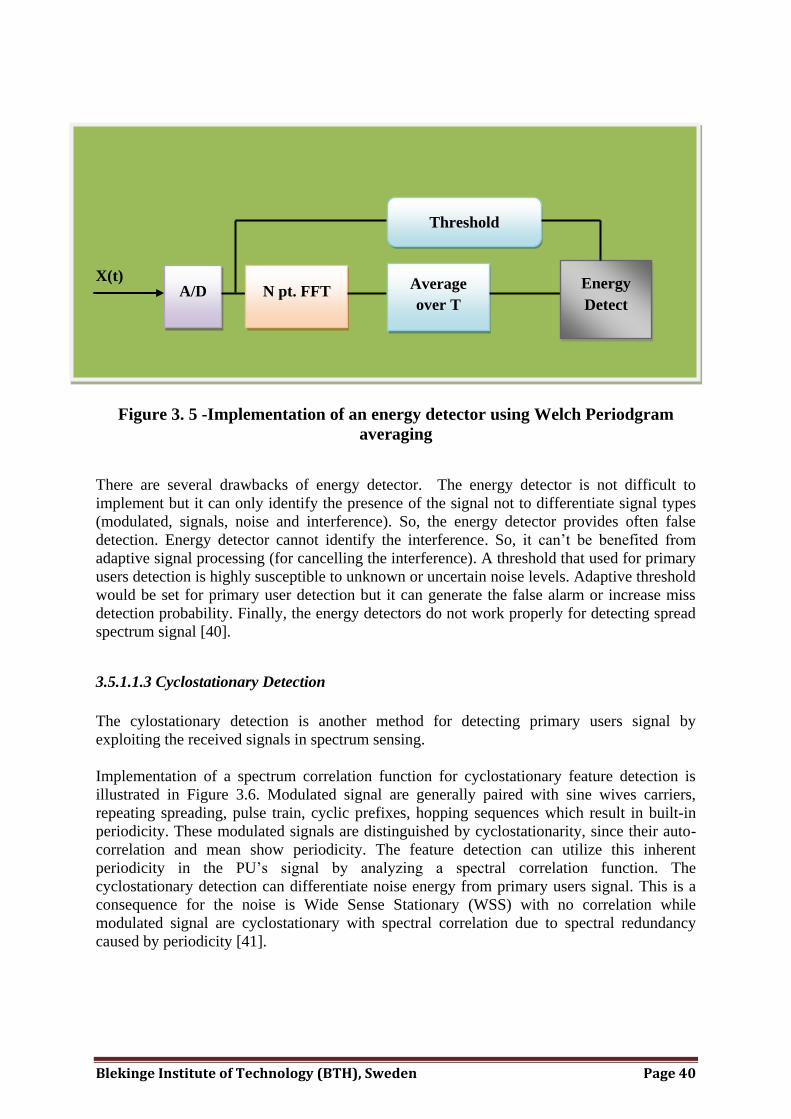
In this block diagram, processing gain is proportional to FFT size N and averaging time T.
When N increases, it improves the frequency resolution that helps in narrow band signal
detection. The noise power level is reduced by longer averaging time (T) which leads to
improve the SNR. However, the energy detector requires only samples to
achieve a detection error probability constraint.
Blekinge Institute of Technology (BTH), Sweden Page 40
X(t)
Figure 3. 5 -Implementation of an energy detector using Welch Periodgram
averaging
There are several drawbacks of energy detector. The energy detector is not difficult to
implement but it can only identify the presence of the signal not to differentiate signal types
(modulated, signals, noise and interference). So, the energy detector provides often false
detection. Energy detector cannot identify the interference. So, it can’t be benefited from
adaptive signal processing (for cancelling the interference). A threshold that used for primary
users detection is highly susceptible to unknown or uncertain noise levels. Adaptive threshold
would be set for primary user detection but it can generate the false alarm or increase miss
detection probability. Finally, the energy detectors do not work properly for detecting spread
spectrum signal [40].
3.5.1.1.3 Cyclostationary Detection
The cylostationary detection is another method for detecting primary users signal by
exploiting the received signals in spectrum sensing.
Implementation of a spectrum correlation function for cyclostationary feature detection is
illustrated in Figure 3.6. Modulated signal are generally paired with sine wives carriers,
repeating spreading, pulse train, cyclic prefixes, hopping sequences which result in built-in
periodicity. These modulated signals are distinguished by cyclostationarity, since their auto-
correlation and mean show periodicity. The feature detection can utilize this inherent
periodicity in the PU’s signal by analyzing a spectral correlation function. The
cyclostationary detection can differentiate noise energy from primary users signal. This is a
consequence for the noise is Wide Sense Stationary (WSS) with no correlation while
modulated signal are cyclostationary with spectral correlation due to spectral redundancy
caused by periodicity [41].
A/D N pt. FFT Average
over T
Energy
Detect
Threshold

Blekinge Institute of Technology (BTH), Sweden Page 41
X(t)
Figure 3. 6 -Implementation of a cyclostationary feature detector
The Cyclic Spectral Density (CSD) function of received signal as given below:
(3.2)
where,
Cyclic Auto-Correlation Function (CAF) is and α is
the cyclic frequency.
The key advantages of cyclostationary detection or feature detection is more robust to noise
uncertainty than an energy detector. This cyclostationary is also able to distinguish different
type of signals and abide false alarm caused by external signal such as those from
interference or other CR users.
Transmitter detection as matched filter detection, energy detection, and cyclostationary
feature detection are described and comparison is shown these different detection techniques
in Table 3.1.
A/D N. pt
FFT Correlate
Feature
Detect
Average
over T
Blekinge Institute of Technology (BTH), Sweden Page 42
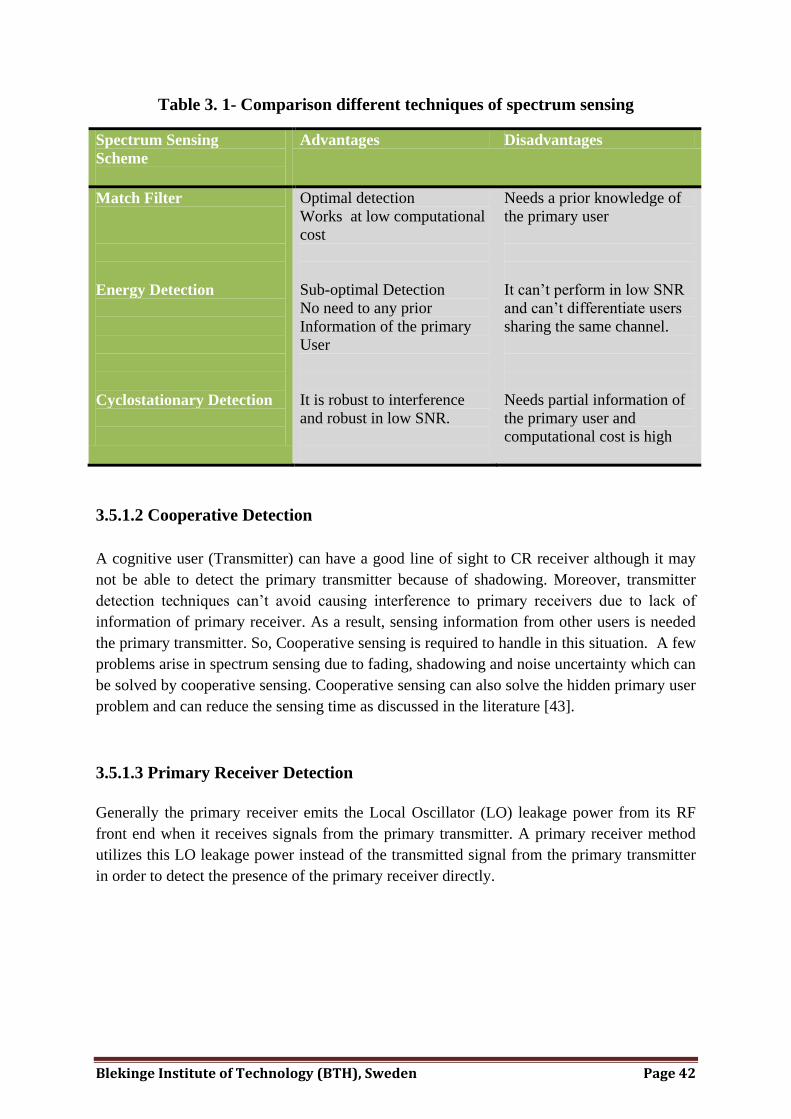
Table 3. 1- Comparison different techniques of spectrum sensing
Spectrum Sensing
Scheme
Advantages Disadvantages
Match Filter
Energy Detection
Cyclostationary Detection
Optimal detection
Works at low computational
cost
Sub-optimal Detection
No need to any prior
Information of the primary
User
It is robust to interference
and robust in low SNR.
Needs a prior knowledge of
the primary user
It can’t perform in low SNR
and can’t differentiate users
sharing the same channel.
Needs partial information of
the primary user and
computational cost is high
3.5.1.2 Cooperative Detection
A cognitive user (Transmitter) can have a good line of sight to CR receiver although it may
not be able to detect the primary transmitter because of shadowing. Moreover, transmitter
detection techniques can’t avoid causing interference to primary receivers due to lack of
information of primary receiver. As a result, sensing information from other users is needed
the primary transmitter. So, Cooperative sensing is required to handle in this situation. A few
problems arise in spectrum sensing due to fading, shadowing and noise uncertainty which can
be solved by cooperative sensing. Cooperative sensing can also solve the hidden primary user
problem and can reduce the sensing time as discussed in the literature [43].
3.5.1.3 Primary Receiver Detection
Generally the primary receiver emits the Local Oscillator (LO) leakage power from its RF
front end when it receives signals from the primary transmitter. A primary receiver method
utilizes this LO leakage power instead of the transmitted signal from the primary transmitter
in order to detect the presence of the primary receiver directly.

Blekinge Institute of Technology (BTH), Sweden Page 43
3.5.1.4 Interference Temperature Management
In 2003, the FCC has proposed the concept of ‘’Interference temperature’’ in order to
determine to RF interference. This model is designed to operate to the distance at which the
receive power approaches the level of noise floor. The noise floor is location specific
depending on the additional interfering signal. This model shows a recommended
interference temperature limit that is the amount of new interference which the primary
receiver can tolerate. The objective of spectrum sensing is best fitted by this proposed model
but the difficulties to properly determine the interference temperature. Naturally a CR is
aware of its transmitted power level and global positioning system and also knows it precise
location. A CR can compute the probability with the help of this information that its
transmission can cause significant interference to a neighboring receiver on the same
frequency.
Unfortunately, however, the interference temperature techniques may not give guarantee.
Actually there is no practical way for CR user to estimate or measure the interference
temperature because CR users have difficulties in differentiating the actual signals from the
PU and interference [44].

Blekinge Institute of Technology (BTH), Sweden Page 44
Chapter Four: OFDM Based Cognitive
Radio
4.1 Merits and Challenges for OFDM Based CR
The challenges of OFDM based cognitive radio (CR) can be grouped into three categories as
represented in Figure 4.1. The first category includes challenges are related to OFDM
systems including Peak-to-Average Power Ratio (PAPR), phase noise, synchronization and
sensitivity to frequency offset. The second category comprise of CRs, i.e. spectrum sensing,
cross layer adaptation and interference avoidance. Third category can be arising when OFDM
technique is employed by CR.
CR provides the tempting solution to spectral crowding problem by introducing the proper
opportunistic usage of frequency bands that are not heavily occupied by licensed user [45].
CR demands that the physical layer (PHY) should be adaptable and flexible. CR may
achieve this objective through the use of OFDM. OFDM has gained popularity and is used in
many current wireless communications system nowadays, e.g., Wireless Metropolitan Area
Network (WMAN), Wireless Local Area Network (WLAN), and Digital Video Broadcasting
(DVB) that is already proven as an adaptive, flexible and reliable transmission method. In
spite of this, identified challenges (adaptation, awareness, etc.) need to be researched further
to find firm solutions. It is predicted that OFDM will be an attractive PHY technology for CR
systems.
4.2 OFDM Based CR Architecture
The OFDM applications to CR bring new features and challenges to system design. An
OFDM based CR model is shown in Figure 4.2. The cognitive engine is the main unit of this
model. Basically, cognitive engine is an intellectual unit that is responsible for making the
intelligent decisions and configures the PHY parameters. The decision unit can identify the
spectral opportunities based on the information from policy engine through local and network
spectrum sensing data [10].
After that, policy engine gives information to the cognitive engine regarding to the present
policies to be measured depending on the system location. This makes sure that CR doesn’t
use unauthorized waveform or break any policies.
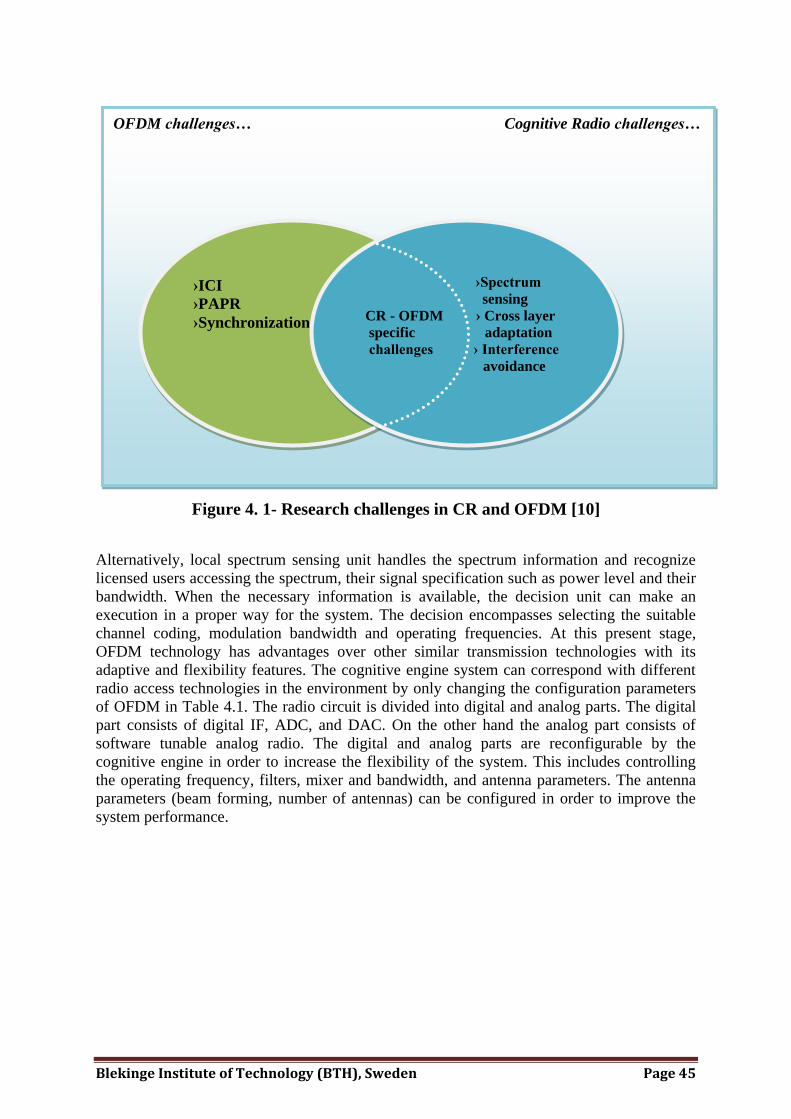
Blekinge Institute of Technology (BTH), Sweden Page 45
Figure 4. 1- Research challenges in CR and OFDM [10]
Alternatively, local spectrum sensing unit handles the spectrum information and recognize
licensed users accessing the spectrum, their signal specification such as power level and their
bandwidth. When the necessary information is available, the decision unit can make an
execution in a proper way for the system. The decision encompasses selecting the suitable
channel coding, modulation bandwidth and operating frequencies. At this present stage,
OFDM technology has advantages over other similar transmission technologies with its
adaptive and flexibility features. The cognitive engine system can correspond with different
radio access technologies in the environment by only changing the configuration parameters
of OFDM in Table 4.1. The radio circuit is divided into digital and analog parts. The digital
part consists of digital IF, ADC, and DAC. On the other hand the analog part consists of
software tunable analog radio. The digital and analog parts are reconfigurable by the
cognitive engine in order to increase the flexibility of the system. This includes controlling
the operating frequency, filters, mixer and bandwidth, and antenna parameters. The antenna
parameters (beam forming, number of antennas) can be configured in order to improve the
system performance.
OFDM challenges… Cognitive Radio challenges…
›ICI
›PAPR
›Synchronization
›Spectrum
sensing
CR - OFDM › Cross layer
specific adaptation
challenges › Interference
avoidance

Blekinge Institute of Technology (BTH), Sweden Page 46
Software Tunable Radio
Figure 4. 2- OFDM base CR system block diagram [10]
Table 4. 1- OFDM Based Wireless Standards
Standard
IEEE
802.11 (a/g)
IEEE
802.16 (d/e)
IEEE
802.22
DVB-T
FFT
Size
64
128, 256, 512,
1024, 2048
1024, 2048,
4096
2048, 8192
CP
Size
¼ 1/4, 1/8,
1/16, 1/32
Variable 1/4, 1/8
1/16, 1/32
Bit per symbol
1, 2, 4, 6 1, 2, 4, 6 2, 4, 6 2, 4, 6
Pilots
4 Variable 96, 192,
384
62, 245
Bandwidth
(MHz)
20 1.75 to 20 6, 7, 8 8
Multiple
Accessing
CSMA OFDMA
/TDMA
OFDMA
/TDMA
N/A
Local
Policies
Spectrum
Informat-
ion from
Network
Upper
Layers
PHY Layer
So
ftw
are
Tu
na
ble
an
alo
g R
ad
io
Coding S/P IFFT
Decoding Equalizer P/S FFT
Synch & channel
estimation
Digital
RF
DA
C
Digital
RF
Cognitive Engine
Policy Engine Decision Unit Local Spectrum
Sensing
AD
C
Radio

Blekinge Institute of Technology (BTH), Sweden Page 47
4.3 Proposed System
This work describes the OFDM based CR architecture’s block diagram. In order to reduce the
high peak power ratio by introducing repeated clipping and frequency domain filtering which
is demonstrated in Figure 4.3.
This thesis, we attempt to exploit previous channel information in Non-Contiguous OFDM
(NC-OFDM) based CRs under dynamic spectrum sharing environments. In the traditional
OFDM systems have base on the resource allocation problem such as the allocated
transmission spectrum is fixed. The spectrum is co-shared in the CR and the operating
bandwidth is not continuously fixed in frequency, time, and geographical domains. The
channel and power status will be tracked through this system and provided reliable feedback
from channel state information to the transmitter. In this thesis, we take NC-OFDM radio link
under a varying available bandwidth and maintain the SNRs of sub-channels under total
power constraints. We have adaptively chosen high PAPR reduction approach which are
clipping and filtering.
Figure 4. 3 -Proposed block diagram of NC-OFDM based CR
High PAPR brings disadvantages like an increased complexity of the analog to digital and
digital to analog converters and reduced efficiency of radio frequency (RF) power amplifier.
One of the uncomplicated and effective PAPR reduction techniques is clipping, which cancel
the signal components that exceed some unchanging amplitude called clip level. However,
clipping yields power distortion which called clipping noise.
Subcarrier ON/OFF information
Power and past channel status Channel and spectrum info. feedback
Input
Output
Null subcarried selection
Subcarrier ON/OFF information
Spectrum sensing measurement
ADC RF
frontend
Remove
CP
P
/
S
S
/
P
FFT Demod
Receiver
Transmitter
DAC ADD
CP Mod Clip
Filter
RF
frontend
P / S
S / P
IFFT

Blekinge Institute of Technology (BTH), Sweden Page 48
Clipping is a nonlinear process. It causes in-band noise distortion, which causes degradation
in the system performance and out-of-band noise, which decreases the spectral efficiency.
The clipping ratio is defined as the ratio of the clipping level to the root mean square value of
the unclipped signal which causes no distortion to the in-band power and rejects out-of-band
power of the signal. With the form of filtering, clip-and-filter operation causes some peak re-
growth. By using repeated clip-and-filter operations can be reduced the overall peak re-
growth. The clipping and filtering technique has discussed in details the Section 2.8.2.4.
Blekinge Institute of Technology (BTH), Sweden Page 49
Chapter Five: Channel Models
5.1 Introduction
The communications channel is the physical medium connecting the transmitter to receiver.
Wired telephone, wireless phones, optical fiber are examples of communication channels. An
accurate and appropriate modeling of the radio channel is crucial in order to predict the
performance of wireless radio systems. A narrow band model is based on predicted mean
signal level and some assumptions about the envelope fading statistics. The assumption is
necessary due to the limited bandwidth of the signal being sent through the channel. For this
reason, a narrow band channel is usually called flat fading channel. However, in wide band
channels, the signal fading caused by time dispersion varies as a function of frequency and
the channel model is usually called frequency selective fading.
Early Binary symmetric channel (BSC) model was described by Wozencraft and Jacobs in
1967. This channel was memory less channel. Bello presented a channel using a tapped delay
line representation that is based on knowledge of the correlation properties of the channel in
1963.
In the literature; Stein, Schwartz and Bennett used a deterministic characterization of the
channel and then introduced dynamics into the model to describe the time varying fading
channel in 1996 [47].
The modeling of channel has been continuing research to recent days. The modeling of the
multiple-input and multiple-output (MIMO) channel has attracted attention, because it offers
significant increases in data throughput without additional bandwidth or transmits power. In
this section we introduce the Additive White Gaussian Noise (AWGN) channel and Rayleigh
fading channel.
5.2 Additive White Gaussian Noise (AWGN) Channel
The simplest channel model in wireless commutations is the well known Additive White
Gaussian Noise (AWGN) model. The mathematical expression of the AWGN channel as
follows in Figure 7.1:
, (5.1)
where, X(t) is the transmitted signal and plus N(t) is the white Gaussian Noise.

Blekinge Institute of Technology (BTH), Sweden Page 50
Transmitted Signal Received Signal
X (t) Y (t) = X (t) + N (t)
Noise N (t)
Figure 5. 1- AWGN channel
AWGN channel is considered as an important reference or benchmark model for comparing
the performance evaluation of communication systems and modulation formats. However,
when the signal travels from transmitter to receive via multiple propagation paths then a
practical fading channel model must be used to model the propagation environment. There
are some factors affecting fading including multipath propagation, speed of surrounding
objects, speed of the mobile, the transmission symbol duration and the transmission
bandwidth of the signal.
5.3 Rayleigh fading channel
Multipath is the propagation phenomenon that results in radio signal reaching the receiver
antennas via multiple propagation paths. There are many causes of multipath fading including
atmospheric ducting, refraction, reflection from terrestrial objects such as buildings and
mountains, etc.
The most harmful fading channel is the Rayleigh fading model which was first introduced by
Bell Lab in 1970s. It is a statistical model of the communication channel to represent the
effects of a propagation environment on a radio signal. A statistical Rayleigh fading model is
the simplest fading channel model. A Rayleigh fading channel is viewed as a model when a
radio signal passes through communication channel that varies power of signal according to
Rayleigh distribution.
Note that when there is no dominant propagation along a Line-of-Sight (LOS) between
transmitter and receiver, Rayleigh fading is most applicable. Rician fading is more applicable
when there is a dominant LOS component.
Rayleigh fading model performs as reasonable channel model when there are many objects
(such as building and mountain) in the propagation environment which scatter the radio
signal before it arrives at the receiver.
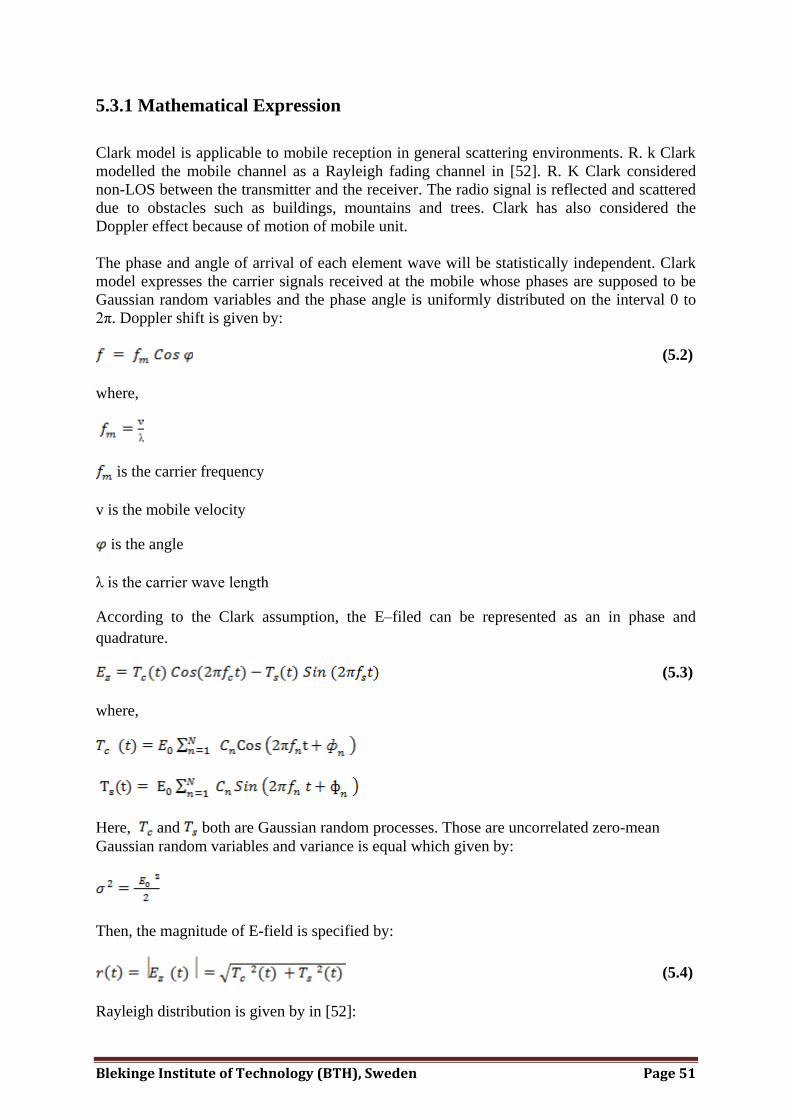
Blekinge Institute of Technology (BTH), Sweden Page 51
5.3.1 Mathematical Expression
Clark model is applicable to mobile reception in general scattering environments. R. k Clark
modelled the mobile channel as a Rayleigh fading channel in [52]. R. K Clark considered
non-LOS between the transmitter and the receiver. The radio signal is reflected and scattered
due to obstacles such as buildings, mountains and trees. Clark has also considered the
Doppler effect because of motion of mobile unit.
The phase and angle of arrival of each element wave will be statistically independent. Clark
model expresses the carrier signals received at the mobile whose phases are supposed to be
Gaussian random variables and the phase angle is uniformly distributed on the interval 0 to
2π. Doppler shift is given by:
(5.2)
where,
is the carrier frequency
v is the mobile velocity
is the angle
λ is the carrier wave length
According to the Clark assumption, the E–filed can be represented as an in phase and
quadrature.
(5.3)
where,
Here, and both are Gaussian random processes. Those are uncorrelated zero-mean
Gaussian random variables and variance is equal which given by:
Then, the magnitude of E-field is specified by:
(5.4)
Rayleigh distribution is given by in [52]:
Blekinge Institute of Technology (BTH), Sweden Page 52
, (5.5)
where, is the variance of the Rayleigh distributed variables.

Blekinge Institute of Technology (BTH), Sweden Page 53
Chapter Six: Simulation and Results
6.1 Introduction
This chapter is divided into two sections. The first section calculates peak-to-average power
ratio (PAPR) reduction and bit error rate (BER) for the single channel. The second section
calculates BER for different channels.
In the system, the following specifications are used for the PAPR reduction of OFDM:
Parameters of the simulation: bandwidth is 10 MHz, FFT/IFFT block is 256, and
clipping ratio is 4.
Three types of modulation schemas BPSK, QPSK, QAM16 used in simulations.
There are two types of channel models AWGN, Rayleigh fading used in simulations.
The three different outputs of the simulation are: reduction of PAPR, BER vs. SNR
for single channel (theoretical, without clipping, and with clipping), and BER vs. SNR
for two different channels.
6.2 Mathematical Definitions
The theoretical BER for BPSK or QPSK using AWGN channel:
, (6.1)
where, is spectral noise density and is energy per bit.
The theoretical BER for BPSK or QPSK using Rayleigh fading channel:
, (6.2)
where, is spectral noise density and is energy per bit.
The peak-to-average power ratio of OFDM, PAPR{s(t), τ} is given in equation 2.9.
where, s(t) is the signal and τ is the time interval.

Blekinge Institute of Technology (BTH), Sweden Page 54
A clipping method in its basic form is based on simple time domain signal limitation. Clipped
signal can be expressed by following relationship:
(6.3)
where, A is clipping level and Φ(t) is the phase of original signal s(t).
6.3 PAPR Reduction
Simulation results of PAPR reduction using different modulation techniques are given below
(Figure 6.1-6.3):
The complementary cumulative distribution function (CCDF) of the PAPR for the
transmitted signal are plotted in Figure 6.1, 6.2, and 6.3, where the PAPR technique being
employed by the iterated clipping and filtering. It is evident from these results that the PAPR
can be improved by using iterated clipping and filtering.
0 2 4 6 8 10 1210
-3
10-2
10-1
100
PAPR [dB]
CC
DF
PAPR reduction using BPSK
Original
First Iteration
Second Iteration
Third Iteration
Fourth Iteration
Figure 6. 1- PAPR reduction using BPSK with clipping and filtering

Blekinge Institute of Technology (BTH), Sweden Page 55
In Figure 6.1, by increasing PAPR, we observed that CCDF is 10-3
at 11.5 dB; but during
next iteration, same 10-3
is achieved at less PAPR, i.e., 10.05 dB. At fourth iteration, PAPR is
6.8 dB.
0 2 4 6 8 10 1210
-3
10-2
10-1
100
PAPR [dB]
CC
DF
PAPR reduction using QPSK
Original
First Iteration
Second Iteration
Third Iteration
Fourth Iteration
Figure 6. 2- PAPR reduction using QPSK with clipping and filtering
In the Figure 6.2, by increasing PAPR, we observed that CCDF is 10-3
at 10.8 dB; but during
next iteration, same 10-3
is achieved at less PAPR 9.95 dB. At fourth iteration, PAPR is 6.7
dB.

Blekinge Institute of Technology (BTH), Sweden Page 56
0 2 4 6 8 10 1210
-3
10-2
10-1
100
PAPR [dB]
CC
DF
PAPR reduction using QAM16
Original
First Iteration
Second Iteration
Third Iteration
Fourth Iteration
Figure 6. 3- PAPR reduction using QAM16 with clipping and filtering
In the Figure 6.3, by increasing PAPR, we observed that CCDF is 10-3
at 10.6 dB; but during
next iteration, same 10-3
is achieved at less PAPR 9.7 dB. At fourth iteration, PAPR is 6.65
dB.
In the system, repeated clipping and filtering significantly reduce PAPR, where modulation
schemas are BPSK, QPSK, and QAM16. PAPR of QAM16 is low compared to BPSK and
QPSK which gives better result can be as seen in Figure 6.3. According to the fourth
iteration, PAPR are given respectively 6.8, 6.7, and 6.65 dB for BPSK, QPSK, and QAM16.
Finally, it can be concluded that QAM16 is given better result compared to the BPSK and
QPSK.

Blekinge Institute of Technology (BTH), Sweden Page 57
6.4 BER calculation for AWGN channel
Simulation results of BER vs. SNR using BPSK and QPSK modulation techniques through
AWGN channel are given below (Figure 6.4-6.5):
0 5 10 1510
-5
10-4
10-3
10-2
10-1
100
SNR(dB)
BE
R
BER vs SNR using BPSK through AWGN channel
Theoretical
Without Clipping
With Clipping
Figure 6. 4- BER Vs SNR using BPSK through AWGN channel
Theoretical and without clipping curves are nearly same while with clipping gives worse
results in Figure 6.4. The results are given below:
BER= 10-3
at SNR ≈ 7 dB for theoretical and without clipping.
BER= 10-3
at SNR ≈ 11 dB with clipping.

Blekinge Institute of Technology (BTH), Sweden Page 58
0 5 10 1510
-5
10-4
10-3
10-2
10-1
100
SNR(dB)
BE
R
BER vs SNR using QPSK through AWGN channel
Theoretical
Without Clipping
With Clipping
Figure 6. 5- BER Vs SNR using QPSK through AWGN channel
Theoretical and without clipping curves are nearly same while with clipping gives worse
results in Figure 6.5. The results are given below:
BER= 10-3
at SNR ≈ 7 dB for theoretical and without clipping.
BER= 10-3
at SNR ≈ 11.5 dB with clipping.

Blekinge Institute of Technology (BTH), Sweden Page 59
6.5 BER calculation for Rayleigh fading channel
Simulation results of BER Vs SNR using BPSK and QPSK modulation techniques through
Rayleigh fading channel are given below (Figure 6.6-6.7):
0 5 10 15 20 2510
-5
10-4
10-3
10-2
10-1
100
SNR(dB)
BE
R
BER vs SNR using BPSK through Rayleigh fading channel
Theoretical
Without Clipping
With Clipping
Figure 6. 6- BER Vs SNR using BPSK through Rayleigh fading channel
Theoretical and without clipping curves are nearly same while with clipping gives worse
results in Figure 6.6. The results are given below:
BER= 10-2
at SNR ≈ 14 dB for theoretical and without clipping.
BER= 10-2
at SNR ≈ 17.5 dB with clipping.

Blekinge Institute of Technology (BTH), Sweden Page 60
0 5 10 15 20 2510
-5
10-4
10-3
10-2
10-1
100
SNR(dB)
BE
R
BER vs SNR using QPSK through Rayleigh fading channel
Theoretical
Without Clipping
With Clipping
Figure 6. 7- BER Vs SNR using QPSK through Rayleigh fading channel
Theoretical and without clipping curves are nearly same while with clipping gives worse
results in Figure 6.7. The results are given below:
BER= 10-2
at SNR ≈ 14 dB for theoretical and without clipping.
BER= 10-2
at SNR ≈ 20 dB with clipping.

Blekinge Institute of Technology (BTH), Sweden Page 61
6.6 BER calculation for Different channels
Simulation results of BER vs. SNR using BPSK and QPSK modulation techniques through
different channels are given below (Figure 6.8-6.9):
0 5 10 15 20 2510
-5
10-4
10-3
10-2
10-1
100
SNR(dB)
BE
R
BER vs SNR using BPSK through different channels (with clipping)
AWGN channel
Rayleigh fading channel
Figure 6. 8- BER Vs SNR using BPSK through two different channels
Rayleigh fading channel gives worst result compared to AWGN channel in Figure 6.8.
The results are given below:
BER= 10-2
at SNR ≈ 8.5 dB for AWGN channel.
BER= 10-2
at SNR ≈ 17.5 dB for Rayleigh fading channel.
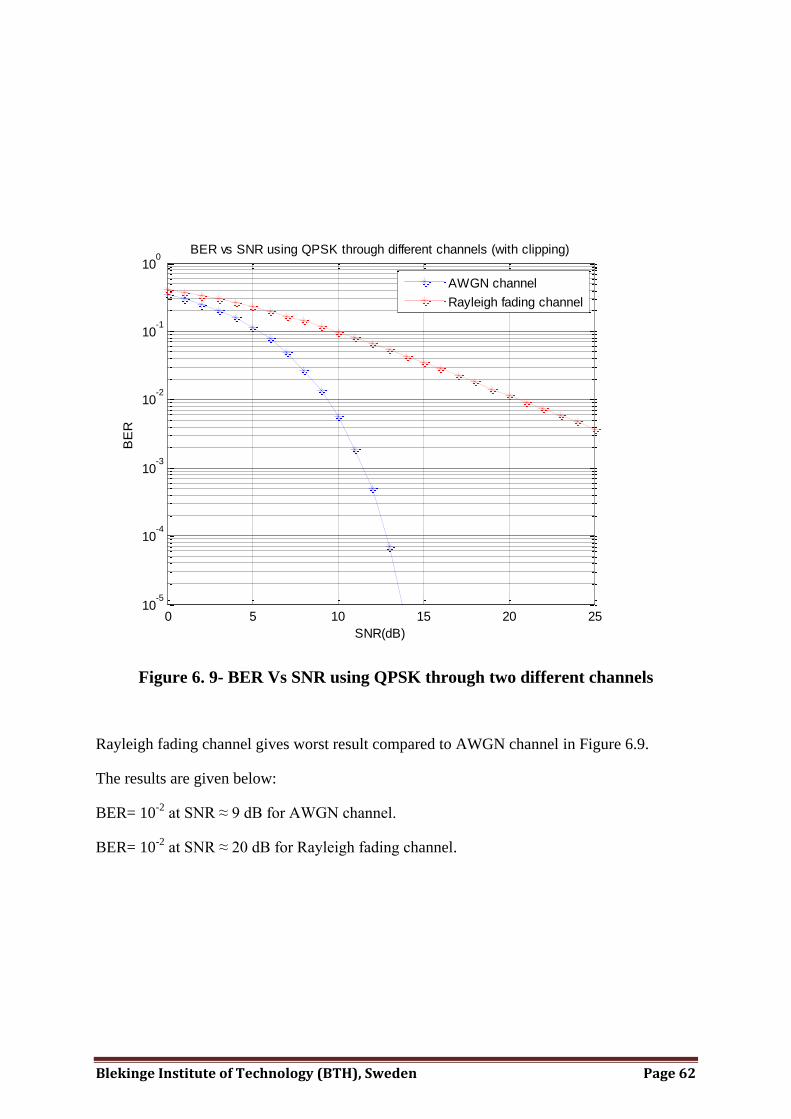
Blekinge Institute of Technology (BTH), Sweden Page 62
0 5 10 15 20 2510
-5
10-4
10-3
10-2
10-1
100
SNR(dB)
BE
R
BER vs SNR using QPSK through different channels (with clipping)
AWGN channel
Rayleigh fading channel
Figure 6. 9- BER Vs SNR using QPSK through two different channels
Rayleigh fading channel gives worst result compared to AWGN channel in Figure 6.9.
The results are given below:
BER= 10-2
at SNR ≈ 9 dB for AWGN channel.
BER= 10-2
at SNR ≈ 20 dB for Rayleigh fading channel.
Blekinge Institute of Technology (BTH), Sweden Page 63
Chapter Seven: Conclusion
This thesis presented an overview of Orthogonal Frequency Division
Multiplexing (OFDM) and Cognitive Radio (CR). For flexibility and
adaptability, the OFDM is an attractive candidate for CR systems. This
dissertation proposes a novel non-contiguous OFDM (NC-OFDM) technique,
where the implementation achieves high data rates of non-contiguous
subcarriers while simultaneously avoiding any interference to the
transmissions. The main goal of this thesis work was to investigate PAPR
reduction techniques for non-contiguous bands of OFDM based CR system.
Simulation results of PAPR reduction has shown that the performance of
QAM16 is good compared to others modulation schemes such as BPSK, QPSK.
According to the BER results, we need higher value of SNR to achieve the same
BER as compared to lower constellation modulation schemes.

Blekinge Institute of Technology (BTH), Sweden Page 64
References
[1] Wilkison, T. A. and Jones A. E., "Minimization of the Peak to mean Envelope Power Ratio of
Multicarrier Transmission Schemes by Block Coding," IEEE, Vehicular Conference, Vol.2, Jul.
1995.
[2] Jayalath, A. D. S. , and Tellambura C., "The use of Interleaving to Reduce the Peak to Average
Power Ratio of an OFDM Signals ," IEEE Global telecommunications conference, Vol.1, Nov.
2000.
[3] Loo, Kah Chenge, "Design of an OFDM transmitter and receiver using FPGA ," Master’s thesis,
University Teknologi, Malaysia.
[4] P. Bedell, Wireless Crash Course, Second Edition ed. McGraw Hill, March 2001.
[5] E. Phillip, "Adaptive Technique for Multiuser OFDM," PhD thesis, James Cook University,
Australia, 2001.
[6] L. D. Kabulepa, "OFDM Basics for Wireless Communications," Darmstadt University of
Technology.
[7] R. Prasad, OFDM for Wireless Communications System . Artech House, Inc., 2004.
[8] H. Rohling et al., "OFDM Air Interface for the 4th Generation of Mobile Communication
Systems," in Proc. 6th International OFDM Workshop, Hamburg, Germany, September 2000.
[9] F. Alam, "Space Time Processing for Third Generation CDMA Systems," Ph.D. dissertation,
Virginia Polytechnic Institute and State University, Blackburg, Virginia, November 2002.
[10] H. Arslan and T. Yäucek, Cognitive Radio, Software Defined Radio, and Adaptive Wireless
Systems. Springer, 2007.
[11] B. Farhang-Boroujeny, "Signal Processing Techniques for Spectrum Sensing and in Cognitive
Radios," Electrical and Computer Engineering Department, University of Utah Lecture, 2007.
[12] Ahn, H., Shin, Y. m and Im, S., "A Block Coding Scheme for Peak to Average Power Ratio
Reduction in an Orthogonal Frequency Division Multiplexing System ," IEEE Vehicular
Conference Proceedings, Vol.1, May 2000.
[13] Bauml , R. W. , Fischer, R. F. H. , and Huber, J. B., "Reducing the Peak to Average Power Ratio
of Multicarrier Modulation by Selective Mapping," IEEE Electronics Letters, Vol.32, Oct. 1996.

Blekinge Institute of Technology (BTH), Sweden Page 65
[14] Muller , S. H. , and Huber, J. B., "OFDM Reduced Peak to Average Power Ratio by optimum
combination of Partial Transmit Sequences," IEEE Electronics letters, Vol.33, Feb. 1997.
[15] J. Tellado-mourelo, "Peak to Average Power reduction of OFDM signals using Peak Reduction
Carriers," James Cook University Signal Processing Research, 22-25 August, 1999.
[16] A. Gatherer and M. Polley, "Controlling clipping probability in DMT transmission,” in Proc.
Asilomar Conference on Signals, Systems, and Computers , Pacific Grove, Calif, USA, , Vol.1, p.
578–584Nov. 1997.
[17] Van Nee, R. , and Wild, A., "Reducing the Peak to Average Power Ratio of OFDM," in IEEE
Vehicular Technology Conference, May 1998, Vol.3.
[18] Foomooljareon , P and Fernando, W. A. C., "Input Sequence Envelope Scaling in PAPR
Reduction of OFDM," in IEEE 5th International Symposium on Wireless Personal Multimedia
Communications, , Vol.1, Oct 2002.
[19] Tan, C. E. Wassell I. J., "Data bearing peak reduction carriers for OFDM systems," in IEEE
Proceedings of the 2003 Joint Conference of the Fourth International Conference of Information,
Communication Signal Processing and Fourth Pacific Rim Conference On Multimedia, , Vol.2, Dec
2003.
[20] Toshiyuki, Shigeru, Masaharu, and Junichiro, "Peak Reduction Improvement in Iterative Clipping
and Filtering with a Graded Band Limiting Filter for OFDM Transmission," IEICE Trans
Fundamentals, Vol.E90–A, No.7, 2007.
[21] Xiaodong Li and Leonard J. Cimini, "Effects of Clipping and Filtering on the Performance of
OFDM ," IEEE Communications Letters , Vol. 2, No. 5, May 1998.
[22] Masaki Ojima, and Takeshi Hattori, "PAPR Reduction Method using Clipping and Peak-
windowing in CI/OFDM System," Sophia University Journal, 2007.
[23] F. Communication, "Unlicensed Operation in the TV Broadcast bands," First Report and Order
and Notice of proposal Rulemaking, pp. 06-156, Oct. 2006.
[24] Stephen J. Shellhammer, "SPECTRUM SENSING IN IEEE 802.22", Qualcomm Inc. San Diego.
[25] F. C. Commission, "Spectrum Policy Task Force," Rep. ET Docket, pp. 02-135, Nov. 2002.
[26] S. Haykin, "Cognitive Radio: Brain-Empowered Wireless Communications ," IEEE Journal on
Selected Areas in Communications, Vol. 23, pp. 201-220, Feb. 2005.
[27] F. C. Commission, "Report and Order (FCC 05-57): Facilitating Opportunities for Flexible,
Efficient, and Reliable Spectrum Use Employing Cognitive Radio Technologies," ET Docket No.
03-108, 2005.

Blekinge Institute of Technology (BTH), Sweden Page 66
[28] J. Polson, "Cognitive Radio Applications in Software Defined Radio," in Prof. of the SDR 04
Technical Conference and Product Exposition, 2004.
[29] Joseph Wynn Mwangoka , Khaled Ben Letaief, Zhigang Cao," Robust End-to-End QoS
Maintenance in Non-Contiguous OFDM Based Cognitive Radios, " Hong Kong University of
Science and Technology, Clear Water Bay, Hong Kong, 2008.
[30] FCC, " Facilitating Opportunities for Flexible, Efficient, and Reliable Spectrum Use Employing
Cognitive Radio Technologies," pp. 03-108, 2003.
[31] Rakesh Rajbanshi, Alexander M. Wyglinski, Gary J. Minden, "Adaptive-Mode Peak-to-Average
Power Ratio Reduction Algorithm for OFDM-based Cognitive Radio," The University of Kansas,
2006.
[32] CSDR, "Software Defined Radio, Term, Trends and Perspective," Aalborg University White paper,
January, 2007.
[33] Sadiku, M. N. O. and Akujuobi, C. M., "Software Defined Radio: A brief overview," Potentials,
IEEE , Vol.23, No.4, pp. 14-15, Oct. 2000.
[34] B. Cetiner, H. Jafarkhani, J. Qian, H. Yoo, A. Grau, and F. De Flaviis., "Multifunctional
Reconfigurable Mems Integrated Antennas for Adaptive MIMO Systems," IEEE Commun. Mag.,
Vol. 42, No. 12, p. 62–70, Dec. 2004.
[35] S.H. Oh, J. T. Aberle, S. Anantharaman, K. Arai, H. L. Chong, and S. C. Koay, "Electronically
tunable antenna pair and novel rf front-end architecture for software-defined radios," EURASIP
J. Appl. Signal Process, p. 2701–2707, 2005.
[36] J. Proakis, Digital Communications, 3rd ed. Mc Graw Hil.
[37] A Sahai, N. Hoven, R. Tandra, "Some Fundamental Limits on Cognitive Radio," in Proc of
Alberton Conference, Monticello, 2004.
[38] A. V Oppenheim, R. W. Schafer, and J. R. Buck, Discrete-time Signal processing . Prentice Hall,
1999.
[39] A Sahai, N. Hoven, R. Tandra, "Some Fundamental Limits on Cognitive Radio," University of
California at Berkeley Wireless Foundations, EECS, February 11,2005.
[40] D. Cabric S. Mishra, and R. Brodersen, "Implementation issues in spectrum sensing for cognitive
radios," Asilomar Conf. on Signals, Systems and Computers, Pacific Grove, California, . Vol. 1,
p. 772–776, Nov. 2004.
[41] D. C. a. R. W. Brodersen, "Physical layer design issues unique to cognitive radio systems," IEEE
int. Symposium personal Indoor and Mobile Radio Commun, Sept.2005.

Blekinge Institute of Technology (BTH), Sweden Page 67
[42] Haijian ZHANG, Didier LE RUYET, Michel TERRE, "Spectral Correlation of multicarrier
Modulated signals and its application for signal detection," Electronics and Communications
Laboratory, CNAM.
[43] G. GENESAN and Y. Li, "Cooperative Spectrum Sensing in Cognitive Radio Networks," no. IEEE
Int. Symposium on New Frontiers in Dynamic Spectrum Access Networks, Baltimore, Maryland,
pp. 137-143, Nov. 2005.
[44] Yang Xiao and Fei Hu, Cognitive Radio Networks. CRC Press, NW, 2009.
[45] T. Yücek, "Channel, Spectrum, and Wave form Awareness in OFDM based Cognitive Radio
systems," Ph.D. Dissertation, University of south Florida, July, 2007.
[46] H. Anderson, Fixed Broadband Wireless System Design. The srtium, Sothern Gate, Chichester,
West sussex PO19 8SQ, England: John Wiley & Sons , March 2003 .
[47] J. D. Gibson, The Communications Hand book . Santa Barbara, USA: University of California, April
29, 2002.
[48] V. Erceg, K. V. S. Hari, M. S. Smith, D. S. Baum et al, "Channel Models for Fixed Wireless
Applications," IEEE 802.16.3 Task Group Contributions , 2001.
[49] Pedro Sebastiao, Fernando Jose Velez Rui Costa Daniel Robalo, Antonio Rodrigues, Planning
and Deployment of WiMAX Networks, Publish online ed. 26 August, 2009.
[50] J. Winters, "On the capacity of radio communication system with diversity in a Rayleigh fading
environment," Vol. SAC-5, no. IEEE journal on the selected areas in communication, pp. 87-88,
1987.
[51] S. Salous, "Multiple Input Multiple Output systems: Capacity and Channel measurements,"
department of electrical Engineering and Electronics, UMIST.
[52] R. H. Clarke, "A Statistical Theory of Mobile-Radio Reception," The Bell Systems Technical
Journal , Vol. 47, No. 6,pp. 957-1000, Jul. 1968.
[53] May T., and Rohling H., " Reducing The Peak to average Power Ratio on OFDM’’ ," radio
transmission systems, IEEE Vehicular Technology Conference, Vol.3.
[54] SDR forum,"Driving the future of radio communications and systems worldwide ," URL:http://
www.sdrforum.org.
[55] Wikipedia, The free encyclopedia, URL: http://en.wikipedia.org/wiki/Main_Page.