Embed Size (px)
Citation preview

Neuroelectrics White Paper (WP201307)
1
Starstim EEG monitoring during tDCS stimulation
Neuroelectrics White Paper WP201307
Author(s): L. Dubreuil-Vall, G. Ruffini
Released: Nov 17th 2013

Neuroelectrics White Paper (WP201307)
2
Starstim EEG monitoring during tDCS stimulation
Neuroelectrics White Paper WP201307 L. Dubreuil-Vall, G. Ruffini, Neuroelectrics Barcelona SL
In this short white paper we show that EEG signals can be recorded concurrent with tDCS
stimulation with Starstim using PISTIM electrodes. We also show that electrodes used for
stimulation can be used for PRE and POST stimulation comparisons.
Neuroelectrics PISTIM (“Pi”) electrodes1 rely on optimal electrochemistry for efficient, low noise current
transfer. In particular, they are superior to sponge electrodes in terms of induced electrical noise. See our
wiki for more information.
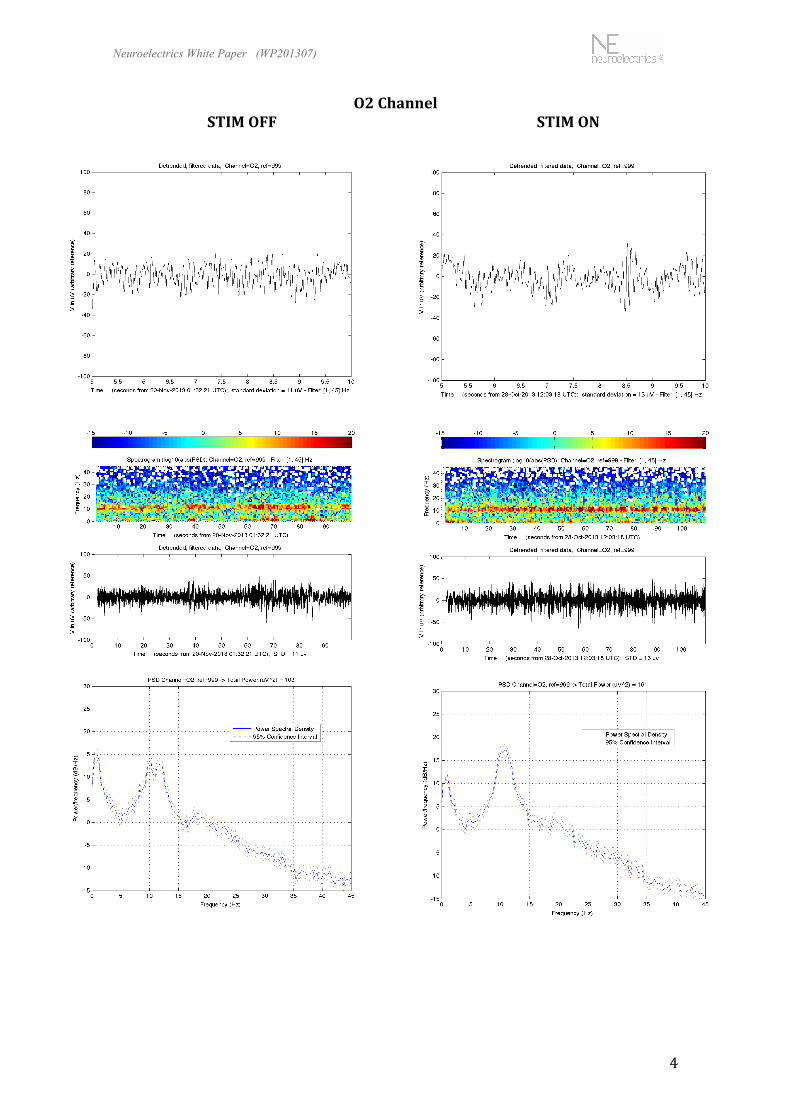
The first figures in the following pages display raw detrended data, spectrograms and the Power Spectral
Density functions of EEG signals from O1 and O2 positions recorded with tDCS stimulation ON and
OFF sessions. In all cases, 1 mA stimulation currents were delivered through electrodes F3 (cathodal) and
F4 (anodal).
We recall here that Starstim can measure EEG from all electrodes with stimulation OFF, and from
electrodes not used for stimulation during stimulation. PISTIM electrodes (gelled Ag/AgCl 3.14 cm2
electrodes) were used both for stimulation channels and EEG recording channels with CMS/DRL
electrodes placed in the left mastoid. All signals show a clear peak at 10 Hz corresponding to the alpha
waves of the subject, who remained with eyes closed during the whole protocol. Signals are filtered for
display from 1 to 45 Hz.
Comparisons between tDCS stimulation ON and OFF show that the quality of EEG signals at O1 and O2
during tDCS stimulation using “Pi” electrodes is very good and unaffected by the current injected through
the stimulation electrodes. We note, however, that some low frequency artifacts may be present in
electrodes very close to the stimulation electrodes, and that stimulation is typically electrically noisier
during the first minutes of a session, while conduction channels are established and impedance stabilizes.
In the last figures we show the spectrograms from the stimulation electrodes (F3 and F4) before and after
a stimulation session and see that although there is some leftover noise from electrochemical dynamics
returning to zero current equilibrium during the first minute, it decays rapidly.
1 The term Pi comes from the 1 cm radius of these electrodes, which thus provide a π cm2 (3.14 cm2) gel contact area with the skin. The gel used is SIGNAGEL Electrode Gel by Parker Labs.

Neuroelectrics White Paper (WP201307)
3
O1 Channel STIM OFF STIM ON
Neuroelectrics White Paper (WP201307)
4
O2 Channel STIM OFF STIM ON

Neuroelectrics White Paper (WP201307)
5
EEG data collected with stimulation OFF (top) and ON (bottom) with 2-15 Hz filtering. Reference is a global average (F3 and F4 electrodes used for stimulation).

Neuroelectrics White Paper (WP201307)
6
EEG data collected with stimulation OFF from the stimulation electrode F3 (cathode) before (top) and after (bottom) stimulation. Some low frequency noise is apparent after stimulation during the first 50s.

Neuroelectrics White Paper (WP201307)
7
EEG data collected with stimulation OFF from the stimulation electrode F4 (anode) before (top) and after (bottom) stimulation. Some low frequency noise is apparent after stimulation during the first 50s.


![NSF Project EEG CIRCUIT DESIGN. Micro-Power EEG Acquisition SoC[10] Electrode circuit EEG sensing Interference](https://img.dokumen.tips/doc/110x75/56649cfb5503460f949ccecd/nsf-project-eeg-circuit-design-micro-power-eeg-acquisition-soc10-electrode.jpg)