Embed Size (px)
Citation preview

- -
I ORNL-6433
OAK RIDGE NATIONAL LABORATORY Energy Use and Fuel Substitution
in Economic Development: What Happened in Developed Countries
and What Might be Expected in Develuping Countries?
Donald 'A. Jones
OPERATED BY
MARTIN MARIETTA ENERGY SYSTEMS, INC. FOR THE UNITED STATES DEPARTMENT OF ENERGY

Printed in the United States of America. Available from National Technical Information Service
U.S. Department of Commerce 5285 Port Royal Road, Springfield, Virginia 22161
NTIS price codes--Printed Copy: A04; Microfiche A01
This report was preparel as an arcount of work sponsored by an agency of the United States Government. Neither the United States Government nor any agency thereof, nor any of their employees, makes any warranty, express or implied, or assumes any legal liability cr responsibility for the accuracy, completeness, or usefulness of any information, apparatus, product, or process disclosed, or represents that i's use vould not infringe privately owned rights. Reference herein to any specific commercial piodu(;t, process, or.,;ervice by trade name, trademark, manufacture., or otherwise, does not necessarily constitute or imply its endorsement, recommendation, or favoring by the United StatesGovernment or any agency thereof. The views ano opinions of authors expressed herein do not necessarily state or rellect those of the United States Governmqnt or any agency thereof.
ORNL-6433
ENERGY USE AND FUEL SUBSTITUTION IN ECONOMIC DEVELOPMENT: WHAT HAPPENED IN DEVELOPED COUNTRIES AND WHAT MIGHT BE EXPECTED IN DEVELOPING COUNTRIES?
Donald W. Jones Energy Division
Oak Ridge National Laboratory
Date Published: August 1988
Prepared for the Office of Energy, Bureau for Science and Technology, @oh /
U.S. Agency for International Development, under contract No. BST-5728-P-ER-4257-01,
under Interagency Agreement DOE No. 1637-1637-Al, as part of the Energy Policy Development and Conservation
Proj ect
Prepared by the Oak Ridge National Laboratory Oak Ridge, Tennessee 37831
operated by Martin Marietta Energy Systems, Inc. /KJ-J
U.S. DEPARTMENT OF ENERGY under Contract No. DE-AC05-84OR21400

PREFACE
Jayant Sathaye of Lawrence Berkeley Laboratory invited me to give a paper on long-term structural changes in energy use, based on work I have done for the Office of Energy (S&T/EY) of the U.S. Agency for International Development, at the Ninth International Meeting of the International Association of Energy Economists in Calgary in July 1987. This report is an outgrowth of that paper.
iii

TABLE OF CONTENTS
PREFACE . . . . . . . . . . . . . . . . . . . . . . . . . . . . . .
LIST OF TABLES .......... .......................... vi
LIST OF FIGURES .......... .......................... vii
ABSTRACT ........... ............................. ix
1. INTRODUCTION .......... .......................... 1
2. ENERGY USE IN THE UNITED STATES, 1800-1982 ..... ........... 9 2.1 SECTORAL TRENDS IN AMERICAN ENERGY CONSUMPTION ... ....... 9 2.2 WOOD USE IN THE UNITED STATES ..... .............. 17 2.3 HOUSEHOLD FUEL USE ........ ..................... . 19 2.4 ELECTRICITY USE ......... ...................... 21 2.5 TRANSPORTATION DEVELOPMENTS ...... ................ 25
3. COAL AND THE HOUSEHOLD SECTOR IN THE NINETEENTH CENTURY U.K. 29
4. ENERGY USE PROFILES IN CURRENTLY DEVELOPED AND DEVELOPING COUNTRIES .................... 35 4.1 SECTORAL ENERGY DEMANDS ...... .................. 35
4.1.1 Residential Energy Use ..... ............... ... 35 4.1.2 Industrial Energy Use ...... ................... 38 4.1.3 Transportation Energy Use ..... ................. 40
4.2 ELECTRICITY CONSUMPTION ....... .................. 44
5. CONCLUSION: DEVELOPING COUNTRY ENERGY PROBLEMS AND PROSPECTS 51
REFERENCES ........... ............................ 55
v

LIST OF TABLES
Table
1 Sectoral Energy Shares, United States, 1800-1982 .... ........ 10
2 Changes in Energy Technical Efficiency Components, United States, 1800-1947 ....... ................... . .11
3 Sectoral Energy Consumption, United States, 1947-1982 .. ..... 14
4 Sources of Primary Energy, United States, 1870-1950 .......... 15
5 Fuel Shares in the United States, 1880 .... ............. ... 18
6 Families Using Particular Domestic Heating Fuels in the United States, 1880-1940 ....... ................... ... 20
7 Penetration of Central Heating in U.S. Households, 1900-1970 ............. .......................... 21
8 Lighting Sources in American Households,
1900-1970 ........... .......................... .. 23
9 Electricity Prices (cents/kWh),United States, 1902-1970 .... 24
10 Electricity Share of U.S. Household Energy Consumption, .. .... 24
11 Electric Appliance Penetration, United States,1900-1970 .... 25
12 Animal Energy Shares, United States, 1850-1940 . ....... 27
13 Residential Energy Shares ....... ................... ... 36
14 Industrial Energy Shares ........ .................... .. 39
15 Transportation Energy Shares ....... ..................... 41
16 Characteristics of Electricity Consumption ..... ........... 45
17 U.K. Electricity Cinsumption Shares, 1895-1982 (percents) 48
vi

LIST OF FIGURES
Figure
1 Energy Consumption Per Unit of GNP, Excluding Wood, United States, 1880-1950 ..... .................... 3
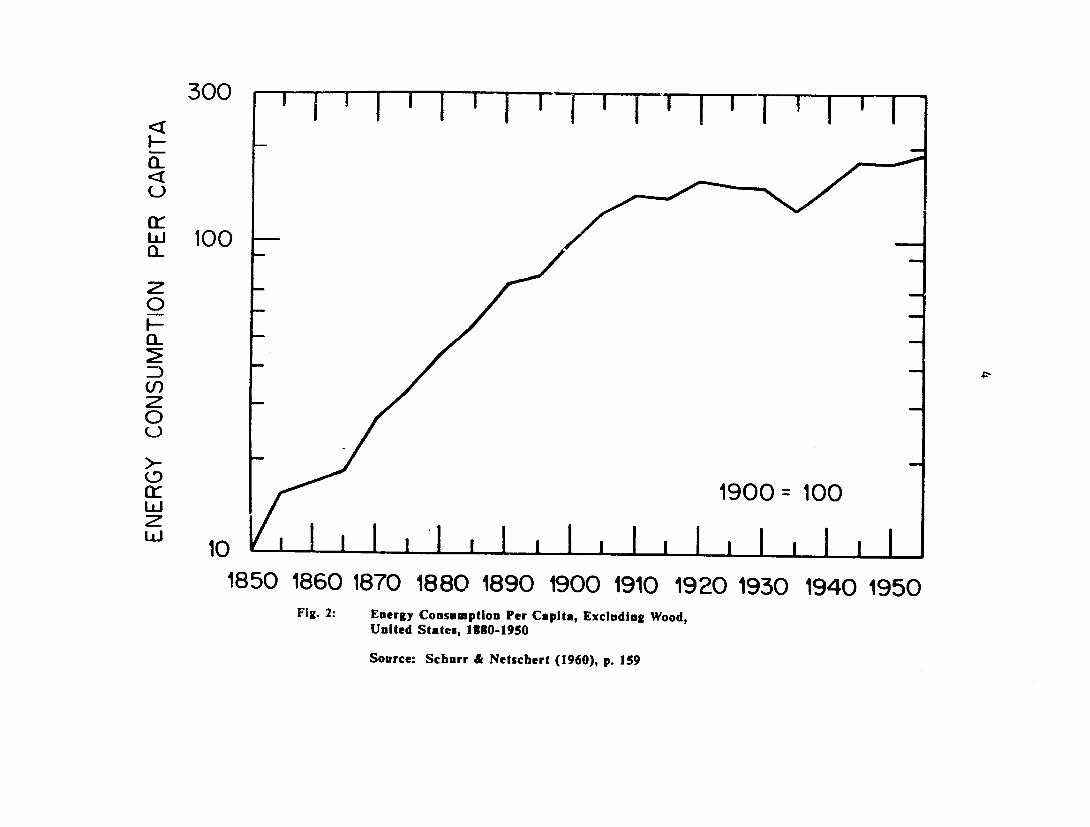
2 Energy Consumption Per Capita, Excluding Wood, United States, 1880-1950 ........ ................. 4
3 Energy-Output Trends, Excluding Traditional Energy Sources in the United States, The United Kingdom, and Italy ............ ......................... 5
4 Energy Consumption Per Unit of GNP, Including Wood, United States, 1880-1950 ........ ................. 6
5 Energy Consumption Per Capita, Including Wood, United States, 1880-1950 ..... .................... 7
6 Putnam's and Dewhurst's Estimates of the Fraction of Energy Used for Work, United States 1850-1950 ..... . 13
7 Residential Share of United States Electricity Consumption, 1912-1982 ...... .................. . 22
8 Energy Per Capita and Energy/Income Ratio, United Kingdom, 1800-1914 ..... ................ . 32
vii

ABSTRACT
Many ideas about changes in energy use that developing countries may experience are based on beliefs about historical changes in energy use in the developed countries. However, some of these common beliefs warrant re-examination. This paper begins with such re-examination ofa developed countries' historical experiences with structural changes in energy sources and uses, in aggregate terms and, where possible, on sector- and fuel-specific bases. It then draws together comparable evidence on developing countries in an effort to assess similarities and differences in situations and experiences. Particular attention is paid to evidence of fuel substitution in the household sector, which is especially important in developing countries but has received relatively scant attention in historical studies of the developed countries. The practice of omitting wood energy from measures of the energy intensity of output, on the grounds that most wood energy is used in the household sector and that including it distorts the impression given of changes in productive energy intensity, may be a reasonable simplification for some purposes, but it may distort the insights that developed country experience can offer for current, developing country prospects.
A major difference between the experiences of the industrialized and developing countries is that in the former, the mechanization and energization of transportation parallelled or followed the mechanization and energization of industry, while the reverse generally is the case in today's developing countries. High energy intensity, low productivity transportation sectors may be serious drags on the macroeconomies of developing countries. Similarly, residential, relative to industrial, electrification has proceeded more rapidly in today's developing countries than it did in the industrialized countries, with detrimental financial and system reliability results. The household sectors of the industrialized countries used energy primarily for space heating, while those of the developing countries use energy mostly for cooking. Fuel substitutions and technological changes assistedin heating systems in the shift in energy consumption from the residential to the industrial sector in the industrialized countries. Fuel substitution can assist in that shift in the developing countries, but how much technological change in cooking systems can contribute is unclear. Substitution between traditional and modern fuels in the household sector, historically in the industrialized countries and presently in the developing countries, as well as the continued substantial claim of the household sector on modern fuels in the industrialized countries, require the inclusion nf traditional fuels in meaningful measures of aggregate energy intensity such as energy-GNP ratios.
ix
1. INTRODUCTION
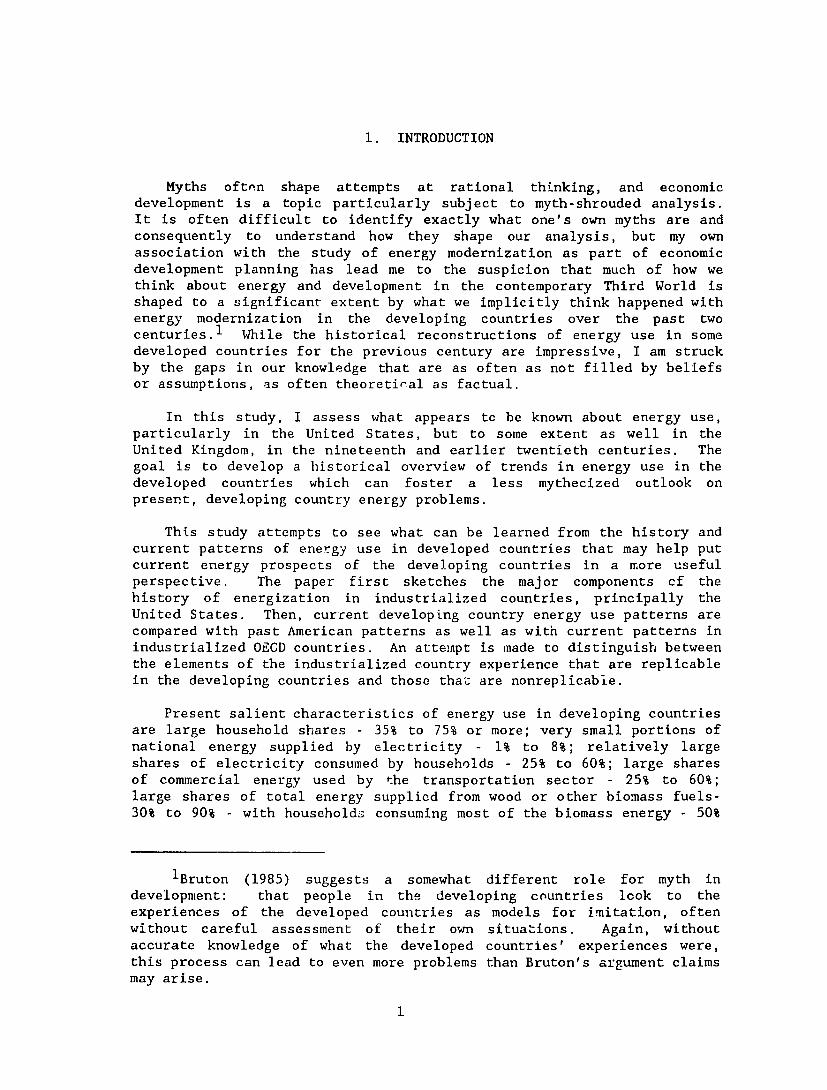
Myths oftnn shape attempts at rational thinking, and economic development is a topic particularly subject to myth-shrouded analysis. It is often difficult to identify exactly what one's own myths are and consequently to understand how they shape our analysis, but my own association with the study of energy modernization as part of economic development planning has lead me to the suspicion that much of how we think about energy and development in the contemporary Third World is shaped to a significant extent by what we implicitly think happened with energy modernization in the developing countries over the past two centuries.1 While the historical reconstructions of energy use in some developed countries for the previous century are impressive, I am struck by the gaps in our knowledge that are as often as not filled by beliefs or assumptions, as often theoretiral as factual.
In this study, I assess what appears to be known about energy use, particularly in the United States, but to some extent as well in the United Kingdom, in the nineteenth and earlier twentieth centuries. The goal is to develop a historical overview of trends in energy use in the developed countries which can foster a less mythecized outlook on present, developing country energy problems.
This study attempts to see what can be learned from the history and current patterns of energy use in developed countries that may help put current energy prospects of the developing countries in a more useful perspective. The paper first sketches the major components cf the history of energization in industrialized countries, principally the United States. Then, current developing country energy use patterns are compared with past American patterns as well as with current patterns in industrialized OECD countries. An attempt is made to distinguish between the elements of the industrialized country experience that are replicable in the developing countries and those that are nonreplicable.
Present salient characteristics of energy use in developing countries are large household shares - 35% to 75% or more; very small portions of national energy supplied by electricity - 1% to 8%; relatively large shares of electricity consumed by households - 25% to 60%; large shares of commercial energy used by the transportation sector - 25% to 60%; large shares of total energy supplicd from wood or other biomass fuels30% to 90% - with households consuming most of the biomass energy - 50%
IBruton (1985) suggests a somewhat different role for myth in development: that people in the developing countries look to the experiences of the developed countries as models for imitation, often without careful assessment of their own situations. Again, without accurate knowledge of what the developed countries' experiences were, this process can lead to even more problems than Bruton's argument claims may arise.
1

2
to 99%: and industrial energy consumption of 25% to 50% of non-biomass energy.
Turning to present, developed country characteristics, we find much smaller household consumption shares 15% to 27%; modest shares of national energy supplied by electricity - 12% to 20% - with about 25% to 35% consumed by households; 20% to 35% of energy consumed by the transportation sector; 30% to 40% of energy consumed by industry; and negligible consumption of biomass fuels.
There are some obvious differences in energy use between the two groups of countries which are important, and there are some apparent similarities which mask equally important differences. An obvious Intervening difference between the two groups of countries themselves is the average level of development, and to implore the implications of developmental differences, some information is presented on developed country energy use over the past one hundred to one hundred fifty years, principally but not exclusively from the United States.
As a motivation for studying these differences in energy use patterns and the forces underlying then, consider the familiar diagrams of American energy use per unit of output and per capiLa irom 185O to 1950 prepared by Schurr and Netschert (1960), reproduced in Figures 1 and 2, and similar diagrams for Britain and Italy prepared by Proops (1984), reproduced in Figure 3. Their messages yield ready, apocalyptic projections. The best news is that energy use per unit of output eventually declines. The bad news is that it may first increase roughly three-fold over a period of about fifty years. The really bad news is that overali consumption per capita rises continually and energy consumption per capita might rise consequently by as much as fifteenfold over a fifty-year period. These diagrams include only modern energy. Less attention has been paid to Schurr und Netschert's parallel diagrams that include wood. Figures 4 and 5 reproduce those diagrams and show the total energy consumption per unit of output rising by something less than twenty percent before beginning a substantial decline, and energy consumption per capita rising a little less than two-fold.
Schurr (1983) has made an argument for the greater relevance of the story told by the diagrams that c:-clude wood. Most of the wood use was in the household sector rather than in sectors that contributed directly to GNP, and Schurr contends that inclusion of wood fuels in aggregate energy measures consequently distorts the meaning of energy intensity measures for production. There iE the additional, glaring fact that even if the substitution of modern energy for wood fuels in developing countries damps the overall net increase in total energy consumption, the purchase, often the importation, of modern energy poses a major problem for national solvency. Cases can be made on both sides of Schurr's argument, but the fifty-year outlook for developing country energy demands is sobering, and the modern fuel import 1.'oblem is already upon many developing countries. Nevertheless, there are useful lessons in

150
z0
L 125
0--
D i00
a:
2 75
0) 50
z 5
2 25
1900 100"' o 100 I i
W0
1880 1890 1900 1910 1920 1930 1940 1950 Fig. 1: Energy Consumption Per Unit of GNP, Excluding Wood,
United States, 1880-1950
Source: Echurr & Netschert (1960), P. 159
300 I i I I i '
I-
Cr
w 100
z 0 a-
U)
0
Z -
1900: 100
1850 1860 1870 1880 1890 1900 1910 1920 1930 Fig. 2: Energy Consumption Per Capita, Excluding Wood,
United States, 1830-1950
Source: Schurr & Netschert (1960), p. 159
1940 1950

- 100
80TALY I
00 60
w1 u 40
w 20 1840 1870 1900 1930 1960 1980
YEARS
Fig. 3: Energy-Output Trends, Excluding Traditional Energy Sources in the United States, the United Kingdom and Italy, 1830-1975
Source: Proops (1984), p. 48

z
150
1._ 125
D
LLr
10 0
z 0
D
75
50 aa
0
>-oC w z
25
0 1900 -100
IL L IIII 1880 Fig. ,:
1890 1900 1910 1920 1930 1940 Energy Consumption Per Unit of GNP, Including Wood, United States, 1380-1950
Source: Schurr & Netschert (1960), p. 159
1950

0
<
C-)
_
IjJJ
e:::1900 =100
18,.0' 1860 1870 1880 1890 1900 1910 1920 19350 1940 1950 Fig. 5: Energy Consump:ion Per Capita, Including Wood, United States,
1880-1950
Source: Schurr & Netschert (1960), p.152

8
how the presently industrialized countries' energy use patterns developed and In the contrasts and similarities between those development paths and the experience of many present developing countries.
The next section presents information on past energy use patterns in the United States and discusses the evolution of present patterns. The second section discusses some aspects of British energy use in the past century and a half. The third section presents current profiles of national energy use in both developed and developing countries. Information from the first two sections is useful in interpreting the differences between the energy use patterns of the two groups of countries. A final section discusses prospects for the continued evolution of energy use patterns and practices in the developing countries.

2. ENERGY USE IN THE UNITED STATES, 1800-1982
Complete energy balances for the United States do not exist for periods before 1947. However, the literature contains evidence on energy use, of varying comprehensiveness, extending back to the early nineteenth century. In this section, I assemble secondary evidence on economy-wide energy sources and uses from 1800 to 2.982, as well as more disaggregated secondary evidence on particular topics. This section begins with a presentation of decennial estimates of energy use in the household and commercial sectors on the one hand and in the industrial and transportation sectors on the other from 1800 to 1982. This leads to a discussion of evidence on changing efficiency of three categories of energy use. Subsequently, four topics are treated in somewhat more detail: wood use, household fuel use, transportation, and electricity use.
2.1. SECTORAL TRENDS IN AMERICAN ENERGY CONSUMPTION
Detailed energy balances are available for the United States from 1970 to the present (OECD, 1984), and primary fuel allocation records are published back to 1947. Consequently, efforts to document energy use patterns and eventually construct new energy balances for the United States should be concentrated on the pre-1947 period. Two major, relatively unexplored, secondary sources treat pre-1947 energy use in the United States (Putnam, 1953; Dewhurst et al., 1955). The monumental work by Schurr and Netschert (1960) contains a wealth of information for the 1850-1950 period, but it is difficult to derive consistent, sectoral constunption estimates from it. However, Putnam and Dewhurst cover much of the same time period, and the structure of their efforts have several points of overlap, providing a cross check. Putnam divides energy uses into three categories -- comfort heat, process heat, and work -- and estimates efficiencies for each of the three categories for four time periods from contemporary engineering reports on energy efficiency. He also estimates the proportion of energy devoted to each of the three use categories for the period 1800 to 1950. Dewhurst enumerates thirteen categories of primary energy, including human and animal power, wind, and water as well as the mineral fuels and wood, decennially from 1850 through 1950. Additionally, he estimates the proportion of each energy source that was used for work in each decennial year. Each source produces the figure of 13 Quads for total primary energy use in 1950. Additionally, there is a third source on fuel use by sector for 1950, U.S. government data from the Minerals Yearbook (Bureau of the Census, 1975), which is useful Eor assessing the translation of Putnam's and Dewhurst's classification of energy uses into sectoral energy uses.
Not surprisingly, Dewhurst and Putnam differ on the share of energy used for work, and for the years of overlap, the differences provide a spread, rather than a point estimate, of sectoral energy use. More will be said about the differences between Putnam's and Dewhurst's energy use distribution estimates later in this section.
9
10
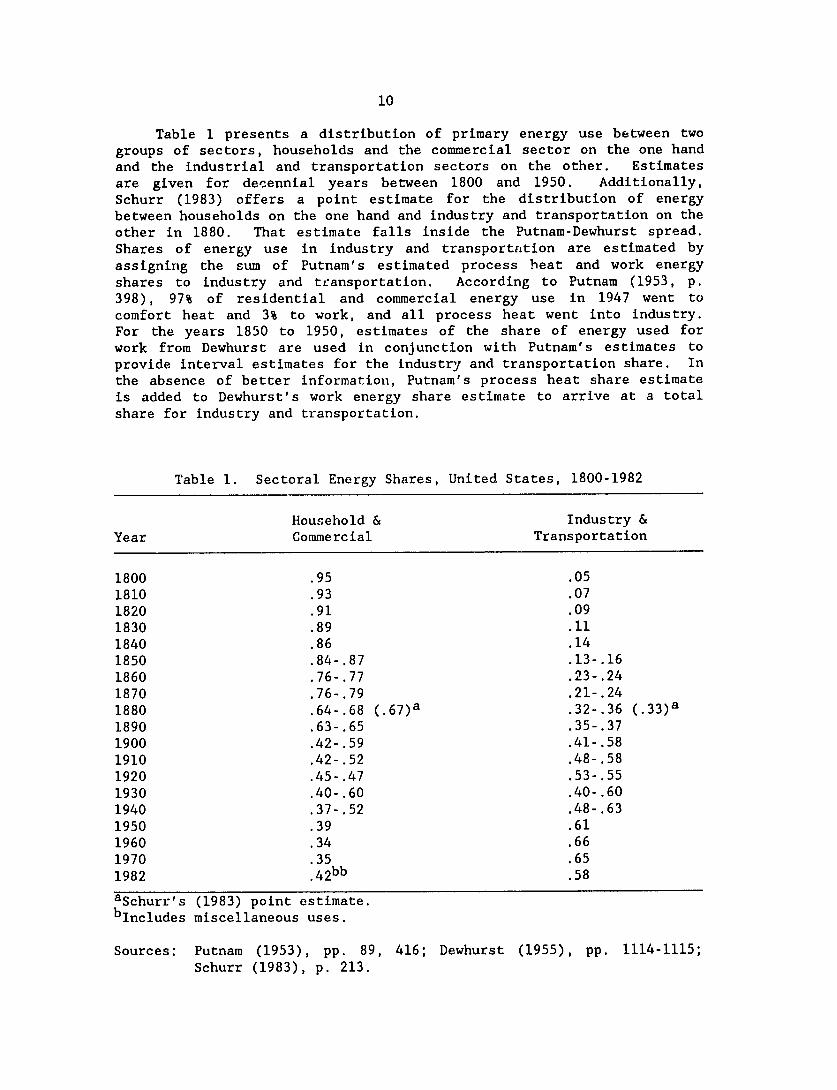
Table 1 presents a distribution of primary energy use between two
groups of sectors, households and the commercial sector on the one hand and the industrial and transportation sectors on the other. Estimates are given for decennial years between 1800 and 1950. Additionally,
Schurr (1983) offers a point estimate for the distribution of energy
between households on the one hand and industry and transportation on the other in 1880. That estimate falls inside the Putnam-Dewhurst spread.
Shares of energy use in industry and transportation are estimated by assigning the sum of Putnam's estimated process heat and work energy
shares to industry and transportation. According to Putnam (1953, p. 398), 97% of residential and commercial energy use in 1947 went to comfort heat and 3% to work, and all process heat went into industry.
For the years 1850 to 1950, estimates of the share of energy used for
work from Dewhurst are used in conjunction with Putnam's estimates to
provide interval estimates for the industry and transportation share. In
the absence of better information, Putnam's process heat share estimate
is added to Dewhurst's work energy share estimate to arrive at a total
share for industry and transportation.
Table 1. Sectoral Energy Shares, United States, 1800-1982
Household & Industry &
Year Commercial Transportation
1800 .95 .05
1810 .93 .07 1820 .91 .09
1830 .89 .11
1840 .86 .14 1850 .84-.87 .13-.16
1860 .76-.77 .23-.24
1870 .76-.79 .21-.24 1880 .64-.68 (.6 7)a .32- .36 (.3 3)a
1890 .63-.65 .35-.37 1900 .42-.59 .41-.58 1910 .42-.52 .48-.58 1920 .45-.47 .53-.55
1930 .40-.60 .40-.60 1940 .37-.52 .48- .63 1950 .39 .61
1960 .34 .66
1970 .35 .65 1982 .4 2bb .58
aSchurr's (1983) point estimate.
blncludes miscellaneous uses.
Sources: Putnam (1953), pp. 89, 416; Dewhurst (1955), pp. 1114-1115; Schurr (1983), p. 213.

11
The shares exhibit a continual shift from households and the commercial sector to industry and transportation, but there are three periods of particularly large shift -- an increase in the industry and transportation share of 50% or more: the 1850/60 decade, the 1870/80 decade, and the thirty-year period 1890-1920. It is possible that increase of the last period could have occurred primarily in the single decade 1890/1900, but the differences in the Putnam and Dewhurst estimates of the share of energy going to work do not permit more precise assessment. The decade 1850/60 saw the recovery from the depression and other economic difficulties of the period from 1836 through the late 1840s and the rapid penetration of steam-powered machinery without substantial increase in the engineering efficiency of work energy. (See Table 2 for estimated efficiencies in American energy use.) This was primarily a period of innovation rather than industrial boom.
Table 2. Changes in Energy Technical Efficiency Components, United States, 1800-1.947*
Efficiencies (%) Energy Distribution (%) Comfort Process Comfort Process Overall
Year heat heat Work heat heat Work efficiency
1800 8 7 1.75 95 5 <1 7.5** 1860 8.5 7.5 2 80 7 13 8 1900 20 11 3.5 59 10 31 14 1947 51 29.6 16.9 34.2 11.2 54.6 30
Source: Putnam (1953), Fig. 4-17, p. 89; Fig. 4-18, p. 90; pp. 416-419. *Efficiency is defined as "output at end-use from secondary sources" +
"input from primary sources" (Putnam, 1953, p. 415). **Putnam places an interval of ± 4 percentage points around the figure
(p. 418).
The 1870/80 decade witnessed major expansions in railroad traffic and indirect increases in the output of the iron and steel industry. Railroad freight traffic increased from 4.92 billion ton-miles in 1870 to 14.48 billion in 1880 (Bureau of the Census, 1975, p. 727), and miles of road operated increased from 53 thousand in 1870 to 93 thousand in 1880 (Bureau of the Census, 1975, p. 731). Bituminous coal was the principal fuel. The iron and steel industry boomed during this period, largely to supply the increased demands from the railroads. Total raw steel produced increased from 77 thousand short tons in 1870 to 1,397 thousand in 1880, and rail production increased from 620 thousand short tons to 1,462 thousand in the same period (Bureau of the Census, 1975, p. 694). The weight of locomotives increased during the decade, but work energy

12
efficiency may have improved by only some 25% to 30% over 1860 levels by that time (see Table 2). Process heat efficiency improved at roughly the same rate. At the same time, comfort heating efficiency improved by roughly 75% in the competing residential and commercial sectors. This period was characterized more by industrial expansion than major innovation.
The period from 1890 to 1920 was one of both industrial expansion and major innovation. Electrification was introduced on a large scale, and remained primarily a power source for manufacturing. Electricity rates were high in the early years of electrification, as high as 28 cents per kWh in the 1890s, precluding most residential use (Rybczynski, 1986, p. 153). Urban electric trains quickly swept away horse trams in the mid-1890s, although the truck did not begin to finish off intracity horse traffic until probably sometime in the second decade of the twentieth century. Truck registrations increased from 700 in 1904 to 10 thousand in 1910, to 1.1 million in 1920 (Bureau of the Census, 1975, p. 716). The innovations increased the demands for fuels from the industrial and transportation sectors rather than from either the residential or commercial sectors. Iron and steel production continued to expand rapidly during the period 1890 to 1910; railroad freight tonmiles nearly doubled between 1890 and 1900, and passenger m4.les doubled between 1900 and 1910.
The relatively wide intervals for 1930 and 1940 shares introduce the possibility that the industry and transportation shares could have declined during the 1930s and 1940s, and the estimates indicate at least a levelling off of the industry and transportation shares since the 1960s. The possibility of this nonmonotonic share behavior lies in the differences between Putnam's and Dewhurst's estimates of energy used for work. As Figure 6 shows, Putnam's estimated work energy shares climb steadily, while Dewhurst's, which were higher than Putnam's in the earlier decades, peak in 1910 and decline gradually thereafter. Unfortunately, neither source offers detailed reasoning behind its estimates of shares of energy used for work. Dewhurst frequently cites "judgement of experts" as well as conclusions based on census sources, while Putnam cites sources for efficiency estimates but not for energy use distribution estimates (Putnam, 1953, pp 417-420). Comparison of both sources' 1950 work share estimates with the published sectoral distribution of fuel. use for 1950 suggests that, at least in the later decades, Dewhurst's estimates are somewhat low and Putnam's are a bit high (see Table 3).
Table 4 preseiits Dewhurst's estimates of energy source shares and use shares by source from 1870 to 1950. The trends in work shares are of some interest themselves. The hydroelectric work share, which should parallel the work share for all electricity, declines steadily from its appearance in 1890, reflecting increasing use of electricity for lighting, probably in the commercial and residential sectors.

0.6
0 PUTNAM
0.5
U 0.4 0
S 0.4DEWHURST
0 0.3
fW
z AL 0.2 w 0.1
0O
n. 0.0 I
1850 1900 1950 2000
Fig. 6: Putnam's and Dewhurst's Estimates of the Fraction of Energy Used for Work, United States 1850-1950
Source: Putnam (1953), pp 89, 416; Dewhurst (1955), pp 1114-15

14
Table 3. Sectoral Energy Consumption, United States, 1947-1982
A. Consumption Shares of Fuel Resources, by Major Consumer Group,
1947 to 1970
Electricity Household & Generation,
Year Commercial Industry Transportation Utilities Misc.
1947 .205 .387 .266 .129 .012 1950 .223 .363 .253 .147 .014 1955 .216 .352 .247 .166 .018 1960 .228 .329 .243 .186 .015 1965 .222 .322 .228 .208 .010 1970 .207 .302 .244 .244 .003
Source: Historical Statistics of the United States, Colonial Times to 1970, Part 2 (1975), Series S 25-31, p. 819. Originally from Minerals Yearbook and Mineral Industry Surveys, annual issues.
B. Sectoral Consumption Shares of Primary Energy
Electricity Household & Generation,
Year Commercial Industry Transportation Utilities Misc.
1970 .257 .325 .232 .157 .029 1975 .234 .315 .249 .191 .011 1982 .218 .274 .250 .224 .034
Source: OECD (1984).
Simultaneously, the work share of petroleum rises. In 1880, some 85% of crude was refined as kerosene, which was used primarily as an illuminant. Fuel oil production expanded around 1905 and maintained a steady share around 50% until 1930. The gasoline share of petroleum began an expansion from around 10% of refined crude in 1910, to around 20% by 1920, and to around 40% by 1930, which was maintained through 1955 (Schurr and Netschert, 1960, pp 93-95). Correspondingly, Dewhurst's work share estimates for petroleum double between 1900 and 1910, increase by 50% between 1910 and 1920 and by nearly one-third between 1920 and 1930, reflecting che widespread introduction of the automobile. Dewhurst's 1950 work share for petroleum is 58%. The transportation sector, according to Putnam, devotes 99% of its energy to work, and the transportation sector consumed 55% of petroleum products in 1950 (Bureau of Mines, 1968, p. 75, Table 6). It is unclear from the Bureau of Mines source whether agricultural petroleum product uses are

_________________ _______________________ __________________________ ________________________
Table 4. Sources of Primary Energy, United States, 1870-1950
1870 1880 1890 1900 Fraction of Fraction ofT Fraction of Fraction of
Share by energy source Share by energy source Share by energy source Share by energy source Energy Source source devoted to source devoted to source devoted to source devoted to
work work work work
Wind .00075 1.000 .00060 1.00 .00042 1.00 .00032 1.00 Water Direct drive .00231 1.000 .00189 1.00 .00124 1.00 .00087 1.00 Hydroelectric 0 0 0 .00014 .71053 .00065 .68945 Coal .26368 .65501 .40452 .65136 .57009 .64023 .72072 .64702 Petroleum .00606 0 .03003 0 .03730 0 .03848 .14982 Natural gas 0 0 .00150 0 .03770 0 .02676 .01959 Fuelwood 72721 .04004 .56145 .02996 .35311 .02000 .21219 .01300
Total 1.00000 1.0000 1.00000 1.00000
1910 1920 1930 1940
Fraction of Fraction of Fraction of Fraction of Share by energy source Share by energy source Share by energy source Share by energy source
Energy Source source devoted to source devoted to source devoted to source devoted to work work work4 work
Wind .00019 1.00 .00013 1.00 .00010 1.00 .00004 1.00 Water Direct drive .00055 1.00 .00058 1.00 .00019 1.00 .00010 1.00 Hydroelectric .00132 .63990 .00351 .58008 .00557 .51999 .00740 .48346
Coal .78238 .58043 .73141 .49936 .59847 .40457 .50900 .32855 Petroleum .07338 .26991 .14781 .39004 .23941 .50998 .31122 .55002 Natural gas .03364 .10005 .04051 .14504 .09209 .18999 .11414 .23500 Fuelwood .10854 .00994 .07605 .00699 .06417 .00504 .05810 .00306
Total 1.00000 1.00000 1.00000 1.00000I

Energy Source
Wind
Water Direct drive Hydroelectric
Coal
Petroleum Natural gas Fuelwood
Total
Share by source
.00001
.00006
.01088
.38785
.36902
.20301
.02917
1.00000
Table 4. Sources of Primary Energy, United States, 1870-1950
(continued)
1950
Fraction of energy source devoted to
work
1.00
1.00 .42523 .23822
.58001
.27999
.00189
Source: Dewhurst, Appendix 25-3, Tables J & K: pp. 1114-1115.

17
included in transportation or industrial uses. Accordingly, Dewhurst's 1950 petroleum work share estimate may be a bit low, but it is not unreasonable.
The work share of coal was steady at 63% to 65% from i70 to 1910, then declined by nearly two thirds between 1910 and 1950. This decline corresponds with the penetration )f coal-fired central heating in commercial and residential buildings (although household furnaces were invented in the 1850s), and by cempecition for railroad freight traffic by petroleum-using truck transportation, the conversion to diesel locomotives, and the relative decline of the railroad industry. Transportation claimed 20.8% of coal use in 1947 but only 14.3% in 1950 and only 3.7% in 1955, indicating the drastic decline in the heavily work-dominated transportation demand for coal, at least at a fairly late date in Dewhurst's data period (Bureau of Mines, 1968, p. 65, Table 3; Schurr and Netschert, 1960, p. 76). There is no clear basis presently for believing that Dewhurst's 1950 work share estimate of 23.8% for coal is either too high or too low.
Dewhurst claims thot natural gas was used almost exclusively for heating and lighting prior to 1900 (Dewhurst, 1955, p. 1107), while Schurr and Netschert show industrial uses claiming some 70% in 1906, with residential and commercial uses claiming from 30% to 40% until 1920, falling to a roughly steady 25% after 1930 (Schurr and Netschert, 1955, p. 132). The two sets of figures are not aecessarily in conflict since the industrial uses cannot be assigned to work or heating uses. Again, there is no present basis foi questioning Dewhurst's 28% work share estimate for natural gas in 1950.
2.2. WOOD USE IN THE UNITED STATES
Wood use data are the weakest of those for any energy source, but clear trends are evident. Dewhurst estimates the shares of American energy coming from wood at 89.7% in 1850 and 82.6% in 1860. Table 4 reports Dewhurst's wood share estimates for the decennial years 1870 through 1950. The wood share declined at an increasing rate between 1870 and 1910, falling from 72.7% to 10.9%. Most wood was used for space heating, as indicated by wood's work share uf 6% in 1850, 5% in 1860, 4% in 1870, and falling steadily in subsequent years.
For 1.880, Schurr and Netschert (1960) and Schurr (1983) offer some disaggregation of wood use in the United States, tabulated in Table 5. Their overall wood energy shares agree with Dewhurst's estimate for 1880. Relying on Sargent (1879), Schurr and Netschert (1960, p. 53) estimate the industrial share of wood use between 3.5% and 5% in 1879/80, with railroads claiming 29% of industrial wood use and manufacturing 50%. Schurr's (1983) estimates imply that wood supplied 9.1% of industrial and transportation energy use in 1880 and 85% of household energy use. Overall, households consumed two thirds of national energy supplies and industry and transportation one third. Both sets of figures are comparable to those found in low-income devcloping countries presently.

18
Table 5. Fuel Shares in the United States, 1880
Household's total energy share 67%
Wood's share of household energy use 85%
Industrial and transportation total energy share 33%
Wood's share of industrial energy use 9.1%
Percent of total energy from wood 56%
Percent of wood used by households 95%
Percent of wood used by industry 5%
Percent of total erergy from mineral fuels 44%
Household share of mineral fuels energy 25%
Industrial/transportation mineral fuels energy 75%
Source: Calculated from Schurr (1983), p. 213, fn 4.
The treatment of wood energy has major consequences for the what we choose to believe happens to aggregate energy use as per capita income increases, as noted in the introduction and shown in Figures 1, 2, 4, and 5. If wood is excluded from the measure of aggregate energy, enezgy use per unit of output and per capita surged strongly between 1880 and 1910, increasing roughly three-fold and fifteen-fold respectively. Including wood dampens these increases to twenty percent and two-fold. Schurr (1983) argues that an energy-output measure excluding wood is more appropriate because wood was not used extensively in production. In fact, wood was predominantly a household and commercial fuel U.7pd for space heating, and industrial fuels, even in 1880--and earlier, judging from the fact that coal was the predominant source of work energy in 1850 and 1860--were not wood. On the other hand, omission of wood energy from energy-output mr:asures introduces an asymnetry as coal, natural gas, and to some extent, petroleum products displace wood in the residential and commercial sectors. Currently, the residential and commercial sectors consume nearly 40% of energy used in the United States, and excluding the energy those sectors formerly used while including the modern fuels that replace the old energy source introduces a large element of confusion rather than clarification of the process of energization of production. Additionally, the income generated in supplying wood fuel is included in
19
the income measure, but the energy supplied is not, although the magnitude of this component of income may be relatively small.
2.3. HOUSEHOLD FUEL USE
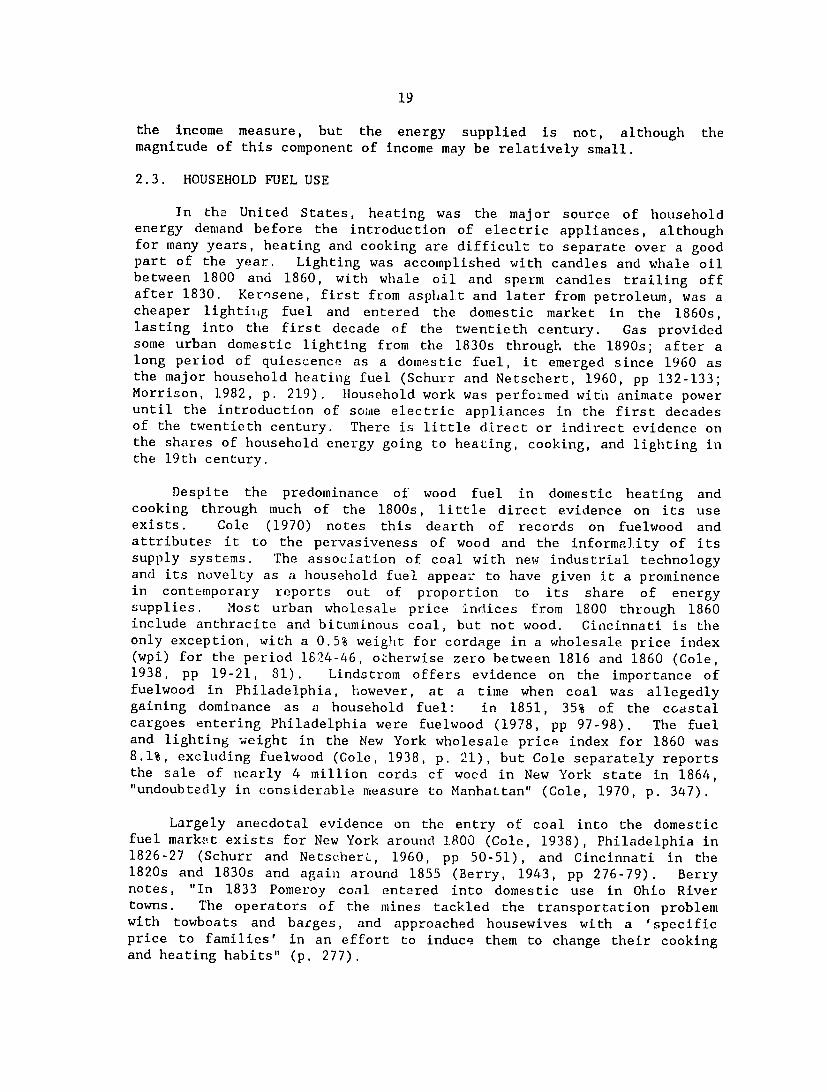
In the United States, heating was the major source of household energy demand before the introduction of electric appliances, although for many years, heating and cooking are difficult to separate over a good part of the year. Lighting was accomplished with candles and whale oil between 1800 and 1860, with whale oil and sperm candles trailing off after 1830. Kerosene, first from asphalt and later from petroleum, was a cheaper lightinig fuel and entered the domestic market in the 1860s, lasting into the first decade of the twentieth century. Gas provided some urban domestic lighting from the 1830s through the 1890s; after a long period of quiescence as a domestic fuel, it emerged since 1960 as the major household heating fuel (Schurr and Netschert, 1960, pp 132-133; Morrison, 1982, p. 219). Household work was performed with animate power until the introduction of some electric appliances in the first decades of the twentieth century. There is little direct or indirect evidence on the shares of household energy going to heating, cooking, and lighting in the 19th century.
Despite the predominance of wood fuel in domestic heating and cooking through much of the 1800s, little direct evidence on its use exists. Cole (1970) notes this dearth of records on fuelwood and attributes it to the pervasiveness of wood and the informality of its supply systems. The association of coal with new industrial technology and its novelty as a household fuel appear to have given it a prominence in contemporary reports out of proportion to its share of energy supplies. Most urban wholesale price indices from 1800 through 1860 include anthracite and bituminous coal, but not wood. CiLncinnati is the only exception, with a 0.5% weight for cordage in a wholesale price index (wpi) for the period 1824-46, otherwise zero between 1816 and 1860 (Cole, 1938, pp 19-21, 81). Lindstrom offers evidence on the importance of fuelwood in Philadelphia, however, at a time when coal was allegedly gaining dominance as a household fuel: in 1851, 35% of the coastal cargoes entering Philadelphia were fuelwood (1978, pp 97-98). The fuel and lighting weight in the New York wholesale price index for 1860 was 8.1%, excluding fuelwood (Cole, 1938, p. 21), but Cole separately reports the sale of nearly 4 million cords cf wood in New York state in 1864, "undoubtedly in considerable measure to Manhattan" (Cole, 1970, p. 347).
Largely anecdotal evidence on the entry of coal into the domestic fuel marke't exists for New York around 1800 (Cole, 1938), Philadelphia in 1826-27 (Schurr and NetscherL, 1960, pp 50-51), and Cincinnati in the 1820s and 1830s and again around 1855 (Berry, 1943, pp 276-79). Berry notes, "In 1833 Pomeroy coal entered into domestic use in Ohio River towns. The operators of the mines tackled the transportation problem with towboats and barges, and approached housewives with a 'specific price to families' in an effort to induce them to change their cooking and heating habits" (p. 277).

20
Lebergott reports the percent of families using various fuels for domestic heating in 1880, 1908, and 1940, shown in Table 6. Fron C. S. Sargent's report in the 1880 Census, Lebergott reports 65% of families using wood and 35% using coal, which, assuming a greater efficiency of coal, is roughly compatible with the reports by Schurr and Netschert (1960) and Schurr (1983) that about 85% of household fuel use was from wood in 1880 (see Table 5). Lebergott assumes that 95% of rural households used wood and arrives at a figure of 16% of urban households using wood in 1880. For 1908, he relies on a Forest Service survey. The survey estimated 14.2 million cords of wood to be consumed in towns and cities, and he assumes an arbitrary 12 million cords went to household consumption. The survey implied 12.44 cords per farm family per year, and reasoning from higher wood prices in cities, Lebergott assumes 10 cords per year per urban family to arrive at the figures of 36% of total families and 9% of urban families using wood for heating in 1908. The 1940 figures are from the Census of Housing.
Table 6: Families using particular domestic heating fuels in the Urited States, 1880-1940
Total U.S. Urban Farm
Wood Coal Oil Gas Wood Other Wood Other
1880 65% 35% 0 0 16 84 98 2
1908 36 63 1 0 9 91 95 5
1940 23 55 11 11 6 93 67 33
Source: Lebergott (1976), p. 276, Table 14.
Clearly, the relative transportability of wood and coal encouraged the substitution of coal for wood as urbanization concentrated fuel demands into small areas. Lindstrom reports market ranges around Philadelphia in 1830 for cordwood of 6 miles by wagon and 29 miles by canal and for coal of 19 miles by wagon and 1.75 miles by canal (1978, p. 118). Despite the greater portability of charcoal than cordwood, charcoal appears to have remained almost exclusively an industrial fuel in the United States. Additionally, the expense of urban land discouraged the stockpiling of the large quantities of wood required to supply the same energy that a small quantity of coal. could deliver. Technology for using coal as a heating fuel existed long before its widespread use, primarily because of the capital expense: residential furnaces were available from the 1850s, but in 1920, only 1% of American homes had central heating. That figure increased to 42% by 1940 and to 78% by 1970 (Lebergott, 1976, p. 277). Table 7 documents the penetration of central heating in American homes.
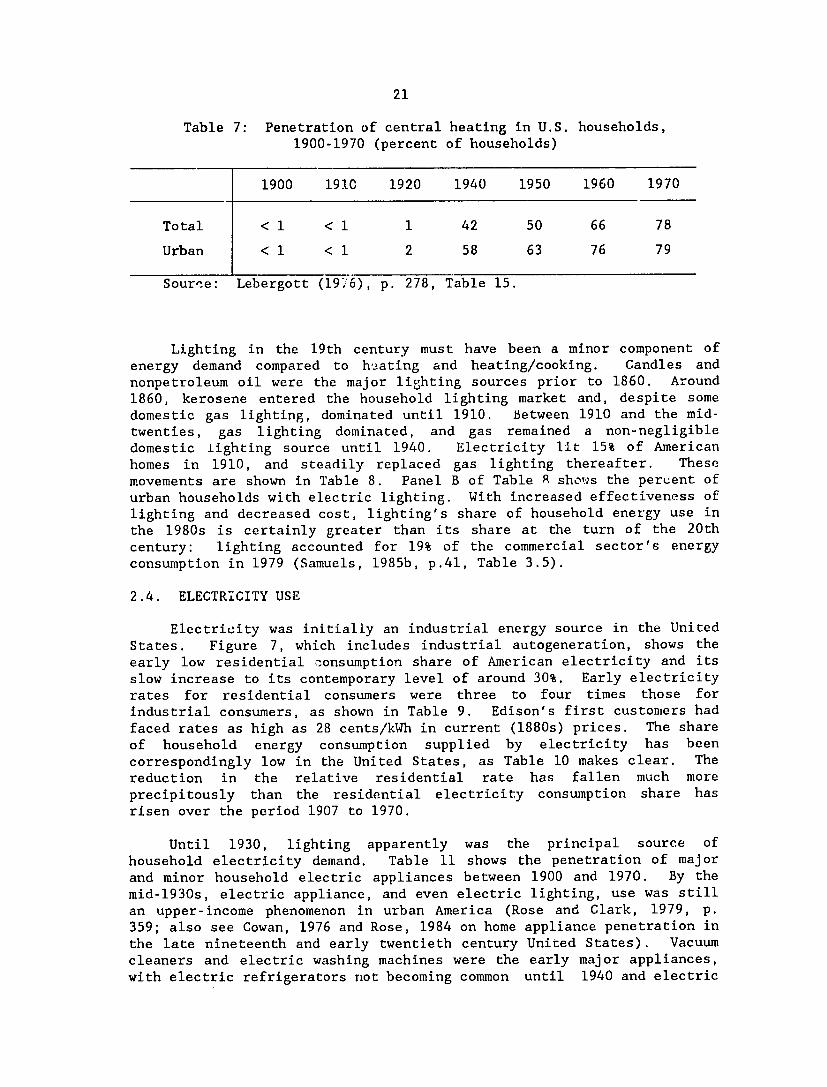
21
Table 7: Penetration of central heating in U.S. households, 1900-1970 (percent of households)
1900 1910 1920 1940 1950 1960 1970
Total < 1 <1 1 42 50 66 78
Urban < 1 < 1 2 58 63 76 79
Sourne: Lebergott (19,6), p. 278, Table 15.
Lighting in the 19th century must have been a minor component of energy demand compared to heating and heating/cooking. Candles and nonpetroleum oil were the major lighting sources prior to 1860. Around 1860, kerosene entered the household lighting market and, despite some domestic gas lighting, dominated until 1910. Between 1910 and the midtwenties, gas lighting dominated, and gas remained a non-negligible domestic lighting source until 1940. Electricity lit 15% of American homes in 1910, and steadily replaced gas lighting thereafter. These movements are shown in Table 8. Panel B of Table A shous the percent of urban households with electric lighting. With increased effectiveness of lighting and decreased cost, lighting's share of household energy use in the 1980s is certainly greater than its share at the turn of the 20th century: lighting accounted for 19% of the commercial sector's energy consumption in 1979 (Samuels, 1985b, p.41, Table 3.5).
2.4. ELECTRICITY USE
Electricity was initially an industrial energy source in the United States. Figure 7, which includes industrial autogeneration, shows the early low residential consumption share of American electricity and its slow increase to its contemporary level of around 30%. Early electricity rates for residential consumers were three to four times those for industrial consumers, as shown in Table 9. Edison's first customers had faced rates as high as 28 cents/kWh in current (1880s) prices. The share of household energy consumption supplied by electricity has been correspondingly low in the United States, as Table 10 makes clear. The reduction in the relative residential rate has fallen much more precipitously than the residential electricity consumption share has risen over the period 1907 to 1970.
Until 1930, lighting apparently was the principal source of household electricity demand. Table 11 shows the penetration of major and minor household electric appliances between 1900 and 1970. By the mid-1930s, electric appliance, and even electric lighting, use was still an upper-income phenomenon in urban America (Rose and Clark, 1979, p. 359; also see Cowan, 1976 and Rose, 1984 on home appliance penetration in the late nineteenth and early twentieth century United States). Vacuum cleaners and electric washing machines were the early major appliances, with electric refrigerators riot becoming common until 1940 and electric

I- 50
I
40
wjz 00
a
-Z20(no
z w 0
w W
40
0
4945 4920 4925 4930 4935 4940 4945 4950 4955 4960 4965
YEAR
Fig. 7: Residential Share of United States Electricity Consumption,
1912-1982
4970 4975 4980
Source: U.S. Department of Commerce (1975), p. 828

-- -- --
23
ranges still relatively infrequent even in 1950. Gas was a more common cooking fuel until the mid-1970s; the number of households using electricity for cooking surpassed those using gas only in 1974, and by 1980, 52% of American households cooked with electricity compared to 40% using gas (Samuels, 1985b, p. 5, Table 2.1). Electric heating has been a more recent development, with the houses primarily heated by electricity reaching only 10% in new houses in 1950, but accelerating rapidly in the early 1960s and reaching nearly 50% in new houses by 1980 (Samuels, 1985b, p. 1.4, Figure 2.7).
Table 8: Lighting sources in American households, 1900-1970 (percent of households)
A.
Primary Lighting Source 1900 1910 1920 1930 1940 1950 1960 1970
Kerosene & Coal Oil 88 -- -- -- --
Gas 9 85 65 32 21 6 1 --
Electricity 3 15 35 68 79 94 99 99
Other -- -- - -- --.. - 1
B.
Percent of Families 1900 1910 1920 1930 1940 1950 1960 1970 With Electric Lighting
Urban 8 47 96 99 99+33 85 99+
All U.S. 3 15 35 68 79 94 96+ 99
Source: Lebergott (1976), pp. 279-280, Tables 16 and 17; Bureau of Census (1975), p. 827.

24
Table 9: Electricity Prices (cents/kWh), United States, 190 2-1970a
Residentialb Large Light & Power
1902 16.20 -
1907 10.50 2.70 1912 9.10 -
1917 7.52 2.10 1920 7.45 2 .83cd2.711925 7.30 1930 6.03 2.66 1935 5.01 2.46 1940 3.84 2.06 1945 3.41 1.73 1950 2.88 1.81 1955 2.65 1.67 1960 2.47 1.69 1965 2.25 1.59 1970 2.10 1.59
alnformation insufficient to determine whether
prices are current or constant dollar.
bAverage of four average block rates.
c1922.
d1926.
Source: Historical Statistics of the United States (1975), p. 827.
Table 10: Electricity share of U.S. household energy consumption, 1900-198)
1900 1910 1920 1930 1940 1950 1960 1970 1980
Electricity (direct) % < 1 < 1 <1 1 2 4 9 15 25
Source: Morrison (1982), p. 219, Table 11.1.

25
Table 11: Electric appliance penetration, United States, 1900-1970 (percent of households owning)a
1900 1910 1920 1930/32 1940/41 1950/53 1960 1970
Washing Machine 0 0 8 24 50 70 73 70
Refrigerator (mechanical) 0 0 <1 8 44-51 80-84 -- 99
Range (electric) 0 0 b 12 21 -- 56
Dishwasher 0 0 0 1 -- 3 -- 26
Vacuum Cleaner 0 0 lib 30 41 54 -- 92
Iron 0 0 0 65 -- 82 -- 100
Toaster 0 0 0 27 -- 65 -- 93
Radio 0 0 0 61 -- 94 -- 100
Television 0 0 0 0 -- 43 -- 99 % of Dwellings with electric service -- 16 c 35 68 79 94 99+ 99+
aLebergott's figures are for percents of U.S. households while Dewhurst's
are for percents of wired households. An attempt has been made to adjust Dewhurst's figures to percents of U.S. households.
b1925.
c1912.
Sources: Dewhurst (1955), Appendix 8-1, p. 1041; Lebergott (1976), Tables 18-20, pp. 281-288.
2.5. TRANSPORTATION DEVELOPMENTS
Mechanization occurred first in interregional transportation-river and oceangoing ships and railroads. Coal was used in Ohio River shipping as early as the 1820s, although "wood . remained the staple fuel on the river at least as late as 1834 ." (Berry, 1943, p. 277). Locomotives shifted from wood largely to coal in the early 1870s. Local and intraurban transportation, however, remained entirely on animate power until the late 1880s. In 1890, steam powered street railways in the United States carried 287 million passengers while horse powered systems carried 1.23 billion (McKay, 1976, p. 41). In the early 1890s, urban electric railways swept away urban horse tram and omnibus systems as well as the clumsier and more expensive steam systems (McKay, 1976,

26
pp 50-51). Intraurban freight traffic still moved by horse-powered wagon until the wide diffusion of the truck in the late 1910s and early 1920s.
During the period of widespread use of horse power for local and intraurban transportation, between 1850 and 1920, animals, including farm animals as well as transportation draft animals, never contributed more than 0.64% of total national energy, as Table 12 shows.2 The impact on animal energy of the introduction and widespread diffusion of the truck for local and intraurban freight can be seen in the sharp decline in the animal energy share beginning in the decade 1900/10 in Table 12. Clearly, farm animals are acting to maintain the shares as high as they remain in the period from 1920 through 1940. Animal transportation was simply not an energy-intensive activity, but it was replaced gradually by the more energy-intensive mechanized transport technologies rather than all at once. Additionally, the passengers and freight carried by the new transportation systems were part of a relatively high-income society and were able to offer a high value added relative to the capital and energy used in the transportation.
2There are several methods of assigning energy equivalents to draft animals. Dewhurst's method assigns one horsepower-hour to an hour's use of a horse. Revelle (1976), cited below for India, uses the energy content of fodder as the energy contribution of draft animals. For Indian bullocks whose work contribution Revelle assigned one-half horsepower-hour per hour, this fodder intake method yields an energy equivalent content for draft animals 3.44 times the direct horsepower method used by Dewhurst. Accounting for Dewhurst's higher horsepower evaluation, the fodder intake method would raise Dewhurst's draft animal figure by a factor of 1.72, to 1.05% of total American energy consumption in 1860. This is still a very small figure.
Another method of assessing draft animal energy contributions is to estimate diesel fuel required to replace draft animals by tractors. This raises the estimate of draft animal contribution over the direct horsepower method (at one-half horsepower per animal) by a factor of 1.75. See Bhatia (1985, pp 330-331) on these three methods of evaluating draft animal energy contributions.
The diesel replacement method is undesirable from an economic viewpoint by mixing together capital substitution with energy/fuel substitution. Dewhurst's method views draft animals as machines and assesses their output energy rather than the energy input required to power them. This method implicitly assumes a constant engineering energy.-efficiency across the various types of capital represented by draft animals and the machines replacing them. See Berndt and Watkins (1986) on this point. The fodder approach is the closest to an input energy assessment of draft animals as capital equipment and is therefore the most preferred method of assessment.

27
Table 12: Animal Energy Shares, United States, 1850-1940 (percent)
1850 1860 1870 1880 1890 1900 1910 1920 1930 1940
Percent of total primary energy supplied by 0.57 0.61 0.53 0.55 0.51 0.45 0.28 0.18 0.11 0.07 animals evaluated by horsepower-hour contributions
Percent of total primary energy supplied by 0.60 0.64 0.56 0.58 0.53 0.47 0.29 0.19 0.12 0.07 animals evaluated by fodder requirements
Source: Dewhurst (1955), pp. 1114-1115, Tables J and K. Fodder adjustments made with Revelle's (1976) estimates for Indian bullocks.

3. COAL AND THE HOUSEHOLD SECTOR IN THE NINETEFATH CENTURY U.K.
It is commonly acknowledged that "coal was king" in the United Kingdom from a very early date. Coal was very early used as a domestic fuel in the U.K. because of rising wood prices accompanying severe deforestation. A successful but lesser-known reforestation effort was completed by the last quarter of the seventeenth century, and coal (coke) did not begin to be substituted for charcoal in the iron industry until the early eighteenth century. In fact, charcoal was still the preferred fuel for iron forging unti! the 5pread of Cort's puddling process in the early 1790s (Ashton, 1962, pp 65-66; Hyde, 1977, pp 88-92). Pawson (1979, -p 79-85) notes that the use of steam power was not general in the U.K. by 1800, and that "for far longer than convention has admitted, the water wheel, windmill, horse-gin and manually-driven machine persisted." He cites a 2.5-to-l ratio of hand looms to power looms as late as 1830. Coal displaced other power sources first in iron and steel and in copper, later in cloth industries, and in 1812, the value of output of the cloth industries was three times that of the iron and steel and copper industries. Domestic energy use in the nineteenth century has been fairly widely accepted to have been nearly 100% from coal.
The belief about British energy use that this section examines is that coal had swept away all competing energy sources for both industrial and domestic uses by the beginning of the nineteenth century. In Figure 3, the U.K. shows a doubling in its energy-output ratio between 1830 and 1880, followed by a gradual reduction in that ratio. That trend in energy intensity, called "the development effect" in energy use, has been identified for a number of countries, including the United States -- see Figure 1. -- and is expected to characterize energy use in developing countries. The purpose of this section is to cast some reasonable doubt on the energy use story told for the U.K. by Figure 3, as has already been done for the American case in the previous section, and looking forward, to raise some questions about prospective energy intensification in the currently developing countries.
In the construction of the energy consumption estimates used in Figure 3, Humphrey and Stanislaw (1979) omitted wood, wind, and water energy. Their attempt to estimate energy supplied by wind and water produced an extremely wide range of possibilities -- from 5% to 164% of coal output in 1760. They did not attempt to quantify later non-coal use and warned particularly of their exclusion of Irish peat consumption. The crucial question for present purposes is whether consideration of only coal in the nineteenth century seriously underestimates energy consumption. British industrialization was much earlier than American, so it may be safe to assume that non-coal sources of industrial energy consumption were negligible. The household sector is the principal place to look for evidence of fuel use other than coal in non-negligible quantities.
Deane and Cole (1962, pp 218-220, Table 55) estimate that the domestic sector used 33.2% of nonexported coal produced in the U.K. in
29

30
1840, 18.7% in 1869, and 20.6% in 1887. Using the nearest census populations, these shares imply per capita annual coal consumption rates of .574 tons, .684 tons, and .616 tons. The Flux-Jevons estimate of per capita coal consumption in 1869, which is not independent of the later Deane and Cole estimate for that year (both were based on the 1871 Coal Commission report) was .672 tons (Jevons, 1903, pp 137-140). That 1869 figure was prepared by Flux in his third edition re-working of Jevons's 1865/1866 estimate of domestic coal consumption: Jevons had allowed one ton per person, and Flux dropped the estimate to 12 cwts on the basis of the 1871 Coal Commission report.
These per capita consumption estimates are substantially below comparable estimates for the United States for 1080. Lebergott (1976, pp 274-275) estimates U.S. urban coal consumption at 7 tons per household per year. Using an average family size of three persons, the modal family size for a sample of 1875 Rhode Island families -- one-third of families had 6 or more persons (Pryor, 1972, p. 585) -- yields an annual per capita consumption rate of 2.33 tons of coal.. An independent estimate for 1880, based on Putnam's estimate of total energy consumption (1953, p. 373) and Schurr's (1983) estimate of the household share of energy consumption, yields 3.112 tons of coal equivalent per capita per year. American and U.K. coal prices were roughly similar, the British retail prices possibly a bit lower, but American wood prices were very cheap, which is reflected in the higher consumption estimate based on Putnam's total energy estimate that includes wood. To get the American per capita consumption down to the 1869 U.K. rate, average American family size would have had to be over ten people per household. It is possible that nineteenth century British heating practices kept indoor winter tempe-atures cooler than did simultaneous American practice. However, it is difficult to believe that different heating practices could account for a 3.4-fold difference in fuel consumption or that lower American wood prices and different heating practices could account for a 4.6-fold difference.
The most plausible reconciliation of the U.K. and U.S. consumption estimates is that the U.K. household sector still extensively used fuels other than coal in the mid and late nineteenth century. Humphrey and Stanislaw's (1979) warning about the exclusion of Irish peat consumption was noted above. For the late eighteenth and early nineteenth centuries, Gilboy (1934) cites use of wood, peat, and cow dung as fuels in the U.K. Cole and Postgate (1939, p. 277) note that dung was still regarded as a marketable commodity in Lancashire in the early 1840s, although its use as fuel or fertilizer is noz specified. Further direct evidence on household fuel use in the nineteenth century U.K. has not been found.
The household sector energy consumption share of 33.2% cited by Deane and Cole for 1840 seems low for the mid-nineteenth century, but is not entirely implausible for a country as industrialized as the U.K. was at that time. However, Lbe 43% drop in that share to 18.7% in 29 years is less plausible, despite the fact that the smaller share implies a slight increase in per capita household consumption. The U.K. residential share was 27% in 1982, and 18% would be a low household

31
sector share in a developed country in the 1980s, and middle-income developing countries have household sector shares ranging from 30% to 45% of national energy consumption. It is possible that rapidly expanding railroad coal consumption could account for the drop, but Dean and Cole's sectoral distribution data do not identify railroads (1.962, p. 219, Table 55). In 1841, 67% of the U.K. population was still rural, and it is possible that biomass fuel sources contributed, say, half of household energy consumption, assuming that urban households used more fuel and that rural households used some coal. It may be possible that an increased claim upon coal production by both railroads and steam navigation by 1869 induced substitution of biomass fuels for coal by households. In 1871, 45% of the population was still rural, so some small supplementation of urban domestic coal use with wood could leave biomass fuels still contributing 50% of household sector energy in 1869. These estimates of 50% biomass fuels for 1840 and 1869 are probably conservative, but they still serve to increase the household sector share of national energy consumption and reduce the steepness of the increase in the energy-income ratio in Figure 3, which was the aim of the exercise.
Another view into the possibility of biomass fuel being excluded from the U.K. energy consumption figures is offered by Figure 8, which presents energy per capita and energy/income ratios for the U.K. (England, Wales, Scotland, and Ireland) from 1800 to 1914. The energy/income ratio is calculated independently of Humphrey and Stanislaw's (1979) estimate. Figure 8 should be compared with the comparable American figures in Figures 1, 2, 4, and 5. The U.K. data show a 7.17-fold increase in energy consumption per capita between 1800 and 1914, but only a 1.78-fold increase between the lowest and highest values of the energy-income ratio (E/Y). The rise in the U.K. per capita income, relative to the rise in E/Y, looks much more like the American Figures 1 and 2, which omits wood use than iL i'uQt l kf, Figu:rcs 4 and 5, which include wood. In fact, working backwards in time in Figure 8, the U.K. energy consumption per capita would look much like the American pattern in Figure 5, allowing for probable price differences for wood, if the solid line flattened out around 1850 at an index of around 0.75, continuing back to 1800 largely unchanged. That would imply roughly a 50% share of wood (or other biomass) fuel in aggregate U.K. consumption in the first half of the nineteenth century, which is in line with the previous suggestions.

o 2.4 1 1 1 1 1
LO
oui
,M
0
0
z
2.0
LO ENERGY PER CAPITA
z
<
F
1.2
0.8 ENERGY/INCOME
ujz zI
ul
0
0.4
0
1800
iII
1820 1840 1860
I
1880
I
1900 1920
Fig. 8: Energy Per Capita and Energy/Income Ratio, United Kingdom, 1800-1914
33
Sources: Coal production, consumption, and exports: Deane and Cole (1969, p. 216); Mitchell and Dean (1971, pp 115-116, 121).
Value of petroleum imports: Deane and Cole (1971, pp 299-300).
Gross material income, U.K., 1801-1851: Deane and Cole (1971, p. 366).
Net material income at 1900 prices, U.K. 1855-1914: Deane and Cole (1971, pp 367-368).
Rousseaux price index, 1801-1851: Mitchell and Deane (1971, pp 471-472)
Population, U.K., 1801-1914 (Ireland 1821-1914): Deane and Cole (1971, pp 6-10).
Population, Ireland, 1791. (extrapolated at constant growth, 1.791-1821): Connell (1950).
Petroleum prices 1870-1918: Potter arid Christy (1962, p. 319).
Bituminous coal prices (average f.o.b. mine mouth prices) and railroad freight charges: (U.S. Dept. of Commerce, 1965, pp 356-357).

4. ENERGY USE PROFILES IN CURRENTLY DEVELOPED AND DEVELOPING COUNTRIES
Development scholars often look to the past in developed countries to gain understanding about circumstances inpresent developingcountries. Similarly, they sometimes compare developing countries with developed countries to assess what the former might look like if development proceeds as desired and to assess what problems developing countries might face if their current ones are resolved. This section compares some aggregate characteristics of energy use in developingcountries with that in developed countries. The information developed in the previous two sections on past energy use in the United States and the United Kingdom add perspective to the present snapshot comparisons of developed and developing countries. The purpose of this comparison is to gain insights into current and prospective energy problems in developing countries. This section first examines the consumption shares of the residential, industrial, and transportation sectors, then compares electricity consumption patterns, for an array of developing and developed countries.
4.1. SECTORAL ENERGY DEMANDS
Seventy to eighty percent of national energy demand generally is accounted for by three major sectoral classifications of user: the residential, industrial, and transportation sectors. In earlier periods in the industrialized countries, the residential sector consumed as much as 80% or more of national energy supplies, arid the history of energy use in their economic development has been the shift of energy consumption from households to industry and transportation. Currently, developingcountries face the task of shifting their energy consumption from households to industry and transportation in about the same proportions that the industrialized countries faced one hundred to one hundred fifty years ago, but the technologies involved in the sectoral competition have changed and some major end-use demand characteristics differ. Consequently, information must be derived from comparisons cautiously.
4.1.1. Residential Energy Use
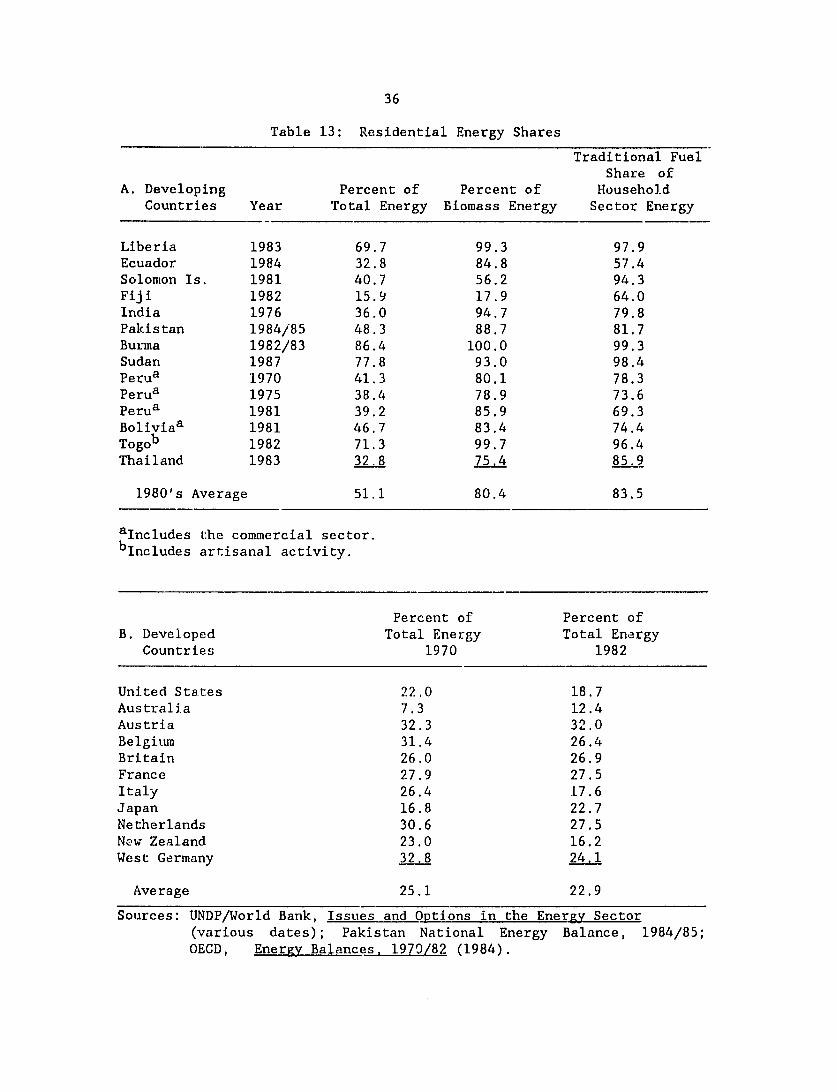
Table 13 shows residential energy shares of national energyconsumption for twelve developing countries and eleven industrialized countries. The household sector is the largest claimant on energy supplies in lower-income developing countries (e.g., Burma, Sudan, Togo)and still consumes around one third in the less desperate developing countries (e.g., Ecuador, Peru, Thailand). The second column in panel A of Table 13 records that the household sector is the major claimant on traditional, biomass fuels, every except Fiji and thein case Solomon Islands, taking over 75% of the traditional energy used in the economy. Additionally, traditional fuels supply well. over half of the household sector's energy consumption. This compares roughly with the United States situation in 1880, shown in Table 5, except that the household share was slightly larger in the U.S. in 1880, probably because modern
35
36
Table 13: Residential Energy Shares
A. Developing Countries Year
Liberia 1983 Ecuador 1984 Solomon Is. 1981 Fiji 1982 India 1976 Pakistan 1984/85 Burma 1982/83 Sudan 1987 Perua 1970 Perua 1975 Perua 1981 Boliviaa 1981 Togob 1982 Thailand 1983
1980's Average
Percent of Total Energy
69.7 32.8 40.7 15.9 36.0 48.3 86.4 77.8 41.3 38.4 39.2 46.7 71.3 32.8
51.1
Percent of Biomass Energy
99.3 84.8 56.2 17.9 94.7 88.7
100.0 93.0 80.1 78.9 85.9 83.4 99.7 75.4
80.4
alncludes the commercial sector. blncludes artisanal activity.
Percent of B. Developed Total Energy
Countries 1970
United States 22.0 Australia 7.3 Austria 32.3 Belgium 31.4 Britain 26.0 France 27.9 Italy 26.4 Japan 16.8 Netherlands 30.6 New Zealand 23.0 West Germany 32.8
Average 25.1
Traditional Fuel Share of
Household Sector Energy
97.9 57.4 94.3 64.0 79.8 81.7 99.3 98.4 78.3 73.6 69.3 74.4 96.4 85.9
83.5
Percent of Total Energy
1982
18.7 12.4 32.0 26.4 26.9 27.5 17.6 22.7 27.5 16.2 24.
22.9
Sources: UNDP/World Bank, Issues and Options in the Energy Sector (various dates); Pakistan National Energy Balance, 1984/85; OECD, Energy Balances, 1970/82 (1984).

37
transportation is such a major claimant on energy supplies, especially in developing countries.
Important differences that are not readily apparent from the sectoral share data exist between the present developing country situation and the 1880 U.S. situation. Most of the U.S. household energy in 1880 went to heating, which is a minor end use in most developing countries today, where most household fuel goes to cooking. For example, in 1978, 83% of wood and 91% of charcoal used in Kenya went for cooking, the remainder for heating. Kenya's altitude may make its heating demands higher than those in many developing countries, although India and Pakistan will have areas with higher heating demands as well. The United States made over a five-fold improvement in energy efficiency of household heating systems between 1880 and 1950, the result of major technological changes, holding fuel types constant, as well as fuel substitutions. The prospects for end-use efficiency improvements in cooking are of paramount importance in developing countries today. The end-use efficiency of air-dried wood in cooking is 5%-10%; that of charcoal is 15%-25%, excluding the three- to six-fold ratio of wood to charcoal. Charcoal is an urban household fuel in a urbanizing Third World. United States households shifted from fuel wood directly to coal, without going through charcoal, but it is doubtful that most developing countries' household sectors will eliminate the charcoal step. The modern energy forms most likely to replace charcoal for cooking as income increases are kerosene, with an efficiency of 30% to 40%, and LPG, with an efficiency of 45% to 60%. Allowing the net technical efficiency of fuelwood and charcoal to be roughly the same at, say, 7.5%, the energy efficiency improvements possible by fuel shifts to kerosene and LPG alone are in the range of 4.6- to 7-fold. There is the possibility, however, if urban charcoal use continues to dominate modern cooking fuels and if the relative advantage of charcoal burning efficiency over wood does not exceed the wood-to-charcoal conversion ratio, that household sector primary energy demands will increase markedly before appliance and fuel substitution can decrease them. Major shifts to gas and electric cooking appliances in developing countries do not seem likely in the near future.
An issue often rais-d in discussions of cooking fuels is the retardant effect on cooking fuel substitution of culinary habits and preferences. Over a period of several generations, this may be a minor issue. Certainly, American culinary habits have changed substantially over the past hundred years as cooking technology, food prices, and ideas regarding food have changed. Whether other societies' food habits have changed substantially as well or whether the culinary change is peculiarly American is an open question.
Household energy shares in the industrialized countries are currently a little less than half those in the developing country group, and have continued to fall between 1970 and 1982. These smaller shares exist despite a greater range of energy-using activities conducted in industrialized households than is common in developing country households: air conditioning and space heating, and a wide array of major and minor electric appliance use. Low relative prices of biomass
38
fuels contributes to their more extensive use in households of less developed countries. This was the case in the United States in the nineteenth century, and higher wood prices in the eighteenth and nineteenth century United Kingdom contributed to earlier and more extensive household coal use than in North America. Still, greater enduse efficiency associated with modern fuels can contribute substantially to fitting the current array of household sector energy-using activities into a much smaller share of national e nergy use. Jones ana Younger (1987) estimate that substitution of kercsene for fuelwood and charcoal in Sudanese urban areas alone could deliver the end-use energy that required 49% of national energy consumption for only 7.7% of that same national consumption. The large discrepancy between current household sectoz energy consumption shares in developed and developing countries does not necessarily constitute an insuperable problem facing developing countries, although the transition may require more deliberate policy initiatives than involved in transition in industrializedwere the the countries.
4.1.2. Industrial Energy Use
Table 14 shows the industrial sector's energy consumption shares for the same group of developing and industrialized countries. The industrial sectors of the developing countries claim roughly half the share of national energy supplies that the industrial sectors of the developed countries do, 19% contrasted with 37%. However, the industrial sectors of the developing countries claim a much larger share of modern energy, an of and may be a moreaverage 30%, this relevant basis of comparison since the residential sector is such a dominant user of the large share of biomass fuels in those countries and because modern industrial activities increasingly will rely on modern energy sources as a country develops. In the industrialized countries, the energy consumption shares are very close to the industrial contribution to GNP. On average, the share of total energy used by the industrial sectors of the developing countries is close to the industrial share of GNP, but the picture changes when the industrial sector share of modern (non-biomass) energy is compared. What appears is relatively energy-intensive industrial activity, compared with that in industrialized countries. Care must be taken in interpreting this ratio of energy to GNP shares, however. That share ratio in the developing countries is biased upwards relative to that in developed countries because agriculture is a relatively much larger contributor to GNP in the former countries and it uses almost no energy. Several other factors probably contribute to this high ratio in developing countries, but their relative contributions cannot be determined simply from the share: poor operational efficiency, subsidized energy prices relative to output prices, or both, either independently or through interaction effects of inattention to cheap inputs. Especially energy-intensive output mixes probably do not contribute to the relative high ratio energy to GNP inof shares industry in developing countries; in fact, the industry mix in developing

39
Table 14: Industrial Energy Shares
A. Developing countries Share of manufac-Percent Percent of turing; construction of total non-biomass &electricity, gas energy energy & water in GNP, 1981
Liberia 1983 1.0 3.2 11.4 Ecuador 1984 17.3 18.9 20.0 Solomon Is. 1981 2.9 1.1 Fiji 1982 58 .7a 25.3 21 .5b India 1976 39.3 53.4 23.9 Pakistan 1984/85 29.9 47.7 24.5 Burma 1982/83 4.9 34.5 11.4 Sudan 1981 5.8 31.5 13.8 Peru 1970 14.3 21.4 28.3 Peru 1975 17.6 24.4 30.7 Peru 1981 18.2 23.4 29.4 Bolivia 1981 19.6 28.0 20.2 Togo 1982 16.7 53.7 15.5 Thailand 1983 24.2 29.1 26.8
1980's Average 19.2 30.3 21.3 alncludes commercial energy use. b1980.
B. Developed Countries Share of manufacturing construction; &
Percent of electricity, gas total energy & water in GNP, 1981
United States 1960 33.3 35.8 United States 1965 32.6 36.1 United States 1970 32.9 33.1 United States 1975 30.6 30.7 United States J.982 28.0 30.1
aAustralia 1982 39.1 29.9 Austria 1982 32.6 38.6 Belgium 1982 41.5 36.2b
Britain 1982 31.8 27.6 cFrance 1982 34.8 33.9 cItaly 1982 37.9 41.4cJapan 1982 49.4 42.3
New Zealand 1982 37.8 30.6 West Germany 1982 358 470 b
1982 Average 36.9 35.8 a1979 . b1980.
c1981.
Sources: UNDP/World Bank, Issues and Options in the Energy Sector (various dates); Pakistan National Energy Balance, 1984/85; OECD, Energy Balances, 1970/82 (1984); East-west Center, Energ. Mission Report: Solomon Islands (1982)

40
countries probably depress the ratio. At any rate, developing country industrial sectors, paradoxically, look energy-intensive relative to industrialized countries' industrial sectors.
An additional problem with simple interpretation of the ratio nf energy consumption shares and GNP shares in Table 14 is that in the smaller countries, a single industry can cause a large shift in the. ratio. For example, Liberia appears to have a remarkably energyefficient industrial sector, but that appearance is deceptivs. Mining, which is excluded from both GNP and energy consumption in Table 14, contributed 12.5% of GNP in 1981 and used 34% of Liberia's modern energy in 1983. In Fiji, the much smaller percent of non-biomass energy used in industry relative to the percent of total energy used by industry reflects the industrial mix of the country. Sugar refining is a major industry, and is fired largely, if not exclusively, from bagasse, with bagasse, and a small amount of wood, contributing 84% of industrial energy supply (East-West Center, 1982a, pp 6-7, 15). Agriculture is even more dominant in the Solomon Islands, and agricultural processing is included in primary industry accounts (East-West Center, 1982b, pp 7, 9, 17). The ratios for the larger developing countries, such as India, Pakistan, and Thailand are less subject to influence by single industries.
4.1.3. Transportation Energy Use
Table 15 shows transportation sector shares of national energy consumption for the same groups of developing and developed countries. Energy use in transportation gets far ahead of energy modernization in the rest of the economy. Transportation shares of total energy supplies are usually in the range of those in developed countries, or even lower, but the developing countries' transportation sectors claim much higher shares of modern energy than those in the industrialized countries do today as well as much higher shares than transportation used during the industrialized countries' earlier transportation revolutions. Table 1 estimated the industry and transportation shares in the United States at 53% to 55% in 1920, a time when the effect of the automobile and truck was beginning to be felt on energy demands. Transportation shares in GNP are very nearly the same in developing and developed countries, but the transportation sector uses nearly double the share of modern energy in developing countries that it does in industrialized countries. The share of petroleum products used by the transportation sector would be even higher in developing countries. An impressive further consideration is that extensive latent demand exists for freight and particularly passenger traffic in many developing countries. Revelle estimated that in 1976, 14% of tocal rural energy was derived from bullocks, 16% of that in transportation and 84% in agriculture (Revelle, 1976, p. 973). In 1850 in the United States, only 0.64% of the total national energy supply of the United States was contributed by all animals, so this rural transportation and agricultural operation powered by animals in India represents a very large potential addition to modern fuel demand when those activities become mechanized. In Nairobi in 1976, 30% of the trips taken by middle income residents were on foot or bicycle, with figures

41
Table 15: Transportation Energy Shares
A. Developing countries Transportation Percent Percent of (& communication) of total non-biomass shares of GNP (at energy energy factor cost), 1981
Liberia 1983 16.1 51.4 7.8 Ecuador 1984 38.8 49.9 6.8 Solomon Is. 1981 8.2 25.8 Fiji 1982 24.1 55.9 9.9 India 1976 16.8 24.1 6.8 Pakistan 1984/85 11.9 21.4 7.7 Burma 1982/83 7.6 53.5 5.6 Sudan 1981 61.911.0 10.5 Peru 1970 21.8 36.6 5.4 Peru 1975 24.8 38.7 6.5 Peru 1981 25.3 37.0 6.8 Bolivia 1981 30.7 52.6 11.4 Togo 1981 11.1 35.8 7.2 Thailand 1983 32.9 52.5 6.5
1980's Average 18.7 42.7 6.7
B. Developed Countries Percent of Transportation total energy (& communication)(Z % non- shares of GNP (at
biomass energy) factor cost), 1981 United States 1960 27.4 6.6 United States 1965 27.6 6.4 United States 1970 28.2 6.4 United States 1975 33.2 6.2 United States 1982 33.8 6.8
aAustralia 1982 35.9 8.1Austria 1982 24.5 7.3 Belgium 1982 18.6 6.9b
Britain 1982 24.9 7.7 bFrance 1982 25.8 6.3
Italy 1982 25.3 7.0 Japan 1982 20.1 .6 3b
bNew Zealand 1982 33.4 8.3West Germany 1982 2 6.3
Average (1982) 26.4 7.1
a19 78 . b1980.
Sources: UNDP/World Bank, Issues and Options in the Energy Sector (various dates); Pakistan National Energy Balance, 1984/85; OECD, Energy Balances, 1970/82 (1984); World Bank, (1983).

42
of 65% and 80% for the next lowest and lowest income groups (McGranahan et al., 1976, pp 31-32). These urban pedestrians also represent substantial additions to transportation fuel demands over the next generation.
The transportation sectcrs of most developing countries ere carrying relatively low-value added cargoes and passengers with relatively highcost capital equipment and fuels. Both the transportation equipment and fuels trade in international markets at international prices. The result is a high energy cost of providing a service of relatively low final value, despite high people loads in motorized passenger transportation. There is little short run substitutability between capital and fuel, and the substitutability between labor and capital (e.g., reduced maintenance) causes more fuel use per unit of service.
Additionally, the fuel and usually the equipment entail foreign exchange costs, and the uses to which these items are put must yield, directly or indirectly, foreign exchange earnings within a fairly short time to avoid increasing foreign indebtedness and contributing to macroeconomic problems. This is not simply a misplaced concern that foreign exchange-using imports be used directly in foreign exchangeearning export industries. In general, there is no reason why imports would have to be used in direct export activities to repay foreign exchange costs, but intersectoral linkages often are weak in developing countries. Even in many economically more advanced developing countries, industrial protection policies have inhibited the development of intersectoral linkages, and exchange-u~ing imports absorbed by a domestic production sector may generate indirect export earnings only slowly and haltingly (Chenery, Robinson, and Syrquin, 1986). Many of the currently industrialized countries either entered the mod-ern transportation age with more sophisticated interindustry linkage structures that could convert imports into foreign exchange earnings efficiently, were able to rely to a large extent on domestic fuel sources for modern transportation, or both.
There are few intermediate-technology options in modern transportation between head loads and bullock carts on the one hand and modern motor vehicles on the other. However, subsidization of some or all motor fuels exacerbates the problem in many developing countries. Non-highway transportation (rail and water) is not highly developed in developing countries; a 197/82 sample of developing countries averaged 85% of their transportation energy used in road transport, while a 1976 sample of industrialized countries averaged 83% for road transport. India has a mnuch more extensively developed rail system than other countries, developed or developing. In fact, both developed and developing countries have very similar structures of energy use across the four major transportation modes, air, road, rail, and internal water, although this classification disguises transportation like pipeline movement of liquid fuel products, which are not major options in most, small developing countries, hcwever.

43
There is another aspect to this issue of intermediate transportation technology, however. The industrialized countries developed rail and inland water freight transport systems before the advent of motorized road freight transportation, and these were appropriate for the income levels of those countries at that time. In urban passenger transportation, the electric street car was an intermediate technology within cities, as was the interurban electric train for intercity movement, and both were widely used in the industrialized countries before the shift to petroleum-fueled transport. The imore fuel-intensive, mechanized road transportation systems were introduced into wealthier circumstances than were the earlier rail and water systems.
The developing countries have gone directly to the transport systemof the wealthier societies, largely skipping the intermediate stage.3
What were the options of the developing countries, though? First, both rail and inland water transport require large infrastructural investments, probably greater than those required for motorized road transport. Second, rail systems, particularly, require fairlysophisticated management inputs, which are particularly scarce in most developing countries. The high divisibility and low management requirements of mechanized road transportation avoid these two problems, and the early emphasis on mechanized road transportation in developing countries well may be a rational response to their particular resource constraints, encouraged to some extent by government policies such as motor fuel subsidies. Additionally, the inefficiencies of existing, developing country railroad systems, in circumstances in which simple comparison of rail and road tariffs would appear to favor rail, shift even bulk traffic from rail to roads (Mwase, 1987, pp 206-12).
This explanation of what has been called the transportation energyimbalance in developing countries is supported by the pattern and evolution of transportation energy shares in India. In 1976, 54% of India's transportation energy was used by the rail system and 41% by road transport. An array of other developing countries (Bolivia, Togo,Nigeria, Brazil, Indonesia, Mexico, and Egypt) averaged around 2% of transport energy going to rail systems and 75% to 90% going to road transport between 1976 and 1982. India's transportation share of
3This statement requires some caveat. Railroads have existed since the nineteenth century in the developing countries. The first railroad opened in India in 1853, and India had an extensive rail system by the First World War. Rails were begun in South Africa in the 1860s, in French West Africa in the 1880s, and in German East Africa by 1905. (Latham, 1978, pp 18-25). However, by the late 1920s in India and Southeast Asian countries theand by 1930s in Africa, these railroads were facing severe competition from parallel motor roads from which they, as well as their counterparts in much of the developed world, never strongly recovered (Latham, 1981, pp 23-39). Clearly, the developing countries were at lower income levels and less complex levels of generaleconomic development when their motor transport systems began to offer crippling competition to thei-. rail systems.

44
national modern energy consumption in 1976 was a correspondingly low .24, compared with an average of .43 for eleven other developing countries in the early 1980s (Table 15). In Table 15, Pakistan shows a similarly low transportation share in national energy consumption, and its rail share of transportation energy is larger than that of most other developing countries, but smaller than India's, in the range of .14 to .18 between 1976 and 1984. Since 1976, India's road transportation has increased its share of transportation sector energy consumption at the expense of the rail system's energy consumption, but the overall transportation sector's share of national modern energy consumption had risen only to around .26 by 1982. There has been roughly a 16% decrease in the quantity of energy used in the rail transport sector in India between the mid-1970s and the early 1980s as the rail energy share has fallen relative to the road energy share. Traffic volume data would be required to decide the isoue, but a logically plausible story is that while road transport has boomed in India, the freight and passenger volume shares have not swung nearly as heavily toward road transport as have the energy consumption shares, and the overall transportation share in national energy consumption has not risen drastically as a consequence.
As described earlier, the industrialized countries had the opportunity to phase in their transportation revolutions over periods of sixty to eighty years between the introduction of the train and steamboat and the major penetration of the automobile and the truck. Mechanization of industry had largely preceded the petroleum-powered transportation revolution, increasing the value added of the cargoes to be carried by the new transport modes. Developing countries have not had this luxury, and indeed, usually have had their industrial mechanization lag behind the mechanization of their transportation systems.
4.2. ELECTRICITY CONSUMPTION
Table 16 offers a comparison of several important characteristics of electricity consumption patterns in developing and industrialized countries. Electricity comprises a smaller share of total energy supply in developing countries than in developed, whether measured as a proportion of total, or only modern, energy. At the same time, the residential share of aggregate electricity consumption is somewhat larger in developing countries than in developed.4 Household shares of electricity consumption are much higher in developing countries than they were in comparable periods of electricity system development in the United States (Figure 7) or the United Kingdom (Table 17). The residential shares cited in panel A of Table 16 are recorded data and do
of developing countries in Panel A of Table 16 is, of course. not complete, but it does appear to be representative of electricity consumption characteristics.
4The list

45
Table 16: Characteristics of Electricity Consumption
A. Developing Electricity Electricity Residential Share Countries as % of Total as % of Modern of Electricity
Year Energy Energy Consumption* Consumption* Consumption
Liberia 1983 8.5 27.1 35.0 Liberia 1986 2.4 8.8 61.9 Ecuador 1984 6.0 7.8 65.9 Solomon Is. 1981 1.3 4.2 32.1 Fiji 1982 8.3 19.2 20.5 India 1976 6.8 10.9 8.7 Pakistan 1984/85 7.0 12.5 45.1 Burma 1984/85 1.1 7.5 30.1 Sudan 1981 1.0 5.5 38.3 Peru 1970 5.6 9.3 28.8 Peru 1975 6.5 10.2 31.9 Peru 1981 8.0 11.7 33.0 Bolivia 1981 5.8 9.9 44.4 Togo 1982 3.5 11.4 21.3 Thailand 1983 8.3 13,2 24,7*
1980's Average 5.3 11.8 35.5
*Excludes autogeneration; uses 1983 figures for Liberia.
B. Developed Electricity as Residential Share Countries % of Total of Electricity
Energy Consumption Consumption, 1982 1982
Australia 15.1 36.2 Austria 15.8 27.1 Belgium 11.9 33.2 Canada 18.5 29.6 France 14.4 30.1 Italy 13.9 25.4 Japan 19.1 24.0 Netherlands 10.1 27.9 New Zealand 24.5 40.8 Norway 41.7 31.8 Sweden 24.7 27.0 Switzerland 19.2 25.9 United Kingdom 14.4 36.9 United States 13.7 36.2 West Germany 15.0 27.7
1982 Average 1 6 .4a 29.9 b
aExcluding Norway; 18.1 with Norway. bExcluding Netherlands; 30.7 with Netherlands.
Sources: UNDP/World Bank, Issues and Options in the Energy Sector (various dates); Pakistan National Energy Balance, 1984/85; OECD, Energy Balances, 1970/82 (1984); GOL/DOE (1987).

46
not reflect potentially substantial loads from unreported residential hookups which are otherwise reported under losses. The small consumers typical of residential loads are more expensive to provide with service, and their bills are harder to collect than are large industrial bills. Additionally, residential loads may contribute more to peaks than do industrial loads, which can be spaced more easily, and in developingcountries with low residential load shares, such as Egypt, with a 1975 residential load share of around 18% (DOE, 1979 Annex 3, p. 30), the residential loads often contribute heavily to peak demands, thus degrading the overall system far more than their low load shares would suggest.
Low residential electricity prices encourage residential usage while industrial users are discouraged from relying on grid-suppliedelectricity in many developing countries because of its unreliability,which in turn reflects the financial problems of the utility. Subsidized fuel costs of thermal generation or capital and maintenance costs of hydro generation often are not covered by the collected revenues, ],.avingthe utility a burden on the national treasury or the international donor community. Low-income developing countries can ill-afford the low value added activities powered by a quarter to a half of their electricitygeneration. Lighting is the most prevalent domestic use, and televisions are remarkably in rural areas. Domesticcommon even refrigerators, irons, and room air conditioners are also popular household appliances at somewhat higher incomes.
The electricity consumption shares for the developing countries in Table 16 exclude autogeneration, which has a large nonresidential component and which may be of substantial magnitude In many countries. Higher-income residences, which are connected to the national grid, often have oil-fired back-up power systems which are uscd during periods of grid failure. Autogeneration capacity in Sudan in 1983 was estimated to have been equivalent to half of the National Electricity Corporation'ssupply from the grid and isolated systems (UNDP/World Bank, July 1983, pp 5-6). In 1981, iron mining companies in Liberia generated their own electricity to the extent of 114% of grid-generated (Liberia ElectricityCorporation or LEC) supply (Samuels 1985a, p. 2). In an independentlyconducted estimate, the electricity autogenerated by iron miningcompanies in Liberia in 1986 amounted to 283% of LEC-supplied consumption (excluding transmission losses of LEC)(COL/DOE, 1987). Autogeneration bythe commercial and agricultural/forestry sectors added another 10.4% to LEC production (not excluding LEC transmission losses, for which no equivalent is offered, or possibly relevant, for the commercial and agricultural/forestry sectors; if transmission losses are debited from LEC generation, the autogenerated contribution of these two sectors rises to 12.3% of LEC-supplied consumption). Generation losses from the miningcompanies in 1986 were 68.0%, comparable to the 69.4% generation losses for LEC. The commercial and agricultural/forestry sectors had slightlyhigher generation losses of 76.2% and 72.0%, although implications for relative economic efficiency cannot be inferred without information on generation costs. Thus, additional pressurethe that autogeneration is sometimes alleged to place on fuel oil and diesel supplies is only

47
marginally higher than the petroleum that the national grid supplierwould require to supply the same load. This marginal, as opposed tomajor, difference in Liberia probably characterizes small-scaleautogeneration in other developing countries as well, and the difference may largely evaporate when considering large, industrial autogenerators.
In general, adding autogenerated electricity to national supplieswould reduce the residential share of total electricity consumption for most developing countries. However, the residential share of publiclysupplied electricity is a good, inverse indicator of the financial strength of the public electricity system. In the early years ofelectrification in the United States, industrial autogeneration was common also. By 1919, 43% of electric motor capacity of manufacturingestablishments was still autogenerated (Devine, 1983, 369-370;pp also see Woolf, 1987, p. 24). In 1940, 21% of electricity in the UnitedStates was still generated by industrial establishments; theautogenerated share fell below 10% in the United States only in 1961, andstood at 6.6% in 1970 (U.S. Department of Commerce, 1975, p. 821).Figure 7, above, shows residential consumption shares of total U.S.electricity production, including industrial autogeneration. Exclusion of industrial autogeneration to convert Figure 7's residentialconsumption shares to shares of utility-produced electricity would raisethose shares by as much as 42% in 1920, still by 25% in 1940, and by 10% in 1960. However, these larger residential consumption shares of gridproduced electricity for the United States are still smaller than the contemporary residential shares of grid-produced electricity in most of the developing countries shown.
Household electricity consumption shares in developed countries haveonly recently reached their current levels, although there has been somesubsidence of residential electricity shares in some Western Europeancountries since the early 1970s. Figure 7 showed the long, slow growthin the residential electricity share in the United States, and Table 17shows a similar trend in the United Kingdom from 1895 to 1982. In thefirst decade of U.K. electricity supply, commercial and public lightingwere the principal loads, but industry and traction (railroads) veryrapidly came to dominate. In 1920, the first year for which separatedomestic load data exist, the domestic share was 8% compared to industryand traction's 80%. The U.K. residential share increased more rapidlythan did the U.S. residential share, reaching American 1980 levels by1950 and peaking at 41% in 1974, a high figure by current industrialized country standards. In the U.K., the ratio of residential electricityprices to industrial prices fell from 3.4 in 1921 to 1.5 in 1948,similarly to the decline in relative rates in the United States duringthe same period (Hannah, 1979, pp 430-31). The patterns in both theUnited States and the United Kingdom are consistent with initial systemtransmission and distribution expansions being financed initially byindustrial users; when chese systems were largely in place and paid for,marginal costs of additional residential hookups were much lowe.z, beinglimited to kilowatt hour charges and some portion of additional capacitycosts. The current sectoral structure of electricity loads in developing

48
countries looks as if a different strategy of financing transmission and distribution costs has been followed.
The high residential electricity shares in developing countries are in large part artifacts of deliberate subsidization policies and should not be expected to grow (despite the growth in Peru's residential share between 1970 and 1981, shown in Table 16), appliance penetration associated with real income growth notwithstanding. On the other hand, the industrial shares will not grow rapidly in the face of unreliable grid supplies. Either pricing reforms will retrench household demands or retard their growth, offering the possibility of more rel.iable supply to industry, or major electricity supply systems in developing countries
Table 17: U.K. Electricity Consumption Shares, 1895-1982 (percents)
Year Domestic Industrial and Traction
1895 N.A. <1.0 1897 N.A. 1.7 1898 N.A. 4.7 1899 N.A. 5.8 1900 N.A. 15.7 1905 N.A. 45.4 1910 N.A. 62.1 1913 N.A. 64.8 1920 8.0 80.0 1925 11.2 74.8 1930 16.7 67.2 1935 22.0 60.7 1939 26.7 58.2 1940 25.7 61.9 1945 28.1 60.3 1946 33.5 54.6 1948 33.5 52.9 1970 37.7 42.2 1974 40.9 39.5 1975 39.7 39.1 1980 36.8 38.6 1982 36.9 36.6
N.A.: Domestic consumption cannot be disaggregated from commercial consumption and public lighting.
Sources: 1895-1948, Hannah, Electricity Before Nationalization (1979), pp. 426-429, Table A.I. 1970-1982, OECD, Energy Balances. 1970/82 (1984), pp. 366-378.

49
will experience failures of major proportion that may offer them opportunities to start over. Only major foreign exchange earning activities (at resource rather than financial costs), both directly through productive activities and indirectly through productively financed household demands, can offer financial viability to large-scale electricity supply.
Again, as with the transporcation imbalance, there is another side to the story of developing countries' typically high residential electricity consumption share. Electrification has sometimes begunaround an industrial. or agricultural application, in financially sound fashion, but authorities have had to yield to residential demands for hookups to avoid sabotage- to facilities. Residents' ideas of "taici:ess" include access to electricity, and system financial soundness do not enter their utility functions. Also, the availability of electric household appli nces in the industrialized countries grew concurrently with the extension of household electrification, but householders in developing countries face a fully-developed array of such devices even before their residences are electrified and probably before they could afford to pay the full cost of owning and operating them. This array of comfort-providing devices that use electricity undoubtedly feed into the popular concept of "fairness" in the residential consumption of electricity, and rational pricing policy can be extended only so far against such a force. While this circumstance can account for some of the pressure for relatively high residential electricity shares in many developing countries, it does not lend optimism about remedying the problem.

5. CONCLUSION: DEVELOPING COUNTRY ENERGY PROBLEMS AND PROSPECTS
The sectoral structure of national energy consumption in developing countries looks similar to that of the United States in the late nineteenth century. The household sectors use most of national energy supplies, but mostly use traditional, biomass fuels. The industrial sectors are relatively minor claimants, reflecting their small size in most developing economies, but they use proportionately more energy than their industrialized country counterparts. The apparently disproportionate energization of developing country industry is possibly attributable as much to the sectoral balance between industry and agriculture as it is to various inefficiencies of energy use attributable to price distortions and attendant operation and maintenance practices. Industrial mixes in most developing countries probably have an effect in the opposite direction.
The major structural imbalance appears to be in the transportation sector. Hechanized transportation is an energy-intensive activity relative to its share in national income, but that effect is magnified strongly in developing countries because there is little or no intermediate technology between domestically-priced animate traction and internationally-priced motor power. Cargoes are low-valued relative to the equipment and fuels providing the transport service and there are few effective foreign exchange-saving factor substitutions available. The transportation revolutions of the nineteenth and early twentieth centuries in the industrialized countries were spread over nearly a century and followed or parallelled the mechanization of the industries whose inputs and products were to be carried. The developing countries of the last third of the twentieth century have not had this advantage. Serious, major competitors to mechanized transportation cannot compete in an integrated international economy, and developing countries' industrial mechanization generally has followed transport mechanization. Motor fuel pricing reform may alleviate the situation, as might the development of some intermediate transportation technologies. However, solution to the economic imbalance in sectoral energy demands may ultimately require the growth of the industrial sectors of developing countries into their transportation technologies, although probably not into their current transportation systems, which often employ the new technologies highly inefficiently.
The structure of electricity consumption also appears to have a serious imbalance between residential and industrial consumption. Residential loads in the industrialized countries grew slowly from shares of less than 10% of national consumption to 30% to 40% over periods of several decades as the ratio of residential electricity prices to industrial electricity prices fell from as high as 7 to 1 to nearly parity. Residential electricity prices in developing countries typically are subsidized as part of social policies, unfortunately resulting in weak electricity supply systems offering unreliable supplies to industries which are reluctant to depend on the national grid. Current residential shares probably cannot grow much beyond their present levels,
51

52
but industrial shares, and hence utility financial solvency, will not increase until reliability improves substantially.
The large household shares are probably less menacing than they appear except for their potential for deforestation. In the industrialized countries, heating demands dominated household energydemand, but cooking dominates in the developing countries. Despitedifferences in energy efficiency improvements offered by heating and cooking appliance technologies, substitution of modern, petroleum-basedfuels, with relatively simple appliances, for traditional fuelwood and charcoal may be able to provide end-use energy services equal to half of current national energy demands with the use of less than one-fifth of the displaced energy. The substitutions involved are not without problems, but the technical possibility exists if the economic costs can be addressed successfully.
Developing country energy problems have been discussed in terms of shares so far, but questions of total amounts of energy are important as well. So called "development effects" on energy use, in which energy use per unit of national income may increase three-fold and energy use percapita may increase fifteen-fold over a fifty-year period before gradually levelling off, appear to exist, but have been much less accentuated in the industrialized countries than has been reported.However, the good news may be grim enough, as I have suggested elsewhere. Continued urbanization over a two-generation period, with no increases in per capita income or in the extent of industrialization, could increase the per capita energy demands of nearly two billion of the world's currently low-income population by a third to a half (Jones, 1986).
Finally, of what use is comparison of the energization of the industrialized countries over the past century prospectsand the for energization of the developing countries? The technological optionsfacing the two sets of countries during their periods of mechanization and energization are vastly different. Industry and agriculturemechanized and energized relatively slowly in the industrialized countries, but those sectors in the developing countries can switch directly from wood fuel and animate power to highly sophisticatedelectrical machinery and equipment powered by petroleum fuels. The aggregate energy efficiency improvements that occurred over one hundred and fifty years in the industrialized countries can be made in a much shorter time in the developing countries. On the darker side, the rapidity of the change possible in the developing countries mayexacerbate structural imbalances if mechanization proceeds at different paces in different sectors and may in turn foster instability in overall development. The relative overdevelopment of the transportation sector in developing countries exemplifies this possibility for unpropitiousimbalance, and the foreign debt problems of many small African countries,in particular, may exemplify attendant stability problems, assuming the two may be related. However, the social upheavals of the industrial revolution in the industrialized countries should be recalled alongsidethe social obstacles to current mechanization in the developingcountries; the smoothness of the energy transition in the industrialized

53
countries should not be overemphasized. Clearly, the experience of the industrialized countries' energy transformation will not be reproduced exactly, because of the differences in technological settings. The transferrable lessons may be the circumstantial differences as much as events to be copied.

REFERENCES
Ashton, T.S. (1962). The Industrial Revolution. 1760-1830. Revised Edition. London: Oxford University Press.
Berry, Thomas S. (1943). Western Prices Before 1861: A Study of the Cincinnati Market. Cambridge: Harvard University Press.
Bhatia, Ramesh. (1985) "Energy and Agriculture in Developing Countries," Energy Policy 13: 330-334.
Bruton, Henry J. (1985) "The Search for a Development Economics," World Development 13: 1099-1124.
Chenery, Hollis, Sherman Robinson, and Moshe Syrquin (1986). Industrialization and Growth: A Comparative Study. New York: Oxford University Press.
Cole, Arthur H. (1970). "The Mystery of Fuel Wood Marketing in the United States," Business History Review 44: 333-59.
Cole, Arthur H. (1938). Wholesale Commodity Prices in the United States, 1700-1861. Cambridge: Harvard University Press.
Cole, G.D.H., and Raymond Postgate (1938). The British Common People, 1746-1938. New York: Knopf.
Connell, K. N. (1950) The Population of Ireland 1750-1845. Oxford: Oxford University Press.
Cowan, Ruth Schwartz. (1976) "The 'Industrial Revolution' in the Home: Household Technology and Social Change in the 2oth Century," Technologv and Culture 17: 1-23.
Deane, Phyllis, and W.A. Cole (1962). British Economic Growth, 16881959. 2nd Ed. Cambridge: Cambridge University Press.
Devine, Warren D., Jr. (1983) "From Shafts to Wires: Historical Perspective on Electrification," Journal of Economic History 43: 347372.
Dewhurst, J. Frederic and Associates (1955). America's Needs and Resources: A New Survey. New York: Twentieth Century Fund.
East-West Center, Pacific Islands Development Program and Resource Systems Institute. Energy Mission Report: Fiji. Honolulu: East-West Center, 1982a.
East-West Center, Pacific Islands Development Program and Resource Systems Institute. Energy Mission Report: Solomon Islands. Honolulu: East-West Center, 1982b.
55

56
Gilboy, Elizabeth W. (1934). Wages in Eighteenth-Century England. Cambridge: Harvard University Press.
Government of Liberia, Department of Energy (GOL/DOE). (1987). "1986 Liberia Energy Balance." mimeo. Monrovia: Department of Energy, June.
Hannah, Leslie (1979). Electricity Before Nationalization: A Study of the Development of the Electricity Supply Industry in Britain to 1948. Baltimore: Johns Hopkins University Press.
Humphrey, William S., and Joe Stanislaw (1979). "Economic Growth and Energy Consumption in the UK, 1700-1975," Energy Policy 7: 29-42.
Hyde, Charles K. (1979). Technologicl Change and the British Iron Industry, 1700-1870. Princeton: Princeton University Press.
Jevons, W. Stanley (1903). The Coal Question. Third Edition, Revised. A.W. Flux (ed.) New York: Macmillan. Reprinted by Kelley Reprints, 1965.
Jones, Donald W. (1986). "Urbanization and Energy Use in Economic Development." mimeo. Oak Ridge, Tenn.: Oak Ridge National Laboratory.
Latham, A.J.H. (1978) The International Economy and the Undeveloped World. 1865-1914. London: Croom Helm.
Latham, A.J.H. (1981) The Depression and the Developing World, 19141939. London: Croom Helm.
Lebergott, Stanley (1976). The American Economy: Income, Wealth, and Want. Princeton: Princeton University Press.
Lindstrom, Diane (1978). Economic Development in the Philadelphia Region, 1810-1850. New York: Columbia University Press.
McKay, John P. (1976). Tramways and Trolleys: The Rise of Urbain Mass Transport in Europe. Princeton: Princeton University Press.
Mitchell, B. R., with the collaboration of Phyllis Deane. (1971) Abstract of British Historical Statistics. Cambridge: Cambridge University Press.
Morrison, Bonnie Maas (1982). "Household Energy Consumption, 1900-1980: A Quantitative History." In George H. Daniels and Mark H. Rose (eds), Energy and Transport Historical Perspectives on Policy Issues. Beverly Hills: Sage, pp 201-233.
Morrison, Warren E., and Charles L. Readling (1968). An Energy Model for the United States, Featuring Energy Balances for the Years 1947 to 1965 and Projections and Forecasts to the Years 1890 and 2000. U.S. Department of the Interior, Bureau of Mines, Information Circular 8384. Washington: U.S. Government Printing Office.

57
OECD (1984). Energy Balances of OC.D countries, 1970/1982. Paris: OECD. Pawson, Eric (1979). The Early Industrial Revolution: Britain in the
Eighteenth Century. New York: Harper & Row.
Potter, Neal, and Francis T. Christy, Jr. (1962) Trends in Natural Resource Commodities. Baltimore: Johns Hopkins University Press.
Proops, John L.R. (1984). "Modelling the Eaergy-Output RAtio," E Economics 7: 47-51.
Putnam, Palmer C. (1953). Energy in the Future. Princeton: Van Nostrand.
Revelle, Roger (1976). "Energy Use in Rural India," Science 192: 96975.
Rose, Mark H. (1984) "Urban Environments and Technological Innovation: Energy Choices in Denver and Kansas City, 1900-1940," Technology and Culture 25: 503-529.
Rose, Mark H., and John G. Clark. (1979) "Light, Heat, and Power;Energy Choices in Kansas City, Wichita, and Denver, 1900-1935," Journal of Urban History 5: 340-364.
Rybczynski, Witold (1986). Home: A Short History of an Idea. New York: Viking.
Samuels, Garland (1985a). Liberian Energy Consumption and Sectoral Distribution for 1981. ORNL/TM-9424. Oak Ridge, Tenn.: Oak RidgeNational Laboratory.
Samuels, Garland (1985b). The Outlook for Electricity Supply and Demand. ORNL/TM-9469. Oak Ridge, Tenn.: Oak Ridge National Laboratory.
Sargent, C.S. (1879). "The Forests of United States inthe Their Economic Aspects," Census of Manufactures, Volume 9. Washington: U.S. Government Printing Office.
Schurr, Sam H. (1983). "Energy Efficiency and Economic Efficiency: An Historical Perspective." In Sam H. Schurr, Sidney Sonenblum, and David 0. Wood (eds), Energy. Productivity, and Economic Growth. Cambridge, Mass.: Oelgeschlager, Gunn & Hamn, pp 203-14.
Schurr, Sam H., and Bruce C. Netschert, with Vera F. Eliasberg, JosephLerner, and Hans H. Landsberg (1960). Energy in the American Economy,1850-1975: An Economic Study of Its History and Prospects. Baltimore: Johns Hopkins University Press.

58
UNDP/World Bank (December 1985). Ecuador Issues and Options in the Energy Sector. Washington: UNDP/World Bank.
UNDP/World Bank (September 1985). Thailand: Issues and Options in the Energy Sector. Washington: UNDP/World Bank.
UNDP/World Bank (June 1985). Burma: Issues and Options in the Energy Sector. Washington: UNDP/World Bank.
UNDP/World Bank (June 1985). Togo: Issues and Options in the Energy Sector. Washington: UNDP/World Bank.
UNDP/World Bank (December 1984). Liberia: Issues and Options in the Energy.Secto . Washington: UNDP/World Bank.
UNDP/World Bank (January 1984). Peru: Issues and Options in the Energ Sector. Washington: UNDP/World Bank.
UNDP/World Bank (July 1983). Sudan: Issues and Options in the Energy Sector. Washington: UNDP/World Bank.
UNDP/World Bank (June 1983). Fiji: Issues and Options in the Energy Sector. Washington: UNDP/World Bank.
UNDP/World Bank (June 1983). Solomon Islands: Issues and Options in the Energy Sector. Washington: UNDP/World Bank.
TJNDP/World Bank (April 1983). Bolivia: Issues and Options in the Energy Sector. Washington: UNDP/World Bank.
U.S. Agency for International Development/Pakistan (1987). Pakistan National Energy Balance, 1983/84. Islamabad: USAID.
U.S. Department of Commerce, Bureau of the Census. (1965) The Statistical History of the United States from Colonial Times to the Present. Stamford, Conn.: Fairfield.
U. S. Department of C-mmerce, Bureau of the Census (1975). Historical Statistics of the United States, Colonial Times to 1970. Part 2. Washington: U.S. Government Printing Office.
U.S. Department of Energy (DOE), Assistant Secretary for International Affairs (1979). Joint Egypt/United States Report on Egvtt/United States Cooperative Energy Assessment, Volume 3, Annexes 2-5. Washington, D.C.: U.S. Government Printing Office, April.
Woolf, Arthur G. (1987) "The Residential Adoption of Electricity in Early Twentieth-Century America," Energy Journal 8: 19-30..
World Bank (1983). World Tables. 3rd Ed. Volumes I and II, Baltimore: Johns Hopkins University Press.

1. B. L. Bush 2. A. W. Campbell 3. J. Christian 4. L. M. Cochran 5. T. R. Curlee 6. J. Evans 7. W. Fulkerson 8. C. L. Gaudreau 9. R. K. Goel
10. D. L. Greene 11. G. Harrison 12. L. J. Hill 13. E. L. Hillsman 1.4. M. C. Holcomb 15. J. K. Hunt
16-40. D. W. Jones 41. C. R. Kerley 42. R. Lee 43. P. N. Leiby 44. L. N. McCold
INTERNAL DISTRIBUTION
45. 46. 47. 48. 49. 50. 51. 52. 53. 54. 55. 56. 57. 58. 59. 60. 61. 62.
63-65. 66.
W. R. Mixon H. Perez Blanco R. D. Perlack A. M. Perry C. H. Petrich S. Rayner D. E. Reichle L. W. Rickert E. Rogers R. D. Roop R. B. Shelton C. G. Stevenson P. J. Sullivan E. J. Szarleta T. J. Wilbanks ORNL Patent Office Central Research Library Document Reference Section Laboratory Records Laboratory Records -RC
EXTERNAL DISTRIBUTION
67. J. J. Cuttica, Vice President of Research and Development, Gas Research Institute, 8600 W. Bryn Mawr Avenue, Chicago, IL 60631
68. Mr. David J. Jhirad, Office of Energy, U.S. Agency for International Development, SA-18, Room 509, Washington, DC 20523
69. J. P. Kalt, Professor of Economics, Kennedy School of Government, Harvard University, 70 John F. Kennedy Street, Cambridge, MA 02138
70. D. E. Morrison, Professor of Sociology, Michigan State University, 201 Berkey Hall, East Lansing, MI 48824-1111
71. R. L. Perrine, Professor, Engineering and Applied Sciences, Civil Engineering Department, Engineering I, Room 2066, University of California, Los Angeles, CA 90024
72. Mr. Alberto Sabadell, Office of Energy, U.S. Agency for International Development, SA-18, Room 509, Washington, DC 20523
59

60
73. Mr. James B. Sullivan, Office of Energy, U.S. Agency for International Development, SA-18, Room 509, Washington, DC 20523
74. Ms. Shirley Toth, Office of Energy, U.S. Agency for International Development, SA-18, Room 509, Washington, DC 20523
75. Office of Assistant Manager for Energy Research and Development, DOE/ORO, P.O. Box 2001, Oak Ridge, TN 37831-8600
76-85. OSTI, U.S. Department of Energy, P.O. Box 62, Oak Ridge, TN 37831