Embed Size (px)
Citation preview
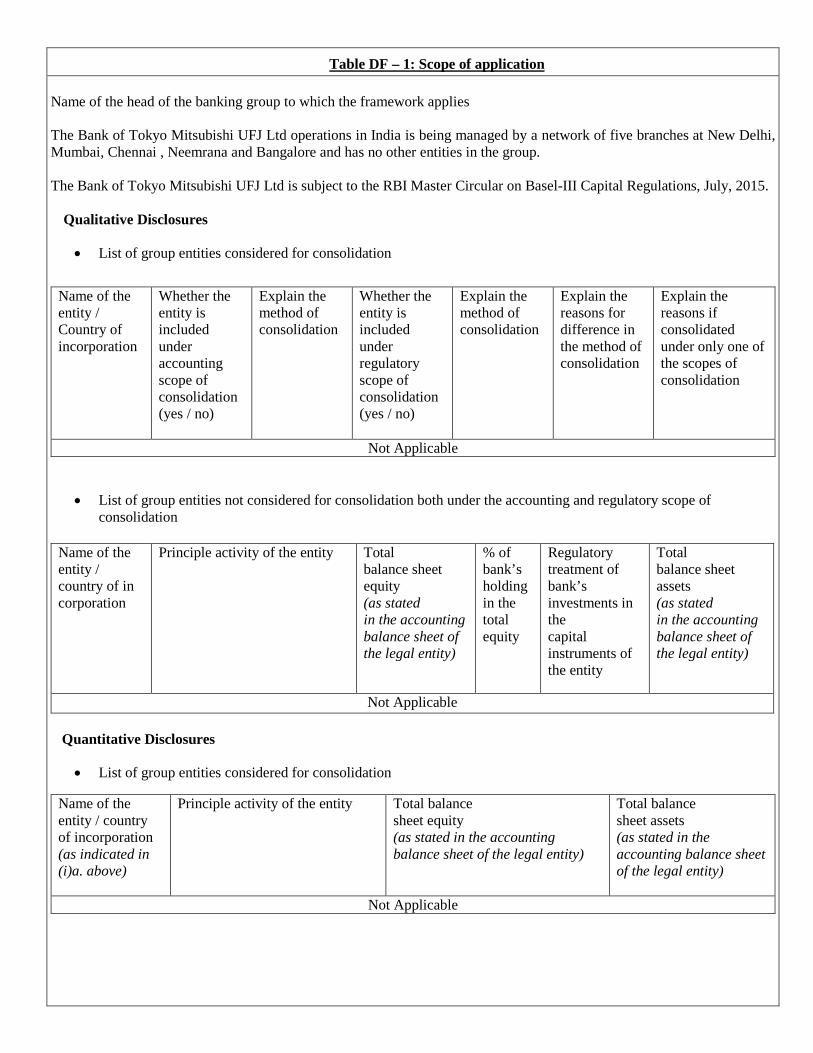
Table DF – 1: Scope of application
Name of the head of the banking group to which the framework applies The Bank of Tokyo Mitsubishi UFJ Ltd operations in India is being managed by a network of five branches at New Delhi, Mumbai, Chennai , Neemrana and Bangalore and has no other entities in the group. The Bank of Tokyo Mitsubishi UFJ Ltd is subject to the RBI Master Circular on Basel-III Capital Regulations, July, 2015.
Qualitative Disclosures
• List of group entities considered for consolidation
• List of group entities not considered for consolidation both under the accounting and regulatory scope of consolidation
Quantitative Disclosures
• List of group entities considered for consolidation
Name of the entity / Country of incorporation
Whether the entity is included under accounting scope of consolidation (yes / no)
Explain the method of consolidation
Whether the entity is included under regulatory scope of consolidation (yes / no)
Explain the method of consolidation
Explain the reasons for difference in the method of consolidation
Explain the reasons if consolidated under only one of the scopes of consolidation
Not Applicable
Name of the entity / country of in corporation
Principle activity of the entity Total balance sheet equity (as stated in the accounting balance sheet of the legal entity)
% of bank’s holding in the total equity
Regulatory treatment of bank’s investments in the capital instruments of the entity
Total balance sheet assets (as stated in the accounting balance sheet of the legal entity)
Not Applicable
Name of the entity / country of incorporation (as indicated in (i)a. above)
Principle activity of the entity Total balance sheet equity (as stated in the accounting balance sheet of the legal entity)
Total balance sheet assets (as stated in the accounting balance sheet of the legal entity)
Not Applicable
Qualitative Disclosures
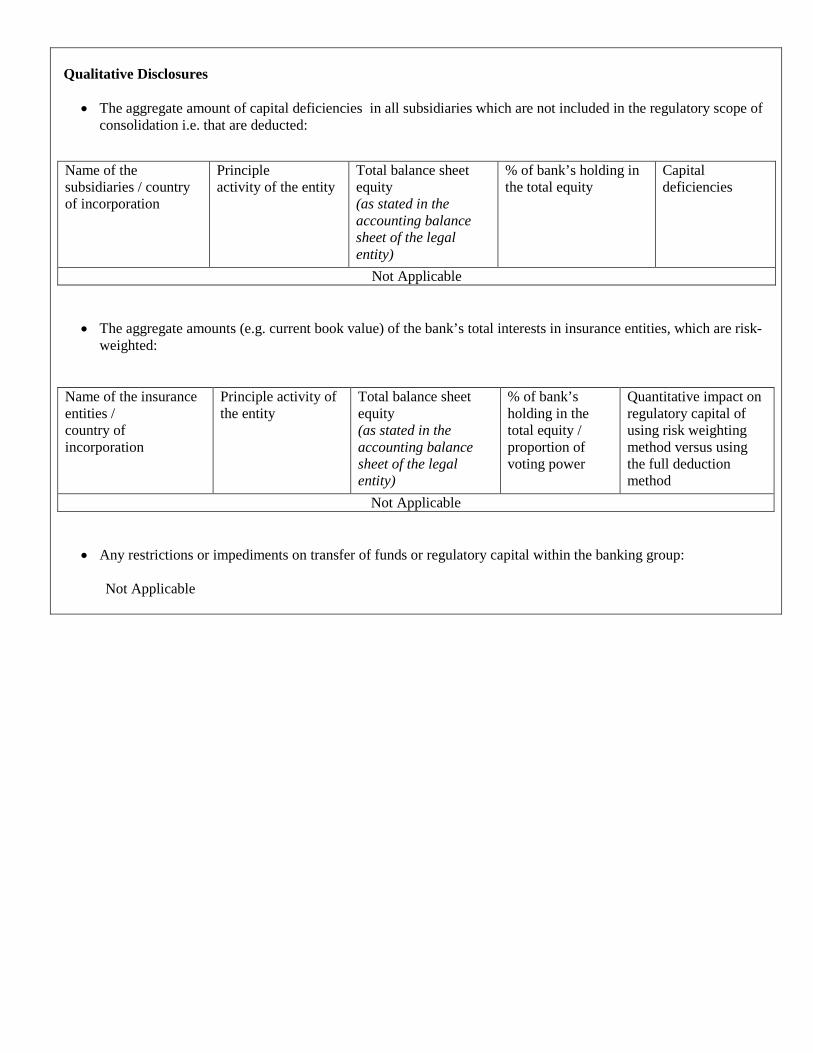
• The aggregate amount of capital deficiencies in all subsidiaries which are not included in the regulatory scope of
consolidation i.e. that are deducted:
• The aggregate amounts (e.g. current book value) of the bank’s total interests in insurance entities, which are risk-
weighted:
• Any restrictions or impediments on transfer of funds or regulatory capital within the banking group:
Not Applicable
Name of the subsidiaries / country of incorporation
Principle activity of the entity
Total balance sheet equity (as stated in the accounting balance sheet of the legal entity)
% of bank’s holding in the total equity
Capital deficiencies
Not Applicable
Name of the insurance entities / country of incorporation
Principle activity of the entity
Total balance sheet equity (as stated in the accounting balance sheet of the legal entity)
% of bank’s holding in the total equity / proportion of voting power
Quantitative impact on regulatory capital of using risk weighting method versus using the full deduction method
Not Applicable
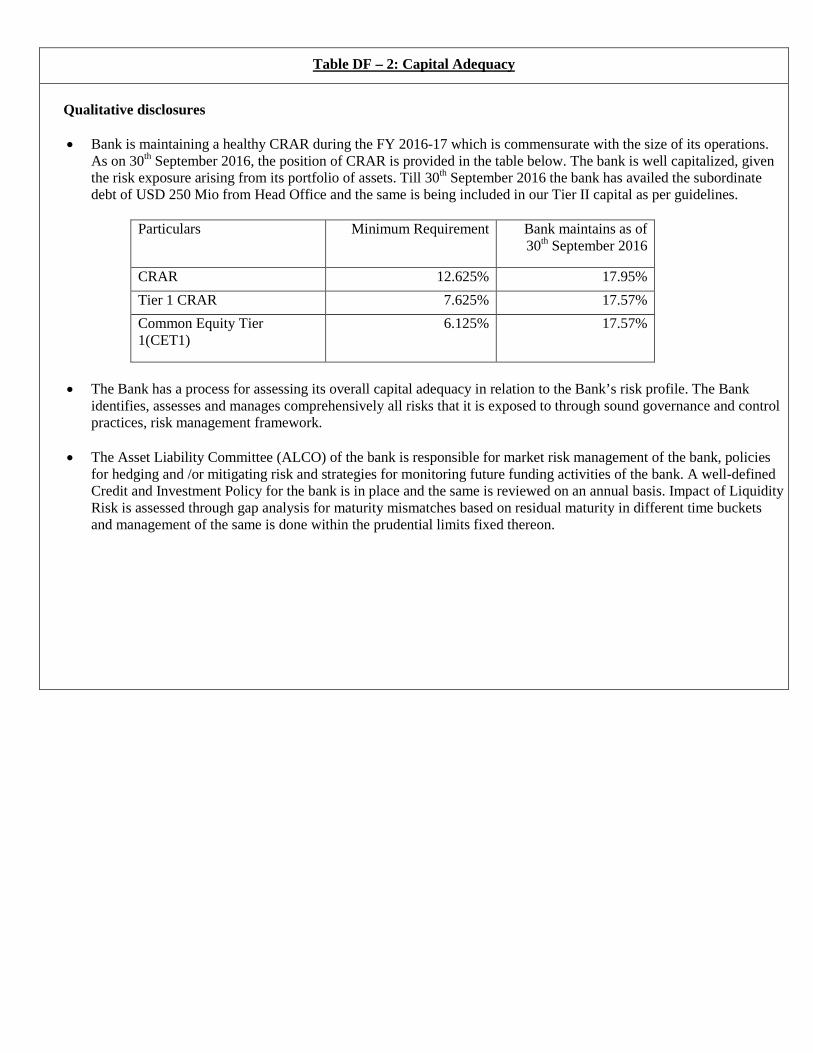
Table DF – 2: Capital Adequacy Qualitative disclosures
• Bank is maintaining a healthy CRAR during the FY 2016-17 which is commensurate with the size of its operations.
As on 30th September 2016, the position of CRAR is provided in the table below. The bank is well capitalized, given the risk exposure arising from its portfolio of assets. Till 30th September 2016 the bank has availed the subordinate debt of USD 250 Mio from Head Office and the same is being included in our Tier II capital as per guidelines.
Particulars Minimum Requirement Bank maintains as of
30th September 2016
CRAR 12.625% 17.95% Tier 1 CRAR 7.625% 17.57% Common Equity Tier 1(CET1)
6.125% 17.57%
• The Bank has a process for assessing its overall capital adequacy in relation to the Bank’s risk profile. The Bank
identifies, assesses and manages comprehensively all risks that it is exposed to through sound governance and control practices, risk management framework.
• The Asset Liability Committee (ALCO) of the bank is responsible for market risk management of the bank, policies
for hedging and /or mitigating risk and strategies for monitoring future funding activities of the bank. A well-defined Credit and Investment Policy for the bank is in place and the same is reviewed on an annual basis. Impact of Liquidity Risk is assessed through gap analysis for maturity mismatches based on residual maturity in different time buckets and management of the same is done within the prudential limits fixed thereon.
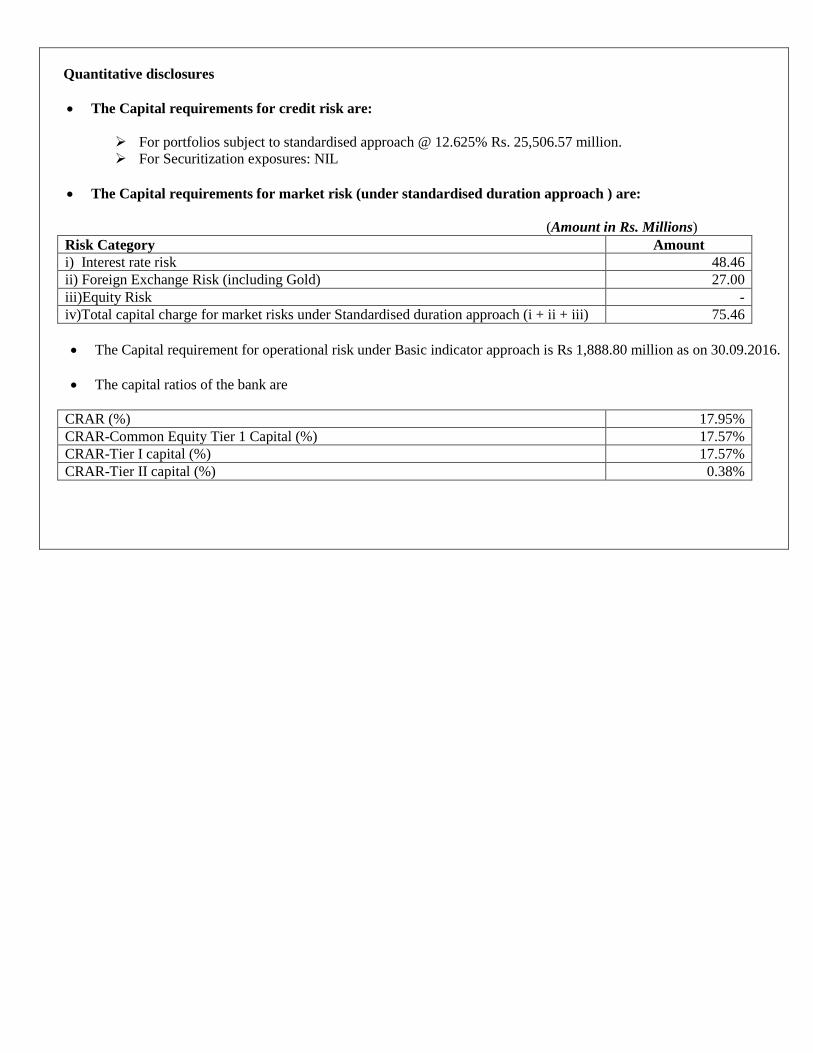
Quantitative disclosures
• The Capital requirements for credit risk are:
For portfolios subject to standardised approach @ 12.625% Rs. 25,506.57 million. For Securitization exposures: NIL
• The Capital requirements for market risk (under standardised duration approach ) are:
(Amount in Rs. Millions) Risk Category Amount i) Interest rate risk 48.46 ii) Foreign Exchange Risk (including Gold) 27.00 iii)Equity Risk - iv)Total capital charge for market risks under Standardised duration approach (i + ii + iii) 75.46 • The Capital requirement for operational risk under Basic indicator approach is Rs 1,888.80 million as on 30.09.2016.
• The capital ratios of the bank are
CRAR (%) 17.95% CRAR-Common Equity Tier 1 Capital (%) 17.57% CRAR-Tier I capital (%) 17.57% CRAR-Tier II capital (%) 0.38%
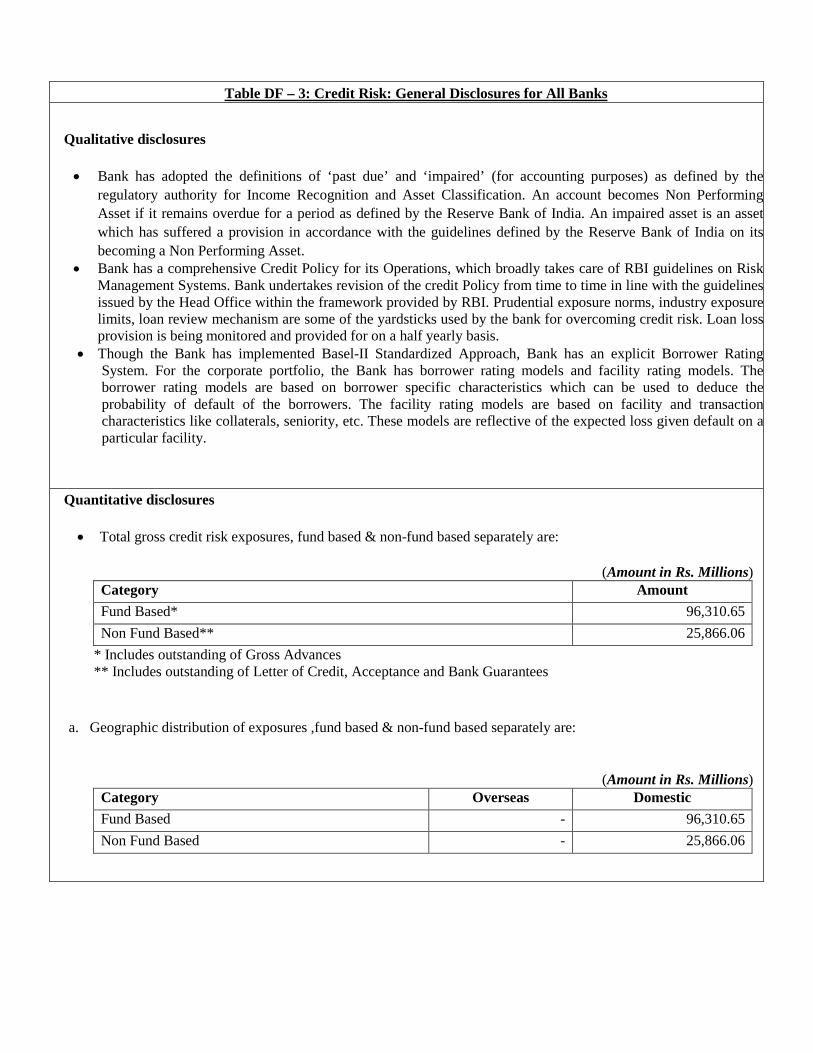
Table DF – 3: Credit Risk: General Disclosures for All Banks
Qualitative disclosures
• Bank has adopted the definitions of ‘past due’ and ‘impaired’ (for accounting purposes) as defined by the regulatory authority for Income Recognition and Asset Classification. An account becomes Non Performing Asset if it remains overdue for a period as defined by the Reserve Bank of India. An impaired asset is an asset which has suffered a provision in accordance with the guidelines defined by the Reserve Bank of India on its becoming a Non Performing Asset.
• Bank has a comprehensive Credit Policy for its Operations, which broadly takes care of RBI guidelines on Risk Management Systems. Bank undertakes revision of the credit Policy from time to time in line with the guidelines issued by the Head Office within the framework provided by RBI. Prudential exposure norms, industry exposure limits, loan review mechanism are some of the yardsticks used by the bank for overcoming credit risk. Loan loss provision is being monitored and provided for on a half yearly basis.
• Though the Bank has implemented Basel-II Standardized Approach, Bank has an explicit Borrower Rating System. For the corporate portfolio, the Bank has borrower rating models and facility rating models. The borrower rating models are based on borrower specific characteristics which can be used to deduce the probability of default of the borrowers. The facility rating models are based on facility and transaction characteristics like collaterals, seniority, etc. These models are reflective of the expected loss given default on a particular facility.
Quantitative disclosures
• Total gross credit risk exposures, fund based & non-fund based separately are:
(Amount in Rs. Millions) Category Amount Fund Based* 96,310.65 Non Fund Based** 25,866.06
* Includes outstanding of Gross Advances ** Includes outstanding of Letter of Credit, Acceptance and Bank Guarantees
a. Geographic distribution of exposures ,fund based & non-fund based separately are:
(Amount in Rs. Millions)
Category Overseas Domestic Fund Based - 96,310.65 Non Fund Based - 25,866.06
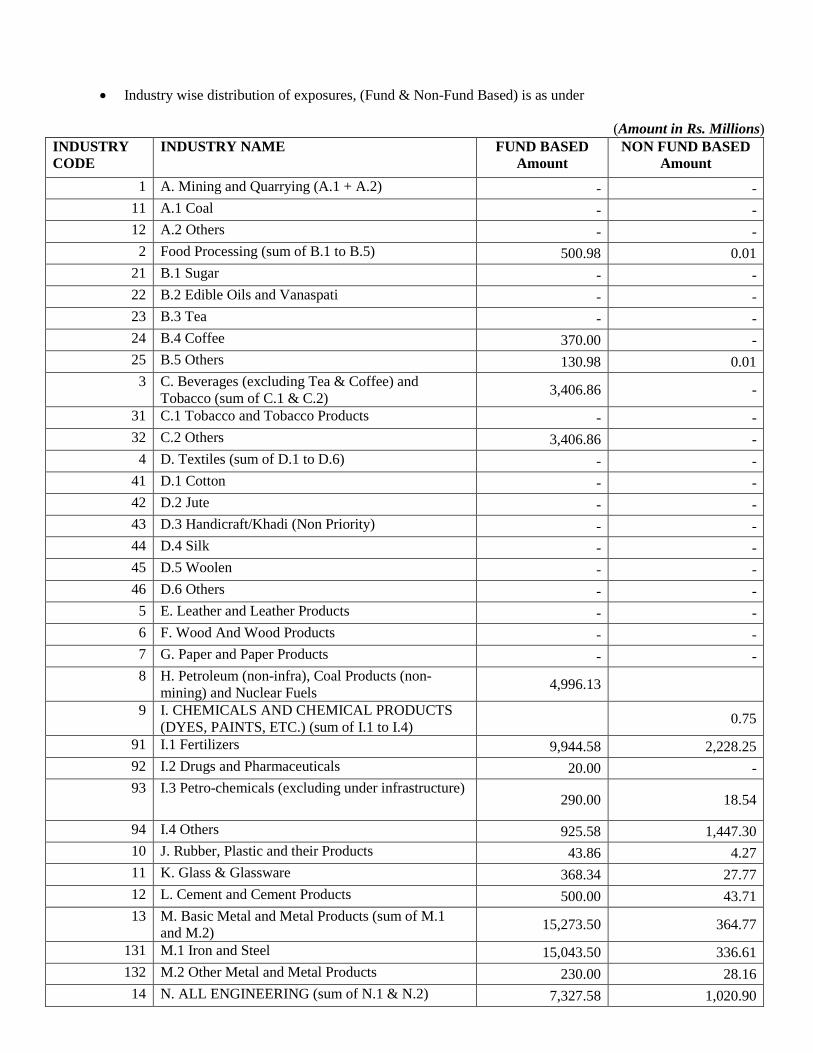
• Industry wise distribution of exposures, (Fund & Non-Fund Based) is as under
(Amount in Rs. Millions)
INDUSTRY CODE
INDUSTRY NAME FUND BASED Amount
NON FUND BASED Amount
1 A. Mining and Quarrying (A.1 + A.2) - - 11 A.1 Coal - - 12 A.2 Others - - 2 Food Processing (sum of B.1 to B.5) 500.98 0.01
21 B.1 Sugar - - 22 B.2 Edible Oils and Vanaspati - - 23 B.3 Tea - - 24 B.4 Coffee 370.00 - 25 B.5 Others 130.98 0.01 3 C. Beverages (excluding Tea & Coffee) and
Tobacco (sum of C.1 & C.2) 3,406.86 -
31 C.1 Tobacco and Tobacco Products - - 32 C.2 Others 3,406.86 - 4 D. Textiles (sum of D.1 to D.6) - -
41 D.1 Cotton - - 42 D.2 Jute - - 43 D.3 Handicraft/Khadi (Non Priority) - - 44 D.4 Silk - - 45 D.5 Woolen - - 46 D.6 Others - - 5 E. Leather and Leather Products - - 6 F. Wood And Wood Products - - 7 G. Paper and Paper Products - - 8 H. Petroleum (non-infra), Coal Products (non-
mining) and Nuclear Fuels 4,996.13
9 I. CHEMICALS AND CHEMICAL PRODUCTS (DYES, PAINTS, ETC.) (sum of I.1 to I.4) 0.75
91 I.1 Fertilizers 9,944.58 2,228.25 92 I.2 Drugs and Pharmaceuticals 20.00 - 93 I.3 Petro-chemicals (excluding under infrastructure)
290.00 18.54
94 I.4 Others 925.58 1,447.30 10 J. Rubber, Plastic and their Products 43.86 4.27 11 K. Glass & Glassware 368.34 27.77 12 L. Cement and Cement Products 500.00 43.71 13 M. Basic Metal and Metal Products (sum of M.1
and M.2) 15,273.50 364.77
131 M.1 Iron and Steel 15,043.50 336.61 132 M.2 Other Metal and Metal Products 230.00 28.16
14 N. ALL ENGINEERING (sum of N.1 & N.2) 7,327.58 1,020.90
141 N.1 Electronics 372.73 199.86 142 N.2 Others 6,954.85 821.04
15 O. Vehicles, Vehicle Parts and Transport Equipments 13,891.91 772.60
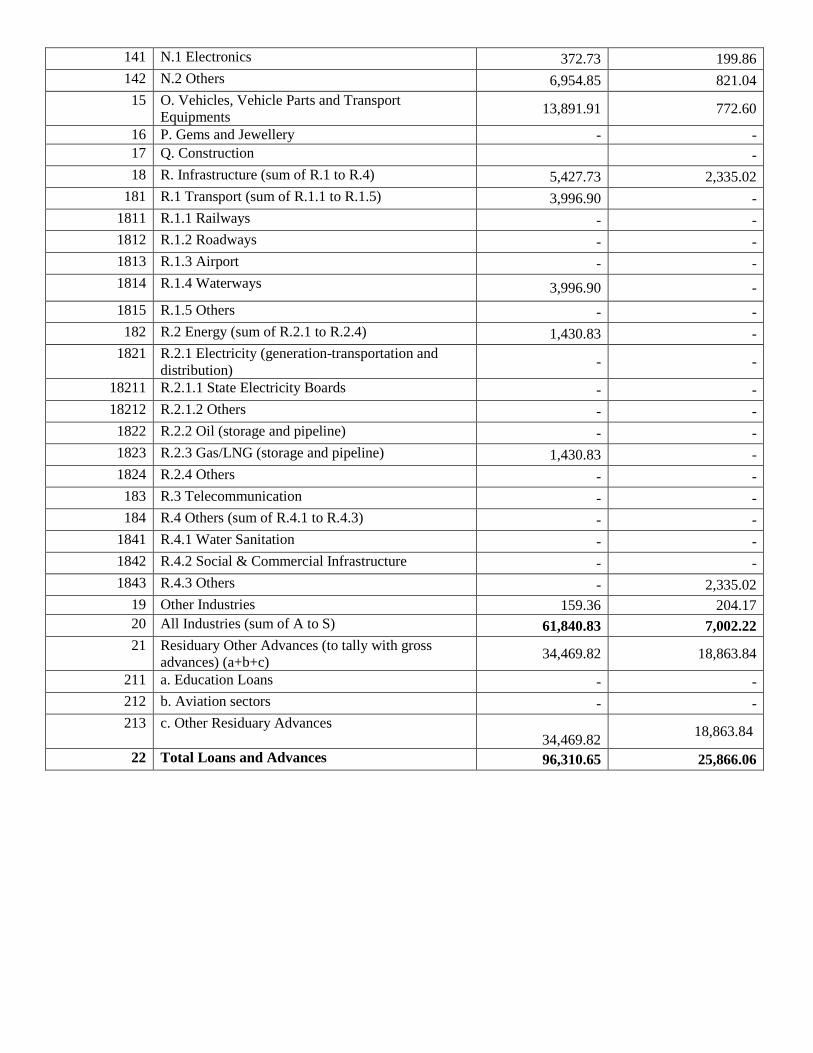
16 P. Gems and Jewellery - - 17 Q. Construction - 18 R. Infrastructure (sum of R.1 to R.4) 5,427.73 2,335.02
181 R.1 Transport (sum of R.1.1 to R.1.5) 3,996.90 - 1811 R.1.1 Railways - - 1812 R.1.2 Roadways - - 1813 R.1.3 Airport - - 1814 R.1.4 Waterways 3,996.90 - 1815 R.1.5 Others - - 182 R.2 Energy (sum of R.2.1 to R.2.4) 1,430.83 -
1821 R.2.1 Electricity (generation-transportation and distribution) - -
18211 R.2.1.1 State Electricity Boards - - 18212 R.2.1.2 Others - - 1822 R.2.2 Oil (storage and pipeline) - - 1823 R.2.3 Gas/LNG (storage and pipeline) 1,430.83 - 1824 R.2.4 Others - - 183 R.3 Telecommunication - - 184 R.4 Others (sum of R.4.1 to R.4.3) - -
1841 R.4.1 Water Sanitation - - 1842 R.4.2 Social & Commercial Infrastructure - - 1843 R.4.3 Others - 2,335.02
19 Other Industries 159.36 204.17 20 All Industries (sum of A to S) 61,840.83 7,002.22 21 Residuary Other Advances (to tally with gross
advances) (a+b+c) 34,469.82 18,863.84
211 a. Education Loans - - 212 b. Aviation sectors - - 213 c. Other Residuary Advances
34,469.82 18,863.84
22 Total Loans and Advances 96,310.65 25,866.06
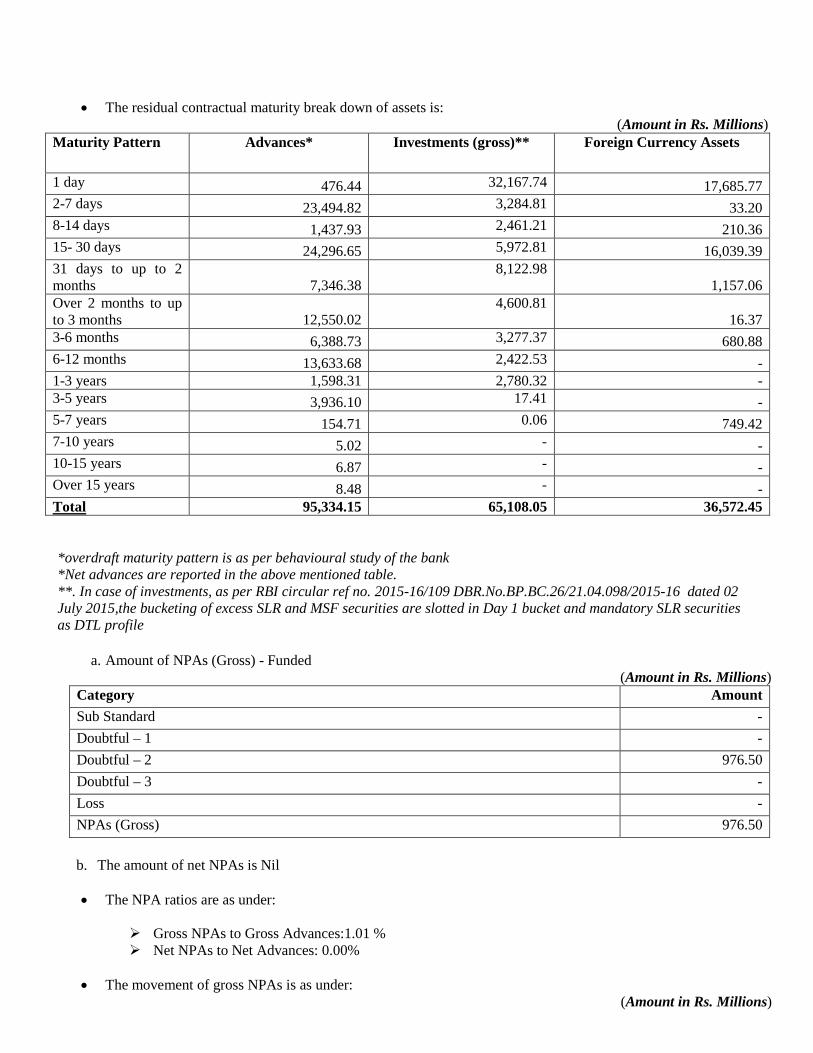
• The residual contractual maturity break down of assets is: (Amount in Rs. Millions)
Maturity Pattern Advances* Investments (gross)** Foreign Currency Assets
1 day 476.44 32,167.74 17,685.77 2-7 days 23,494.82 3,284.81 33.20 8-14 days 1,437.93 2,461.21 210.36 15- 30 days 24,296.65 5,972.81 16,039.39 31 days to up to 2 months 7,346.38
8,122.98 1,157.06
Over 2 months to up to 3 months 12,550.02
4,600.81 16.37
3-6 months 6,388.73 3,277.37 680.88 6-12 months 13,633.68 2,422.53 - 1-3 years 1,598.31 2,780.32 - 3-5 years 3,936.10 17.41 - 5-7 years 154.71 0.06 749.42 7-10 years 5.02 - - 10-15 years 6.87 - - Over 15 years 8.48 - - Total 95,334.15 65,108.05 36,572.45 *overdraft maturity pattern is as per behavioural study of the bank *Net advances are reported in the above mentioned table. **. In case of investments, as per RBI circular ref no. 2015-16/109 DBR.No.BP.BC.26/21.04.098/2015-16 dated 02 July 2015,the bucketing of excess SLR and MSF securities are slotted in Day 1 bucket and mandatory SLR securities as DTL profile
a. Amount of NPAs (Gross) - Funded (Amount in Rs. Millions)
Category Amount Sub Standard - Doubtful – 1 - Doubtful – 2 976.50 Doubtful – 3 - Loss - NPAs (Gross) 976.50
b. The amount of net NPAs is Nil
• The NPA ratios are as under:
Gross NPAs to Gross Advances:1.01 % Net NPAs to Net Advances: 0.00%
• The movement of gross NPAs is as under:
(Amount in Rs. Millions)
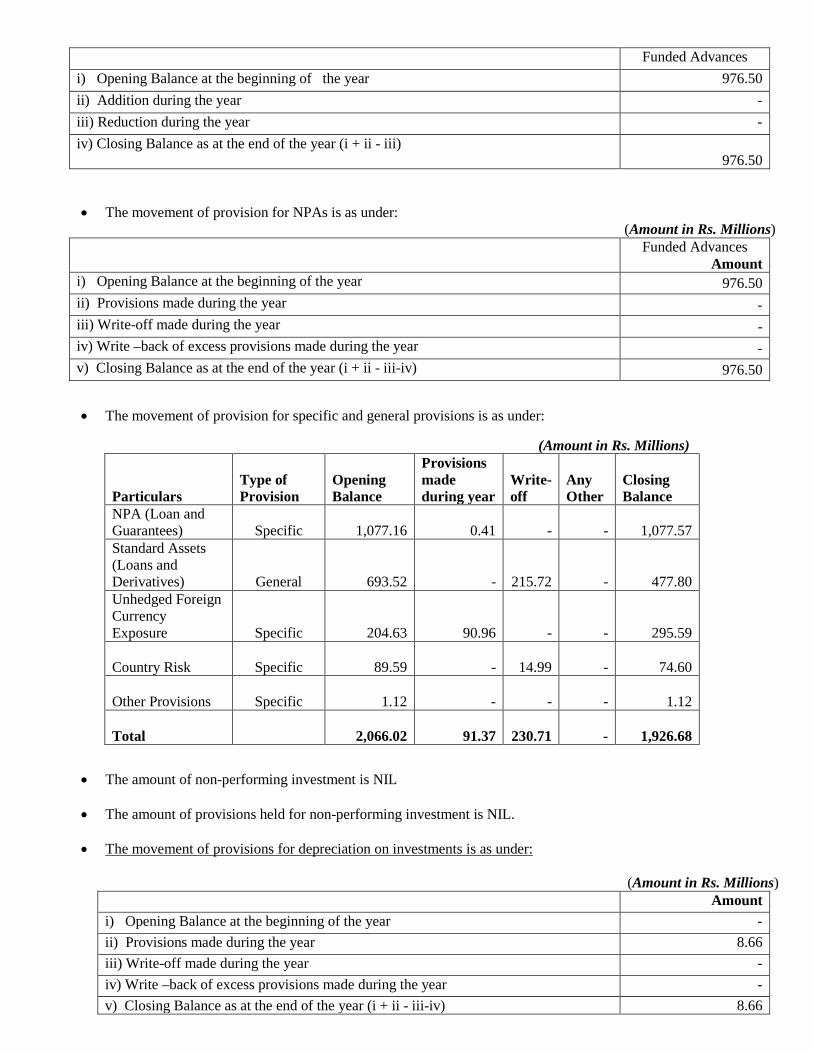
Funded Advances i) Opening Balance at the beginning of the year 976.50 ii) Addition during the year - iii) Reduction during the year - iv) Closing Balance as at the end of the year (i + ii - iii)
976.50
• The movement of provision for NPAs is as under: (Amount in Rs. Millions)
Funded Advances Amount
i) Opening Balance at the beginning of the year 976.50 ii) Provisions made during the year - iii) Write-off made during the year - iv) Write –back of excess provisions made during the year - v) Closing Balance as at the end of the year (i + ii - iii-iv) 976.50
• The movement of provision for specific and general provisions is as under:
(Amount in Rs. Millions)
Particulars Type of Provision
Opening Balance
Provisions made during year
Write-off
Any Other
Closing Balance
NPA (Loan and Guarantees) Specific 1,077.16
0.41
-
- 1,077.57
Standard Assets (Loans and Derivatives) General 693.52 -
215.72
- 477.80
Unhedged Foreign Currency Exposure Specific 204.63 90.96
-
- 295.59
Country Risk Specific 89.59 -
14.99
- 74.60
Other Provisions Specific 1.12 -
-
- 1.12
Total 2,066.02
91.37 230.71
- 1,926.68
• The amount of non-performing investment is NIL
• The amount of provisions held for non-performing investment is NIL.
• The movement of provisions for depreciation on investments is as under:
(Amount in Rs. Millions) Amount i) Opening Balance at the beginning of the year - ii) Provisions made during the year 8.66 iii) Write-off made during the year - iv) Write –back of excess provisions made during the year - v) Closing Balance as at the end of the year (i + ii - iii-iv) 8.66
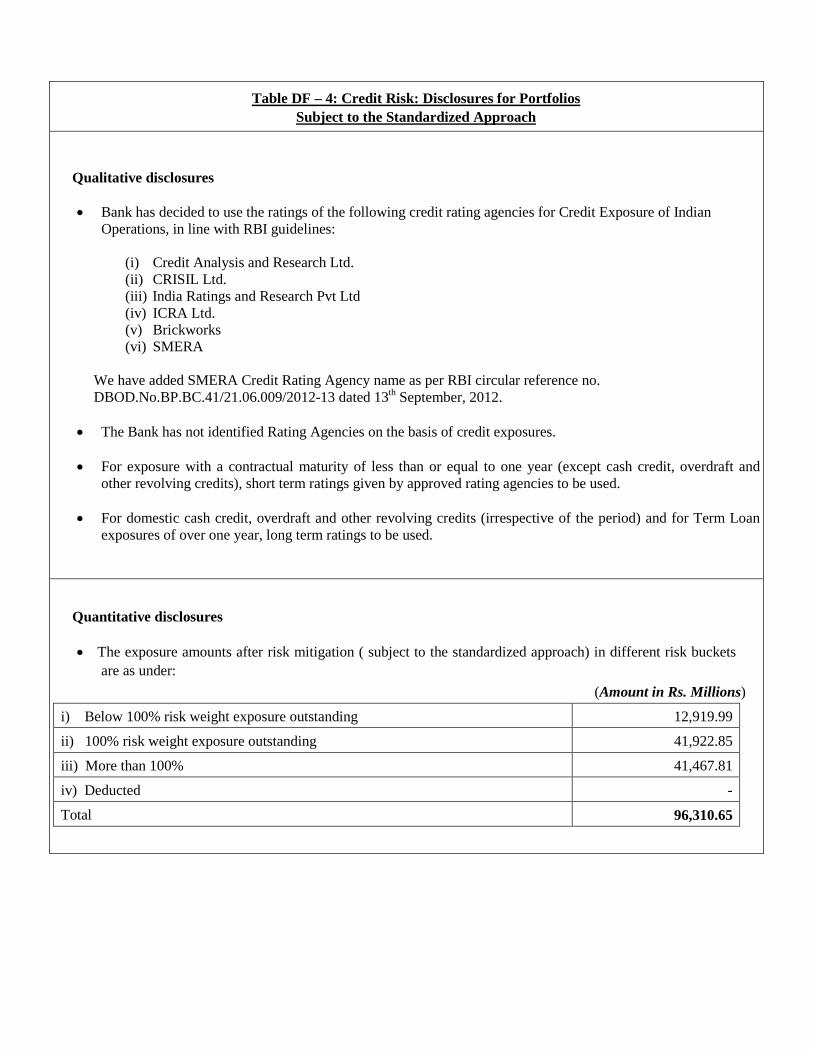
Table DF – 4: Credit Risk: Disclosures for Portfolios Subject to the Standardized Approach
Qualitative disclosures • Bank has decided to use the ratings of the following credit rating agencies for Credit Exposure of Indian
Operations, in line with RBI guidelines:
(i) Credit Analysis and Research Ltd. (ii) CRISIL Ltd. (iii) India Ratings and Research Pvt Ltd (iv) ICRA Ltd. (v) Brickworks (vi) SMERA
We have added SMERA Credit Rating Agency name as per RBI circular reference no. DBOD.No.BP.BC.41/21.06.009/2012-13 dated 13th September, 2012.
• The Bank has not identified Rating Agencies on the basis of credit exposures.
• For exposure with a contractual maturity of less than or equal to one year (except cash credit, overdraft and other revolving credits), short term ratings given by approved rating agencies to be used.
• For domestic cash credit, overdraft and other revolving credits (irrespective of the period) and for Term Loan exposures of over one year, long term ratings to be used.
Quantitative disclosures • The exposure amounts after risk mitigation ( subject to the standardized approach) in different risk buckets
are as under: (Amount in Rs. Millions)
i) Below 100% risk weight exposure outstanding 12,919.99
ii) 100% risk weight exposure outstanding 41,922.85
iii) More than 100% 41,467.81
iv) Deducted -
Total 96,310.65
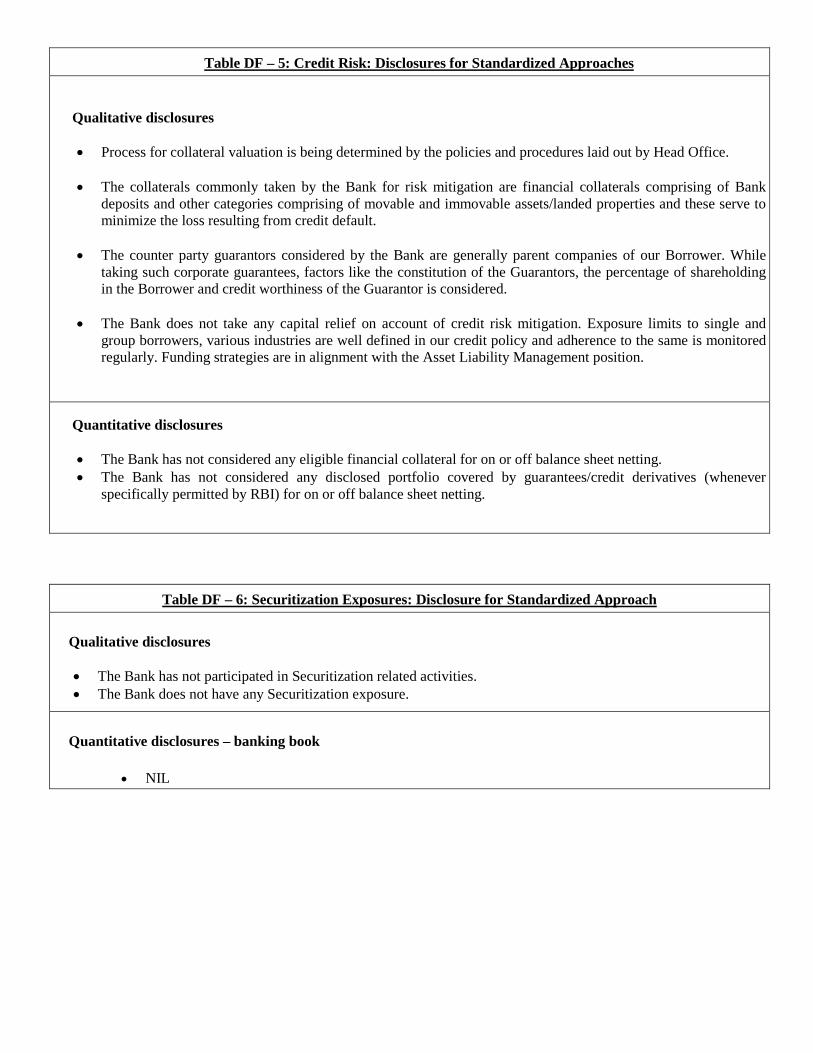
Table DF – 5: Credit Risk: Disclosures for Standardized Approaches
Qualitative disclosures • Process for collateral valuation is being determined by the policies and procedures laid out by Head Office.
• The collaterals commonly taken by the Bank for risk mitigation are financial collaterals comprising of Bank
deposits and other categories comprising of movable and immovable assets/landed properties and these serve to minimize the loss resulting from credit default.
• The counter party guarantors considered by the Bank are generally parent companies of our Borrower. While
taking such corporate guarantees, factors like the constitution of the Guarantors, the percentage of shareholding in the Borrower and credit worthiness of the Guarantor is considered.
• The Bank does not take any capital relief on account of credit risk mitigation. Exposure limits to single and
group borrowers, various industries are well defined in our credit policy and adherence to the same is monitored regularly. Funding strategies are in alignment with the Asset Liability Management position.
Quantitative disclosures • The Bank has not considered any eligible financial collateral for on or off balance sheet netting. • The Bank has not considered any disclosed portfolio covered by guarantees/credit derivatives (whenever
specifically permitted by RBI) for on or off balance sheet netting.
Table DF – 6: Securitization Exposures: Disclosure for Standardized Approach
Qualitative disclosures • The Bank has not participated in Securitization related activities. • The Bank does not have any Securitization exposure.
Quantitative disclosures – banking book
• NIL
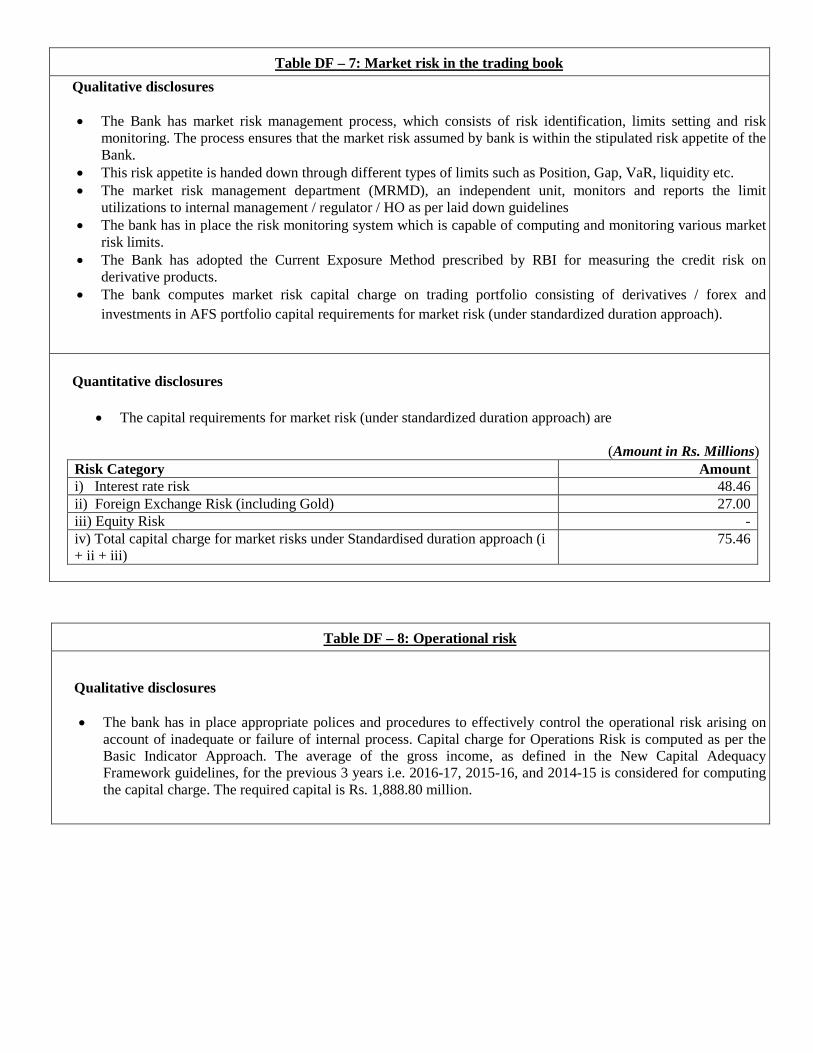
Table DF – 7: Market risk in the trading book Qualitative disclosures • The Bank has market risk management process, which consists of risk identification, limits setting and risk
monitoring. The process ensures that the market risk assumed by bank is within the stipulated risk appetite of the Bank.
• This risk appetite is handed down through different types of limits such as Position, Gap, VaR, liquidity etc. • The market risk management department (MRMD), an independent unit, monitors and reports the limit
utilizations to internal management / regulator / HO as per laid down guidelines • The bank has in place the risk monitoring system which is capable of computing and monitoring various market
risk limits. • The Bank has adopted the Current Exposure Method prescribed by RBI for measuring the credit risk on
derivative products. • The bank computes market risk capital charge on trading portfolio consisting of derivatives / forex and
investments in AFS portfolio capital requirements for market risk (under standardized duration approach).
Quantitative disclosures
• The capital requirements for market risk (under standardized duration approach) are
(Amount in Rs. Millions) Risk Category Amount i) Interest rate risk 48.46 ii) Foreign Exchange Risk (including Gold) 27.00 iii) Equity Risk - iv) Total capital charge for market risks under Standardised duration approach (i + ii + iii)
75.46
Table DF – 8: Operational risk
Qualitative disclosures • The bank has in place appropriate polices and procedures to effectively control the operational risk arising on
account of inadequate or failure of internal process. Capital charge for Operations Risk is computed as per the Basic Indicator Approach. The average of the gross income, as defined in the New Capital Adequacy Framework guidelines, for the previous 3 years i.e. 2016-17, 2015-16, and 2014-15 is considered for computing the capital charge. The required capital is Rs. 1,888.80 million.
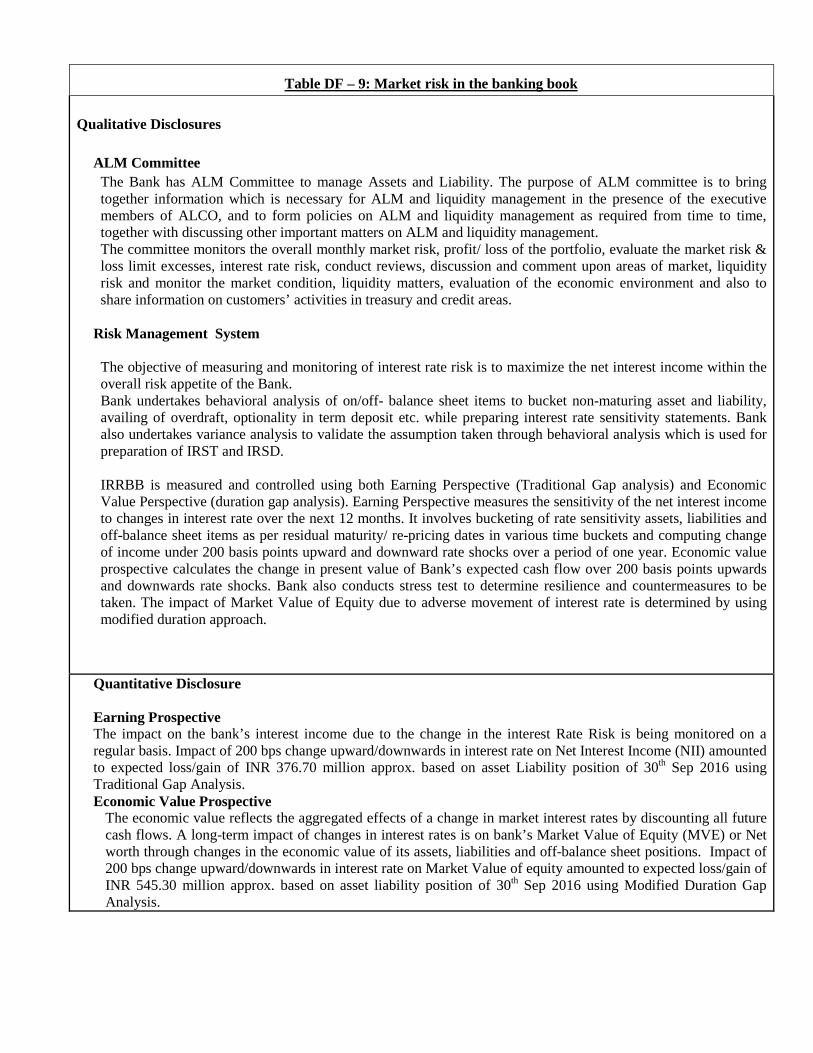
Table DF – 9: Market risk in the banking book
Qualitative Disclosures
ALM Committee The Bank has ALM Committee to manage Assets and Liability. The purpose of ALM committee is to bring together information which is necessary for ALM and liquidity management in the presence of the executive members of ALCO, and to form policies on ALM and liquidity management as required from time to time, together with discussing other important matters on ALM and liquidity management. The committee monitors the overall monthly market risk, profit/ loss of the portfolio, evaluate the market risk & loss limit excesses, interest rate risk, conduct reviews, discussion and comment upon areas of market, liquidity risk and monitor the market condition, liquidity matters, evaluation of the economic environment and also to share information on customers’ activities in treasury and credit areas.
Risk Management System The objective of measuring and monitoring of interest rate risk is to maximize the net interest income within the overall risk appetite of the Bank. Bank undertakes behavioral analysis of on/off- balance sheet items to bucket non-maturing asset and liability, availing of overdraft, optionality in term deposit etc. while preparing interest rate sensitivity statements. Bank also undertakes variance analysis to validate the assumption taken through behavioral analysis which is used for preparation of IRST and IRSD. IRRBB is measured and controlled using both Earning Perspective (Traditional Gap analysis) and Economic Value Perspective (duration gap analysis). Earning Perspective measures the sensitivity of the net interest income to changes in interest rate over the next 12 months. It involves bucketing of rate sensitivity assets, liabilities and off-balance sheet items as per residual maturity/ re-pricing dates in various time buckets and computing change of income under 200 basis points upward and downward rate shocks over a period of one year. Economic value prospective calculates the change in present value of Bank’s expected cash flow over 200 basis points upwards and downwards rate shocks. Bank also conducts stress test to determine resilience and countermeasures to be taken. The impact of Market Value of Equity due to adverse movement of interest rate is determined by using modified duration approach.
Quantitative Disclosure Earning Prospective The impact on the bank’s interest income due to the change in the interest Rate Risk is being monitored on a regular basis. Impact of 200 bps change upward/downwards in interest rate on Net Interest Income (NII) amounted to expected loss/gain of INR 376.70 million approx. based on asset Liability position of 30th Sep 2016 using Traditional Gap Analysis. Economic Value Prospective
The economic value reflects the aggregated effects of a change in market interest rates by discounting all future cash flows. A long-term impact of changes in interest rates is on bank’s Market Value of Equity (MVE) or Net worth through changes in the economic value of its assets, liabilities and off-balance sheet positions. Impact of 200 bps change upward/downwards in interest rate on Market Value of equity amounted to expected loss/gain of INR 545.30 million approx. based on asset liability position of 30th Sep 2016 using Modified Duration Gap Analysis.
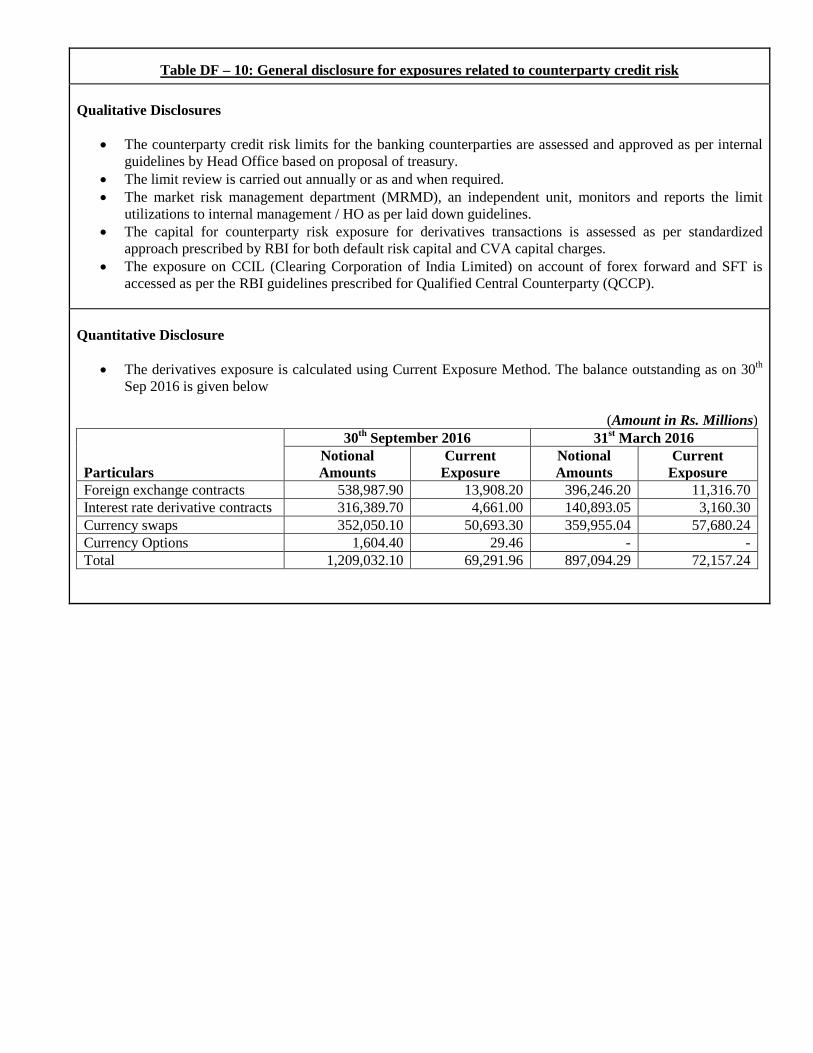
Table DF – 10: General disclosure for exposures related to counterparty credit risk Qualitative Disclosures
• The counterparty credit risk limits for the banking counterparties are assessed and approved as per internal guidelines by Head Office based on proposal of treasury.
• The limit review is carried out annually or as and when required. • The market risk management department (MRMD), an independent unit, monitors and reports the limit
utilizations to internal management / HO as per laid down guidelines. • The capital for counterparty risk exposure for derivatives transactions is assessed as per standardized
approach prescribed by RBI for both default risk capital and CVA capital charges. • The exposure on CCIL (Clearing Corporation of India Limited) on account of forex forward and SFT is
accessed as per the RBI guidelines prescribed for Qualified Central Counterparty (QCCP).
Quantitative Disclosure
• The derivatives exposure is calculated using Current Exposure Method. The balance outstanding as on 30th Sep 2016 is given below
(Amount in Rs. Millions)
Particulars
30th September 2016 31st March 2016 Notional Amounts
Current Exposure
Notional Amounts
Current Exposure
Foreign exchange contracts 538,987.90 13,908.20 396,246.20 11,316.70 Interest rate derivative contracts 316,389.70 4,661.00 140,893.05 3,160.30 Currency swaps 352,050.10 50,693.30 359,955.04 57,680.24 Currency Options 1,604.40 29.46 - - Total 1,209,032.10 69,291.96 897,094.29 72,157.24
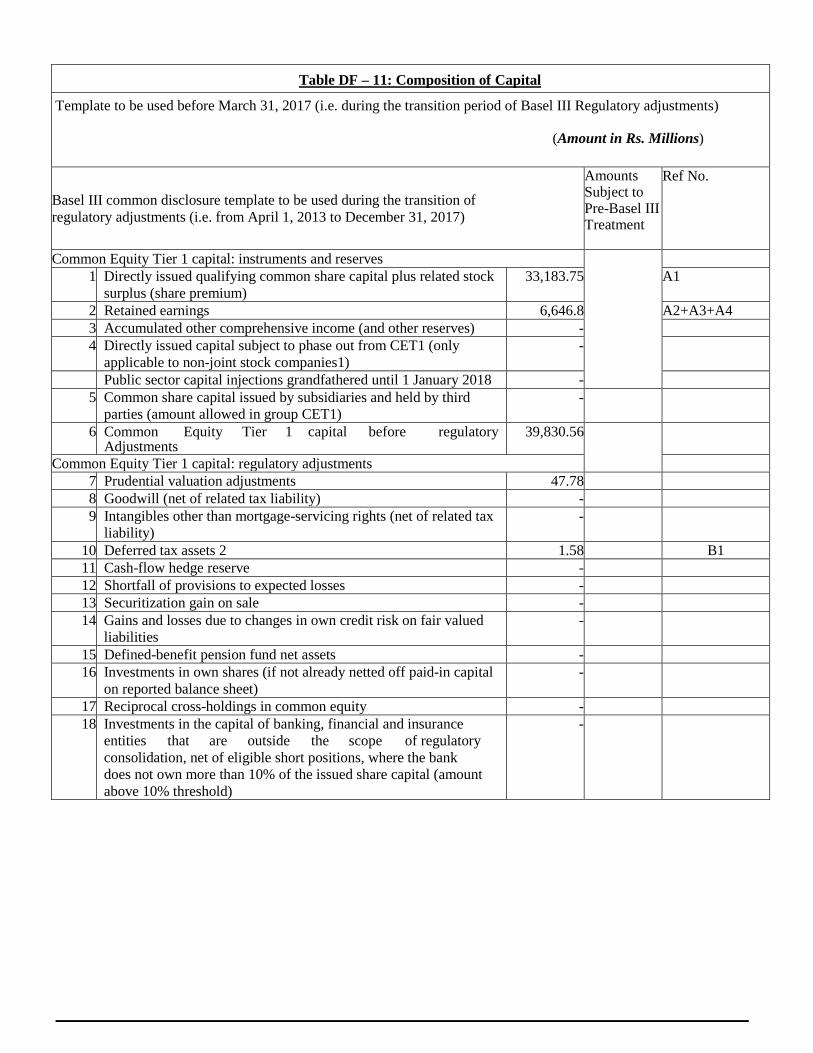
Table DF – 11: Composition of Capital
Template to be used before March 31, 2017 (i.e. during the transition period of Basel III Regulatory adjustments)
(Amount in Rs. Millions)
Basel III common disclosure template to be used during the transition of regulatory adjustments (i.e. from April 1, 2013 to December 31, 2017)
Amounts Subject to Pre-Basel III Treatment
Ref No.
Common Equity Tier 1 capital: instruments and reserves 1 Directly issued qualifying common share capital plus related stock
surplus (share premium) 33,183.75 A1
2 Retained earnings 6,646.8 A2+A3+A4 3 Accumulated other comprehensive income (and other reserves) - 4 Directly issued capital subject to phase out from CET1 (only
applicable to non-joint stock companies1) -
Public sector capital injections grandfathered until 1 January 2018 - 5 Common share capital issued by subsidiaries and held by third
parties (amount allowed in group CET1) -
6 Common Equity Tier 1 capital before regulatory Adjustments
39,830.56
Common Equity Tier 1 capital: regulatory adjustments 7 Prudential valuation adjustments 47.78 8 Goodwill (net of related tax liability) - 9 Intangibles other than mortgage-servicing rights (net of related tax
liability) -
10 Deferred tax assets 2 1.58 B1 11 Cash-flow hedge reserve - 12 Shortfall of provisions to expected losses - 13 Securitization gain on sale - 14 Gains and losses due to changes in own credit risk on fair valued
liabilities -
15 Defined-benefit pension fund net assets - 16 Investments in own shares (if not already netted off paid-in capital
on reported balance sheet) -
17 Reciprocal cross-holdings in common equity - 18 Investments in the capital of banking, financial and insurance
entities that are outside the scope of regulatory consolidation, net of eligible short positions, where the bank does not own more than 10% of the issued share capital (amount above 10% threshold)
-
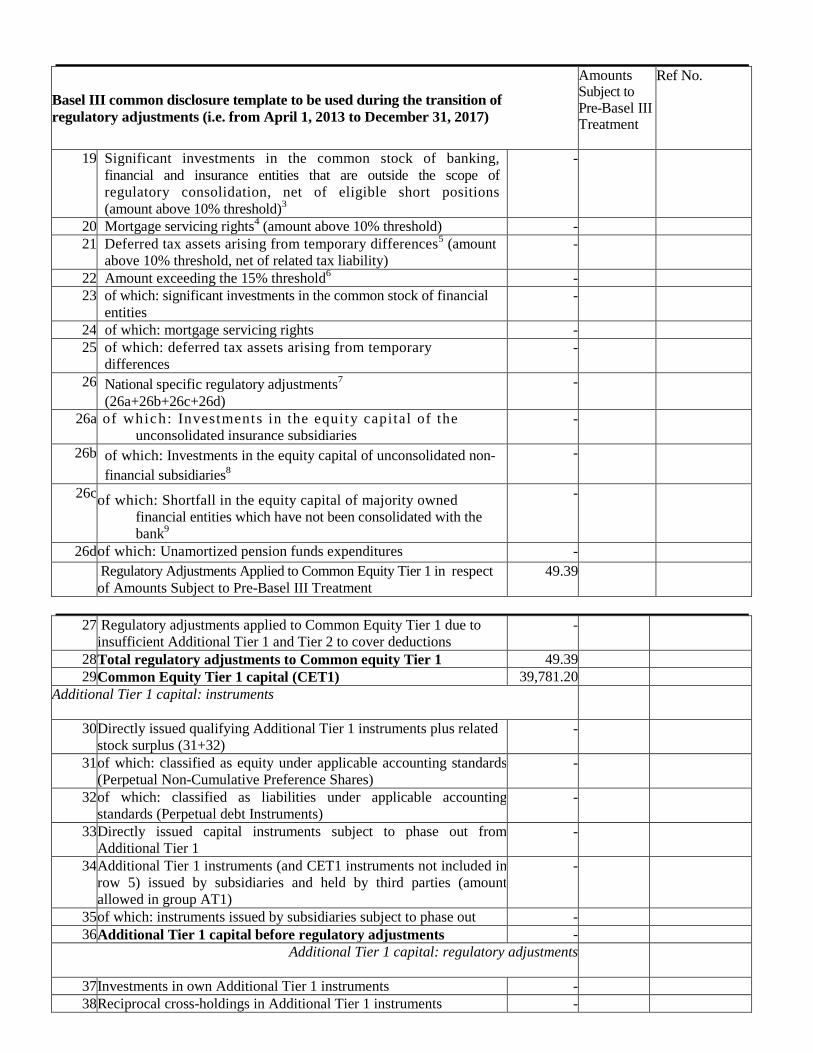
Basel III common disclosure template to be used during the transition of regulatory adjustments (i.e. from April 1, 2013 to December 31, 2017)
Amounts Subject to Pre-Basel III Treatment
Ref No.
19 Significant investments in the common stock of banking, financial and insurance entities that are outside the scope of regulatory consolidation, net of eligible short positions (amount above 10% threshold)3
-
20 Mortgage servicing rights4 (amount above 10% threshold) - 21 Deferred tax assets arising from temporary differences5 (amount
above 10% threshold, net of related tax liability) -
22 Amount exceeding the 15% threshold6 - 23 of which: significant investments in the common stock of financial
entities -
24 of which: mortgage servicing rights - 25 of which: deferred tax assets arising from temporary
differences -
26 National specific regulatory adjustments7 (26a+26b+26c+26d)
-
26a of which: Investments in the equity capital of the unconsolidated insurance subsidiaries
-
26b of which: Investments in the equity capital of unconsolidated non-financial subsidiaries8
-
26c of which: Shortfall in the equity capital of majority owned financial entities which have not been consolidated with the bank9
-
26d of which: Unamortized pension funds expenditures - Regulatory Adjustments Applied to Common Equity Tier 1 in respect
of Amounts Subject to Pre-Basel III Treatment 49.39
27 Regulatory adjustments applied to Common Equity Tier 1 due to
insufficient Additional Tier 1 and Tier 2 to cover deductions -
28 Total regulatory adjustments to Common equity Tier 1 49.39 29 Common Equity Tier 1 capital (CET1) 39,781.20
Additional Tier 1 capital: instruments
30 Directly issued qualifying Additional Tier 1 instruments plus related stock surplus (31+32)
-
31 of which: classified as equity under applicable accounting standards (Perpetual Non-Cumulative Preference Shares)
-
32 of which: classified as liabilities under applicable accounting standards (Perpetual debt Instruments)
-
33 Directly issued capital instruments subject to phase out from Additional Tier 1
-
34 Additional Tier 1 instruments (and CET1 instruments not included in row 5) issued by subsidiaries and held by third parties (amount allowed in group AT1)
-
35 of which: instruments issued by subsidiaries subject to phase out - 36 Additional Tier 1 capital before regulatory adjustments -
Additional Tier 1 capital: regulatory adjustments
37 Investments in own Additional Tier 1 instruments - 38 Reciprocal cross-holdings in Additional Tier 1 instruments -
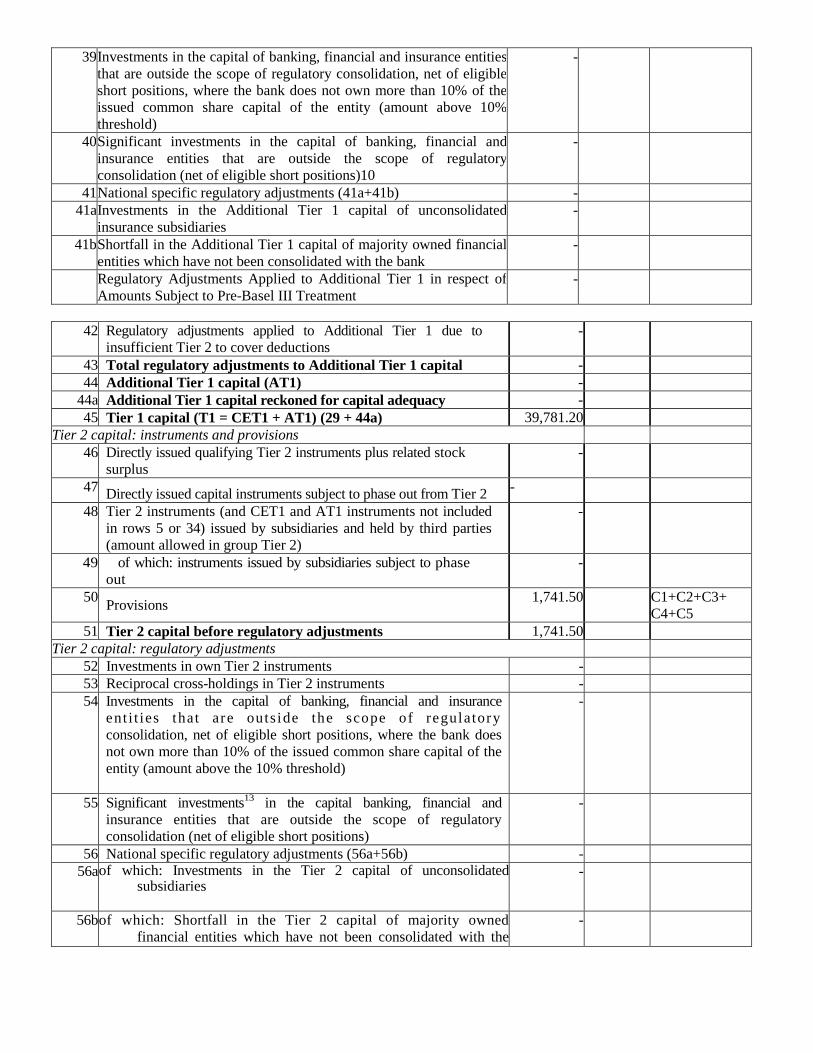
39 Investments in the capital of banking, financial and insurance entities that are outside the scope of regulatory consolidation, net of eligible short positions, where the bank does not own more than 10% of the issued common share capital of the entity (amount above 10% threshold)
-
40 Significant investments in the capital of banking, financial and insurance entities that are outside the scope of regulatory consolidation (net of eligible short positions)10
-
41 National specific regulatory adjustments (41a+41b) - 41a Investments in the Additional Tier 1 capital of unconsolidated
insurance subsidiaries -
41b Shortfall in the Additional Tier 1 capital of majority owned financial entities which have not been consolidated with the bank
-
Regulatory Adjustments Applied to Additional Tier 1 in respect of Amounts Subject to Pre-Basel III Treatment
-
42 Regulatory adjustments applied to Additional Tier 1 due to insufficient Tier 2 to cover deductions
-
43 Total regulatory adjustments to Additional Tier 1 capital - 44 Additional Tier 1 capital (AT1) -
44a Additional Tier 1 capital reckoned for capital adequacy - 45 Tier 1 capital (T1 = CET1 + AT1) (29 + 44a) 39,781.20
Tier 2 capital: instruments and provisions 46 Directly issued qualifying Tier 2 instruments plus related stock
surplus -
47 Directly issued capital instruments subject to phase out from Tier 2 -
48 Tier 2 instruments (and CET1 and AT1 instruments not included in rows 5 or 34) issued by subsidiaries and held by third parties (amount allowed in group Tier 2)
-
49 of which: instruments issued by subsidiaries subject to phase out
-
50 Provisions 1,741.50 C1+C2+C3+ C4+C5
51 Tier 2 capital before regulatory adjustments 1,741.50 Tier 2 capital: regulatory adjustments
52 Investments in own Tier 2 instruments - 53 Reciprocal cross-holdings in Tier 2 instruments - 54 Investments in the capital of banking, financial and insurance
ent i t ies that are outs ide the scope of regulatory consolidation, net of eligible short positions, where the bank does not own more than 10% of the issued common share capital of the entity (amount above the 10% threshold)
-
55 Significant investments13 in the capital banking, financial and insurance entities that are outside the scope of regulatory consolidation (net of eligible short positions)
-
56 National specific regulatory adjustments (56a+56b) - 56a of which: Investments in the Tier 2 capital of unconsolidated
subsidiaries
-
56b of which: Shortfall in the Tier 2 capital of majority owned financial entities which have not been consolidated with the
-
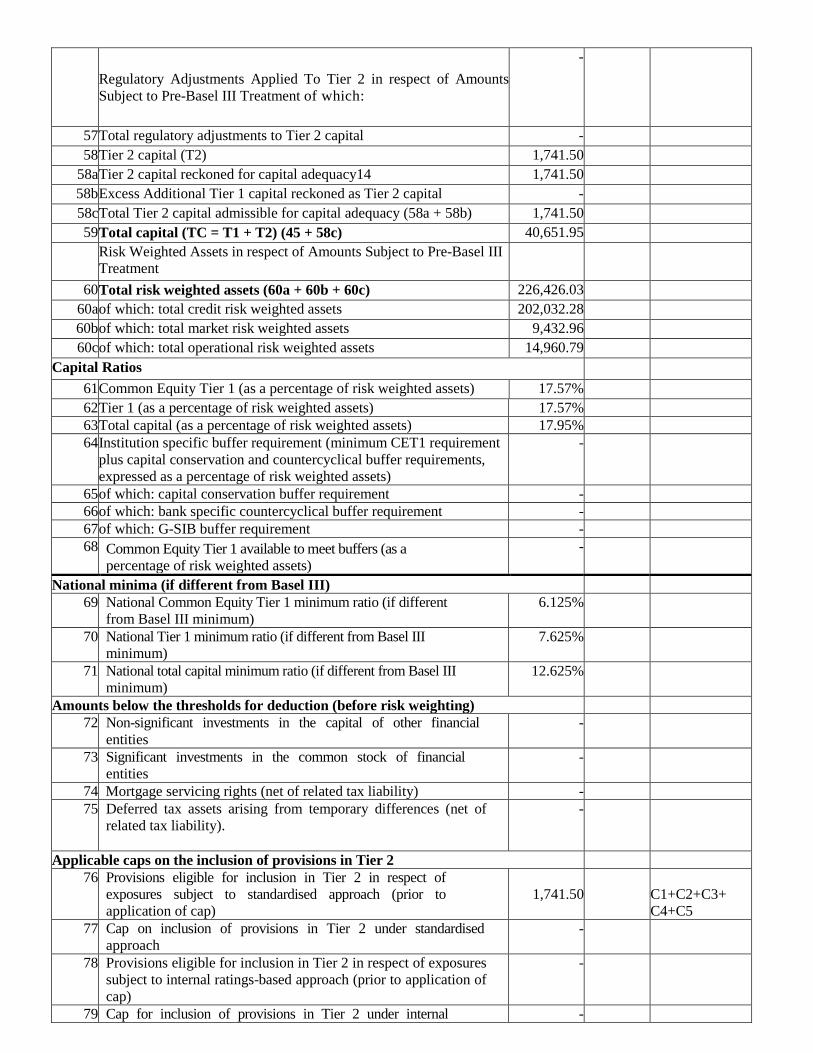
Regulatory Adjustments Applied To Tier 2 in respect of Amounts Subject to Pre-Basel III Treatment of which:
-
57 Total regulatory adjustments to Tier 2 capital - 58 Tier 2 capital (T2) 1,741.50
58a Tier 2 capital reckoned for capital adequacy14 1,741.50 58b Excess Additional Tier 1 capital reckoned as Tier 2 capital - 58c Total Tier 2 capital admissible for capital adequacy (58a + 58b) 1,741.50 59 Total capital (TC = T1 + T2) (45 + 58c) 40,651.95
Risk Weighted Assets in respect of Amounts Subject to Pre-Basel III Treatment
60 Total risk weighted assets (60a + 60b + 60c) 226,426.03
60a of which: total credit risk weighted assets 202,032.28 60b of which: total market risk weighted assets 9,432.96 60c of which: total operational risk weighted assets 14,960.79
Capital Ratios 61 Common Equity Tier 1 (as a percentage of risk weighted assets) 17.57% 62 Tier 1 (as a percentage of risk weighted assets) 17.57% 63 Total capital (as a percentage of risk weighted assets) 17.95% 64 Institution specific buffer requirement (minimum CET1 requirement
plus capital conservation and countercyclical buffer requirements, expressed as a percentage of risk weighted assets)
-
65 of which: capital conservation buffer requirement - 66 of which: bank specific countercyclical buffer requirement - 67 of which: G-SIB buffer requirement - 68 Common Equity Tier 1 available to meet buffers (as a
percentage of risk weighted assets) -
National minima (if different from Basel III) 69 National Common Equity Tier 1 minimum ratio (if different
from Basel III minimum) 6.125%
70 National Tier 1 minimum ratio (if different from Basel III minimum)
7.625%
71 National total capital minimum ratio (if different from Basel III minimum)
12.625%
Amounts below the thresholds for deduction (before risk weighting) 72 Non-significant investments in the capital of other financial
entities -
73 Significant investments in the common stock of financial entities
-
74 Mortgage servicing rights (net of related tax liability) - 75 Deferred tax assets arising from temporary differences (net of
related tax liability).
-
Applicable caps on the inclusion of provisions in Tier 2 76 Provisions eligible for inclusion in Tier 2 in respect of
exposures subject to standardised approach (prior to application of cap)
1,741.50
C1+C2+C3+ C4+C5
77 Cap on inclusion of provisions in Tier 2 under standardised approach
-
78 Provisions eligible for inclusion in Tier 2 in respect of exposures subject to internal ratings-based approach (prior to application of cap)
-
79 Cap for inclusion of provisions in Tier 2 under internal -
ratings-based approach Capital instruments subject to phase-out arrangements (only applicable between March 31, 2017 and March 31, 2022)
80 Current cap on CET1 instruments subject to phase out arrangements
-
81 Amount excluded from CET1 due to cap (excess over cap after redemptions and maturities)
-
82 Current cap on AT1 instruments subject to phase out arrangements
-
83 Amount excluded from AT1 due to cap (excess over cap after redemptions and maturities)
-
84 Current cap on T2 instruments subject to phase out arrangements
-
85 Amount excluded from T2 due to cap (excess over cap after redemptions and maturities)
-
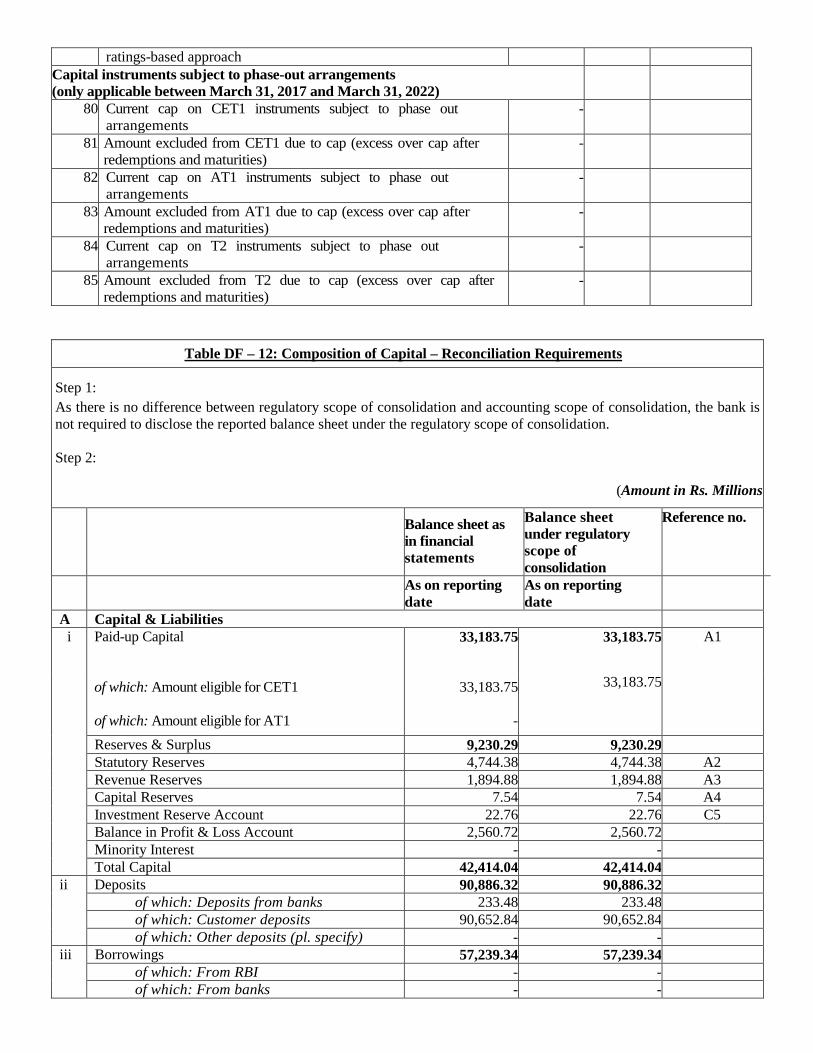
Table DF – 12: Composition of Capital – Reconciliation Requirements
Step 1: As there is no difference between regulatory scope of consolidation and accounting scope of consolidation, the bank is not required to disclose the reported balance sheet under the regulatory scope of consolidation. Step 2:
(Amount in Rs. Millions)
Balance sheet as in financial statements
Balance sheet under regulatory scope of consolidation
Reference no.
As on reporting date
As on reporting date
A Capital & Liabilities i
Paid-up Capital of which: Amount eligible for CET1 of which: Amount eligible for AT1
33,183.75
33,183.75
-
33,183.75
A1
33,183.75
Reserves & Surplus 9,230.29 9,230.29 Statutory Reserves 4,744.38 4,744.38 A2 Revenue Reserves 1,894.88 1,894.88 A3 Capital Reserves 7.54 7.54 A4 Investment Reserve Account 22.76 22.76 C5 Balance in Profit & Loss Account 2,560.72 2,560.72 Minority Interest - - Total Capital 42,414.04 42,414.04
ii Deposits 90,886.32 90,886.32 of which: Deposits from banks 233.48 233.48 of which: Customer deposits 90,652.84 90,652.84 of which: Other deposits (pl. specify) - -
iii Borrowings 57,239.34 57,239.34 of which: From RBI - - of which: From banks - -
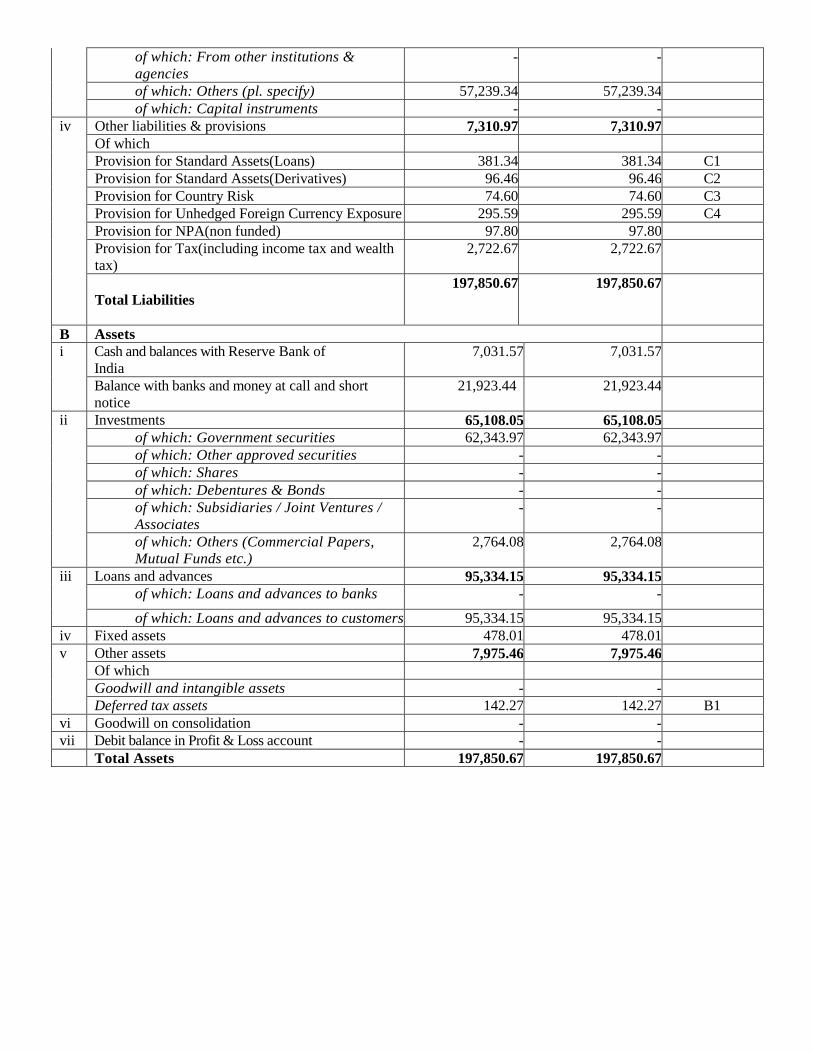
of which: From other institutions & agencies
- -
of which: Others (pl. specify) 57,239.34 57,239.34 of which: Capital instruments - -
iv Other liabilities & provisions 7,310.97 7,310.97 Of which Provision for Standard Assets(Loans) 381.34 381.34 C1 Provision for Standard Assets(Derivatives) 96.46 96.46 C2 Provision for Country Risk 74.60 74.60 C3 Provision for Unhedged Foreign Currency Exposure 295.59 295.59 C4 Provision for NPA(non funded) 97.80 97.80 Provision for Tax(including income tax and wealth tax)
2,722.67 2,722.67
Total Liabilities 197,850.67 197,850.67
B Assets i Cash and balances with Reserve Bank of
India 7,031.57 7,031.57
Balance with banks and money at call and short notice
21,923.44 21,923.44
ii Investments 65,108.05 65,108.05 of which: Government securities 62,343.97 62,343.97 of which: Other approved securities - - of which: Shares - - of which: Debentures & Bonds - - of which: Subsidiaries / Joint Ventures / Associates
- -
of which: Others (Commercial Papers, Mutual Funds etc.)
2,764.08 2,764.08
iii Loans and advances 95,334.15 95,334.15 of which: Loans and advances to banks - -
of which: Loans and advances to customers 95,334.15 95,334.15 iv Fixed assets 478.01 478.01 v Other assets 7,975.46 7,975.46
Of which Goodwill and intangible assets - - Deferred tax assets 142.27 142.27 B1
vi Goodwill on consolidation - - vii Debit balance in Profit & Loss account - -
Total Assets 197,850.67 197,850.67
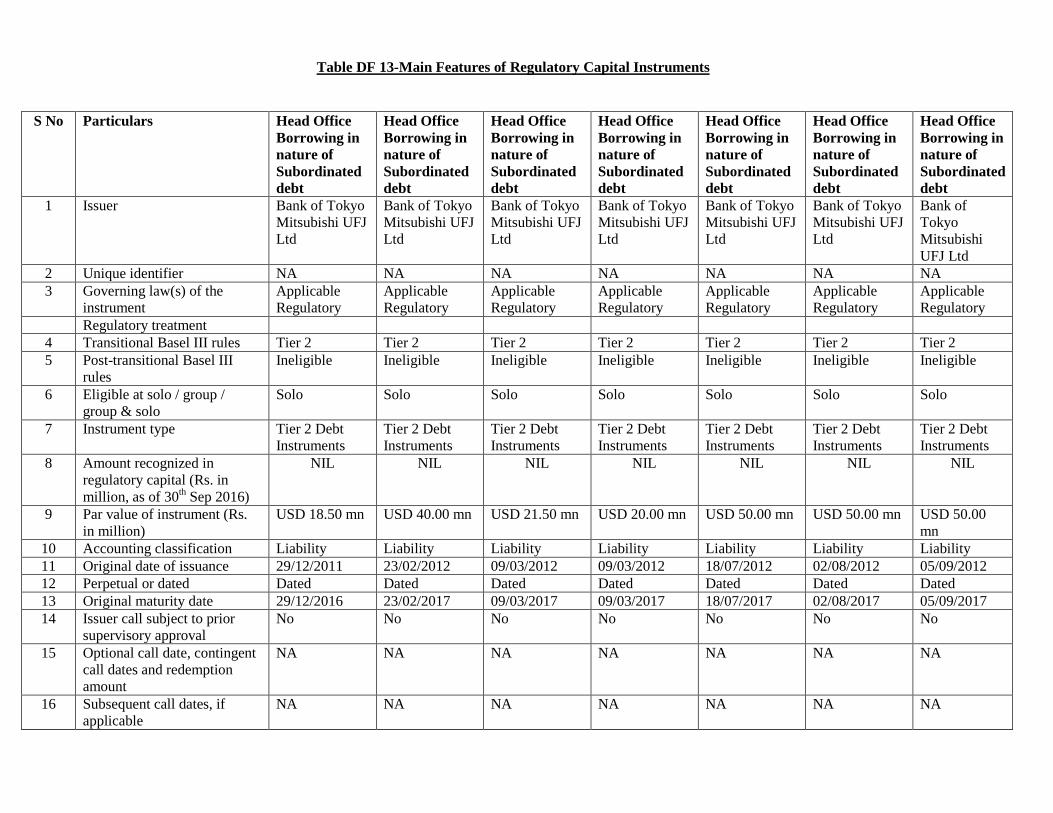
Table DF 13-Main Features of Regulatory Capital Instruments S No Particulars Head Office
Borrowing in nature of Subordinated debt
Head Office Borrowing in nature of Subordinated debt
Head Office Borrowing in nature of Subordinated debt
Head Office Borrowing in nature of Subordinated debt
Head Office Borrowing in nature of Subordinated debt
Head Office Borrowing in nature of Subordinated debt
Head Office Borrowing in nature of Subordinated debt
1 Issuer Bank of Tokyo Mitsubishi UFJ Ltd
Bank of Tokyo Mitsubishi UFJ Ltd
Bank of Tokyo Mitsubishi UFJ Ltd
Bank of Tokyo Mitsubishi UFJ Ltd
Bank of Tokyo Mitsubishi UFJ Ltd
Bank of Tokyo Mitsubishi UFJ Ltd
Bank of Tokyo Mitsubishi UFJ Ltd
2 Unique identifier NA NA NA NA NA NA NA 3 Governing law(s) of the
instrument Applicable Regulatory
Applicable Regulatory
Applicable Regulatory
Applicable Regulatory
Applicable Regulatory
Applicable Regulatory
Applicable Regulatory
Regulatory treatment 4 Transitional Basel III rules Tier 2 Tier 2 Tier 2 Tier 2 Tier 2 Tier 2 Tier 2 5 Post-transitional Basel III
rules Ineligible Ineligible Ineligible Ineligible Ineligible Ineligible Ineligible
6 Eligible at solo / group / group & solo
Solo Solo Solo Solo Solo Solo Solo
7 Instrument type Tier 2 Debt Instruments
Tier 2 Debt Instruments
Tier 2 Debt Instruments
Tier 2 Debt Instruments
Tier 2 Debt Instruments
Tier 2 Debt Instruments
Tier 2 Debt Instruments
8 Amount recognized in regulatory capital (Rs. in million, as of 30th Sep 2016)
NIL
NIL NIL NIL NIL NIL NIL
9 Par value of instrument (Rs. in million)
USD 18.50 mn USD 40.00 mn USD 21.50 mn USD 20.00 mn USD 50.00 mn USD 50.00 mn USD 50.00 mn
10 Accounting classification Liability Liability Liability Liability Liability Liability Liability 11 Original date of issuance 29/12/2011 23/02/2012 09/03/2012 09/03/2012 18/07/2012 02/08/2012 05/09/2012 12 Perpetual or dated Dated Dated Dated Dated Dated Dated Dated 13 Original maturity date 29/12/2016 23/02/2017 09/03/2017 09/03/2017 18/07/2017 02/08/2017 05/09/2017 14 Issuer call subject to prior
supervisory approval No No No No No No No
15 Optional call date, contingent call dates and redemption amount
NA NA NA NA NA NA NA
16 Subsequent call dates, if applicable
NA NA NA NA NA NA NA
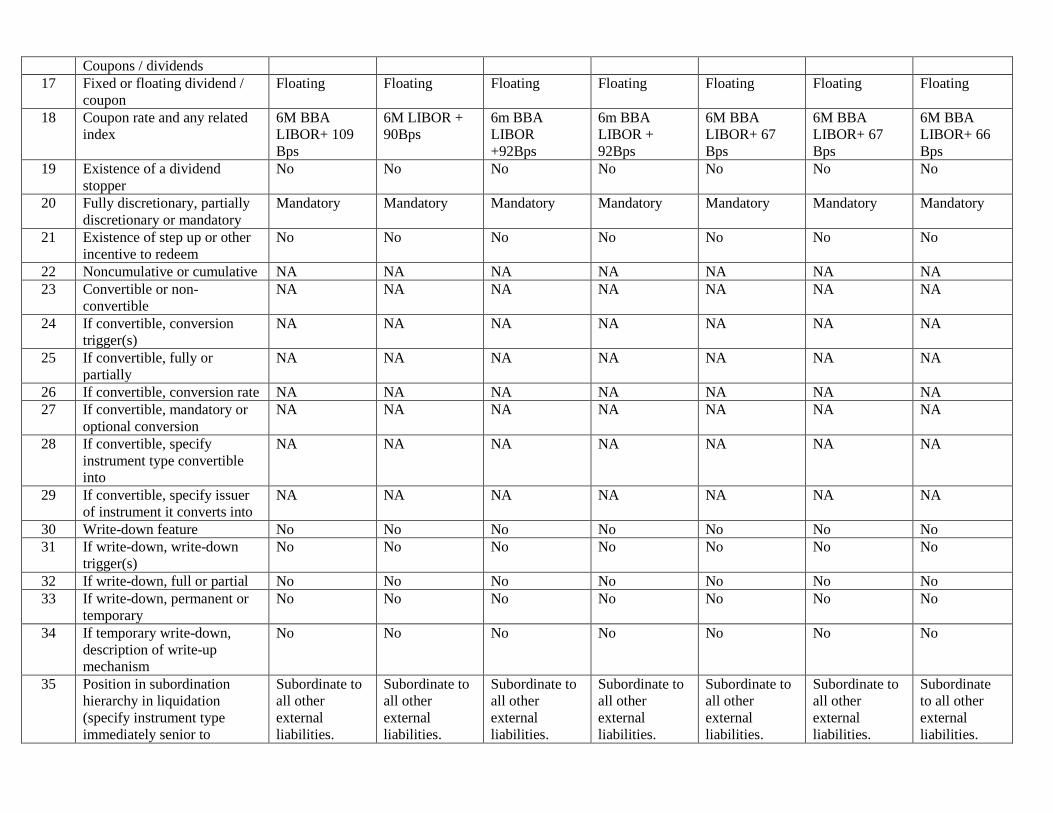
Coupons / dividends 17 Fixed or floating dividend /
coupon Floating Floating Floating Floating Floating Floating Floating
18 Coupon rate and any related index
6M BBA LIBOR+ 109 Bps
6M LIBOR + 90Bps
6m BBA LIBOR +92Bps
6m BBA LIBOR + 92Bps
6M BBA LIBOR+ 67 Bps
6M BBA LIBOR+ 67 Bps
6M BBA LIBOR+ 66 Bps
19 Existence of a dividend stopper
No No No No No No No
20 Fully discretionary, partially discretionary or mandatory
Mandatory Mandatory Mandatory Mandatory Mandatory Mandatory Mandatory
21 Existence of step up or other incentive to redeem
No No No No No No No
22 Noncumulative or cumulative NA NA NA NA NA NA NA 23 Convertible or non-
convertible NA NA NA NA NA NA NA
24 If convertible, conversion trigger(s)
NA NA NA NA NA NA NA
25 If convertible, fully or partially
NA NA NA NA NA NA NA
26 If convertible, conversion rate NA NA NA NA NA NA NA 27 If convertible, mandatory or
optional conversion NA NA NA NA NA NA NA
28 If convertible, specify instrument type convertible into
NA NA NA NA NA NA NA
29 If convertible, specify issuer of instrument it converts into
NA NA NA NA NA NA NA
30 Write-down feature No No No No No No No 31 If write-down, write-down
trigger(s) No No No No No No No
32 If write-down, full or partial No No No No No No No 33 If write-down, permanent or
temporary No No No No No No No
34 If temporary write-down, description of write-up mechanism
No No No No No No No
35 Position in subordination hierarchy in liquidation (specify instrument type immediately senior to
Subordinate to all other external liabilities.
Subordinate to all other external liabilities.
Subordinate to all other external liabilities.
Subordinate to all other external liabilities.
Subordinate to all other external liabilities.
Subordinate to all other external liabilities.
Subordinate to all other external liabilities.
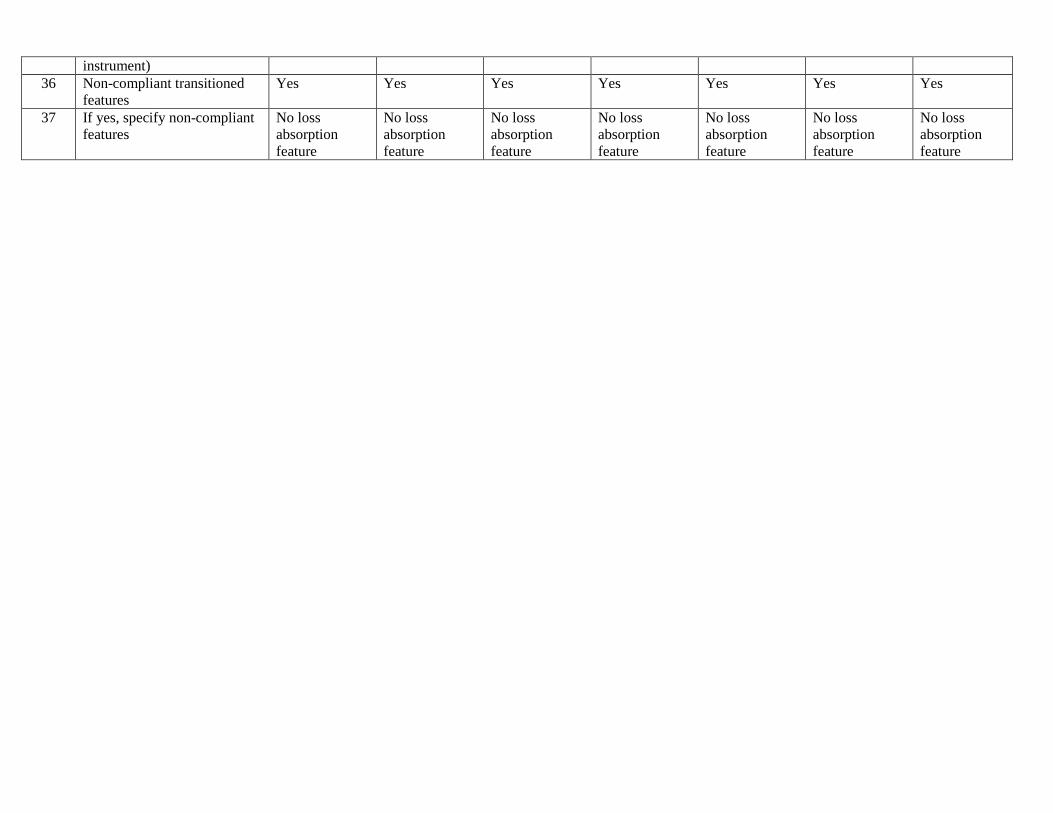
instrument) 36 Non-compliant transitioned
features Yes Yes Yes Yes Yes Yes Yes
37 If yes, specify non-compliant features
No loss absorption feature
No loss absorption feature
No loss absorption feature
No loss absorption feature
No loss absorption feature
No loss absorption feature
No loss absorption feature
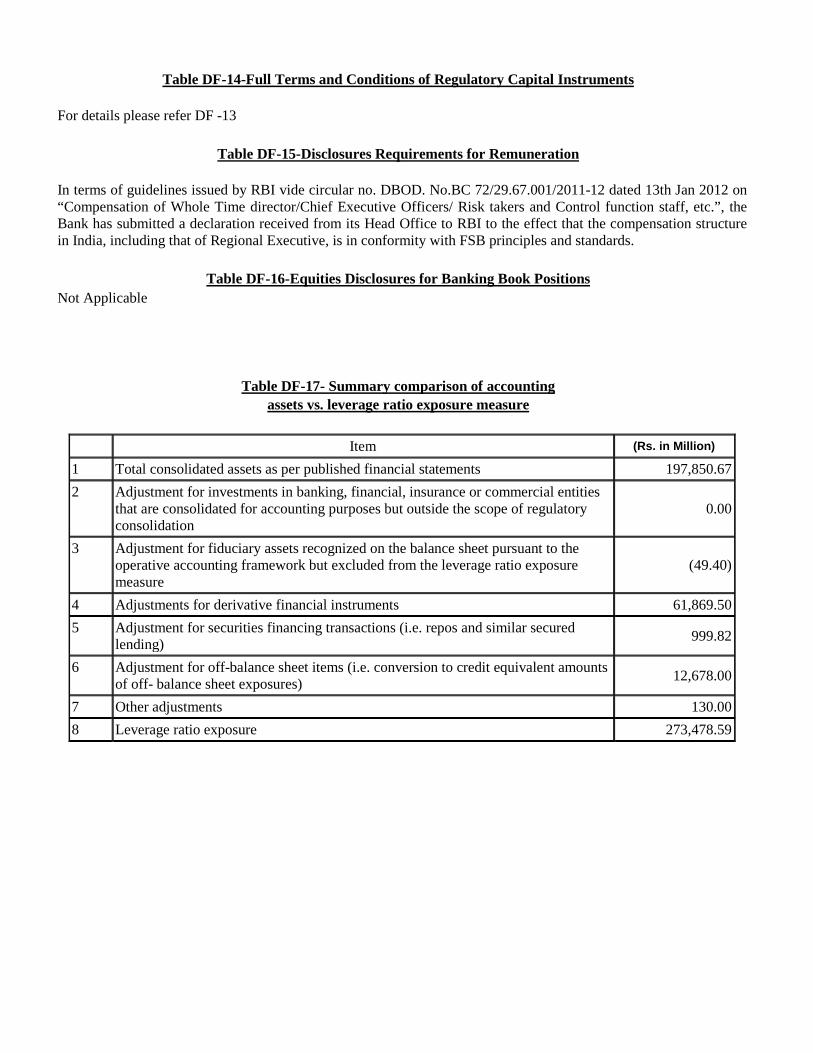
Table DF-14-Full Terms and Conditions of Regulatory Capital Instruments
For details please refer DF -13
Table DF-15-Disclosures Requirements for Remuneration In terms of guidelines issued by RBI vide circular no. DBOD. No.BC 72/29.67.001/2011-12 dated 13th Jan 2012 on “Compensation of Whole Time director/Chief Executive Officers/ Risk takers and Control function staff, etc.”, the Bank has submitted a declaration received from its Head Office to RBI to the effect that the compensation structure in India, including that of Regional Executive, is in conformity with FSB principles and standards.
Table DF-16-Equities Disclosures for Banking Book Positions Not Applicable
Table DF-17- Summary comparison of accounting assets vs. leverage ratio exposure measure
Item (Rs. in Million)
1 Total consolidated assets as per published financial statements 197,850.67 2 Adjustment for investments in banking, financial, insurance or commercial entities
that are consolidated for accounting purposes but outside the scope of regulatory consolidation
0.00
3 Adjustment for fiduciary assets recognized on the balance sheet pursuant to the operative accounting framework but excluded from the leverage ratio exposure measure
(49.40)
4 Adjustments for derivative financial instruments 61,869.50 5 Adjustment for securities financing transactions (i.e. repos and similar secured
lending) 999.82
6 Adjustment for off-balance sheet items (i.e. conversion to credit equivalent amounts of off- balance sheet exposures) 12,678.00
7 Other adjustments 130.00 8 Leverage ratio exposure 273,478.59
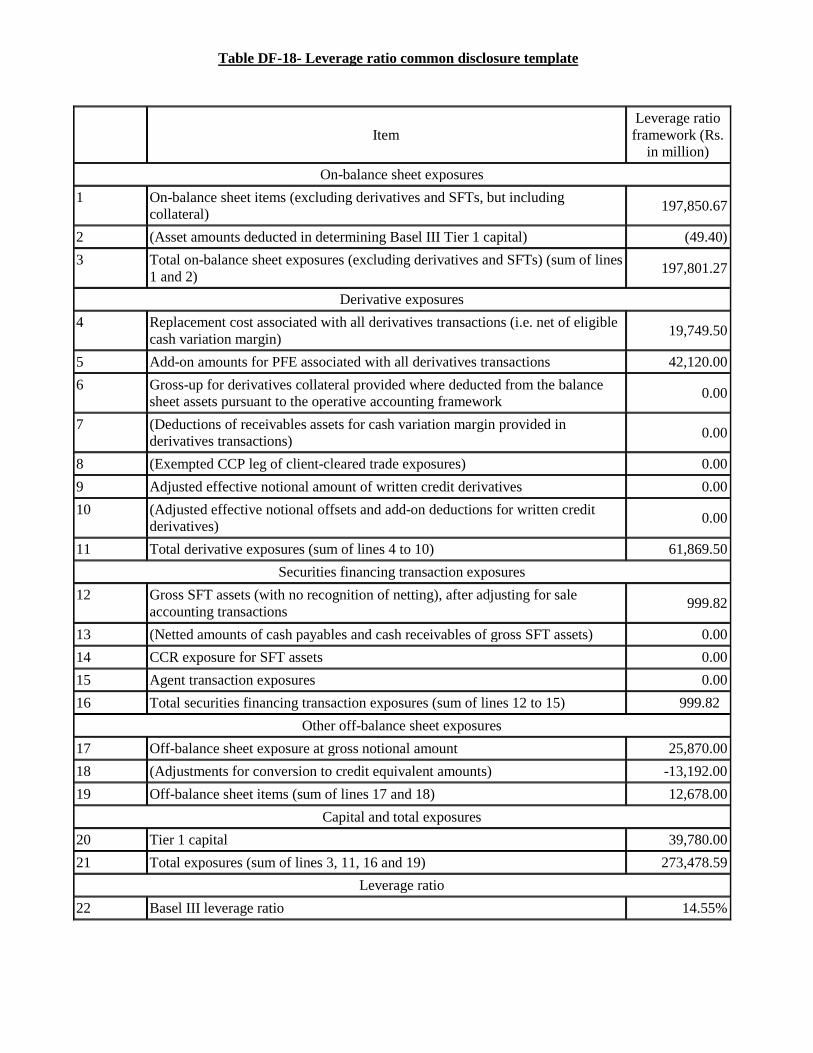
Table DF-18- Leverage ratio common disclosure template
Item Leverage ratio framework (Rs.
in million) On-balance sheet exposures
1 On-balance sheet items (excluding derivatives and SFTs, but including collateral) 197,850.67
2 (Asset amounts deducted in determining Basel III Tier 1 capital) (49.40) 3 Total on-balance sheet exposures (excluding derivatives and SFTs) (sum of lines
1 and 2) 197,801.27
Derivative exposures 4 Replacement cost associated with all derivatives transactions (i.e. net of eligible
cash variation margin) 19,749.50
5 Add-on amounts for PFE associated with all derivatives transactions 42,120.00 6 Gross-up for derivatives collateral provided where deducted from the balance
sheet assets pursuant to the operative accounting framework 0.00
7 (Deductions of receivables assets for cash variation margin provided in derivatives transactions) 0.00
8 (Exempted CCP leg of client-cleared trade exposures) 0.00 9 Adjusted effective notional amount of written credit derivatives 0.00 10 (Adjusted effective notional offsets and add-on deductions for written credit
derivatives) 0.00
11 Total derivative exposures (sum of lines 4 to 10) 61,869.50 Securities financing transaction exposures
12 Gross SFT assets (with no recognition of netting), after adjusting for sale accounting transactions 999.82
13 (Netted amounts of cash payables and cash receivables of gross SFT assets) 0.00 14 CCR exposure for SFT assets 0.00 15 Agent transaction exposures 0.00 16 Total securities financing transaction exposures (sum of lines 12 to 15) 999.82
Other off-balance sheet exposures 17 Off-balance sheet exposure at gross notional amount 25,870.00 18 (Adjustments for conversion to credit equivalent amounts) -13,192.00 19 Off-balance sheet items (sum of lines 17 and 18) 12,678.00
Capital and total exposures 20 Tier 1 capital 39,780.00 21 Total exposures (sum of lines 3, 11, 16 and 19) 273,478.59
Leverage ratio 22 Basel III leverage ratio 14.55%