Embed Size (px)
Citation preview

CONCURRENCY AND COMPUTATION: PRACTICE AND EXPERIENCEConcurrency Computat.: Pract. Exper.
Quality Measures for ETL Processes: From goals toimplementation
Vasileios Theodorou1∗, Alberto Abelló 1, Wolfgang Lehner2 and Maik Thiele2
1Department of Service and Information System Engineering, Universitat Politècnica de Catalunya2Department of Computer Science, Database Technology Group, Technische Universität Dresden
SUMMARY
ETL processes play an increasingly important role for the support of modern business operations. Thesebusiness processes are centred around artifacts with high variability and diverse lifecycles, which correspondto key business entities. The apparent complexity of these activities has been examined through the prism ofBusiness Process Management, mainly focusing on functional requirements and performance optimization.However, the quality dimension has not yet been thoroughly investigated and there is a need for a morehuman-centric approach to bring them closer to business-users requirements. In this paper we take a firststep towards this direction by defining a sound model for ETL process quality characteristics and quantitativemeasures for each characteristic, based on existing literature. Our model shows dependencies among qualitycharacteristics and can provide the basis for subsequent analysis using Goal Modeling techniques. Weshowcase the use of Goal Modeling for ETL process design through a use case, where we employ theuse of a goal model that includes quantitative components (i.e., indicators) for evaluation and analysis ofalternative design decisions.
KEY WORDS: ETL; business process; quality measures; Goal Modeling
1. INTRODUCTION
Business Intelligence nowadays involves identifying, extracting, and analysing large amount ofbusiness data coming from diverse, distributed sources. In order to facilitate decision-makers,complex IT-systems are assigned with the task of integrating heterogeneous data deriving fromoperational activities and loading of the processed data to data warehouses, in a process knownas Extraction Transformation Loading (ETL). This integration requires the execution of real-time,automated, data-centric business processes in a variety of workflow-based tasks. The main challengeis how to turn the integration process design, which has been traditionally predefined for periodicoff-line mode execution, into a dynamic, continuous operation that can sufficiently meet end-userneeds.
During the past years, there has been considerable research regarding the optimization of ETLflows in terms of functionality and performance [1, 2]. Moreover, in an attempt to manage thecomplexity of ETL processes on a conceptual level that reflects organizational operations, tools andmodels from the area of Business Process Management (BPM) have been proposed [3, 4]. Theseapproaches make the crucial step of examining data-centric process models in an outlook that bringsthem closer to the business core and allows their functional validation and performance evaluationbased on user input.
However, the dimension of process quality [5] has not yet been adequately examined in asystematic manner. Unlike other business processes, important quality factors for ETL process
∗Correspondence to: [email protected]

2 VASILEIOS THEODOROU
design are tightly coupled to information quality while depending on the interoperability ofdistributed engines. Added to that, there is increasing need for process automation in order tobecome more cost-effective [6] and therefore there needs to be a common ground between analystsand IT that would allow the seamless translation of high level quality concerns to design choices.
The identification of different perspectives of ETL processes — i) data-centric view, ii) softwareview and iii) business process view — attaches to them an interdisciplinary character and enablesthe consolidation and reuse of tools and practices from multiple well-established research areas fortheir analysis. Furthermore, recent advancements in the area of Requirements Engineering offerframeworks targeted to the domain of Business Intelligence that can facilitate ETL process analysison a business level that is backed by measures and runtime behavior characteristics on the technicallevel. In addition, the emerging Data Warehousing paradigms of agile design [7] and self-service BI[8] present new opportunities, denoting the necessity of revisiting existing work in the area, in anangle that can promote ETL design automation, while exposing multiple quality dimensions.
In this paper we take a first step towards quality-aware ETL process design automation by defininga set of ETL process quality characteristics and the relationships between them, as well as byproviding quantitative measures for each characteristic. For this purpose, we conduct a systematicliterature review, extract the relevant quality aspects that have been proposed in literature andadapt them for our case. Subsequently, we produce a model that represents ETL process qualitycharacteristics and the dependencies among them. In addition, we gather from existing literaturemetrics for monitoring all of these characteristics to quantitatively evaluate ETL processes. Ourmodel can provide the basis for subsequent analysis that will use Goal Modeling techniques [9] toreason and make design decisions for specific use cases, as we showcase through the application ofa Goal Model with quantitative components (i.e., indicators) to a running example.���������� ������ �
������� ��������� ����
��
� �� �������������������� ���
�������
��
��� �������������
���������
��� ���!"����!
#����������������
��� ����!������!����������� ��������
������� ����
���������
��� �������������������
$������ %���� �������������
��� ����������������
��������������������
Figure 1. CM_A: A simple conceptual model of the running example ETL
We illustrate how our model works through a running example, based on the TPC-H benchmark†.The running example is an ETL process, which extracts data from a source relational database(TPC-H DB) and after processing, loads data to a data warehouse (DW) and can be described bythe following query: Load in the DW all the suppliers in Europe together with their information(phones, addresses etc.), sorted on their revenue. The tables that are used from the source databaseare Supplier, Nation, Region and Lineitem. After Supplier entries have been filtered to keep onlysuppliers in Europe, the revenue for each supplier is calculated based on the supplied lineitemsand subsequently, they are sorted on revenue and loaded to the DW. One simple conceptual model(CM_A) for this process is depicted in Fig. 1, using the Business Process Model and Notation(BPMN‡).
An ETL process can be designed in more than one way, each design offering different advantagesover the other. In Fig. 2 we can see an alternative conceptual model (CM_B) for our example ETLprocess with the same functionality as CM_A (Fig. 1), yet including additional tasks. It includes aWeb Service (WS) call to complete suppliers’ info and improve data completeness; crosscheckingwith an external data source to correct information and improve data accuracy; replication of therevenue calculation step to improve robustness; and the addition of a recovery point to improverecoverability. In the following sections we will show through our running example how our
†http://www.tpc.org/tpch/‡http://www.bpmn.org
Concurrency Computat.: Pract. Exper. (2016)

QUALITY MEASURES FOR ETL PROCESSES: FROM GOALS TO IMPLEMENTATION 3���������� ������ ������ �
������� ��������� ����
��
� �� �������������
������� ���
�������
��
��� �����������������������
��� ���
��� ����
������� ����
���������
��� �������������������
!������ "���� �������������
��� ����������������
��������������������
� �� ������������������� �����
����
���� ������� �����
���������������������#���
����������� �����
�������������
��������������������
�����������������
��� �������������� ����� ��� ��������� ����
����������$����%�&����������������
��� ��������������
$�����%����������� ��������
� �� �������������
������� ���
��� �������������
��� ����������������
��������������������
�������'���������"
��
����#�����
���()*++(,(���������-���
Figure 2. CM_B: Conceptual model of the running example ETL, including additional tasks
proposed models can be used as a basis for i) quality-aware evaluation of ETL processes andii) ETL process re-design that uses as input only the user-defined importance of different qualitycharacteristics. For the former, we show how the two alternative designs of the same ETL process,despite having the same functionality, differ in quality characteristics in a way that can be quantified,using the measures that we have identified. For the latter, we showcase a user-centered methodthat starts with the design of CM_A; incrementally generates patterns on the process in order toimprove specific quality characteristics; and (semi)-automatically produces the design of CM_Band its corresponding implementation.
The paper is organized as follows. Section 2 presents related work regarding qualitycharacteristics for design evaluation. In Section 3 we present the extraction of our model fromrelated work. The definitions, measures and dependencies among characteristics are presented inSection 4 and Section 5 where we distinguish between characteristics with construct implicationsand those only for design evaluation, respectively. In Section 6 we present goal modelingframeworks and in Section 7 we validate the usefulness of our models and showcase throughexamples how they can be used for quality-based ETL process evaluation and redesign. Finally,we provide our conclusions and future work in Section 8.
2. RELATED WORK
Quality has always been a central concern for data warehouses, mainly due to the costly resourcesinvested in their development. [10] takes the important step of introducing a business perspectiveto data warehouse quality, by introducing an extended architecture with different conceptual levels,which enables separation of concerns as well as traceability from client intentions to physical datamodels. It also captures the notion of goal negotiation for conflicting quality goals.
The significance of quality characteristics for the design and evaluation of ETL processes hasalso gained attention recently. [6] recognizes the importance of considering not only processfunctionality but also quality metrics throughout a systematic ETL process design. Thus, it definesa set of quality characteristics specific to ETL processes that it refers to as QoX metrics andprovides guidelines for reasoning about the degree of their satisfaction over alternative designsand the tradeoffs among them. A more recent work that has also considered the ideas from [6] isthe work from [11]. Based on well-known standards for software quality, the author maps softwarequality attributes to ETL specific parameters which he calls QoX factors. He defines these factorsin ETL context and reasons about the impact that the different ETL subsystems might have on eachcharacteristic.
Focusing on Information Quality, [12] provides a comprehensive list of criteria for the evaluationof Information Systems for data integration. In the same area, [13] identifies most importantchallenges for Data Integration and highlights quality concerns in distributed, heterogeneousenvironments. Likewise, [14] identifies the various stakeholders in Data Warehousing activitiesand the differences in their roles as well as the importance of reasoning among alternative qualityconcerns and how that affects design choices.
In the last years, there has been an effort in the area of Business Process Management toquantify process quality characteristics and to empirically validate the use of well-defined metrics
3

4 VASILEIOS THEODOROU
for the evaluation of specific quality characteristics. In this respect, [15] proposes a framework formanaging, modeling and evaluating software processes; defines and experimentally validates a setof measures to assess, among others understandability and modifiability of process models. Similarempirical validation is provided by [5], which relates understandability and modifiability to innatecharacteristics of business process models.
Our approach differs from the above-mentioned ones in that we specifically focus on the processperspective of ETL processes. Instead of providing some characteristics as examples like in [6], wepropose a comprehensive list of quality characteristics and we adjust them for our case. In addition,for each of these characteristics we provide quantitative metrics that are backed by literature.
3. EXTRACTING QUALITY CHARACTERISTICS
Our model mainly derives from a systematic literature review that we conducted, following theguidelines reported by [16]. The research questions addressed by this study are the following:RQ1) What ETL process quality characteristics have been addressed?RQ2) What is the definition for each quality characteristic?
Our search process used an automated keyword search of SpringerLink§, ACM Digital Library¶,ScienceDirect‖ and IEEE Xplore∗∗. Thus, we searched not one, but multiple electronic resources,following the guidelines from [17]. These electronic resources were chosen because of theirpopularity within the software engineering community — and the data warehousing researchdomain in specific — and because we found during our review planning phase that other indexingservices (e.g., Citeseer library, Google scholar) only include for our topic of interest, a subset of thematerial found in our chosen resources. Our goal was to gather all peer-reviewed studies related toour search and therefore we selected a set of resources that is complete with respect to internationalconference publications, journals and books in the research area of data warehousing.
The search strings were the following:
• (quality attributes OR quality characteristics OR qox) AND (“etl” OR “extractiontransformation loading”) AND (“information technology” OR “business intelligence”)
• (quality attributes OR quality characteristics OR qox) AND (“data integration” OR“information systems integration” OR “data warehouses”) AND (“quality aware” OR “qualitydriven”)
The inclusion criterion for the studies was that they should identify a wide range of qualitycharacteristics for data integration processes and thus only studies that mentioned at least 10different quality characteristics were included. The quality characteristics could refer to any stageof the process as well as to the quality of the target repositories as a result of the process. Weshould mention at this point that there exists a large number of studies focusing specifically on thequality dimension of Data Quality, but the rationale of our search was to gather all different qualitydimensions previously studied, which justifies our inclusion criterion. One exclusion criterion wasthat studies should be written in English. Whenever multiple studies from same line of work wereidentified, our approach was to include the most recent or the most extensive version of the study.
The result of our selection process was a final set of 5 studies. Nevertheless, in an attempt toimprove the completeness of our sources, we also considered the ETL subsystems as defined in[18] for an industry perspective on the area, as well as standards from the field of software quality.Regarding software quality, our approach was to study the work by [19] and include in our modelall the attributes relevant to ETL processes, with the required definition adjustments. This way wereviewed a commonly accepted, generic taxonomy of software quality attributes, while at the same
§http://link.springer.com¶http://dl.acm.org‖http://www.sciencedirect.com/∗∗http://ieeexplore.ieee.org
Concurrency Computat.: Pract. Exper. (2016)
QUALITY MEASURES FOR ETL PROCESSES: FROM GOALS TO IMPLEMENTATION 5
Cha
ract
eris
tic[1
9][6
][1
4][1
1][1
2][1
3][1
8]Characteristicswithconstructimplications
data
qual
ity-
data
char
acte
rist
ics
qual
itydi
men
sion
s-
rele
vanc
y,re
puta
tion
data
qual
ityda
taqu
ality
data
accu
racy
data
accu
racy
accu
racy
accu
racy
data
com
plet
enes
sda
taco
mpl
eten
ess
com
plet
enes
sco
mpl
eten
ess
data
fres
hnes
sfr
eshn
ess
data
fres
hnes
s,tim
elin
ess
timel
ines
stim
elin
ess
data
cons
iste
ncy
cons
iste
ncy
data
cohe
renc
e,co
rrec
tnes
s,m
inim
ality
cons
iste
ntre
pres
enta
tion
cons
iste
ncy
cons
iste
ncy,
dedu
plic
atio
n,da
taco
nfor
man
ceda
tain
terp
reta
bilit
yin
terp
reta
bilit
yin
terp
reta
bilit
y
perf
orm
ance
perf
orm
ance
perf
orm
ance
perf
orm
ance
,sof
twar
eef
ficie
ncy
perf
orm
ance
effic
ienc
y-
perf
orm
ance
-
time
effic
ienc
yla
tenc
yla
tenc
ytim
ebe
havi
our
late
ncy,
resp
onse
time
para
llelin
g&
pipe
linin
gre
sour
ceut
iliza
tion
reso
urce
utili
zatio
nch
ange
data
capt
ure
capa
city
capa
city
,thr
ough
put
qual
ityof
serv
ice
mod
esm
odes
type
sof
fact
tabl
esco
stef
ficie
ncy
-co
st,a
ffor
dabi
lity
--
valu
e-ad
ded,
pric
epr
icin
g-
upst
ream
over
head
-ov
erhe
adof
sour
cesy
stem
s-
upst
ream
over
head
--
-
secu
rity
secu
rity
-se
curi
ty-
secu
rity
secu
rity
secu
rity
confi
dent
ialit
yco
nfide
ntia
lity
com
plia
nce
man
agem
ent
inte
grity
inte
grity
avai
labi
lity
avai
labi
lity
avai
labi
lity
avai
labi
lity
avai
labi
lity
avai
labi
lity
audi
tabi
lity
-au
dita
bilit
y-
audi
tabi
lity
-pr
oven
ance
linea
ge&
depe
nden
cytr
acea
bilit
ytr
acea
bilit
ytr
acea
bilit
ytr
acea
bilit
ydo
cum
enta
tion
self
-doc
umen
ting
relia
bilit
yre
liabi
lity
relia
bilit
yre
liabi
lity
relia
bilit
y-
relia
bilit
yre
liabi
lity
proc
ess
avai
labi
lity
avai
labi
lity
resp
onsi
vene
ssav
aila
bilit
yav
aila
bilit
yfa
ultt
oler
ance
faul
ttol
eran
cefa
ultt
oler
ance
robu
stne
ssin
tegr
ityro
bust
ness
robu
stne
ss
reco
vera
bilit
yre
cove
rabi
lity
reco
vera
bilit
yre
cove
rabi
lity,
prob
lem
esca
latio
n
Characteristicsfordesignevaluation
adap
tabi
lity
--
-ad
apta
bilit
y-
--
scal
abili
tysc
alab
ility
scal
abili
tysc
alab
ility
flexi
bilit
yfle
xibi
lity
reus
abili
typo
rtab
ility
reus
abili
tyus
abili
ty-
-us
abili
ty-
--
visi
bilit
y
unde
rsta
ndab
ility
conc
ise
repr
esen
tatio
n,un
ders
tand
abili
tyun
ders
tand
ing
sour
ceda
ta
man
agea
bilit
y-
--
mod
ular
ity,
anal
yzab
ility
--
man
agea
bilit
y
mai
ntai
nabi
lity
mai
ntai
nabi
lity
mai
ntai
nabi
lity
mai
ntai
nabi
lity
mai
ntai
nabi
lity
mai
ntai
nabi
lity
test
abili
tyva
lidat
ion
test
abili
tyve
rifia
bilit
y
n/a
safe
tyac
cess
ibili
ty,
usef
ulne
ss,b
elie
vabi
lity
cust
omer
supp
ort,
belie
vabi
lity,
obje
ctiv
ity,a
mou
ntof
data
licen
cing
Figu
re3.
ET
LPr
oces
sC
hara
cter
istic
s
5

6 VASILEIOS THEODOROU
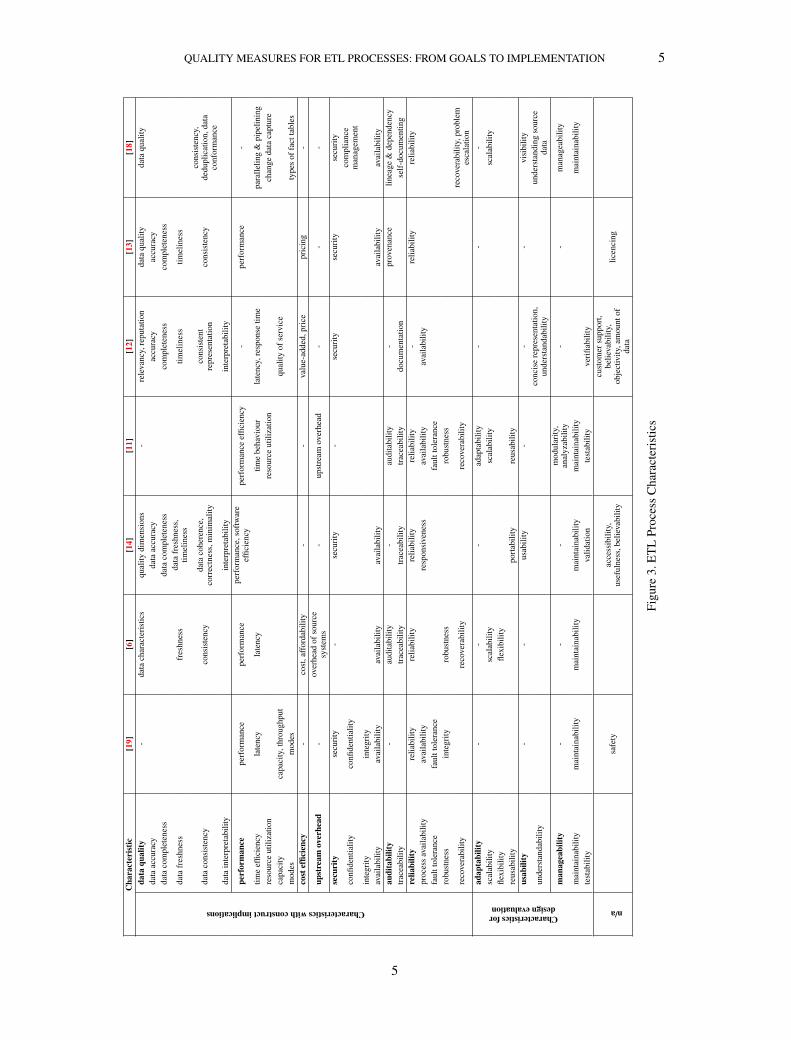
time avoiding the adherence to more recent, strictly defined standards for practical industrial use,which we are nevertheless aware of [20]. The complete list from the resulting 7 sources, coveringthe most important characteristics from a process perspective can be seen in Fig. 3. In many caseswe discovered that the same quality characteristic was referenced using a different term (synonym)and that term is shown at the corresponding table cell under each approach.
Data quality is a prime quality chracteristic of ETL processes. Its significance is recognized byall the approaches presented in our selected sources, except for [11] and [19], since the factors intheir analyses derive directly or indirectly from generic software quality attributes. Our model wasenriched with a more clear perspective of data quality in Information Systems and a practical viewof how quality criteria can lead to design decisions, after reviewing the work by [12]. Althoughthis framework is intended for interoperation of distributed Information Systems in general, manyaspects are clearly applicable in the case of ETL processes where data sources can be found indiverse locations and types.
Performance, was given attention by all presented approaches , which was expected since timebehavior and resource efficiency are the main aspects that have traditionally been examined asoptimization objectives. On the other hand, [11] and [6] were the only approaches to include theimportant characteristic of upstream overhead. However, [11] does not include security, which isdiscussed in the rest of the works. The same is true for auditability, which is absent from [19] butfound in all other works. Reliability on the other hand, is recognized as a crucial quality factor byall approaches. As expected, the more abstract quality characteristics adaptability and usability areless commonly found in the sources, in contrast with manageability which is found in all approachesexcept for [13], which does not discuss about intangible characteristics.
Although we include cost efficiency in Fig. 3, in the remainder of this paper this characteristicis not examined as the rest. The reason is that we view our quality-based analysis in a similarperspective as [21], who consider cost as a separate concern to the rest of the attributes, accordingto which any quality attribute can be improved by spending more resources and it is a matter ofweighting the benefits of this improvement to the required cost that can lead to rational decisions. Inour case, cost is considered to act as a restriction to the search space of alternative process designs.In addition, we regarded safety as non-relevant for the case of ETL processes, since these processesare computer-executable, non-critical and hence the occurrence of accidents or mishaps is not aconcern. Similarly, we considered that the characteristics of accessibility, usefulness, customersupport, believability, amount of data and objectivity found in [14] and [12] are not relevant forour case, as they refer to the quality of source or target repositories, yet do not depend on theETL process. Likewise, licencing [13] refers to concrete tools and platforms while our ETL qualityanalysis is platform independent.
Thus, we regarded for our models only characteristics that are related to the process perspectiveof the ETL and other aspects, such as characteristics of the source or target repositories, which areindependent of the process, were considered to extend beyond the concern of this study. In thisrespect, we disregarded ETL quality dimensions specific to the target data warehouse, such as thequality of OLAP modeling (e.g., schemata, hierarchies). Nevertheless, our assumption is that theETL processes evaluated by our models are functionally correct and produce output correspondingto the target repositories’ data modeling. Hence, as we will show in the following sections, ourmethod for process redesign receives as input an ETL process that has been designed respecting theinformation requirements of the data warehouse.
Through our study we identified that there are two different types of characteristics —characteristics that can actively drive the generation of patterns in the ETL process design andcharacteristics that cannot explicitly indicate the use of specific design patterns, but can still bemeasured and affect the evaluation of and the selection among alternative designs. In the remainderof this paper we refer to the first category as characteristics with construct implications and to thesecond as characteristics for design evaluation.
Concurrency Computat.: Pract. Exper. (2016)

QUALITY MEASURES FOR ETL PROCESSES: FROM GOALS TO IMPLEMENTATION 7
4. PROCESS CHARACTERISTICS WITH CONSTRUCT IMPLICATIONS
In this section, we present our model for characteristics with construct implications. Subsequently,we show the relationships between different characteristics and showcase the use of our modelthrough our running example. The proposed list of characteristics and measures can be extendedor narrowed down to match the requirements for specific use cases. Thus, our model is extensibleand can constitute a template, generically capturing the quality dimensions of ETL processes andtheir interrelationships, which can be modified and instantiated per case. The definition of eachcharacteristic can be adjusted; the proposed measures are only mentioned as valid examples thatcan be extended or replaced by other more appropriate ones; users can decide to use only anexcerpt of the model; and the quantitative effect that each characteristic can have to another candiffer for different cases. The above points also stand for the model of the following section, aboutcharacteristics for design evaluation.
4.1. Characteristics and Measures
In this subsection, we provide a definition for each characteristic as well as candidate metricsunder each definition, based on existing approaches that we discovered coming from literatureand practice in the areas of Data Warehousing and Software Engineering. For each metric thereis a definition and a symbol, either (+) or (−) denoting whether the maximization or minimizationof the metric is desirable, respectively. Similarly to the quality characteristics, the measures comefrom the areas of Data Warehousing, ETL, Data Integration and Software Engineering and BusinessProcess Management.
1. data quality (DQ): the fitness for use of the data produced as the outcome of the ETL process.It includes:
(a) data accuracy: percentage of data without data errors.M1: % of correct values [22] (+)M2: % of delivered accurate entities [22] (+)
(b) data completeness: degree of absence of missing values and entities.M1: % of missing entities from their appropriate storage [23, 22] (−)M2: % of non-empty values [22] (+)
(c) data freshness: indicator of how recent data is with respect to time elapsed since lastupdate of the target repository from the data source.M1: Instant when data are stored in the system - Instant when data are updated in the
real world [22] (−)M2: Request time - Time of last update [22] (−)M3: 1 / (1 - age * Frequency of updates) [22] (−)
(d) data consistency: degree to which each user sees a consistent view of the data and dataintegrity is maintained throughout transactions and across data sources.M1: % of entities that violate business rules [23, 22] (−)M2: % of duplicates [22] (−)
(e) data interpretability: degree to which users can understand data that they get.M1: # of entities with interpretable data (documentation for important values) [22] (+)M2: Score from User Survey (Questionnaire) [22] (+)
2. performance (PF): the performance of the ETL process as it is implemented on a system,relative to the amount of resources utilized and the timeliness of the service delivered. Itincludes:
(a) time efficiency: the degree of low response times, low processing times and highthroughput rates.
7

8 VASILEIOS THEODOROU
M1: Process cycle time [24] (−)M2: Average latency per entity in regular execution [23] (−)M3: Min/Max/Average number of blocking operations [23] (−)
(b) resource utilization: the amounts and types of resources used by the ETL process.M1: CPU load, in percentage of utilization [24] (−)M2: Memory load, in percentage of utilization [24] (−)
(c) capacity: the demand that can be placed on the system while continuing to meet timeand throughput requirements.M1: Throughput of regular workflow execution [23] (+)
(d) modes: the support for different modes of the ETL process based on demand andchanging requirements, for example batch processing, real-time event-based processing,etc.M1: Number of supported modes / Number of all possible modes (+)
3. upstream overhead (UO): the degree of additional load that the process causes to the datasources on top of their normal operations.
M1: Min/Max/Average timeline of memory consumed by the ETL process at the sourcesystem [23] (−)
4. security (SE): the protection of information during data processes and transactions. It includes:
(a) confidentiality: the degree to which data and processes are protected from unauthorizeddisclosure.M1: % of mobile computers and devices that perform all cryptographic operations
using FIPS 140-2 cryptographic modules [25] (+)M2: % of systems (workstations, laptops, servers) with latest antispyware signatures
[26] (+)M3: % of remote access points used to gain unauthorized access [25] (−)M4: % of users with access to shared accounts [25] (−)
(b) integrity: the degree to which data and processes are protected from unauthorizedmodification.M1: % of systems (workstations, laptops, servers) with latest antivirus signatures [26]
(+)(c) reliability: the degree to which the ETL process can maintain a specified level of
performance for a specified period of time. It includes:i. availability: the degree to which information, communication channels, the system
and its security mechanisms are available when needed and functioning correctly.M1: Mean time between failures (MTBF) [23] (+)M2: Uptime of ETL process [23] (+)
ii. fault tolerance: the degree to which the process operates as intended despite thepresence of faults.M1: Score representing asynchronous resumption support [23] (+)
iii. robustness: the degree to which the process operates as intended despiteunpredictable or malicious input.M1: # of replicated processes [23] (+)
iv. recoverability: the degree to which the process can recover the data directly affectedin case of interruption or failure.M1: # of recovery points used [23] (+)M2: % of successfully resumed workflow executions [23] (+)M3: Mean time to repair (MTTR) [23] (−)
Concurrency Computat.: Pract. Exper. (2016)

QUALITY MEASURES FOR ETL PROCESSES: FROM GOALS TO IMPLEMENTATION 9
5. auditability (AU): the ability of the ETL process to provide data and business ruletransparency. It includes:
(a) traceability: the ability to trace the history of the ETL process execution steps and thequality of documented information about runtime.M1: % of KPIs that can be followed, discovered or ascertained by end users [27] (+)
4.2. Characteristics Relationships
Upstream Overhead Limitation
Performance
Time Efficiency Resource Utilization Capacity Modes
-
-
Data Quality
Data FreshnessData AccuracyData Consistency
Data Completeness
+
-
Auditability
TraceabilitySecurity
Confidentiality Integrity
+-
-
Reliability
Availability Fault Tolerance RecoverabilityRobustness
Data Interpretability
Positively affectsIncludes
Negatively affects
+-
Figure 4. Dependencies among process characteristics with construct implications
In the same direction as [6] and [19] we also recognise that ETL process characteristics are notindependent of each other and each time a decision has to be made, the alternative options mightaffect different characteristics differently, but that this is not realized in completely ad hoc ways.On the contrary, we argue that there is an inherent relationship between characteristics and it canbe depicted in a qualitative model that can be instantiated per case for reasoning and automation.Our vision is that this objective model can be generic yet powerful enough in order to aid in a broadrange of ETL process design decisions.
Our model for the dependencies among characteristics with construct implications can be seenin Fig. 4. In this model we include all the characteristics with construct implications that we haveidentified and defined in Sec. 3. It consists of first-level characteristics and in some cases second-or even third-level sub-characteristics and can be read in a cause-and-effect fashion, i.e., improvingone characteristic leads to improvement or deterioration of another characteristic. We should noticethat although traditionally availability is classified directly under security, for our case availabilityis in fact a subgoal of reliability. The reason is that we regard the satisfaction of availability asa necessary but not sufficient condition for reliability. Reliability additionally requires maintainingspecified SLAs for the ETL process and therefore in our model we place availability under reliabilityand reliability under security.
Coming back to our running example from Fig. 1 and Fig. 2, it is clear that the second designwould require more time and more computational resources than the first one in order to performthe additional tasks. The measures of Process execution time and CPU load measured in percentageof utilization would have higher values indicating worse time efficiency and resource utilization.Thus, improved Data Quality and Reliability would have to be considered at the price of decreasedPerformance and whether or not the decision to select the second design would be optimal, woulddepend on the importance of each of these characteristics for the end-user. We will quantitativelyshow these effects in the following subsection.
As can be seen in Fig. 4 the improvement of any other characteristic negatively affectsperformance. That is reasonable since such improvements would require the addition of extracomplexity to the ETL process, diverging from the optimal simplicity that favours performance.Improving Data Quality would require additional checks, more frequent refreshments, additionaldata processing and so on, thus utilizing more resources and imposing a heavier load on thesystem. In the same manner, improving security would require more complex authentication,
9

10 VASILEIOS THEODOROU
authorization and accounting (AAA) mechanisms, encryption, additional recovery points, etc.,similarly having negative impact on performance. Likewise, improving auditability would requireadditional processes for logging, monitoring as well as more resources to constantly provide real-time access to such information to end-users. In a similar fashion, promoting upstream overheadlimitation would demand locks and scheduling to minimize impact of ETL processes on competingresources and therefore time and throughput limitations.
On the other hand, improving security positively affects data quality since data becomes moreprotected against ignorant users and attackers, making it more difficult for data and system processesto be altered, destroyed or corrupted. Therefore, data integrity becomes easier to maintain. Inaddition, improved system availability and robustness leads to improved data quality in the sensethat processes for data refreshing, data cleaning and so on remain undisrupted.
Regarding the impact that improving auditability has to security, it is obvious that keeping track ofsystem’s operation traces and producing real-time monitoring analytics foster faster and easier threatdetection and mitigation, thus significantly benefiting security. On the contrary, these operationshave a negative impact on upstream overhead limitation, following the principle that one systemcannot be measured without at the same time being affected.
4.3. Calculating the measures
In this subsection, we go through the measures that we have defined and apply them on our runningexample. We will do the same for the following section about the second category of measures andfor both categories, each measure is represented in the form of:
• <Char_Abbr>.<Subchar_No>.<. . . >.<Measure_Id>(<Model_Id >)
, where Char_Abbr is the characteristic abbreviation (e.g., PF for performance); Subchar_No,Measure_Id etc., are the indexes of the measures’ enumerations from the related sections; andModel_Id can take the values CM_A or CM_B, for the simple or the more complex ETL flow,or can be missing if we refer to both examples.
Through this example we showcase i) how our proposed measures can be used and ii) how twoalternative ETL designs for the same process can differ with regards to different quality dimensions,as is reflected by the corresponding measures, in a way that qualitatively agrees with our proposedmodel.
(a) Logical representation of initial ETL process that corresponds to CM_A
WS lookup: complete with data from external data source Reference CSV file: correct data by crosschecking with other data source Duplicate calculation steps: replicate flow for redundant execution Checkpoint: add recovery point
(b) Logical representation of equivalent ETL process with additional steps that corresponds to CM_B
Figure 5. Logical models of alternative ETL processes
Concurrency Computat.: Pract. Exper. (2016)
QUALITY MEASURES FOR ETL PROCESSES: FROM GOALS TO IMPLEMENTATION 11
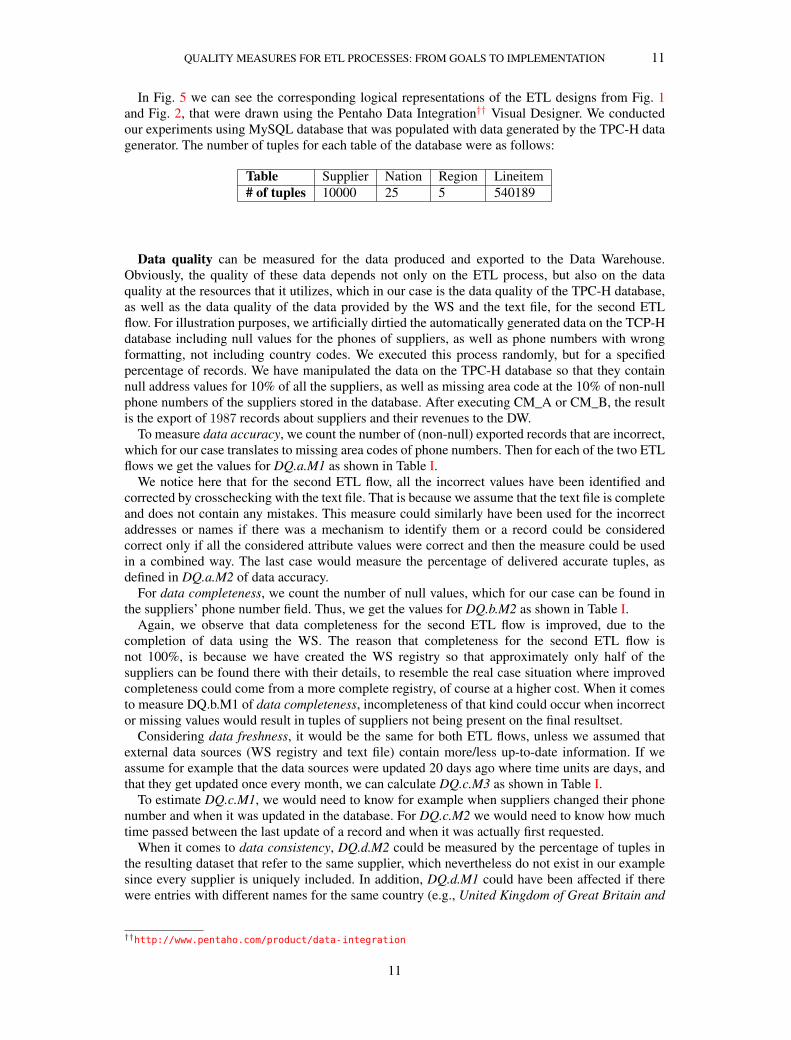
In Fig. 5 we can see the corresponding logical representations of the ETL designs from Fig. 1and Fig. 2, that were drawn using the Pentaho Data Integration†† Visual Designer. We conductedour experiments using MySQL database that was populated with data generated by the TPC-H datagenerator. The number of tuples for each table of the database were as follows:
Table Supplier Nation Region Lineitem# of tuples 10000 25 5 540189
Data quality can be measured for the data produced and exported to the Data Warehouse.Obviously, the quality of these data depends not only on the ETL process, but also on the dataquality at the resources that it utilizes, which in our case is the data quality of the TPC-H database,as well as the data quality of the data provided by the WS and the text file, for the second ETLflow. For illustration purposes, we artificially dirtied the automatically generated data on the TCP-Hdatabase including null values for the phones of suppliers, as well as phone numbers with wrongformatting, not including country codes. We executed this process randomly, but for a specifiedpercentage of records. We have manipulated the data on the TPC-H database so that they containnull address values for 10% of all the suppliers, as well as missing area code at the 10% of non-nullphone numbers of the suppliers stored in the database. After executing CM_A or CM_B, the resultis the export of 1987 records about suppliers and their revenues to the DW.
To measure data accuracy, we count the number of (non-null) exported records that are incorrect,which for our case translates to missing area codes of phone numbers. Then for each of the two ETLflows we get the values for DQ.a.M1 as shown in Table I.
We notice here that for the second ETL flow, all the incorrect values have been identified andcorrected by crosschecking with the text file. That is because we assume that the text file is completeand does not contain any mistakes. This measure could similarly have been used for the incorrectaddresses or names if there was a mechanism to identify them or a record could be consideredcorrect only if all the considered attribute values were correct and then the measure could be usedin a combined way. The last case would measure the percentage of delivered accurate tuples, asdefined in DQ.a.M2 of data accuracy.
For data completeness, we count the number of null values, which for our case can be found inthe suppliers’ phone number field. Thus, we get the values for DQ.b.M2 as shown in Table I.
Again, we observe that data completeness for the second ETL flow is improved, due to thecompletion of data using the WS. The reason that completeness for the second ETL flow isnot 100%, is because we have created the WS registry so that approximately only half of thesuppliers can be found there with their details, to resemble the real case situation where improvedcompleteness could come from a more complete registry, of course at a higher cost. When it comesto measure DQ.b.M1 of data completeness, incompleteness of that kind could occur when incorrector missing values would result in tuples of suppliers not being present on the final resultset.
Considering data freshness, it would be the same for both ETL flows, unless we assumed thatexternal data sources (WS registry and text file) contain more/less up-to-date information. If weassume for example that the data sources were updated 20 days ago where time units are days, andthat they get updated once every month, we can calculate DQ.c.M3 as shown in Table I.
To estimate DQ.c.M1, we would need to know for example when suppliers changed their phonenumber and when it was updated in the database. For DQ.c.M2 we would need to know how muchtime passed between the last update of a record and when it was actually first requested.
When it comes to data consistency, DQ.d.M2 could be measured by the percentage of tuples inthe resulting dataset that refer to the same supplier, which nevertheless do not exist in our examplesince every supplier is uniquely included. In addition, DQ.d.M1 could have been affected if therewere entries with different names for the same country (e.g., United Kingdom of Great Britain and
††http://www.pentaho.com/product/data-integration
11

12 VASILEIOS THEODOROU
Table I. Data quality measures
Measure DQ.a.M1 DQ.b.M2 DQ.c.M3Formula correct_tupples
all_tuplesnon_null_tupples
all_tuples1
1−age∗update_frequencyCM_A 91.5% 90.3% 3CM_B 100% 95.2% 3
Northern Ireland as opposed to United Kingdom) or values of different format for the same attribute(i.e., phone number as “424-242-424-242” instead of “424242424242”).
For data interpretability, to measure DQ.e.M1 we would take under consideration the existenceof comment fields for important attributes and their completeness for the resulting data. We noticethat there are plenty such comment fields in our database. For DQ.e.M2, we would conduct asurvey where actual/potential users of the ETL process would describe how well they understandthe meaning and content of each field of the resulting data.
Performance was measured by executing both of the ETL flows on Kettle Engine, running onMac OS X, 1.7 GHz Intel Core i5, 4GB DDR3 and kept average values from 10 executions.
In Table II we can see the calculation of values for measures PF.a.M1 and PF.a.M3 for timeefficiency.
Due to the existence of blocking operators, it is not relevant to calculate measure PF.a.M2 forlatency per tuple. As blocking operations, we consider the steps that have to be completed and all ofthe values that they process have to be calculated before moving to the succeeding operators, whichfor our case are the aggregation and the sorting steps.
For resource utilization, the calculation of measures PF.b.M1 and PF.b.M2 are shown in Table IIand Table III.
For capacity, we consider the size of the input datasets processed by these ETL flows, divided bythe time that they need to execute and calculate measures PF.c.M1 in Table III.
We should notice here that the input size for the two processes slightly differs, because for thesecond process we also have to take under consideration the input data that come from the datacleaning tasks (WS and text file). A possible explanation for the big difference of the throughputvalues for the two ETL flows can be that the second flow requires the concurrent execution of anumber of steps, which decreases the available processing power that accounts for each.
It is clear from all the performance measures shown above, that the design of CM_B issignificantly worse that that of CM_A with respect to performance. In other words, the measuresagree with our model, according to which the improvement of some quality characteristic(s) (i.e.,data quality and security in our example) negatively affects some other(s) (i.e., performance, if wecompare CM_B to CM_A).
When it comes to modes, if we consider batch processing and real-time processing as the twopossible modes, our ETL flows are only designed to be executed in a batch mode, as calculated inmeasure PF.d.M1 (Table III).
Upstream overhead can be considered as the additional load that comes into play because ofthe use of additional services, which in our case can refer to the WS. Therefore, there would beupstream overhead only for the second ETL flow and it could be measured as such:
• UO.M1(CM_B) = AV G_memory_consumed_by_WS = 426MB
This memory consumption lasted for as long as the interaction of the ETL with the WS that wasan avarage of 12.9sec, which corresponds to: 12.9sec
18.9sec = 68% of the process cycle time.Security did not play an important role for setting up our tests, except from reliability. Thus,
for confidentiality, SE.a.M1 would be 0, since we are not using any cryptographic operations andthe web service communication is realized over HTTP. SE.a.M2 would refer to the anti-spywareinstalled in the operation system of the computer where we run the ETL processes and SE.a.M3would also be 0 since there was no provisioning for accessing or firing the execution of the ETLprocesses remotely. SE.a.M4 would be 100%, since all users could have shared access to the
Concurrency Computat.: Pract. Exper. (2016)

QUALITY MEASURES FOR ETL PROCESSES: FROM GOALS TO IMPLEMENTATION 13
Table II. Performance measures - Part 1
Measure PF.a.M1 PF.a.M3 PF.b.M1Formula Process_cycle_time No_of_aggr +No_of_sort CPU
No_of_logical_processorsCM_A 10.4sec 8 49.25CM_B 18.9sec 11 55.75
Table III. Performance measures - Part 2
Measure PF.b.M2 PF.c.M1 PF.d.M1Formula used_memory
total_memoryInput_data_size
Process_cycle_timeNo_supported_modesall_possible_modes
CM_A 0.166 52906 tuplessec 50%
CM_B 0.181 29179 tuplessec 50%
terminal of the process execution. Similarly for integrity, SE.b.M1 would refer to antivirus installedin the operation system of the terminal where we run the ETL processes.
When it comes to reliability, the measures for availability and fault tolerance can easily beextracted from historic traces of the ETL process execution, monitoring the time of failures andthe periods during which the ETL process was available and the periods during which it wasnot responsive, for example due to memory limitations in high demand. Of course, such analysispresumes that the ETL process has a continuous lifecycle, corresponding to changing data in the datasources. Regarding robustness, in the second ETL flow there is a part that duplicates the calculationsteps to guarantee that even in the presence of unpredictable or malicious input that could cause thefailure of this part of the ETL flow, there will be a duplicate of this part for the resumption of theexecution. Thus, the measure for the second ETL flow is:
• SE.c.iii.M1(CM_B) = No_of_replicated_processes = 1
In a similar manner, recoverability is improved in the second ETL flow, by the addition of arecovery point. Thus, if for any reason the execution of the ETL flow is interrupted or terminated,already processed data is not lost and execution can continue, starting from the latest checkpoint.
• SE.c.iv.M1(CM_B) = No_of_recovery_points = 1
The next two measures SE.c.iv.M2 and SE.c.iv.M3 for recoverability, can again be extracted fromhistoric traces of the ETL process execution.
Auditability and traceability can be measured, arguing that all of the KPIs or measures that havebeen considered so far can be monitored and followed for both ETL flows. Therefore, assuming thatthese are all the KPIs that we are interested in, the corresponding measure would be:
• AU.a.M1 = %_of_observable_KPIs = No_of_observable_KPIsNo_of_important_KPIs = 31
31 = 100%
5. PROCESS CHARACTERISTICS FOR DESIGN EVALUATION
In this section we show our model about characteristics for design evaluation. These characteristicsare the most difficult ones to analyze as they are more abstract and intangible. As mentioned above,the intention of this model is to be used as an extensible, modifiable template that can be adjustedper case. Similarly to Sec. 4 we first define the characteristics and then show the relationships amongthem.
5.1. Characteristics and Measures
In this subsection we provide a definition for each characteristic for design evaluation, as well asproposed metrics deriving from literature.
13

14 VASILEIOS THEODOROU
1. adaptability (AD): the degree to which ETL process can effectively and efficiently be adaptedfor different operational or usage environments. It includes:
(a) scalability: the ability of the ETL process to handle a growing demand, regarding boththe size and complexity of input data and the number of concurrent process users.M1: Ratio of system’s productivity figures at two different scale factors, where
productivity figure = throughput * QoS/ cost [28] (+)M2: # of Work Products of the process model, i.e., documents and models produced
during process execution [15] (−)(b) flexibility: the ability of the ETL flow to provide alternative options and dynamically
adjust to environmental changes (e.g., by automatically switching endpoints).M1: # of precedence dependences between activities [15] (−)
(c) reusability: the degree to which components of the ETL process can be used foroperations of other processes.M1: % of reused low level operations in the ETL process [29] (+)The following measure is valid in the case where there are statistical data about the useof various modules (e.g., transformation or mapping operations) of the ETL process:M2: Average of how many times low level operations in the ETL process have been
reused per specified time frame [29] (+)
2. usability (US): the ease of use and configuration of the implemented ETL process on thesystem. It includes:
(a) understandability: the clearness and self-descriptiveness of the ETL process model for(non-technical) end users.M1: # of activities of the software process model [15] (−)M2: # of precedence dependences between activities [15] (−)
3. manageability (MN): the easiness of monitoring, analyzing, testing and tuning theimplemented ETL process.
(a) maintainability: the degree of effectiveness and efficiency with which the ETL processcan be modified to implement any future changes.M1: Length of process workflow’s longest path [23] (−)M2: # of relationships among workflow’s components [23] (−)M3: # of input and output flows in the process model [30] (−)M4: # of output elements in the process model [30] (−)M5: # of merge elements in the process model [30] (−)M6: # of input and output elements in the process model [30] (−)
(b) testability: the degree to which the process can be tested for feasibility, functionalcorrectness and performance prediction.M1: Cyclomatic Complexity of the ETL process workflow [31] (−)
5.2. Characteristics Relationships
In Fig. 6 we show the dependencies among characteristics for design evaluation. Increased usabilityfavors manageability because a more concise, self-descriptive system is easier to operate andmaintain. Similarly, adaptability positively affects usability, since an easily configured system iseasier to use and does not require specialized skill-set from the end user. On the other hand,adaptability can be achieved with more complex systems and therefore it negatively affectsmanageability. This negative relationship might appear counter-intuitive, but it should be notedthat our view of adaptability does not refer to autonomic behavior, which would possibly provideself-management capabilities. Instead, we regard manageability from an operator’s perspectivewhere control is desirable and the addition of unpredictable, “hidden” mechanisms would make
Concurrency Computat.: Pract. Exper. (2016)

QUALITY MEASURES FOR ETL PROCESSES: FROM GOALS TO IMPLEMENTATION 15
Understandability
Usability
Manageability Adaptability
Scalability Flexibility Reusability
++
-
Maintainability Testability
Positively affectsIncludes
Negatively affects
+-
Figure 6. Dependencies among characteristics for design evaluation
the process more difficult to test and maintain. Regarding the apparent conflict between the negativedirect relationship among Adaptability and Manageability and the transitive positive relationshipbetween Adaptability, Usability and Manageability, our qualitative model allows for different directand indirect influences between characteristics. If the model is instantiated and extended withmeasurable components to quantitatively specify these influences (i.e., weights on the edges of theDigraph), then the compound effect that the improvement of one characteristic has to another willdepend on the elicitation techniques used.
5.3. Calculating the measures
Similarly to the previous section and using the same notation, we show in this subsection howour measures can be calculated for the characteristics for design evaluation, for the two alternativedesigns of Fig. 5.
Adaptability was measured as such: for the first measure AD.a.M1 of scalability, we cancalculate the throughput, cost and QoS for two different scale factors, for example for differentallocation of resources (CPU, memory etc.) to the system for the ETL process execution. As QoSwe can consider any of the measures that we have examined so far. The calculation of measureAD.a.M2 is as follows:
• AD.a.M2(CM_A) = No_of_work_products = 1• AD.a.M2(CM_B) = No_of_work_products = 2
The difference is due to the fact that the second ETL flow exports data not only to the DW, butalso to the checkpoint and so it has 2 work products.
To measure flexibility, we have to count the precedence dependences between activities, forexample for every Join operation, the incoming data streams must be sorted, which dictatesprecedence dependences between Join and Sort operators. Essentially, the way that both of theseETL flows have been designed, there are precedence dependences between each operation and itspredecessor(s), so this measure will equal to the number of edges, if we view the ETL process as aDirected Acyclic Graph (DAG):
• AD.b.M1(CM_A) = No_of_precedence_dependencies = 20• AD.b.M1(CM_B) = No_of_precedence_dependencies = 44
Regarding reusability, we can calculate measures AD.c.M1 and AD.c.M2 with respect to theability of operations to be reused in other ETL flows. For example, using the GUI for Pentaho DataIntegration (PDI), some operators can simply be copied/pasted to/from the clipboard and functionnormally as part of different flows. These operators could be considered to have locality among thedifferent flows. This is not true for example for Table input/output operations, since the databaseconnectivity and data source to be used must be explicitly defined for every flow. For measureAD.c.M1, we can compare the two ETL flows and identify the operators that have been reused fromthe first to the second flow, which for our case are all of the operators from the first flow:
• AD.c.M1(CM_B) = %_of_reused_operators = No_of_reused_operatorsNo_of_operators = 20
20 = 100%
Usability and understandability were evaluated using the following measures:
15

16 VASILEIOS THEODOROU
Table IV. Maintainability measures - Part 1
Measure MN.a.M1 MN.a.M2 MN.a.M3Formula Length_of_longest_path No_of_activity_relationships No_of_i/o_flowsCM_A 9 20 5CM_B 23 44 8
Table V. Maintainability measures - Part 2
Measure MN.a.M4 MN.a.M5 MN.a.M6Formula No_of_outputs No_of_merge No_of_i/o_elementsCM_A 1 4 5CM_B 2 8 8
• US.a.M1(CM_A) = No_of_activities = 20• US.a.M2(CM_A) = No_of_precedence_dependencies = 20• US.a.M1(CM_B) = No_of_activities = 41• US.a.M2(CM_B) = No_of_precedence_dependencies = 44
Manageability can be measured, if we consider the ETL flow as a DAG, where each ETL logicaloperation corresponds to a node and each control flow precedence relationship corresponds to adirected edge. Hence, we have the measures for maintainability as shown in Table IV and Table V.
Regarding testability, we can measure Cyclomatic Complexity (CC) for each flow:
• MN.b.M1(CM_A) = CC = No_of_nodes−No_of_edges+No_of_cycles =20− 20 + 0 = 0
• MN.b.M1(CM_B) = CC = 44− 41 + 0 = 3
From the above measures, we can clearly see how the design of CM_B is less usable, manageableand adaptable than CM_A. This is not only an intuitive impression from looking at a more complexprocess model, but can also be quantitatively measured in an automatic and straightforward fashion,thanks to the gathered metrics.
6. GOAL MODELING FOR ETL DESIGN
The research area of Requirements Engineering has been active over the past years, offering aplethora of frameworks and methodologies to bridge the gap between stakeholders’ (early andlate) design goals and specific decisions. The field of Goal-Oriented Requirements Engineeringadditionally depicts the alignment between requirements and goals and their relationship to strategicdecisions.
A goal constitutes an objective of a business, for example Increase revenue, Improve customersatisfaction and so on. A goal can be satisfied or not, depending not only on the success ofthe corresponding tactical steps undertaken but also on factors external to the goal, such asenvironmental conditions or the satisfaction or not of other goals that can affect it. Hence, a goalcan be decomposed (or refined as found in literature) to other more simple goals — its subgoals —in different ways, the most common being AND and OR decomposition. Examples of subgoals forthe goal Increase revenue, can be the goals Reduce production costs and Increase sales.
In general, the semantics of an AND-decomposition is that if all of the subgoals of a goal Gthat participate in the same AND-decomposition are satisfied, then G is satisfied. Regarding OR-decomposition, it introduces the possibility of alternative ways to satisfy one goal. That is, if anyof the (groups of AND-)subgoals of a goal G that participate in an OR-decomposition is satisfied,then G is satisfied. Furthermore, the satisfaction of a goal might be influenced by the satisfaction ofanother goal, either positively or negatively.
Concurrency Computat.: Pract. Exper. (2016)

QUALITY MEASURES FOR ETL PROCESSES: FROM GOALS TO IMPLEMENTATION 17
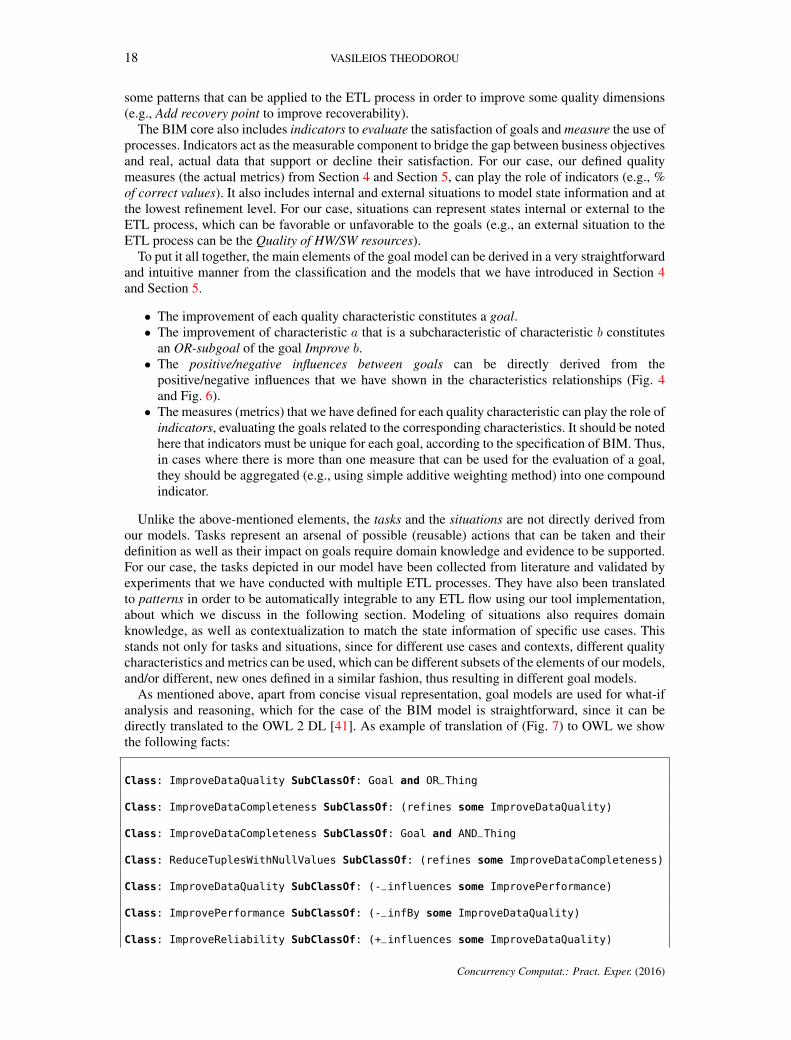
It is natural that goals and their interrelationships are usually depicted diagrammaticallyusing goal-models, with goals being represented as boxes and arrows connecting them to showrelationships for goal elicitation. For our case, goals are quality goals about the ETL process (e.g.,Improve performance, Improve data quality) and as we have mentioned above, the satisfactionof one such goal might affect negatively or positively the satisfaction of another, which can beshown in the model using arrows of positive or negative influence. In addition, quality goals canbe decomposed to subgoals, for example the goal Improve reliability can be satisfied either bysatisfying the goal Improve robustness OR the goal Improve recoverability. These refinementscan be directly derived by our model of quality characteristics and subcharacteristics, where theimprovement of the latter can play the role of subgoals to the goals of improvement of the former.We can see for our use case, goals, subgoals and influences in Fig. 7, but more details about thismodel will be provided below, where we describe the specific goal modeling paradigm that has beenused.
Goal models are used not only to lighten for business users the cognitive load of managingmultiple goals but also to aid in their analysis through reasoning. By defining specific rules forsatisfaction propagation through different parts of the goal model (e.g., if any of the AND-subgoalsis denied → the goal is denied), users can assume given values for part of the model and test thefeasibility of different what-if scenarios; they can see what implications (if any) are applied to theother parts of the model; in some models they can even make decisions about specific actions to betaken, in a top down approach where they select which goal(s) they would like to satisfy. Differentgoal modeling paradigms offer different levels of expressiveness.
A thorough review of goal-oriented approaches is provided by [32, 33] which present the basicconcepts of goal-oriented requirements engineering and show through examples how goals can berefined for the selection among alternative architectural designs. The author illustrates the use ofthe KAOS framework for modeling, specifying and analyzing requirements in order to decide aboutsystem architectures. Additionally to goal decompositions, contribution links and partial negativeor positive contribution among goals, the NFR (non-functional requirement) modeling framework[34] also introduces the concept of softgoals: intangible goals without clear-cut criteria. The i* [35]framework integrates these concepts with resources, and dependencies between actors to facilitatethe modeling for identifying stakeholders and for examining the problem domain while exposingearly phase system design requirements.
In a more recent work, [36] compares several existing approaches on goal oriented requirementsanalysis and shows how different modeling of the same goals can lead to different evaluation anddecisions.
Goal modeling approaches have also been suggested to aid with decision making for BusinessIntelligence. An application of the Tropos goal modeling methodology [37] to data warehousingis suggested by [38], which introduces a technique to map requirements with facts, dimensionsand measures to relevant data schemata and decisions. This technique can be seen as a first steptowards requirements-oriented data warehousing, concentrating on functionality and early phasedesign. [39] presents a goal modeling framework to support Collaborative BI systems requirementselicitation and the business intelligence model (BIM) [40] is a goal modeling paradigm, specific toBI context that is used to represent, in an object-centered way the interaction among different goalsand situations.
6.1. Applying BIM to ETL processes
We applied the BIM Model for our running example (Fig. 7), in order to aid in ETL Process designdecisions. In the BIM model, a goal is an intentional situation that is desired by the (viewpoint)organization and BIM models the positive or negative relationship among them, their elicitationfrom other goals (subgoals) and from tasks (or processes as they are referred in newer versions),which are processes or set of actions that are related to some goal and can achieve it, to provide a“how” dimension. The satisfaction of a goal can be inferred from the satisfaction level of other goals.For our case, goals are quality goals for the ETL process (e.g., Improve reliability) and tasks are
17
18 VASILEIOS THEODOROU
some patterns that can be applied to the ETL process in order to improve some quality dimensions(e.g., Add recovery point to improve recoverability).
The BIM core also includes indicators to evaluate the satisfaction of goals and measure the use ofprocesses. Indicators act as the measurable component to bridge the gap between business objectivesand real, actual data that support or decline their satisfaction. For our case, our defined qualitymeasures (the actual metrics) from Section 4 and Section 5, can play the role of indicators (e.g., %of correct values). It also includes internal and external situations to model state information and atthe lowest refinement level. For our case, situations can represent states internal or external to theETL process, which can be favorable or unfavorable to the goals (e.g., an external situation to theETL process can be the Quality of HW/SW resources).
To put it all together, the main elements of the goal model can be derived in a very straightforwardand intuitive manner from the classification and the models that we have introduced in Section 4and Section 5.
• The improvement of each quality characteristic constitutes a goal.• The improvement of characteristic a that is a subcharacteristic of characteristic b constitutes
an OR-subgoal of the goal Improve b.• The positive/negative influences between goals can be directly derived from the
positive/negative influences that we have shown in the characteristics relationships (Fig. 4and Fig. 6).
• The measures (metrics) that we have defined for each quality characteristic can play the role ofindicators, evaluating the goals related to the corresponding characteristics. It should be notedhere that indicators must be unique for each goal, according to the specification of BIM. Thus,in cases where there is more than one measure that can be used for the evaluation of a goal,they should be aggregated (e.g., using simple additive weighting method) into one compoundindicator.
Unlike the above-mentioned elements, the tasks and the situations are not directly derived fromour models. Tasks represent an arsenal of possible (reusable) actions that can be taken and theirdefinition as well as their impact on goals require domain knowledge and evidence to be supported.For our case, the tasks depicted in our model have been collected from literature and validated byexperiments that we have conducted with multiple ETL processes. They have also been translatedto patterns in order to be automatically integrable to any ETL flow using our tool implementation,about which we discuss in the following section. Modeling of situations also requires domainknowledge, as well as contextualization to match the state information of specific use cases. Thisstands not only for tasks and situations, since for different use cases and contexts, different qualitycharacteristics and metrics can be used, which can be different subsets of the elements of our models,and/or different, new ones defined in a similar fashion, thus resulting in different goal models.
As mentioned above, apart from concise visual representation, goal models are used for what-ifanalysis and reasoning, which for the case of the BIM model is straightforward, since it can bedirectly translated to the OWL 2 DL [41]. As example of translation of (Fig. 7) to OWL we showthe following facts:
Class: ImproveDataQuality SubClassOf: Goal and OR_Thing
Class: ImproveDataCompleteness SubClassOf: (refines some ImproveDataQuality)
Class: ImproveDataCompleteness SubClassOf: Goal and AND_Thing
Class: ReduceTuplesWithNullValues SubClassOf: (refines some ImproveDataCompleteness)
Class: ImproveDataQuality SubClassOf: (-_influences some ImprovePerformance)
Class: ImprovePerformance SubClassOf: (-_infBy some ImproveDataQuality)
Class: ImproveReliability SubClassOf: (+_influences some ImproveDataQuality)
Concurrency Computat.: Pract. Exper. (2016)

QUALITY MEASURES FOR ETL PROCESSES: FROM GOALS TO IMPLEMENTATION 19
Class: ImproveDataQuality SubClassOf: (+_infBy some ImproveReliability)
Class: ImproveDataQuality SubClassOf: (refinedBy exactly 2) and(refines exactly 0) and (influences exactly 1) and (infBy exactly 2)
Listing 1: OWL facts for running example
For more information about the BIM and its translation to OWL, interested readers are referredto [42].
Increase # of replicated processes
Improve performance
Improve security
Improve data quality
- -
+
Improve data completeness
Improve robustness Improve
recoverability
Improve data accuracy
Quality of HW / SW resources
+
+
Complete with data from external
data source
Correct data by crosschecking with other
data source
Add recovery
point
Replicate flow for redundant
execution
% of tuples that violate business
rules% of correct values
OR
Goal
Task
Indicator
Situation(External)
Situation(Internal)
ANDInfluencesEvaluates
Reduce tuples with null values
Increase # of recovery points
Increase % of correct values
# of recovery points used
# of replicated processes
Improve reliability
Figure 7. Goal modeling for running example
7. USER-CENTERED ETL OPTIMIZATION
In this section, we showcase how our model can provide the conceptual and practical base, uponwhich a user-centered method can be applied to translate user goals about ETL process quality tospecific implementation steps. Thus, we introduce our proposed architecture of this method togetherwith explanation of how it is applied to our running example.
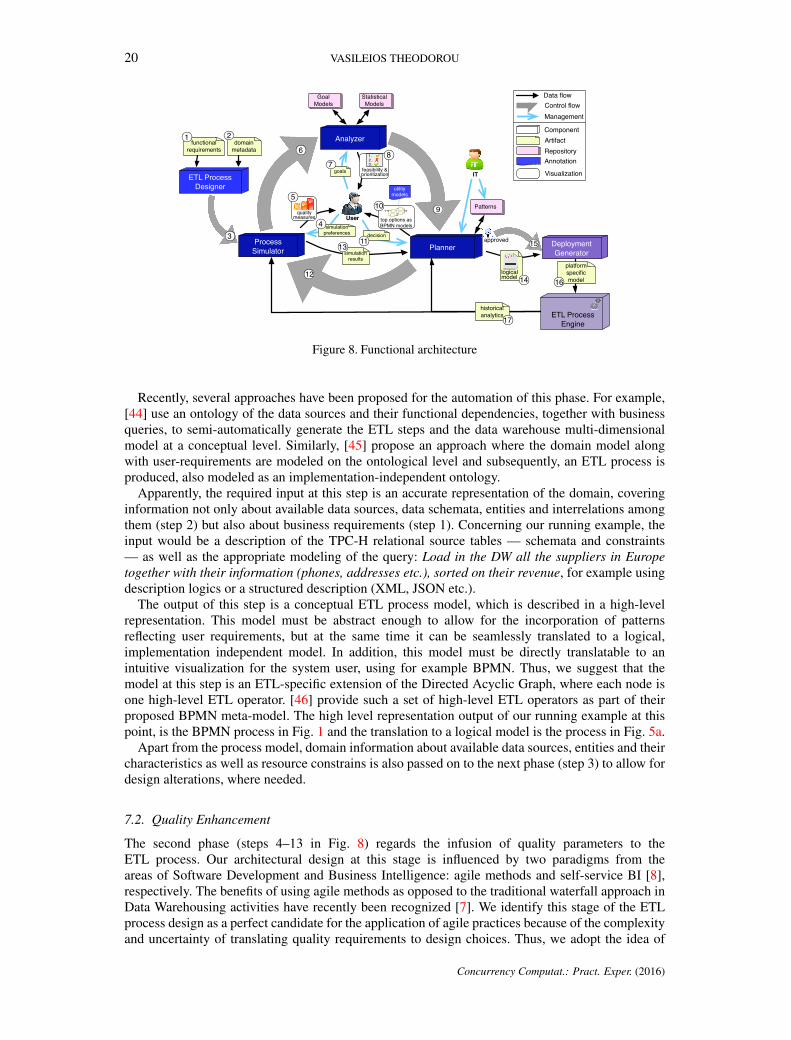
In Fig. 8 we can see the architecture of a novel methodology, which we have presented in [43],for the end-to-end design of ETL processes that takes under consideration both functional and non-functional requirements. As can be seen from Fig. 8, which is labeled with a number for eachstep, our methodology consists of three phases: design of an ETL process based on functionalrequirements (steps 1–3); improvement by instillation of user-defined quality characteristics to theprocess (steps 4–13); and finally deployment and execution (steps 15–17). In order to promoteautomation and user-centricity, our modular architecture employs reuse of components and patternsto streamline the design. Furthermore, for the improvement phase we apply an iterative model whereusers are the key participants through well-defined collaborative interfaces. In the following wedescribe each component in more detail, as well as the application to our running example.
7.1. Functionality-Based Design
The ETL Process Designer component is responsible for the design of an ETL process modelthat implements the basic ETL functionality: extraction of data from the original data sources,transformation of data to comply with functional requirements and finally loading into targetrepositories. This part of the method (steps 1–3 in Fig. 8) only concerns the functional requirementsfor the ETL process, producing an ETL model that complies with the information requirements andthe characteristics of the target repositories (e.g., star schema with specific facts and dimensions).Thus, it is not connected to our models about quality (or non-functional) requirements. However,it is presented here to showcase how it guarantees the generation of a functionally correct ETLprocess, which can subsequently be provided as input to and be improved by a quality-enhancementphase.
19
20 VASILEIOS THEODOROU
Process Simulator
Analyzer
Goal Models
Patterns
Planner
User
ETL Process Designer
ETL Process Engine
platform specific model
approved3
6
9
12
utility models
measuresquality
Deployment Generator
Data flowControl flow
ComponentArtifactRepositoryAnnotation
Visualization
historical analytics
goals
modellogical
decision
simulation results
Statistical Models
top options as BPMN models
domain metadata
functional requirements
7
10
1113
14
15
16
17
1 2
simulation preferences
4
5
IT
Management
prioritizationfeasibility &
1.2.3.X
8
���������
Figure 8. Functional architecture
Recently, several approaches have been proposed for the automation of this phase. For example,[44] use an ontology of the data sources and their functional dependencies, together with businessqueries, to semi-automatically generate the ETL steps and the data warehouse multi-dimensionalmodel at a conceptual level. Similarly, [45] propose an approach where the domain model alongwith user-requirements are modeled on the ontological level and subsequently, an ETL process isproduced, also modeled as an implementation-independent ontology.
Apparently, the required input at this step is an accurate representation of the domain, coveringinformation not only about available data sources, data schemata, entities and interrelations amongthem (step 2) but also about business requirements (step 1). Concerning our running example, theinput would be a description of the TPC-H relational source tables — schemata and constraints— as well as the appropriate modeling of the query: Load in the DW all the suppliers in Europetogether with their information (phones, addresses etc.), sorted on their revenue, for example usingdescription logics or a structured description (XML, JSON etc.).
The output of this step is a conceptual ETL process model, which is described in a high-levelrepresentation. This model must be abstract enough to allow for the incorporation of patternsreflecting user requirements, but at the same time it can be seamlessly translated to a logical,implementation independent model. In addition, this model must be directly translatable to anintuitive visualization for the system user, using for example BPMN. Thus, we suggest that themodel at this step is an ETL-specific extension of the Directed Acyclic Graph, where each node isone high-level ETL operator. [46] provide such a set of high-level ETL operators as part of theirproposed BPMN meta-model. The high level representation output of our running example at thispoint, is the BPMN process in Fig. 1 and the translation to a logical model is the process in Fig. 5a.
Apart from the process model, domain information about available data sources, entities and theircharacteristics as well as resource constrains is also passed on to the next phase (step 3) to allow fordesign alterations, where needed.
7.2. Quality Enhancement
The second phase (steps 4–13 in Fig. 8) regards the infusion of quality parameters to theETL process. Our architectural design at this stage is influenced by two paradigms from theareas of Software Development and Business Intelligence: agile methods and self-service BI [8],respectively. The benefits of using agile methods as opposed to the traditional waterfall approach inData Warehousing activities have recently been recognized [7]. We identify this stage of the ETLprocess design as a perfect candidate for the application of agile practices because of the complexityand uncertainty of translating quality requirements to design choices. Thus, we adopt the idea of
Concurrency Computat.: Pract. Exper. (2016)
QUALITY MEASURES FOR ETL PROCESSES: FROM GOALS TO IMPLEMENTATION 21
incremental and iterative design with users in the center of the process. Likewise, we adopt theconcept of strategy-driven business process analysis from the area of self-service BI, where usersmake decisions in a declarative fashion based on strategies, goals and measures.
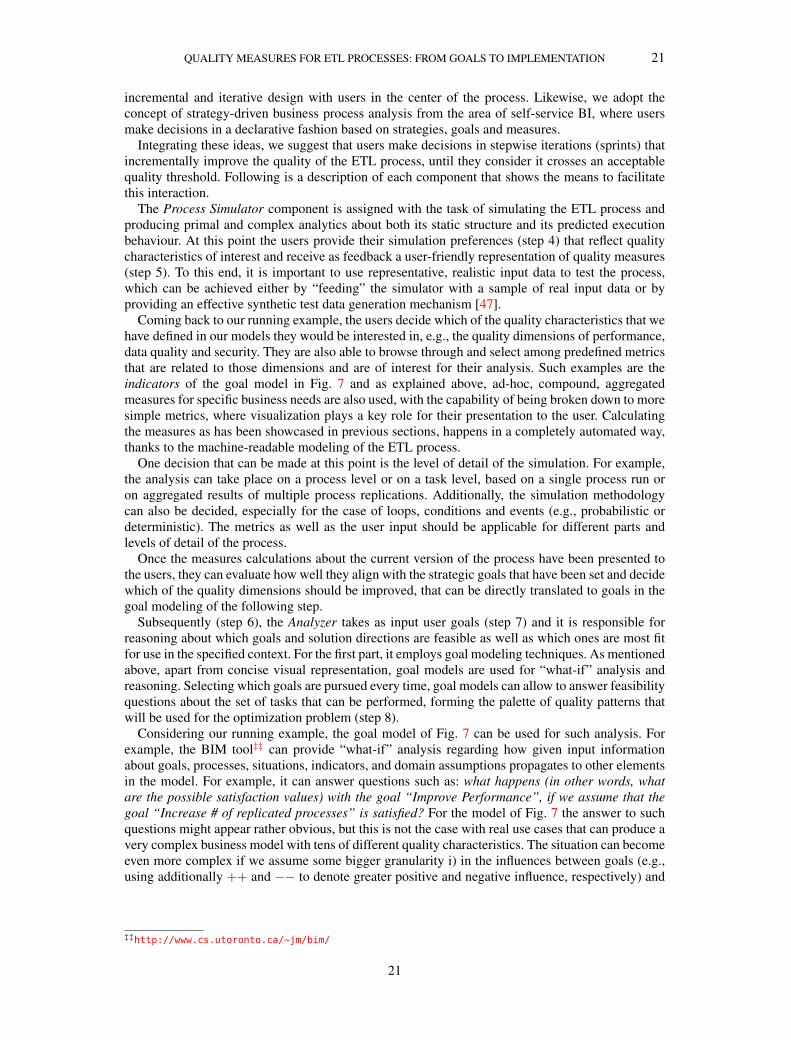
Integrating these ideas, we suggest that users make decisions in stepwise iterations (sprints) thatincrementally improve the quality of the ETL process, until they consider it crosses an acceptablequality threshold. Following is a description of each component that shows the means to facilitatethis interaction.
The Process Simulator component is assigned with the task of simulating the ETL process andproducing primal and complex analytics about both its static structure and its predicted executionbehaviour. At this point the users provide their simulation preferences (step 4) that reflect qualitycharacteristics of interest and receive as feedback a user-friendly representation of quality measures(step 5). To this end, it is important to use representative, realistic input data to test the process,which can be achieved either by “feeding” the simulator with a sample of real input data or byproviding an effective synthetic test data generation mechanism [47].
Coming back to our running example, the users decide which of the quality characteristics that wehave defined in our models they would be interested in, e.g., the quality dimensions of performance,data quality and security. They are also able to browse through and select among predefined metricsthat are related to those dimensions and are of interest for their analysis. Such examples are theindicators of the goal model in Fig. 7 and as explained above, ad-hoc, compound, aggregatedmeasures for specific business needs are also used, with the capability of being broken down to moresimple metrics, where visualization plays a key role for their presentation to the user. Calculatingthe measures as has been showcased in previous sections, happens in a completely automated way,thanks to the machine-readable modeling of the ETL process.
One decision that can be made at this point is the level of detail of the simulation. For example,the analysis can take place on a process level or on a task level, based on a single process run oron aggregated results of multiple process replications. Additionally, the simulation methodologycan also be decided, especially for the case of loops, conditions and events (e.g., probabilistic ordeterministic). The metrics as well as the user input should be applicable for different parts andlevels of detail of the process.
Once the measures calculations about the current version of the process have been presented tothe users, they can evaluate how well they align with the strategic goals that have been set and decidewhich of the quality dimensions should be improved, that can be directly translated to goals in thegoal modeling of the following step.
Subsequently (step 6), the Analyzer takes as input user goals (step 7) and it is responsible forreasoning about which goals and solution directions are feasible as well as which ones are most fitfor use in the specified context. For the first part, it employs goal modeling techniques. As mentionedabove, apart from concise visual representation, goal models are used for “what-if” analysis andreasoning. Selecting which goals are pursued every time, goal models can allow to answer feasibilityquestions about the set of tasks that can be performed, forming the palette of quality patterns thatwill be used for the optimization problem (step 8).
Considering our running example, the goal model of Fig. 7 can be used for such analysis. Forexample, the BIM tool‡‡ can provide “what-if” analysis regarding how given input informationabout goals, processes, situations, indicators, and domain assumptions propagates to other elementsin the model. For example, it can answer questions such as: what happens (in other words, whatare the possible satisfaction values) with the goal “Improve Performance”, if we assume that thegoal “Increase # of replicated processes” is satisfied? For the model of Fig. 7 the answer to suchquestions might appear rather obvious, but this is not the case with real use cases that can produce avery complex business model with tens of different quality characteristics. The situation can becomeeven more complex if we assume some bigger granularity i) in the influences between goals (e.g.,using additionally ++ and −− to denote greater positive and negative influence, respectively) and
‡‡http://www.cs.utoronto.ca/~jm/bim/
21

22 VASILEIOS THEODOROU
ii) in the possible satisfiability values (e.g., using additionally partial satisfaction and partial denialof goals).
A top-down reasoning is also possible, where the user can select which goals need to besatisfied/denied and the tool can provide possible tasks that can be implemented. For example,selecting the satisfaction of the goals Improve security and Improve performance (at the sameiteration) would return no possible tasks, but selecting the satisfaction of the goal Improve dataquality would return the possible tasks of Complete with data from external data source and Correctdata by crosschecking with other data source.
The second process that can be conducted by the Analyzer is the qualitative evaluation ofalternative design patterns application. For this purpose, statistical models can be used that will takeas input user goals and quality measures from the simulation of alternative ETL process models andwill produce as output (step 8) the (quantitative) relationships between goals and quality patterns,and thus the prioritization of the patterns that should be used, based on user’s goals.
The Planner is a core component of the quality enhancement phase, responsible for applyingpatterns on the ETL process that improve its quality, using as input information about the processstructure, current estimated metrics and goals and available patterns prioritization. The availablepattern toolset can be predefined and extended on a per case basis and the resulting model afterthe integration of patterns is a logical model. This model includes a set of configuration andmanagement operations that are not directly related to the functionality of specific flow components,but are rather external to the process (e.g., security configurations). These operations are necessaryto complete the palette of available improvement steps for the satisfaction of quality goals. For ourrunning example, such patterns are the tasks of the goal model (Fig. 7).
Even though the problem space is restricted by estimated (monetary) cost, the optimizationproblem of selecting an optimal combination of patterns to be applied to the process can beformulated as a multi-objective knapsack problem [48]. In order to tackle complexity, we proposethe use of goal models and statistical models on the previous step on one hand; and the applicationof only one pattern during each iteration, on the other. In this direction, after reasoning, the Plannerrecommends to the user a list of the highest ranked potential patterns (step 10) in a graph-likevisualization, together with utility models, which are annotations denoting the estimated affect ofeach pattern to the quality goals. Judging solely from the BPMN models and the utility models, usersmake a selection decision (step 11) and the Planner implements this decision by integrating a patternto the existing process flow. These patterns are in the form of process components and the Plannercarefully merges them to the existing process [49]. Subsequently, new iteration cycles commence(step 12), until the users consider that the model adequately satisfies quality goals. The Plannerreceives feedback from the actual runtime of the executed process as well as from their simulation(step 13) in order to adjust its heuristics and increase accuracy when selecting top options.
Assessing the feasibility of our approach, we have implemented and presented POIESIS [50]as a prototype of the Planner component. Our tool offers a predefined set of patterns that can begenerated and applied to any ETL process on a logical level. It also offers to users the option ofdefining their own patterns, reusing existing structures and patterns as templates, as well as theirown (compound) measures. Hence, POIESIS takes as input the logical representation of an ETLprocess, as well as the selected patterns to be used and produces alternative ETL flows with differentpositioning and combinations of the patterns on each flow. The measures for the quality attributesof interest are presented to the user for the top performing flows (using simulation results) and theuser selects which of the alternative flows to be used for implementation or further analysis.
Regarding our running example, after four iterations, where the user would select the goals toImprove data completeness, Improve data accuracy, Improve robustness and Improve reliability,the resulting ETL logical model would be the one of Fig. 5b, which corresponds to the initial ETLmodel with added and integrated patterns.
For data completeness, a pattern has been added to complete missing rows and null valuesfrom external data sources. We implemented a simple web application that receives a (HTTP)request containing the suppliers’ names for suppliers with empty (null) values for their phones.After matching those names to existing records in its registry, if found the application replies with
Concurrency Computat.: Pract. Exper. (2016)
QUALITY MEASURES FOR ETL PROCESSES: FROM GOALS TO IMPLEMENTATION 23
information about the suppliers, which contains their phones. The corresponding logical steps ofthe ETL process using this service as a client, can be seen in the WS lookup part of the ETL flowin Fig. 5b. Likewise, for data accuracy, a pattern has been applied to correct data, according tocrosschecks with other data sources. We realized this pattern by using a local text file (CSV) thatcontained the ISO 3166-2 standard information for all countries. This file was crosschecked withthe suppliers’ records that have missing phone country codes and the corresponding codes for thesuppliers’ countries were filled in to the telephone numbers. The related logical steps of the ETLprocess can be seen in the Reference CSV file part of the ETL flow in Fig. 5b. Similarly, to improvereliability and robustness, corresponding patterns of logical steps of the ETL flow, can be seen inthe Duplicate calculation steps and the Checkpoint parts of the ETL flow in Fig. 5b, respectively.It should be noticed that the logical steps of the patterns have been generically defined within ourtool, resulting in highly configurable patterns that can be integrated to any ETL process with theappropriate configurations (e.g., URLs of available services, attributes to be joined).
7.3. Deployment and Execution
Once users observe satisfactory estimations for their measures of interest, they will decide that thequality of the process is acceptable and thus it is ready for deployment and execution (steps 14–17in Fig. 8). The Deployment Generator component processes the logical model and translates it toa platform-specific model (step 16). This step can be realized using existing approaches for (semi-)automated transition among different abstraction levels, focusing on cost and performance [51, 3].The ETL Process Engine executes the ETL process and as mentioned above, keeps traces to providerelated historical analytics to the Planner and the Process Simulator (step 17).
8. SUMMARY AND OUTLOOK
The automation of ETL processes is a promising direction in order to effectively face emergingchallenges in Business Intelligence mainly caused by data volume, velocity and variety. Althoughinformation systems are developed by professionals with technical expertise, it is important to alignthe design of underlying processes with an end-user perspective that reflects business requirements.In this paper, we have proposed a model for ETL process quality characteristics that constructivelyuses concepts from the fields of Data Warehousing, ETL, Data Integration, Software Engineeringand Goal Modeling. One important aspect about our model is that for each and every characteristic,there has been suggested measurable indicators that derive solely from existing literature. Our modelincludes the relationships between different characteristics and can indicate how the improvementof one characteristic by the application of design modifications can affect others. We have shownhow our defined models can be used to automate the task of selecting among alternative designs andimproving ETL processes according to defined user goals. Future work will include the definitionof methodologies that use our models as staring points to generate various goal models fromdifferent frameworks, for which refinements, satisfiability propagation and elicitation of goals willbe straightforward.
ACKNOWLEDGEMENT
This research has been funded by the European Commission through the Erasmus Mundus Joint Doctorate“Information Technologies for Business Intelligence - Doctoral College” (IT4BI-DC).
REFERENCES
1. Simitsis, A., Vassiliadis, P., Sellis, T. Optimizing ETL processes in data warehouses. In: ICDE. pp. 564–575 (2005)2. Böhm, M., Wloka, U., Habich, D., Lehner, W. GCIP: Exploiting the generation and optimization of integration
processes. pp. 1128–1131. EDBT, ACM (2009)3. Wilkinson, K., Simitsis, A., Castellanos, M., Dayal, U. Leveraging business process models for ETL design. pp.
15–30. ER, Springer-Verlag (2010)
23

24 VASILEIOS THEODOROU
4. Akkaoui, Z., Mazón, J.N., Vaisman, A., Zimányi, E. BPMN-based conceptual modeling of ETL processes. In:DaWaK. pp. 1–14. Springer (2012)
5. Sánchez-González, L., García, F., Ruiz, F., Mendling, J. Quality indicators for business process models from agateway complexity perspective. Inf. Softw. Technol. 54(11), 1159–1174 (2012)
6. Simitsis, A., Wilkinson, K., Castellanos, M., Dayal, U. QoX-driven ETL design: Reducing the cost of ETL consultingengagements. pp. 953–960. SIGMOD, ACM, New York, NY, USA (2009)
7. Golfarelli, Matteo, Rizzi, Stefano, Turricchia, Elisa. Sprint Planning Optimization in Agile Data Warehouse Design.In: DaWaK, pp. 30–41, 2012.
8. Berthold, Henrike, Rösch, Philipp, Zöller, Stefan, Wortmann, Felix, Carenini, Alessio, Campbell, Stuart, Bisson,Pascal, Strohmaier, Frank. An Architecture for Ad-hoc and Collaborative Business Intelligence. In: EDBT, pp. 1–6,2010.
9. van Lamsweerde, A. Goal-oriented requirements engineering: a guided tour. In: Requirements Engineering. pp.249–262 (2001)
10. Jarke, Matthias, Jeusfeld, Manfred A., Quix, Christoph, Vassiliadis, Panos. Architecture and quality in datawarehouses: An extended repository approach. In: Information Systems 24(3), pp. 229–253 (1999)
11. Pavlov, I. A QoX model for ETL subsystems: Theoretical and industry perspectives. pp. 15–21. CompSysTech,ACM (2013)
12. Naumann, F. Quality-driven Query Answering for Integrated Information Systems. Springer-Verlag (2002)13. Dustdar, S., Pichler, R., Savenkov, V., Truong, H.L. Quality-aware service-oriented data integration: Requirements,
state of the art and open challenges. SIGMOD 41(1), 11–19 (2012)14. Jarke, M., Lenzerini, M., Vassiliou, Y., Vassiliadis, P. Fundamentals of Data Warehouses. Springer (2003)15. García, F., Piattini, M., Ruiz, F., Canfora, G., Visaggio, C.A. FMESP: Framework for the modeling and evaluation
of software processes. pp. 5–13. QUTE-SWAP, ACM (2004)16. Kitchenham, B., Pearl Brereton, O., Budgen, D., Turner, M., Bailey, J., Linkman, S. Systematic literature reviews in
software engineering - a systematic literature review. Inf. Softw. Technol. 51(1), 7–15 (2009)17. Pearl Brereton, Barbara A. Kitchenham, David Budgen, Mark Turner, Mohamed Khalil. Lessons from applying
the systematic literature review process within the software engineering domain. Journal of Systems and Software80(4), 571 – 583 (2007)
18. The subsystems of ETL revisited. http://www.informationweek.com/software/information-management/kimball-university-the-subsystems-of-etl-revisited/d/d-id/1060550 (cited January 2014)
19. Barbacci, M., Klein, M., Longstaff, T., Weinstock, C. Quality Attributes. Tech. rep., Carnegie Mellon University,Pittsburgh, Pennsylvania (1995)
20. Al-Qutaish, R. An investigation of the weaknesses of the ISO 9126 Intl. Standard. In: ICCEE. pp. 275–279 (2009)21. Kazman, R., Asundi, J., Klein, M. Quantifying the costs and benefits of architectural decisions. In: ICSE. pp.
297–306 (2001)22. Batini, C., Cappiello, C., Francalanci, C., Maurino, A. Methodologies for data quality assessment and improvement.
ACM Comput. Surv. 41(3), 1–52 (2009)23. Simitsis, A., Vassiliadis, P., Dayal, U., Karagiannis, A., Tziovara, V. Performance evaluation and benchmarking.
Lecture Notes in Computer Science vol. 5895, chap. Benchmarking ETL Workflows, pp. 199–220. Springer-Verlag(2009)
24. Majchrzak, T.A., Jansen, T., Kuchen, H. Efficiency evaluation of open source ETL tools. pp. 287–294. SAC, ACM,New York, NY, USA (2011)
25. Chew, E., Swanson, M., Stine, K.M., Bartol, N., Brown, A., Robinson, W. Performance Measurement Guide forInformation Security. Tech. rep. (2008)
26. KPILibrary. http://kpilibrary.com (cited January 2014)27. Leite, J., Cappelli, C. Software transparency. Business and Information Systems Engineering 2(3), 127–139 (2010)28. Jogalekar, P., Woodside, M. Evaluating the scalability of distributed systems. Parallel and Distributed Systems,
IEEE Trans. on 11(6), 589–603 (2000)29. Frakes, W., Terry, C. Software reuse: Metrics and models. ACM Comput. Surv. 28(2), 415–435 (1996)30. Muñoz, L., Mazón, J.N., Trujillo, J. Measures for ETL processes models in data warehouses. pp. 33–36.
MoSE+DQS, ACM (2009)31. Gill, G., Kemerer, C. Cyclomatic complexity density and software maintenance productivity. Soft. Eng., IEEE
Trans. on 17(12), 1284–1288 (1991)32. A. van Lamsweerde. Goal-oriented requirements engineering: a guided tour. In: Requirements Engineering, 2001.
Proceedings. Fifth IEEE International Symposium on, pages 249–262, 2001.33. A. van Lamsweerde. From system goals to software architecture. In: Formal Methods for Software Architectures.
Volume 2804 of Lecture Notes in Computer Science, pages 25–43. Springer-Verlag, 2003.34. Chung, Lawrence, Nixon, Brian, Yu, Eric, Mylopoulos, John. Non-Functional Requirements in Software
Engineering. In: International Series in Software Engineering, Volume 5 2000.35. Eric S. K. Yu. Modelling Strategic Relationships for Process Reengineering. Ph.D. Dissertation, University of
Toronto, Toronto, Ont., Canada, 1996.36. Jennifer Horkoff and Eric S. K. Yu. Comparison and evaluation of goal-oriented satisfaction analysis techniques.
In: Requir. Eng., 18 (3): 199–222, 2013.37. Bresciani, P., Perini, A., Giorgini, P., Giunchiglia, F., Mylopoulos, J. Tropos: An agent-oriented software development
methodology. Autonomous Agents and Multi-Agent Systems 8(3), 203–236 (2004)38. Giorgini, P., Rizzi, S., Garzetti, M. GRAnD: A goal-oriented approach to requirement analysis in data warehouses.
Decision Support Systems 45(1), 4 – 21 (2008)39. Yu, Eric, Dobbie, Gillian, Jarke, Matthias, Purao, Sandeep CSRML4BI: A Goal-Oriented Requirements Approach for
Collaborative Business Intelligence. In: Conceptual Modeling, Lecture Notes in Computer Science 8824: 423–430,2014.
Concurrency Computat.: Pract. Exper. (2016)

QUALITY MEASURES FOR ETL PROCESSES: FROM GOALS TO IMPLEMENTATION 25
40. Horkoff, Jennifer, Barone, Daniele, Jiang, Lei et al. Strategic business modeling: representation and reasoning. In:Software & Systems Modeling 13(3), 1015-1041 (2012)
41. OWL 2 Web Ontology Language Manchester Syntax. http://www.w3.org/TR/owl2-manchester-syntax/ (citedAugust 2015)
42. Horkoff, J., Borgida, A., Mylopoulos, J., Barone, D., Jiang, L., Yu, E., Amyot, D. Making data meaningful: Thebusiness intelligence model and its formal semantics in description logics. In: OTM, pp. 700–717. Springer (2012)
43. Theodorou, Vasileios, Abelló, Alberto, Thiele, Maik, Lehner, Wolfgang. A Framework for User-CenteredDeclarative ETL. In: DOLAP, pp. 67–70, 2014.
44. Romero, Oscar, Simitsis, Alkis, Abelló, Alberto GEM: Requirement-Driven Generation of ETL andMultidimensional Conceptual Designs. In: Data Warehousing and Knowledge Discovery, pp. 80-95. Springer(2011).
45. Bellatreche, Ladjel, Khouri, Selma, Berkani, Nabila Semantic Data Warehouse Design: From ETL to Deployment ála Carte. In: Database Systems for Advanced Applications, pp. 64-83. Springer (2013).
46. Akkaoui, Zineb, Zimányi, Esteban, Mazón, José-Norberto, Trujillo, Juan. A BPMN-Based Design and MaintenanceFramework for ETL Processes. In: IJDWM, 9 (3): 46–72, 2013.
47. Nakuçi, Emona, Theodorou, Vasileios, Jovanovic, Petar, Abelló, Alberto. Bijoux: Data Generator for EvaluatingETL Process Quality. In: DOLAP, pp. 23–32, 2014.
48. Thiele, Maik, Bader, Andreas, Lehner, Wolfgang. Multi-objective scheduling for real-time data warehouses. In:Computer Science - Research and Development, 24 (3): 137–151, 2009.
49. Jovanovic, Petar, Romero, Oscar, Simitsis, Alkis, Abelló, Alberto. Integrating ETL Processes from InformationRequirements. In: DaWaK, pp. 65–80, 2012.
50. Theodorou, Vasileios, Abelló, Alberto, Thiele, Maik, Lehner, Wolfgang. POIESIS: a Tool for Quality-aware ETLProcess Redesign. In: EDBT, pp. 545–548, 2015.
51. Böhm, Matthias, Wloka, Uwe, Habich, Dirk, Lehner, Wolfgang. GCIP: Exploiting the Generation and Optimizationof Integration Processes. In: EDBT, pp. 1128–1131, 2009.
25