Embed Size (px)
Citation preview

Prospects for Philippine Investments and Financial Services
Lorenzo V TanLorenzo V. TanPresident & CEO
Rizal Commercial Banking Corporation

Why Invest in the Philippines
The Philippines’ macroeconomic fundamentals improved considerably during the
International Monetary Fund The Philippines macroeconomic fundamentals improved considerably during the past decade, closing the door on an era of recurrent balance of payment crises.
Public debt was nearly halvedInflation has eased to low single digitsGrowth has picked up and become more stableExternal Vulnerabilities were reducedCurrent Account consistently in surplusBuild-up stock of FX reservesOn the verge of achieving a net external asset position.
Short-term market interest rates have fallen to exceptionally low levels.Short term market interest rates have fallen to exceptionally low levels.
Main policy challenge - Safeguarding macroeconomic stability while building the foundations for stronger and more inclusive growth.
2
- April 2013 IMF Report

Comparison of ASEAN CDS & Credit Ratings
5-Year CDS (In Basis Points) Moody's Credit Rating
Moody's Credit Rating Outlook
Philippines 93 Baa3 Positive Indonesia 190 Baa3 StableThailand 110 Baa1 StableMalaysia 109 A3 Stable
As of Oct. 29, 2013Source: Bloomberg
3

Why Invest in the Philippines
Investment Grade Rating – Fitch; Standard and Poors; Moody’s; Rating and Investment, Inc. (Japan-based rating agency)
Demographic Dividend/Sweet Spot
Bright Economic Conditions
High GDP growth; Generally low interest rates; Fairly stable Peso; High FX reserves; Low deficit to GDP ratio; M bl i fl tiManageable inflation.
Fast Growth Economies (Next 16) Forecast – Goldman Sachs; HSBC; CitibankHSBC; Citibank
Preparing for ASEAN (2015) and ASEAN Banking Integration Framework (2020)
4
Framework (2020)

Next 16
5

Expanding Middle Class
6

Demographic Sweet Spot/ Dividend
Emerging middle class amid large
l tiDemographic sweet spot/ dividend (2015)Demographic sweet spot/ dividend (2015)
12th most populous ti i th ld
Majority of the l ti ill b f
population spot/ dividend (2015)spot/ dividend (2015)
nation in the worldMore than 95 million
f 2012
population will be of working age
Increasedas of 201238th in the world in terms of GDP (as of
Increased incomes, consumption, savingsCountries entering thisterms of GDP (as of
2012)Countries entering this phase have experienced relatively high growth for over two (2) decadesover two (2) decades
7

Benign Inflation/CPI (Near 4-Year Lows)
8

5- & 10-Year PDST-F Yields Again Near Record Lows Recently
9

E i C diti f bl f th d l t f th
Why Invest in the Philippines
S
Economic Conditions favorable for the development of the Capital Markets
PSEi
70008000
400050006000
200030004000
01000
3/94
3/94
3/95
3/95
3/96
3/96
3/97
3/97
3/98
3/98
3/99
3/99
3/00
3/00
3/01
3/01
3/02
3/02
3/03
3/03
3/04
3/04
3/05
3/05
3/06
3/06
3/07
3/07
3/08
3/08
3/09
3/09
3/10
3/10
3/11
3/11
3/12
3/12
3/13
3/13
1/3
7/3
1/3
7/3
1/3
7/3
1/3
7/3
1/3
7/3
1/3
7/3
1/3
7/3
1/3
7/3
1/3
7/3
1/3
7/3
1/3
7/3
1/3
7/3
1/3
7/3
1/3
7/3
1/3
7/3
1/3
7/3
1/3
7/3
1/3
7/3
1/3
7/3
1/3
7/3
10

Why Invest in the Philippines
SG CAGR: 12.99%
Philippine Banking System still has opportunity to grow
618 669
756
624 580
680
780
MY CAGR: 11.10%
411
473 510
369 386 416
506
562
391
411 483
409
442
380
480
580
on US $ Singapore
MalaysiaID CAGR: 15 57%
TH CAGR: 12.58%
369
267 289 311
214 211
273
340 409
158 167 196 180
280
Billio Thailand
Indonesia
Philippines
ID CAGR: 15.57%
PH CAGR: 9.53%
124 119 134 158
(20)
80
2007 2008 2009 2010 2011 2012
11

Why Invest in the Philippines
In the Philippines, Insurance Companies, Pension Funds, Mutual Funds and other investment management Companies will also grow
12
Life insurance premium volume to GDP (%)
6
8
10
2
4
6
0China Hong Kong Laos Malaysia Philippines Singapore South
KoreaThailand Vietnam
2001 2.06 10.49 0.01 2.93 0.84 5.22 7.16 3.07 0.592006 1.68 11 0.01 3.09 1.11 5.8 7.7 2.32 0.832011 1 73 5 13 0 01 2 92 0 88 7 11 6 81 2 12 0 87
12
2011 1.73 5.13 0.01 2.92 0.88 7.11 6.81 2.12 0.87

Why Invest in the Philippines
80
Insurance company assets to GDP (%)
60
70
30
40
50
10
20
30
0Brunei China Hong
KongIndonesia Japan Malaysia Philippine
sSingapore South
KoreaThailand Vietnam
2004 5.97 8.27 26.34 2.71 76.17 18.18 6.16 48.97 36 10.65 3.982009 6 4 12 03 44 93 3 12 77 28 20 91 6 78 48 150732 45 59 14 249968 4 655806
13
2009 6.4 12.03 44.93 3.12 77.28 20.91 6.78 48.150732 45.59 14.249968 4.655806

Market Cap of Listed Cos. ‐ex US, CN, JP (in US$): 2012
400.00 450.00 500.00
200 00250.00 300.00 350.00
50.00 100.00 150.00 200.00
‐
IDN MYS PHL SGP THA VNM
14

350 322
Size of Local Currency Bond Market ex‐JP, CN (US$ Bil): Mar. 2013
250
300
350
190
232239
295
100
150
200
98
190
85
148132
9163
11998
0
50
100
2920 13
63
130
ID MY PH SG TH VN
Govt (in USD Billions) Corp (in USD Billions) Total (in USD Billions)
15Source: Asian Development Bank

111 6
Mutual fund AUM: 2012 (in US$ Bil)
60
80
100
120111.6
73.2
53.1
0
20
40 18.58.6 0.2
Mutual fund AUM CAGR: 2008‐2012
20.00%
25.00%
30.00%27.70%
26.00% 23.60%
16.70%14.90%
0.00%
5.00%
10.00%
15.00%
2.00%
16

Comparison Mortgage-to-GDP Ratios For Different Countries
67 4%70 0%
80.0%
Home Mortgage Loans Outstanding (% of GDP)
53.0%
42 5%
67.4%64.5% 65.2%
50.0%
60.0%
70.0%
33.8%
19 3%
42.5%37.6%
32.6% 32.9%
30.0%
40.0%
2.4% 2.6%
19.3%14.4%
7.0%0.6%2.0%
0 0%
10.0%
20.0%
0.0%
Indo
nesia
Mal
aysi
a
Phili
ppine
s
Sing
apor
e
Thai
land
Chin
a
Hong
Kon
g
Japa
n
Sout
h K
orea
Indi
a
Paki
stan
Sri L
anka US
Cana
da
Ger
man
y
UK
17
S
Source: Housing Finance Information Network (HOFINET)‐‐Wharton, IFC, World Bank, FMO
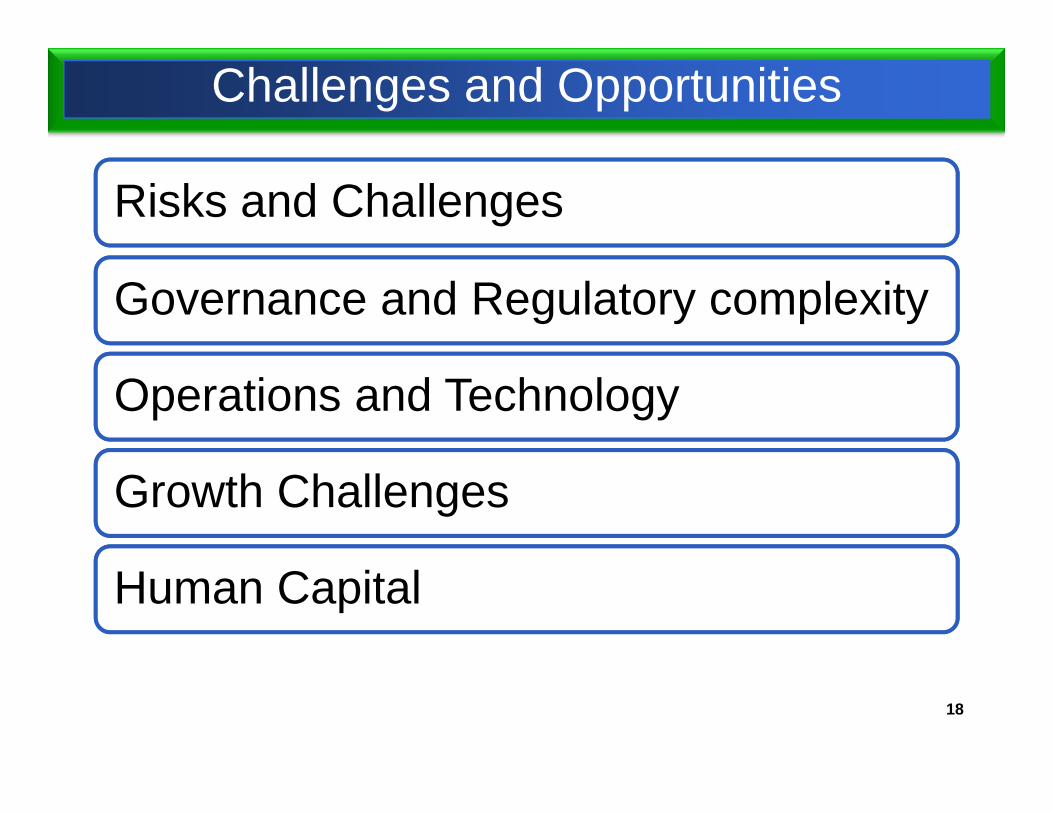
Challenges and Opportunities
Risks and Challenges
Governance and Regulatory complexity
Operations and Technology
Growth Challenges
Human Capital
18

Think Big PictureThink Big PictureThink Big PictureThink Big Picture
“Don’t look at the trees,“Don’t look at the trees,Look at the forest.”Look at the forest.”
-19-

Risks and ChallengesRisks and Challengesin a BORDERLESS INTERCONNECTEDin a BORDERLESS INTERCONNECTEDINTERCONNECTEDGLOBAL ECONOMYINTERCONNECTEDGLOBAL ECONOMYGLOBAL ECONOMYGLOBAL ECONOMY
20

Risks and ChallengesDate Crisis Type of Risk Measures/RegulationsDate Crisis Type of Risk Measures/Regulations
1980s LDC Crisis Sovereign, Default Risk
Fiscal/StructuralReforms, Governance
Oct 19 Black Monday (US Stock Market Risk; Iran Market CircuitOct. 19, 1987
Black Monday (US Stock Market Crash: -23%)
Market Risk; Iran Fired Missiles to Two US Ships in Persian Gulf
Market CircuitBreakers; Stricter Disclosure,Transparency
Late 1970s-Early 1990s
Savings & Loans (S&L) Crisis; High US Int. Rates
Collapse of Some S&Ls
Scrapped interest rate ceilings on deposits
1990-1991 Iraq invasion of Kuwait; Persian Gulf War (Desert
Sharp Increase in Oil Prices, Inflation;
Tighter Monetary Policy; RenewablePersian Gulf War (Desert
Storm)Prices, Inflation; Market Risk
Policy; Renewable Energy
Summer of 1997
Asian Financial Crisis (Started in Thailand; baht depreciated from 25 to 58)
Currency, Market Risk
Floating Currencies; Currency Swaps Among Central Banksdepreciated from 25 to 58) Among Central Banks
Aug. 1998 Russian Default (sharp sell -off in global financial markets)
Credit/Default Risk, Market Risk
IMF/World Bank financial rescue; Fiscal Reforms
Sep. 1998 LTCM Crisis Market Risk Hedges/Diversification21

Risks and Challenges
Date Crisis Type of Risk Measures/Regulations
Sep. 11, 2001
Sep. 11 Terrorist Attacks ( t k k t l d til
Security, O ti l Ri k
Tighter Anti-MoneyL d i L2001 (stock markets closed until
Sep. 17, 2001)Operational Risk Laundering Laws
2002 US Corporate Malfeasance Crisis (Enron, WorldCom,
Governance Risk; Integrity of
Sarbanes-Oxley; Stronger Corporate(
among others)g y
Financialsg p
Governance Standards2007 US Subprime Crisis (sell-off
in global financial markets)Credit, Liquidity,Leverage Risk
Tighter Lending Standards
S 2008 L h B k t C dit Li idit B l 3 D dd F kSep. 2008 Lehman Bankruptcy;Washington Mutual Collapse; Merrill Lynch merged with Bank of A i ( t ll ff i
Credit, Liquidity, Leverage, Market Risk
Basel 3; Dodd-Frank; Sovereign Support of Banks; Creation of Bank HoldingC i TARPAmerica (worst sell-off since
Great Depression; forced liquidations)
Companies; TARP; Economic Stimulus
Nov. 2009 Greece/Euro Zone Crisis Default Risk IMF Assistance ; (sell-off in global markets)
;Deposit Guarantees
22
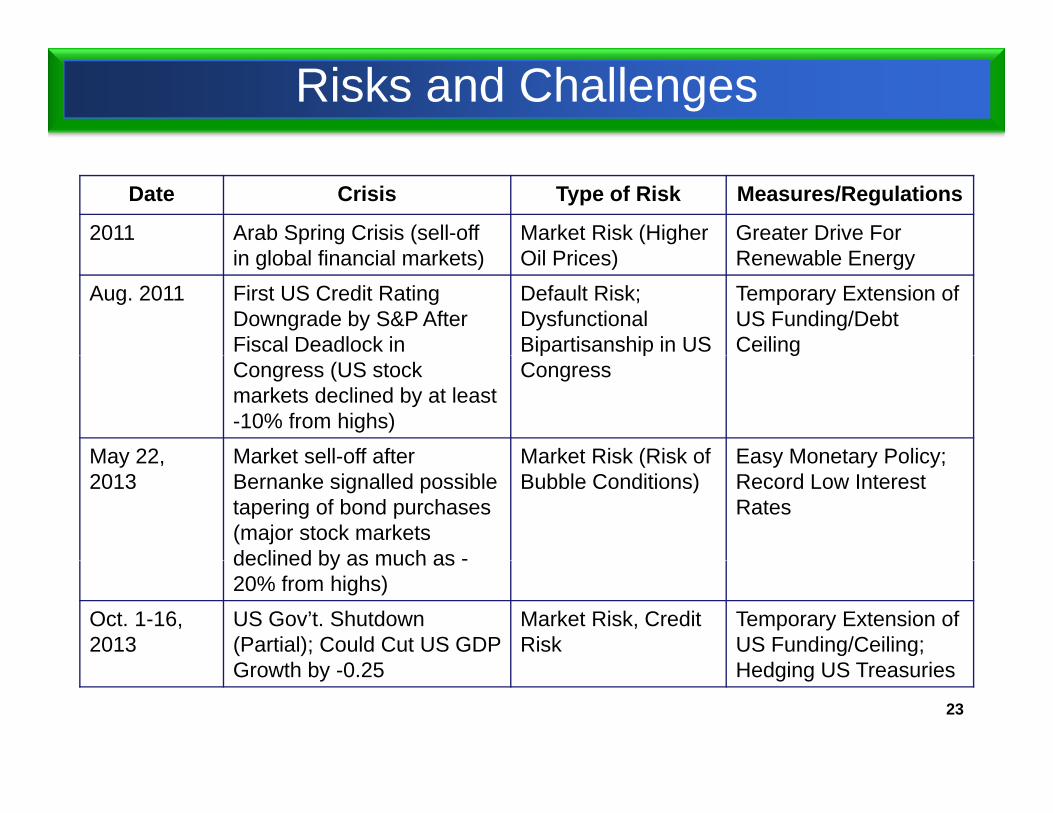
Risks and Challenges
Date Crisis Type of Risk Measures/Regulations
2011 Arab Spring Crisis (sell-off i l b l fi i l k t )
Market Risk (Higher Oil P i )
Greater Drive For R bl Ein global financial markets) Oil Prices) Renewable Energy
Aug. 2011 First US Credit Rating Downgrade by S&P After Fiscal Deadlock in
Default Risk; DysfunctionalBipartisanship in US
Temporary Extension of US Funding/Debt Ceiling
Congress (US stock markets declined by at least -10% from highs)
p pCongress
g
May 22 Market sell-off after Market Risk (Risk of Easy Monetary Policy;May 22, 2013
Market sell-off after Bernanke signalled possible tapering of bond purchases (major stock markets declined by as much as -
Market Risk (Risk of Bubble Conditions)
Easy Monetary Policy;Record Low Interest Rates
declined by as much as -20% from highs)
Oct. 1-16, 2013
US Gov’t. Shutdown(Partial); Could Cut US GDP G th b 0 25
Market Risk, Credit Risk
Temporary Extension of US Funding/Ceiling; H d i US T iGrowth by -0.25 Hedging US Treasuries
23

Asian Financial Crisis
• Excessive investment in property which caused property bubble.
• Over reliance on foreign investments to fund corporate debt, which began toOver reliance on foreign investments to fund corporate debt, which began to taper off after the Federal Reserve raised interest rates. Asian economies attracted investment foreign inflows though high interest rates, which lost some of their attractiveness after the US Fed raised rates.
• Devaluation of the Chinese Yuan led Asian exports to become more expensive, thus reducing their competitiveness
• GDP growth in SEA economies was due to increases in investment rather than increases in total factor productivity.
• Fixed exchange rate led to Asian companies borrowing in foreign currencies• Fixed exchange rate led to Asian companies borrowing in foreign currencies.
24

Liquidity Risk
S t 15 2008 B k t f L h B th l t
Write-downs/Credit losses of major global banks: US$1.5tn
• Sept. 15, 2008: Bankruptcy of Lehman Brothers – largest bankruptcy in US History.
• Sept. 16, 2008: US gov’t. bailout for AIG – largest bailout.S t 21 2008 G ld S h & M St l b b k• Sept. 21, 2008: Goldman Sachs & Morgan Stanley became banks.
• Sept. 25, 2008: Washington Mutual seized by FDIC - biggest bank to ever fail.N 23 2008 US ’t b il t f Citi bi t f• Nov. 23, 2008: US gov’t. bailout for Citigroup - biggest ever for a bank.
• Credit/freeze/Risk aversion
• Troubled Asset Relief Program or TARP (US$700bn), • US economic stimulus (US$787bn), • US gov’t. buyback of long-term Treasuries (US$300bn)• Operation Twist to extend bond maturities (US$ 667 bn)
25
Operation Twist to extend bond maturities (US$ 667 bn)• QE3 (US$85 mn monthly bond purchases)• Fed Funds rate kept at record low 0.0% to 0.25% since Dec 2008

Credit Risk
1. Lehman Brothers Holdings (09/15/08)- $691 billion
The Largest U.S. Bankruptcies
2. Washington Mutual (09/26/08) - $327.9 billion3. WorldCom (07/21/02) - $103.9 billion4. General Motors (06/09) - $91 billion( ) $5. CIT (11/01/09) - $71 billion6. Enron (12/02/01) - $65.5 billion7 Conseco (12/18/02) $52 3 billion7. Conseco (12/18/02) - $52.3 billion8. Pacific Gas & Electric (04/06/01) - $49.75 billion 9. Chrysler (04/30/09) - $39 billion10. Thornburg Mortgage (05/01/09) - $36.5 billion
Global Recession26Almost Systemic Collapse

Operational Risks
M St l t b d t d H i H bl
Bernard Madoff • Fraudulent investment operation- Ponzi scheme• Actual net fraud estimated to be between $50 and $64.8 billion
• Soc Gen claims that Bank trader Jerome Kerviel was engaged in trades of as m ch as EUR4 9bn (bigger than the bank’s market
• Morgan Stanley mortgage bond trader Howie Hubler lost in 2008 about $ 9 billion on subprime bets.
trades of as much as EUR4.9bn (bigger than the bank’s market capitalization), stating that “had taken massive fraudulent directional positions in 2007 and 2008 far beyond his limited authority.
• Kerviel received a 3-year prison sentence for unauthorized trades y pwhich cost the bank EUR4.9bn.
• In 2012, large trading losses occurred at JPMorgan's Chief Investment Office, based on transactions booked through its L d b h A i f d i ti t ti i l i ditLondon branch. A series of derivative transactions involving credit default swaps(CDS) were entered, reportedly as part of the bank's "hedging" strategy.
• Trader Bruno Iksil nicknamed the "London Whale", accumulated outsized CDS positions in the market. An estimated trading loss
27
p gof $5.8 billion was announced, with the actual loss expected to be substantially larger.

Operational Risks
• Collapsed in Mar. 1995 and bought by Dutch company ING for one British pound.• Collapse caused by employee Nick Leeson in the bank’s Singapore office.• Losses amounted to more than US$1bn which caused the failure of Britain’sLosses amounted to more than US$1bn, which caused the failure of Britain s
oldest investment bank
F b i T f G ld S h b d t d f d li bl f f d• Fabrice Tourre, former Goldman Sachs bond trader was found liable for fraud for his role in a failed mortgage deal that cost investors US$1bn in a debacle that foreshadowed the financial crisis.
• Tourre and Goldman allegedly misled investors in an investment called Abacus 2007-AC1, otherwise known as a synthetic collateralized debt obligation.
• The plaintiffs alleged that the former Fannie executives, including CEO Franklin Raines manipulated Fannie Mae’s
, y g
including CEO Franklin Raines, manipulated Fannie Mae s earnings to artificially inflate its stock price
• In 2011 the SEC charged Fannie Mae executives with fraud, indicating that they 'knew and approved of' misleading statements claiming the companies had
28
minimal exposure to subprime loans at the height of home mortgage bubble

Governance and Regulatory Complexity
BASEL IIISarbanes-Oxley Act of 2002
Dodd-Frank Act of 2010
Anti-Money Laundering Act
Strengthening Corporate Governance in BSP Supervised Financial Institutions
Revised code of Corporate Governance
Annual Corporate Governance Report
Corporate Governance Manual ASEAN Corporate Governance Manual
29

Operations and TechnologyTo address:
Greater volume
Need for speed
Cost efficiencyy
Customer convenience/reach
Improved/real time reportingImproved/real time reporting
Data analytics
Decision support tools
Big Data
30Cognitive banking

Growth ChallengesAlternatives:Organic or M&ATo be Global or Regional or Local
• Difficult to find growth in mature marketsDifficult to find growth in mature markets
• Scale becomes more important
• Organic growth through:
Branding/Brand equityImproved distribution and distribution analyticsCustomer segmentation and analytics
32
Customer segmentation and analytics
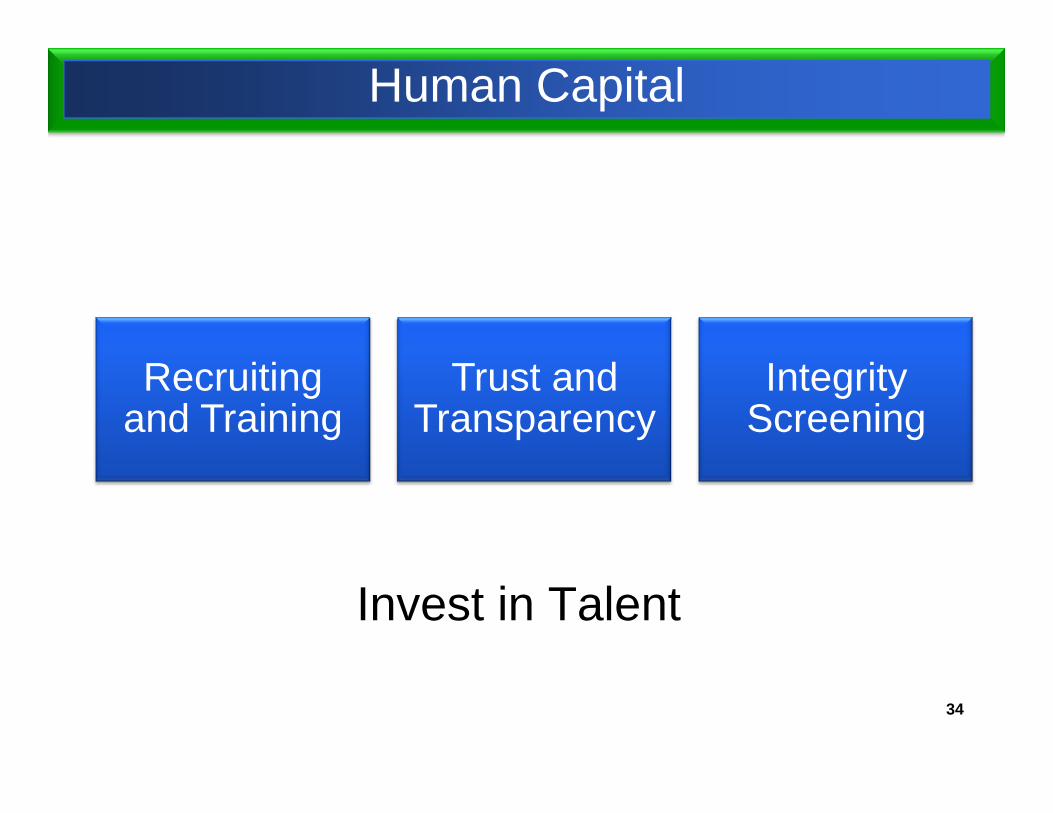
Human Capital
Recruiting and Training
Trust and Transparency
Integrity Screening
Invest in Talent
34

Human Capital
“Somebody once said that in looking for people toin looking for people to hire, you look for three qualities: INTEGRITYqualities: INTEGRITY, INTELLIGENCE, and ENERGY And if they don’tENERGY. And if they don t have the first the other two will kill you ”will kill you.
Warren Buffett35
Warren Buffett

Experience“The best teacher of Governance”“The best teacher of Governance”
1. You don’t become a good lender until you’ve done some bad loansbad loans.
2. You don’t become a good trader until you’ve done some bad tradesbad trades.
3. You don’t become a good operations head until you’ve experienced operational lossesexperienced operational losses.
4. You don’t become a good asset manager until you’ve made some bad investments.made some bad investments.
5. You don’t become a good CEO, until you’ve seen all of the above.
36LORENZO TAN

ENDEND