Embed Size (px)
Citation preview

Private Equity: Optimizing the regulatory landscape and exits April 2017


Private Equity: Optimizing the regulatory landscape and exits
03

Private Equity: Optimizing the regulatory landscape and exits
04

Private Equity: Optimizing the regulatory landscape and exits
05

ForewordThe private equity and venture capital eco-system in India has played a pivotal role in providing a much needed growth and high-risk capital to companies and businesses in India over the last fifteen years. Since early-2000s, private equity and venture capital funds have invested over USD 150 billion in India and also generated market-beating returns. While 2016 turned out to be a year of micro-correction, 2016 saw large pension funds step up their bets on India.
From a tax and regulatory perspective, the overall investment landscape has witnessed a number of positive changes over the last couple of years. Some of the measures include the easing of FDI norms across key sectors, and providing clarity and certainty by renegotiating the double tax avoidance treaties with Mauritius, Cyprus and Singapore. Further relaxations such as permitting FDI into LLP under the automatic route where 100 percent FDI is allowed, and the removal of restrictions on LLPs to avail ECCB, also give a fillip to the investment community.
Looking ahead, India is on the cusp of a renewed growth-trajectory, and the private equity industry is geared to partake in this growth story. With over USD 7 billion worth of dry powder committed to India, and fresh fund-raises by leading private equity funds alone topping USD 2 billion in 2016, there is sufficient capital available to be deployed. Buoyant capital markets, a hot M&A market and a vibrant economic
outlook are helping shape a favorable investment environment in India, as well as opening doors for profitable exits. Further, with over USD 42 billion worth of large ticket (greater than USD 50 million size) private equity investments over two years in vintage still un-exited or partially exited, exit activity is also expected to pick up in the near future.
This paper is an effort towards understanding the impact of the regulatory changes in the Annual Budget 2017 on the private equity industry, the recent private equity exit experiences and their future outlook, and a deliberation on the development of the Fund of funds industry in India from a regulatory perspective.
We thank the key industry participants including regulators, private equity funds and numerous Indian business heads whose periodic views and inputs have helped us shape and crystallise our thoughts.
Andy KhannaPartner and Head Private Equity, Financial Advisory ServicesDeloitte Touche Tohmatsu India LLP
06
Private Equity: Optimizing the regulatory landscape and exits

The India growth appears to be intact, notwithstanding the impact of demonetization announced in November, 2016, India is expecting to regain the position of the fastest growing major economy in 2017. This long term growth trend coupled with the strength of India’s internal consumption market is what continues to attract PE/ VC investment dollars into the country.
The PE/VC industry remained busy with fund raising activity as the industry raised USD 4.2 billion across 39 funds. This momentum continued from 2015, which saw USD 5.7 billion raised across 43 funds. With an estimated dry-powder of over USD 7 billion at their disposal, 2017 could be a record year for PE/VC investments in India.
Historically, exits have been a challenge across the PE/VC industry in India. But the industry witnessed highest value of exits in 2016 in the past five years.
The PE/VC industry has been one of the key pillars to India’s growth, providing the country with significant capital investment. Strong start-up funding by these firms have led to some of the Indian companies earning the status of unicorns and challenging their
Message from ASSOCHAM
07
Private Equity: Optimizing the regulatory landscape and exits
established global counterparts for market share. The announcements in the Union Budget 2017 have further added to investor confidence and are expected to help regain the investment momentum in the near term.
I would like to congratulate the PEVCAI/ ASSOCHAM Team for organizing the Annual PEVCAI Summit 2017 at the beginning of the financial year and we hope that the deliberations will be meaningful for the PE/VC Industry for their future investments programs.
With warm regards, D. S. RawatSecretary General, ASSOCHAM & PEVCAI

Private Equity: Optimizing the regulatory landscape and exits
08
Private Equity: Optimizing the regulatory landscape and exits
08

Private Equity: Optimizing the regulatory landscape and exits
09
Contents1. Fiscal Act 2017: Private Equity and
Regulatory Challenges 12Annual Budget 12Policy updates 12Tax updates 13Budget 2017 – Some of the Misses 15
2. Recent Exit Experiences and Future Opportunities 16Private Equity Investments 16
2016 in review 16Major investors 17Recent trends 17
Private Equity Exits 18Overview 18Exits by sectors 21Exit routes 25Exit through M&As 25Exit through IPOs 27Exit through open market and secondary sale 28Exit through buybacks 29
Outlook 29PE/VC investments 29Outlook for PE exits 30Exit routes for PEs 33In Summary 35
3. Developing Fund of Funds Industry in India 36Setting the context 36Sovereign wealth funds 36Regulatory perspective 38
4. About Deloitte 405. About ASSOCHAM 41

10
Private Equity: Optimizing the regulatory landscape and exits

Private Equity: Optimizing the regulatory landscape and exits
11

Private Equity: Optimizing the regulatory landscape and exits
12
1. Fiscal Act 2017: Private Equity and Regulatory Challenges
Annual BudgetFrom a tax and regulatory perspective, the overall investment landscape has witnessed a number of positive changes, over the last couple of years. The government has meticulously taken initiatives to make it easier to do business in India, in order to attract more foreign investments into the country.
Some of these measures include the easing of FDI norms in a number of sectors including aviation, e-commerce and pharmaceuticals, and providing clarity and certainty by renegotiating the double tax avoidance treaties with Mauritius, Cyprus and Singapore. Considering the investors’ concerns regarding GAAR (General Anti-Avoidance Rules) and Place of Effective Management (POEM), CBDT issued circulars in January 2017 clarifying the implementation of GAAR and provided guiding principles for the determination of POEM. Additionally, to reduce litigation, circulars were also issued to provide clarity on characterization of gains from listed and unlisted securities. Further, the LLP regime has been relaxed by permitting FDI into LLP
under the automatic route in those sectors/ activities where 100% FDI is allowed under automatic route and there are no FDI linked performance conditions. Also, restrictions on LLPs to avail ECB have now been removed.
The Union Budget 2017 was announced in the backdrop of a lot of expectations from across sectors. The Finance Minister did well by not disturbing the growth momentum and there were not too many unwelcome surprises. A few amendments have a direct impact on the private equity sector and the same have been discussed below.
Policy updates01. Affordable Housing to be given
Infrastructure status.02. FIPB to be abolished, and further
liberalization of FDI policy under consideration.
03. Security receipts issued by a Securitization company or a reconstruction company would be permitted to be listed and traded on stock exchanges.
04. Amendment to the Arbitration Act to streamline institutional dispute resolution arrangements in infrastructure.
05. Provision for INR 100 billion for recapitalization of banks.
06. To create a Payments Regulatory Board in the RBI replacing the existing Board for regulating Payment and Settlement Systems.
07. An additional sum of INR 80 billion allocated to complete ten million houses under the Pradhan Mantri Awaas Yojana-Gramin, increasing the total fund allocation to INR 230 billion.
08. Long Term Irrigation Fund—corpus increased to INR 400 billion.
09. Micro Irrigation Fund—initial corpus INR 50 billion.
10. Dairy Processing and Infrastructure Development Fund—corpus of INR 80 billion.

Private Equity: Optimizing the regulatory landscape and exits
13
Tax updatesExemption on long term capital gains
• Exemption on sale of long term listed equity shares is available if the transaction of sale is chargeable to Securities Transaction Tax (‘STT’). With effect from 1 April 2018, shares acquired on or after 1 October 2004, shall be exempt from tax only if STT is chargeable at the time of acquisition of such shares. The above conditions will not apply to the acquisitions notified by the Central Government.
The Central Government has recently issued a draft notification for public comments which provides that all the acquisitions other than the ones specified below would be exempt even if no STT is chargeable on such acquisition—A. Acquisition of listed equity shares of a
company— a. Whose equity shares are not
frequently traded; and b. Acquisition is made through
preferential issue other than those to which Chapter VII of the Securities Exchange Board of India (Issue of Capital and Disclosure Requirements) Regulations 2009 does not apply.
Acquisition of shares of a company whose equity shares are frequently traded on recognised stock exchange will not fall within the purview of the above. However, the definition of “frequently traded shares” is such that it may be difficult for a person acquiring shares to find out whether the shares are frequently traded or not. Hence, there is a need for further clarity.
B. Purchase of listed equity shares in a company is not through a recognised stock exchange.
Here, the term ‘purchase’ is subject to interpretation. This category is wide enough to cover various transactions within its ambit. Transactions which are genuine could also be covered in this category (such as ESOP, off market purchase of listed shares in negotiated deals, etc.) and this would create hardship for assessees in such cases.
Private Equity transactions in listed spaces typically involve a combination of primary investment and secondary acquisition from promoters. Secondary acquisition also includes the acquisition of controlling stake of listed equity shares from promoters in an off-market transaction. Private Equity may acquire listed equity shares off-market for the following reasons:
– Foreign investors are permitted to buy listed shares on the market only if they are registered as Foreign Portfolio Investors. Not all offshore Private Equity entities may have an FPI entity to invest in listed equity shares.
– Foreign Portfolio Investor cannot hold more than 10% equity in a listed company.
– Secondary acquisition price may be different from the prevailing market price, making the acquisition on market difficult.
– Negotiation deals are difficult to go through on the market without there being a leakage.
It is important to note that in case of such off market secondary purchase, the seller would end up paying tax in India since the transaction would
not be subject to STT and would be regarded as purchase of listed equity share not entered through a recognised stock exchange and hence long term capital gains exemption would not be available. Therefore, off-market purchase of listed equity shares by private equity entities such as SEBI registered Alternative Investment Funds and nonresidents/residents acquiring controlling stake from promoters should be specifically excluded from the scope of third proviso to section 10(38).
C. Acquisition of equity shares of a company during the period when the shares are delisted to the period they are again listed on recognised stock exchange.
Here, the notification includes the day when the company is again listed on the recognised stock exchange resulting in a scenario that shares bought on a recognised stock exchange on the day of the listing of shares, on which STT has been paid, would also be subject to tax in the hands of transferor at the time of sale of such shares on the recognised transaction.
From the point of view of private equity, the issues highlighted above need to be addressed in the final notification.
Indirect transfer provisions
• It has been clarified that the provisions of indirect transfer shall not apply to investors of Foreign Institutional Investors (FIIs), for the period from 1 April 2012 to 31 March 2015, and Foreign Portfolio Investors (FPIs) that are registered as Category I or II with the Securities and Exchange Board of India from 1 April 2015 onwards. This is a welcome announcement.

Private Equity: Optimizing the regulatory landscape and exits
14
Rupee denominated bonds
• Transfer of “rupee denominated bond” but issued outside India by an Indian company, from one non-resident to another shall not be regarded as a taxable transfer.
• Foreign exchange gain arising at the time of the redemption of rupee denominated bonds which was allowed to be ignored in case of primary/initial subscribers is now allowed to be ignored in the hands of any subsequent acquirer of such rupee denominated bonds.
• The concessional rate of TDS of 5% on interest payment in respect of external commercial borrowings has been extended for borrowings up to 1 July 2020. The benefit of 5% TDS is further extended to interest payable on rupee denominated bonds (masala bonds) issued outside India before 1 July 2020. This is with retrospective effect from 1 April 2016.
• With the above amendments, as a debt raising instrument from offshore, rupee denominated bonds should gain some traction.
Relaxation to eligible investment fund
• For the purpose of safe harbor provisions for investment funds, the requirement of average monthly corpus of INR 1,000 million for an investment fund shall not apply in the year of winding up.
Several changes are required for the safe harbor provisions to make the same practically feasible, and hence this is still on the unfinished agenda for private equity.
Anti-abuse provisions
• If the consideration for transfer of shares of a company (other than shares listed on recognised stock exchange and traded regularly) is less than the Fair Market Value (‘FMV’) determined in the manner prescribed, the FMV shall be deemed to be the full value of consideration for tax purposes.
• Scope of section 56 of the Act has been widened to cover receipt of sum of money, any property, or any immovable property by a person from any other person (i.e. all categories of tax payers included) without consideration or for inadequate consideration in excess of INR 0.05 million.
Going forward, across asset classes and across tax payers, there will be a greater thrust on executing transactions at fair value.
Others
• Conversion of Compulsorily Convertible Preference Shares (CCPS) into equity shares will be specifically tax exempt with effect from 1 April 2017. Further, the holding period of such equity shares will date back to when the shares were first acquired as CCPS. The cost of acquisition of such equity shares will also be the same as the cost of acquisition of CCPS. Since the amendment is prospective, it in a way, casts some doubt over the tax treatment on earlier conversions of CCPS.
• The concessional rate of a TDS of 5% on interest payable is extended up to interest paid before 1 July 2020 to FII and QFI on their investment in Government securities and rupee denominated corporate bonds, provided the rate of interest does not exceed prescribed limits. This is a positive development.
Shifting of base year for the purpose of computing capital gains
• The base year for indexation purpose while computing capital gains has shifted from 1 April 1981 to 1 April 2001. This may lead to lower capital gains in certain situations, depending on the year of acquisition and fair market value in 2001.
Concessional rate for long term capital gains
• A clarification was issued that the concessional rate of 10% for long term capital gains arising from the transfer
of shares of a company, other than the company in which public are substantially interested, shall be available to non-residents, for transfer made during 1 April 2012 to 31 March 2016. This puts to rest the uncertainty that was there for the interim period.
Interest In line with the recommendations of OECD’s BEPS Action Plan 4, it is proposed to restrict the deduction of excess interest claimed by an entity on debt from its associated enterprise.
The salient features of these provisions are as follows:
Applicable to expenditure by way of interest or of similar nature payable by an Indian company or a permanent establishment of a foreign company in India in respect of any debt:a. issued by a non-resident associated
enterprise; orb. where associated enterprise provides
an implicit or explicit guarantee to the lender; or deposits a corresponding and matching amount of funds with the lender and interest, or a similar consideration that exceeds INR 10 million.
Interest expense disallowance toa. Total interest of less than 30% of
earnings before interest, taxes, depreciation and amortization (EBITDA) in the previous year; or
b. Interest paid or payable to the associated enterprise for that previous year, whichever is less.
Carry forward of interest disallowed
• Up to eight assessment years immediately succeeding the assessment year for which the disallowance was first made; and
• Allowed as deduction against income from business to the extent of interest restriction specified above.

Private Equity: Optimizing the regulatory landscape and exits
15
Exclusions- Business of banking and insurance.
While this is in line with international tax practices, it would have an adverse impact on debt funding by private equity, and IRRs in such transactions would get hit on account of the disallowance. There is a need to provide for an exemption from this provision for the infrastructure and start up sector, where huge debt investment is the norm.
Tax holiday for affordable housing relaxedCurrently, 100% deduction can be claimed in respect of profits and gains derived from developing and building certain housing projects subject to the fulfillment of specified conditions.
It is proposed to relax the specified conditions as under:
• Size of residential unit to be measured using “carpet area” as against “built-up area.”
• Restriction of 30 square meters on the size of residential units not to apply to the places located within 25 km. from the municipal limits of Chennai, Delhi, Kolkata and Mumbai.
• Time limit for project completion to be extended to 5 years from 3 years.
As per the Real Estate (Regulation and Development) Act, 2016, “carpet area” means the net usable floor area of an apartment, excluding the area covered by the external walls, areas under services shafts, exclusive balcony or verandah area and exclusive open terrace area, but includes the area covered by the internal partition walls of the apartment.
Joint Development AgreementIn case of joint development agreements, the year of taxability of capital gains has been a matter of litigation. It has been now proposed that in case of an individual or HUF entering into the JDA, capital gains would be chargeable in the previous year in which the certificate of completion is
issued by the competent authority. The full value of consideration in this case will be the stamp duty value of their share in the project on the date of issuance of the said certificate as increased by any monetary consideration received.
Such benefit would not be available in case such an assessee transfers their share in the project on or before the date of issue of the said certificate. In this case, capital gains will be taxed in the year of transfer as per the general provisions. Further, an amendment has been proposed to withhold tax at the rate of 10% from the monetary consideration payable to a resident. The cost of acquisition of the share in the project in the hands of the landowner shall be the amount which is deemed as full value of consideration, i.e. stamp duty value. Only individual and HUF are covered.
Budget 2017 – Some of the MissesThe following key expectations of the PE/VC industry remain unaddressed:
• Deferral of POEM to provide adequate time to analyse the impact of the final POEM guidelines.
• Increasing the threshold limit for triggering indirect transfer provisions from the existing level of 5 per cent in order to carve out overseas transfer not resulting in change in control or management of underlying Indian entity.
• Relaxations were also expected in the conditions relating to investor diversification and threshold of participation interest of a single investor in the fund to make Safe Harbour Norms practically implementable.
• Tax pass-through status for Category III AIFs.
• Relief to AIFs from withholding tax obligation on the distribution of exempt income to resident investors or on distribution to resident investors who are exempt from tax.
• Relief to foreign investors of Cat I and II AIFs from the filing of return of income.

Private Equity: Optimizing the regulatory landscape and exits
16
2. Recent Exit Experiences and Future Opportunities
Private Equity Investments2016 in review
The Private Equity (PE) and Venture Capital (VC) investment activity in India witnessed a strong bull-run in the three-year period from 2013 to 2015. The number of investments nearly doubled from 1,186 in 2013 to 2,052 in 2015, growing at a CAGR of 33 percent1. The years 2012 and 2013 saw private equity and venture capital
investments stay flat in the USD 11 billion to 12 billion range. The break-out started in 2014, with a growth of 21 percent in investment value over 2013. And by 2015, PE and VC investments had crossed USD 25 billion in value, reaching USD 25.8 billion. This period was punctuated by a host of factors including the election of a new reform-focused government in India and also improvement in the overall global economic environment.
2012
1108 11861451
2052
1571
0
5
10
15
20
25
30
2013
Dea
l Val
ue (U
SD b
illio
n)
PE / VC deals in India (2012 - 2016)
Dea
l Val
ue
2014 20150
2016
500
1000
1500
2000
2500
Value (USD billion) Deal Volume
15.2 17.514.5 25.8 19.8
1VCC Edge database
However, 2016 turned out to be a year of correction, with private equity and venture capital deal volume and value declining by 33 percent, each. One of the main contributors to the decline was the slowdown in the angel/seed and other venture capital investment activity as the sense of valuations being ahead of reality caught up with the investment community. There were also multiple instances of ventures, particularly in the consumer technology space, shutting down or merging with competitors. Venture capital (angel, seed and VC) investments dropped by a whopping 54 percent in value terms in 2016 as the overall PE and VC investment activity volume dropped nearly to 2014 levels.
Further, headwinds in the global economic environment fueled by events such as the Brexit and suspense related to the US presidential elections caused some uncertainty in the market. Investors, particularly FIIs (Foreign Institutional Investors) parked funds in safer havens to avoid capital erosion in these uncertain times.

Private Equity: Optimizing the regulatory landscape and exits
17
On the brighter side, the year 2016 saw big participation from large global pension fund managers and sovereign wealth funds into the India market. Top Canadian pension funds, in particular, stepped up investments in India that have now topped USD 5 billion in the last two years.2 Others such as Singapore’s GIC, Abu Dhabi Investment Authority (ADIA) and Malaysia’s Khazanah Nasional Berhad were also active deal-makers in 2016.3
This year also saw private equity funds stepping up the size and scope of their bets in India. Specifically, in the Private Equity space (excluding angel/seed/VC investments), the share of control deals has gone up from around 7 percent in 2015 to 12 percent in 2016. The year 2016 saw 28 control deals out of 228 pure private equity investments (excluding angel/seed/venture capital and debt investments). This trend shows promising signs of maturity in the market and indicates the evolving nature of the private equity landscape in India.
Major investorsIn the angel/seed segment, Indian Angel Network topped the list with 23 deals. It was followed by Blume Ventures and Singapore Angel Network Pte Limited with 11 and 10 deals, respectively. The venture capital segment saw Sequoia Capital maintain its leadership position with 31 deals in 2016. Other notable VC investors included Accel India (26 deals), Omidyar Network India (16 deals), IDG Ventures (15 deals) and Blume Ventures (13 deals).4
In the broader private equity segment, World Bank Group’s International Finance Corporation (IFC) topped the list with six deals, followed by IDFC Alternatives with five deals. TPG Capital and PremjiInvest were also active during the year, closing four deals each. Prem Watsa’s Fairfax India Holdings also ramped up its investment activity in 2016, closing four investments.5
Recent trendsA look at the trends in deal activity in further detail, particularly in the last two quarters of 2016, is an indicator of promising signs of green shoots of recovery after four successive quarters of drop (from the third quarter of 2015 to the third quarter of 2016). The second
half of the year witnessed an acceleration in the investment activity, showing signs of revival as the year ended on a positive note. The period from July to December 2016 accounted for nearly 60 percent of investments in the year in value terms, driven mainly by some large deals towards the end of the year. The fourth quarter (October to December 2016) was also the only quarter in the year that posed a year-on-year growth in deal activity over the same period in the last year (October to December 2015).
Another notable trend has been the fact that average deal ticket sizes are getting slightly bigger, partly due to a more sluggish early seed and venture stage deal market.
Only PE; Deals tagged 'Control' in VCCEdge database
Share of control deals in PE (excluding VC) deals
2015
2228
294 200
7% 12%
2016
Angel/Seed(# of deals 2016)
Venture capital (# of deals 2016)
Private equity(# of deals 2016)
Indian Angel Network 23 Sequoia Capital 31 IFC 6
Blume Venture 11 Accel India 26 IDFC Alternatives 5
Singapore Angel Network 10 Omidyar Network 16 TPG Capital 4
Global Super Angels Forum 9 IDG Ventures 15 PremjiInvest 4
The Chennai Angels 9 Blume Venture 13 Fairfax India Holdings 4
2‘Canadian fund step up investment in India’ Livemint, October 20163‘Sovereign wealth funds’ India holdings at a record high’ Livemint, July 2016; ‘Abu Dhabi Sovereign Fund ADIA eyes $200 million investment in Greenko’ Economic Times, May 2016; ‘Singapore snaps up 17 merger and acquisition deals in India’ Indian Express, July 2016 4Annual Deal Report – 2017, VCCEdge 5Annual Deal Report – 2017, VCCEdge

Private Equity: Optimizing the regulatory landscape and exits
18
Private Equity ExitsOverview
Private Equity and Venture Capital firms managed to clock exits worth USD 6.8 billion across 239 exits in 2016. While there was a 19.5 percent decline in number of deals as compared to last year, the deal value saw an increase of 17.2 percent.6 The all-time high in recent history was USD 6.8 billion that was achieved last year in 2016.
Interestingly, while the number of private equity and venture capital exits has been on a gradual decline dropping from 309 exits in 2014 to 297 in 2015, and then 239 in 2016, the deal exit value has moved in the opposite direction. This is an indicator of the fact that exits are getting bigger in the industry.
Q1 Q4 Q3 Q4 Q1Q2 Q1 Q2 Q3Q4 Q1 Q2Q32012 2013 2014 2015 2016
Q2 Q3 Q4Q1 Q2 Q3 Q40123456789
Dea
l Val
ue (U
SD b
illio
n)
Dea
l Val
ue (n
umbe
r of
dea
ls)
Deal Value (USD billion) Deal Volume
0
100
200
300
400
500
600
367
6.2 3.33.6 5.4 5.13.1 3.73.8 7.1 5.62.5 5.24.1 7.7 3.53.4 5.32.9 5.6 5.6
241222
278328
248 279331 349 332
381 389
512 465537 538
473
368 392 338
PE Quarterly Trend Chart (2012 - 2016)
For private equity and venture capital exits, there are two strategic exit decisions taken into consideration—the timing and the exit channel. The key external factors that determine the timing and channel for an exit include the prevailing economic conditions, the phase of the economic cycle and the perception of valuations in the markets. As such, some of the indicators that have a bearing on the choice of exit, the timing and the return multiple are the ease of doing M&A deals, the general level of valuations as indicated by the capital markets and the vibrancy of the IPO markets.
The year in review saw 27 IPOs hitting the Indian capital markets with the total amount raised reaching a six-year high of INR 223 billion (highest between 2011 and 2016).7 2016 also marked the largest IPO issuance in six years. Private insurance, ICICI Prudential Life Insurance’s USD 910 million (or INR 6.1 billion) IPO was the biggest in India’s capital markets since the IPO of Coal India in November 2010.8 These were healthy signs for India’s IPO market that had seen very low activity in the period from 2011 to 2014. In fact, at 66, the number of IPOs in 2010 was almost equal to the cumulative number of IPOs in the four-year period from 2011 to 2014 (at 65 IPOs).
PE / VC Exits in India (2014 - 2016)
0
1
2
3
4
5
6
7
8309
2014
Dea
l Val
ue (U
SD b
illio
n)
Dea
l Val
ue
297
2015
239
20160
50
100
150
200
250
300
350
Deal Value (USD billion) Deal Volume
5.2 5.8 6.8
6VCCEdge database7‘Year Wise List of IPO's - Report of Public Issues in India Stock Market’ www.Chittorgarh.com accessed in April 20178‘Investors pile on biggest India IPO in six years as ICICI Pru issue oversubscribed 9.5 times’, September 2016

Private Equity: Optimizing the regulatory landscape and exits
19
Indian capital markets continue to be perceived to be more expensive compared to peers such as China (Hong Kong) or other emerging market indices (such as the Morgan Stanley Composite Index for Emerging Markets).9 While the capital market indices have grown at a CAGR of 8 percent from January 2014 to January 2017, corporate earnings have not been able to catch up with the expectations.10 Though this is a deterrent for funds to invest, it also promises higher exit returns to existing investors.
Since 2005, India’s capital markets have consistently operated at a premium over the broader emerging market indices (Morgan Stanley Composite Index—Emerging Markets). While the Price-to-earnings (P/E) ratios dropped in the aftermath of the global financial crisis in 2008, there was a quick recovery. But, the recovery after the 2011 dip has been slow, and over the years, Indian markets have continued to widen the premium-gap compared with other emerging markets.To some extent, investors have built these
valuation levels into their investment hypothesis but expect better profitability and earnings growth from their investee companies.
In early 2017, while the BSE Sensex was trading at a price-to-earnings ratio of 21.1 times, the broader MSCI Emerging markets index was trading at 16.1 times and the Hang Seng in Hong Kong was trading at 12.8 times.11 Since 2009, Indian markets have maintained a premium of 3-4x over the benchmark index for emerging markets.
9Bloomberg, 201710Google Finance, accessed in April 201711Bloomberg, 2017
20050.0
5.0
10.0
15.0
20.0
25.0
30.0
2006 2009 2012 20152007 2010 2013
21.0
16.1
12.8
20162008 2011 2014 2017
Price-to-earnings ratio trend (SENSEX vs. key indices)
MSCI Emergin Markets Hang Seng (HK) SENSEX (India)
0 0
50 20100
40150
60200
80250
100300
350
400 120339108
39
22
66
40
13 5 7
21 27
183 193
364
60 68
13 12
114
223
Amount raised (USD billion) # of IPOs
India IPO market (# of IPOs and amount raised)

Private Equity: Optimizing the regulatory landscape and exits
Fluctuations and long-term directional movements in exchange rates, i.e., weakening of the rupee against the dollar, blunt the dollar-denominated or dollar-based returns. Over the last seven years, the value of 1 USD has gone up from INR 46 in 2010 to INR 64 as of April 2017.12 The continuous weakening of the rupee has an impact on the dollar-based returns for any potential exits for a private equity fund.
For example, if a fund had invested in a company in January 2012 and exited the investment at a local currency rate of return of 25 percent in January 2017, the equivalent USD based rate of return would have been much lower at 17 percent—a drop of eight percentage points. This is a challenge particularly for investments done prior to January 2014.
Jan
10
May
10
Sep
10
Jan
11
May
11
Sep
11
Jan
12
May
12
Sep
12
Jan
13
May
13
Sep
13
Jan
14
May
14
Sep
14
Jan
15
May
15
Sep
15
Jan
16
May
16
Sep
16
Jan
17
75
70
65
60
55
50
45
40
46 46
5354
6262
6664
INR-USD exchange rate (1 USD = INR)
1 USD = INR Linear (1 USD = INR)
Between January 2011 and January 2014, the rupee depreciated by 37 percent, while between January 2014 and January 2017, it depreciated by 8 percent. Hence, for investments done post-January 2014, the extent of impact of the rupee weakening is lower. More specifically, the rupee has been range-bound over the last eighteen months. This lends some level of comfort to private equity and venture capital funds that have invested in the last two years, and are preparing for potential exits.
12www.Investing.com accessed in April 2017
20

Private Equity: Optimizing the regulatory landscape and exits
21
Exits by sectorsIn terms of sector favorites, the financial services sector topped the exits with 56 exits amounting to USD 1.7 billion in 2016, followed by Information technology (IT) which stood at 55 exit deals at USD 1.3 billion. Consumer discretionary, industrials and healthcare were the other three key sectors that contributed to the exit activity with 39, 35 and 25 exit deals, respectively. Interestingly, consumer discretionary which had only 39 exit deals as compared to IT—which had 55 exit deals—clocked exits worth USD 1.4 billion. Early stage investors continued to put seed and growth capital into companies in the consumer technology space.13
Financials, IT, Consumer Discretionary, Industrials and Healthcare accounted for 88 percent of the exits in the year 2016. However, two of these five sectors—industrials and financials—saw a sharp fall in exit activity dropping by 31 percent and 22 percent over 2015, respectively.
The financial services sector saw a 5 percent decrease in the number of exits from 76 in 2014 to 72 in 2015. Subsequently these exits declined by 22 percent to 56 exits in 2016, imputing a decrease of 26 percent from the number of exits in 2014.
The IT/ITeS sector has seen a marginal increase in the number of exits between 2014 and 2016, which stood at 52 and 55, respectively, imputing a 6 percent increase since 2014. However, 2015 witnessed 61 exits implying a 17 percent increase in the number of exits from 2014. The 55 deals in 2016 thereafter would impute a 9.8 percent decline in the number of exits in 2015.
The consumer discretionary sector saw a continued decline in the number of exits from 63 exits in 2014 to 43 exits in 2015 and 39 exits in 2016, implying a 38 percent decline from 2014 to 2016. The industrials space also witnessed a continued decline in the number of exits from 58 exits in 2014 to 51 exits in 2015 and 35 exits in 2016, which would attribute to a 40% decline in number of exit deals from 2014 to 2016.
The healthcare space witnessed a significant increase in the number of exit deals from 16 exits in 2014 to 23 exits in 2015, implying a 44 percent growth, followed by 25 exits in 2016, imputing 9 percent increase from 2015. The sector noticed a 56 percent increase in the number of exits from 2014 to 2016.
Financials IT Consumer Discre-tionary
Industri-als
Health-care
Consumer Staples
Materials Utilities Telecom Energy
2014 76 52 63 58 16 14 13 7 7 3
2015 72 61 43 51 23 17 18 7 5 0
2016 56 55 39 35 25 12 9 4 2 2
80706050403020100
PE Exits by Sector (2014 - 2016)
13VCCEdge database

Private Equity: Optimizing the regulatory landscape and exits
22
Consumer staples saw a marginal decline from 14 exit deals in 2014 to 12 exit deals in 2016, which would be a 14% decline from 2014 to 2016. However, 2015 witnessed 17 exit-transactions, which would imply a 21 percent increase from the number of exits in 2014. The materials space also saw a decline in number of exits from 13 exits in 2014 to 9 exits in 2016—a 31 percent decline from 2014 to 2016. However, 2015
witnessed 18 exits in the materials space leading to 39 percent growth from 2014 to 2015 and a 50 percent decline from 2015 to 2016.
The utilities space remained constant from 2014 to 2015 with 7 exits and decline in 2016 to 4 exits, implying a 43 percent decline. The telecom space also continued to decline from 2014 to 2016 with 7 exits
in 2014, 5 exits in 2015 and 2 exits in 2016, implying a 71 percent decline from 2014 to 2016. The energy sector witnessed a marginal decline of 33 percent from 2014 to 2016. The energy sector saw 3 exit deals in 2014, none in 2015 and 2 exit deals in 2016.
Some of the large exit deals of the top five sectors from 2014 to 2016 include:
Date Target Buyer Seller Exit Type Stake (%) Deal Value (USD mn)
07-May-15 Shriram City Union Finance Ltd.
Apax Partners LLP
TPG Capital Inc. Secondary Sale 20.37 384.55
16-Oct-15 Equitas Holdings Ltd.
Aavishkaar Goodwell India Microfinance Development Co. Ltd., India Financial Inclusion Fund, MicroVentures SPA, ARIA Investment Partners III LP, Sequoia Capital India III LP, WestBridge Ventures II LLC, Aquarius Investment Advisors India Pvt. Ltd., Helion Venture Partners II LLC, International Finance Corp., Netherlands Development Finance Co., Creation Investments Capital Management LLC, Sarva Capital LLC
Initial Public Offering
34.92 224.41
26-Oct-16 Lodha Group, World One
HDFC Property Fund M&A 224.27
28-Apr-15 Canaan Advisors Pvt. Ltd., Domestic Portfolio
JP Morgan Partners
Canaan Advisors Pvt. Ltd. Secondary Sale 100 200
01-Jan-15 Mahindra and Mahindra Financial Services Ltd.
Cartica Capital LLC Open Market 7.85 188.48
02-Sep-16 Cholamandalam Investment and Finance Company Ltd.
Apax Partners LLP, Apax VIII- A L.P. Open Market 7.14 173.55
01-Oct-16 IDFC Bank Ltd. Khazanah Nasional Berhad Open Market 4.15 150.85
Financials

Private Equity: Optimizing the regulatory landscape and exits
23
Date Target Buyer Seller Exit Type Stake (%)
Deal Value (USD mn)
18-Aug-16 Bharti Telecom Ltd.
Singapore Telecommunications Ltd.
Temasek Holdings Advisors India Pvt. Ltd.
M&A 7.39 657
11-Jul-16 Minacs Pvt. Ltd. Synnex Corporation Capital Square Partners Pte. Ltd, CX Capital Management Ltd.
M&A 100 420
01-Jan-14 HCL Technologies Ltd.
ChrysCapital Investment Advisors India Pvt. Ltd.
Open Market 1.67 287
19-Jan-16 Amber Enterprises India Pvt. Ltd.
Goldman Sachs Group Inc.
Reliance Alternative Investments Fund Private Equity Scheme I
Secondary Sale
34 175
Date Target Buyer Seller Exit Type Stake (%)
Deal Value (USD mn)
07-Nov-14 Hero MotoCorp Ltd.
Bain Capital LLC Open Market 4.28 400.24
19-May-14 Myntra Designs Pvt. Ltd.
Flipkart Pvt. Ltd., Flipkart India Pvt. Ltd.
IndoUS Venture Partners I LLC, Accel India Venture Fund, IDG Ventures India Fund, Sofina Societe, PI Opportunities Fund I, Accel India Venture Fund II LP, Tiger Global Management LLC
M&A 6.42 285.62
12-Jun-14 Hero MotoCorp Ltd.
Bain Capital LLC Open Market 2.81 249.81
10-Apr-15 Dish TV India Ltd. Apollo Management LP Open Market 11 184.22
01-Apr-16 Hero MotoCorp Ltd.
GIC Pte. Ltd. Open Market 1.56 147.78
05-Jul-16 Endurance Technologies Ltd.
Actis Advisers Pvt. Ltd. Initial Public Offering
13.72 135.29
26-Nov-15 Hero MotoCorp Ltd.
Bain Capital LLC Open Market 1.49 116.68
IT
Consumer Discretionary

Private Equity: Optimizing the regulatory landscape and exits
24
Date Target Buyer Seller Exit Type Stake (%)
Deal Value (USD mn)
14-May-14 Mahindra and Mahindra Ltd.
Goldman Sachs (Principal Investments)
Open Market 3.02 356.26
22-Dec-16 International Tractors Ltd.
Yanmar Company Ltd.
Blackstone Advisors India Pvt. Ltd. M&A 17.75 235.48
22-Jan-15 Agile Electric Sub Assembly Pvt. Ltd.
Mape Advisory Group Pvt. Ltd., Igarashi Electric Works Ltd., Tata Capital Growth Fund
Blackstone Advisors India Pvt. Ltd. Secondary Sale
97.9 106.4
01-Jul-15 Mahindra and Mahindra Ltd.
Temasek Holdings Advisors India Pvt. Ltd.
Open Market 0.82 101.39
Date Target Buyer Seller Exit Type Stake (%)
Deal Value (USD mn)
28-Jul-16 Gland Pharma Ltd.
Shanghai Fosun Pharmaceutical Group Co. Ltd.
KKR India Advisors Pvt. Ltd., Gland Celsus Bio Chemicals Pvt. Ltd.
M&A 38.41 576.55
12-Jan-16 Quality Care India Ltd.
Abraaj Capital Ltd. Advent International Corp. Secondary Sale
65.59 189.14
19-Aug-16 Laurus Labs Ltd. Aptuit Inc., Eight Roads Ventures, Warburg Pincus India Pvt. Ltd.
Initial Public Offering
22.8 154.21
06-May-15 Mankind Pharma Ltd.
Capital International Inc.
ChrysCapital IV LLC Secondary Sale
10.77 179.6
22-Aug-14 Intas Pharmaceuticals Ltd.
Temasek Holdings Advisors India Pvt. Ltd.
ChrysCapital III LLC Secondary Sale
10.16 154.6
Industrials
Healthcare

Private Equity: Optimizing the regulatory landscape and exits
25
Exit routesOver the last three years, there has been a dramatic shift in terms of the routes taken by PE/VC funds as they exited their investments. While the share of buybacks and IPOs as exit routes has changed marginally, there has been a significant change in the share of M&A as an exit route. Such exits have been driven by strategic acquisitions—both organic and inorganic—that have happened across sectors.
Buybacks, as a category, dropped from 41 exits in 2014 to 33 in 2015, and subsequently only 12 in 2016, implying a 64 percent decline from 2015 to 2016. The share of buybacks has more than halved from 13 percent in 2014 to around 5 percent in 2016.14
Exits made through IPOs increased marginally in terms of the number of transactions between 2014 and 2016. The number of exits through the IPO route increased from 11, in 2014, to 12, in 2015, and subsequently 14, in 2016, thus implying an increase of around 17 percent in the final year. Secondary sales, on the other hand, remained constant in terms of the number of exit transactions between 2014 and 2016 (from 36 exits in 2014 to 35 exits in 2016), while there was a jump to 44 exits in 2015.
The number of exit transaction through M&A has seen an increase of around 65 percent from 62 exits in 2014 to 102 exits in 2016, whereas the number of open market transactions has decreased year on year, from 159 in 2014 to 122 in 2015, and 76 in 2016, thus implying a 52 percent decline from 2014 to 2016.
Exit through M&AsThe exit to strategic investors through M&A is rapidly emerging as the favorite route for private equity and venture capital funds. In 2016, over one-third of all PE exits were through the M&A route. The share of M&As in PE and VC exits has gone up from 20 percent in 2014 to 29 percent
14VCCEdge database
PE Exits by Exit mode
0
20%
10%
30%
40%
50%
60%
80%
100%
90%
70%
2014
297
2015 2016
Buyback IPO M&A Open Market Secondary Market
11%13% 6%4%
32%41%52%
5%
43%29%20%
4%
15%15%12%
M&As accounting for number of PE / VC exits
0
5.0%
10.0%
15.0%
20.0%
25.0%
30.0%
35.0%
45.0%
40.0%
20.1%
2014
29.0%
2015
42.7%
2016
201462 exits
201586 exits
2016102 exits

Private Equity: Optimizing the regulatory landscape and exits
26
in 2015, and 43 percent in 2016. The rapid rise in the share of M&As in PE/VC exits bears testimony to the growing M&A activity in India. With many foreign MNCs pursuing the inorganic route for entering India, M&A activity has been on the rise in the recent past.
The year 2016 witnessed many big-ticket M&A transactions in which PE funds cashed in on their investments. The private equity giant KKR, in particular, exited from two of its large investments by selling out to strategic investors. Japan’s Yokohoma
purchased the KKR-backed Alliance Tire Group, for USD 1.2 billion. KKR (along with Gland Celsus) sold a 38 percent stake in Gland Pharma to Shanghai Fosun Pharmaceutical for USD 577 million.
Other large private equity exits done through the M&A route included Temasek’s sale of a 7.4 percent stake in Bharti Telecom to Singapore Telecommunications for USD 657 million and Capital Square and CD Capital’s sale of 100 percent stake in the IT sector company Minacs Private Limited to Synnex Corporation for USD 420 million.
The broader M&A market also witnessed strong M&A activity. A key driver for M&A deals was the rise in both domestic and inbound investment activity by strategic investors. In some sectors, consolidation was also a theme that drove M&A activity. The year 2017 has also started with significant activity in the M&A market. Recent examples include: the Vodafone Idea merger in the telecom space,15 and rumors around the Kotak Mahindra Bank and Axis Bank in the financial services sector.16
Date Target Buyer Seller Industry Exit Type
Stake (%) Deal Value (USD mn)
Mar-16 Alliance Tire Group B.V.
Yokohama Rubber Co. Ltd.
KKR India Advisors Pvt. Ltd.
Automotive M&A 100 1,179
Aug-16 Bharti Telecom Ltd
Singapore Telecommunications Ltd.
Temasek Holdings Telecom M&A 7.39 657
Jul-16 Gland Pharma Ltd Shaghai Fosun Pharmaceutical
KKR India, Gland Celsus Life Sciences and Healthcare
M&A 38.41 577
Jul-16 Minacs Pvt. Ltd. Synnex Corporation Capital Square, CX Capital IT Services M&A 100 420
Dec-16 International Tractors Ltd.
Yanmar Company Ltd.
Blackstone Advisors India Pvt. Ltd.
Industrials M&A 17.75 235
Oct-16 Lodha Group, World One
NA HDFC Property Fund Real Estate M&A NA 224
15‘Vodafone, Idea likely to seal merger pact within a month’, Economic Times, February 201716‘Kotak Mahindra, Axis Bank shares rise on merger rumours’, Livemint, February 2017

Private Equity: Optimizing the regulatory landscape and exits
27
Exit through IPOsThe IPO market in India continued on its path of revival as the year saw 27 IPOs raising the highest amount from capital markets in the last six years. However, the IPO route for exits was not the most preferred route for private equity and venture capital investors. In fact, the share
of IPO exits to total PE and VC exits in the year increased marginally from 4 percent in 2015 to 6 percent in 2016. The year 2015 had also seen a marginal increase in the share of IPOs to private equity and venture capital exits from 3.6 percent in 2014. In the same period, the broader IPO market in India had seen the number of
IPO issuances triple from seven in 2014 to 21 in 2015. Moreover, the amount of money raised had grown nearly tenfold between 2014 and 2015, from INR 12 billion to INR 114 billion.
Nevertheless, there were some marquee exits by private equity investors in the form of IPOs. One of the notable exits was the USD 325 million IPO of Equitas Holdings, the Small Finance Bank license holder non-banking financial services company (NBFC), in April 2016. More than ten private equity and venture capital investors, including World Bank’s International Finance Corporation (IFC), Sequoia Capital and CLSA Capital, exited with a reported exit value amounting to USD 217 million.
Company 18 IPO issue size PE/VC funds to exit
Equitas Holdings USD 336 million IFC, Sequoia Capital, CLSA Capital
Laurus Labs USD 205 million Aptuit, Eight Road Ventures, Warburg Pincus
RBL Bank USD 179 million Beacon India, Gaja Capital, Capvent, Elephant Capital Fund
Endurance Technologies USD 178 million Actis Advisors
Varun Beverages USD 153 million Standard Chartered PE, Aion Capital
Ujjivan Financial Services USD 133 million Unitus Equity, Wolfensohn Capital, Indian Financial Inclusion Fund
Parag Milk Foods USD 111 million IDFC Private Equity
Healthcare Global Enterprises USD 102 million Premji Invest, Temasek
CL Educate USD 36 million Gaja Capital, Granite Hill India Opportunities Fund
Seaways Shipping and Logistics USD 12 million IDFC Private Equity
17‘NSE public offer may see largest PE exit’, Business Standard, August 201618‘As IPO market booms in India, 2016 set to be record year for private equity players exits’, Financial Express, August 2016
Share of IPOs in PE/VC exits (#)
0
2.5%
5.0%
7.5%
3.6%
2014
4.0%
2015
5.9%
2016

Private Equity: Optimizing the regulatory landscape and exits
28
Exit through open market and secondary saleSecondary sales and open market transactions accounted for 46 percent of the private equity and venture capital exits in 2016. This share has been coming down sequentially from 63 percent in 2014 to
56 percent in 2015, and now 46 percent in 2016. While the share of secondary sales has largely remained constant (marginal increase in share), the drop in their cumulative share can be entirely attributed to the drop in open market exits.
Some notable open market exits by private equity funds included:
• Providence selling its 3.47% stake in Idea Cellular for USD 205 million.
• Advent International selling its 65.59% stake in Quality Care India Ltd. to Abraaj Capital for USD 189 million.
• Reliance Capital selling its 34% stake in Amber Enterprises India, manufacturer of electronic components, to Goldman Sachs Group Inc. for USD 175 million.
Even the start of 2017 saw the likes of Providence Equity Partners, Khazanah Nasional Berhad, Carlyle Asia and Norwest Venture Partners, amongst others exiting investments through open market transactions valued at more than USD 100 million, each.19
Date Target Buyer Seller Industry Exit Type Stake (%) Deal Value (USD mn)
Jun-16 Idea Cellular Ltd. Providence Equity Partners LLC
Telecom Open Market
3.47 205
Jan-16 Quality Care India Ltd.
Abraaj Capital Ltd.
Advent International Corp.
Life Sciences and Healthcare
Secondary Sale
65.59 189
Jan-16 Amber Enterprises India Pvt. Ltd.
Goldman Sachs Group Inc.
Reliance Alternative Investments Fund Private Equity Scheme I
Manufacturing Secondary Sale
34 175
Sep-16 Cholamandalam Investment and Finance Company Ltd.
Apax Partners LLP, Apax VIII- A L.P.
Financial Services
Open Market
7.14 174
Oct-16 IDFC Bank Ltd. Khazanah Nasional Berhad
Financial Services
Open Market
4.15 150
Apr-16 Hero MotoCorp Ltd.
GIC Pte. Ltd. Automotive Open Market
1.56 148
Jan-16 Marico Ltd. Arisaig Asia Consumer Fund
Consumer Open Market
1.91 84
19VCCEdge database
Share of open market and secondary sales in PE/VC exits (#)
0
20%
10%
30%
40%
50%
60%
70%
2014 2015 2016
Open Market Secondary Sale
41%
52%
15%
15%
12%
32%
Private Equity: Optimizing the regulatory landscape and exits
29
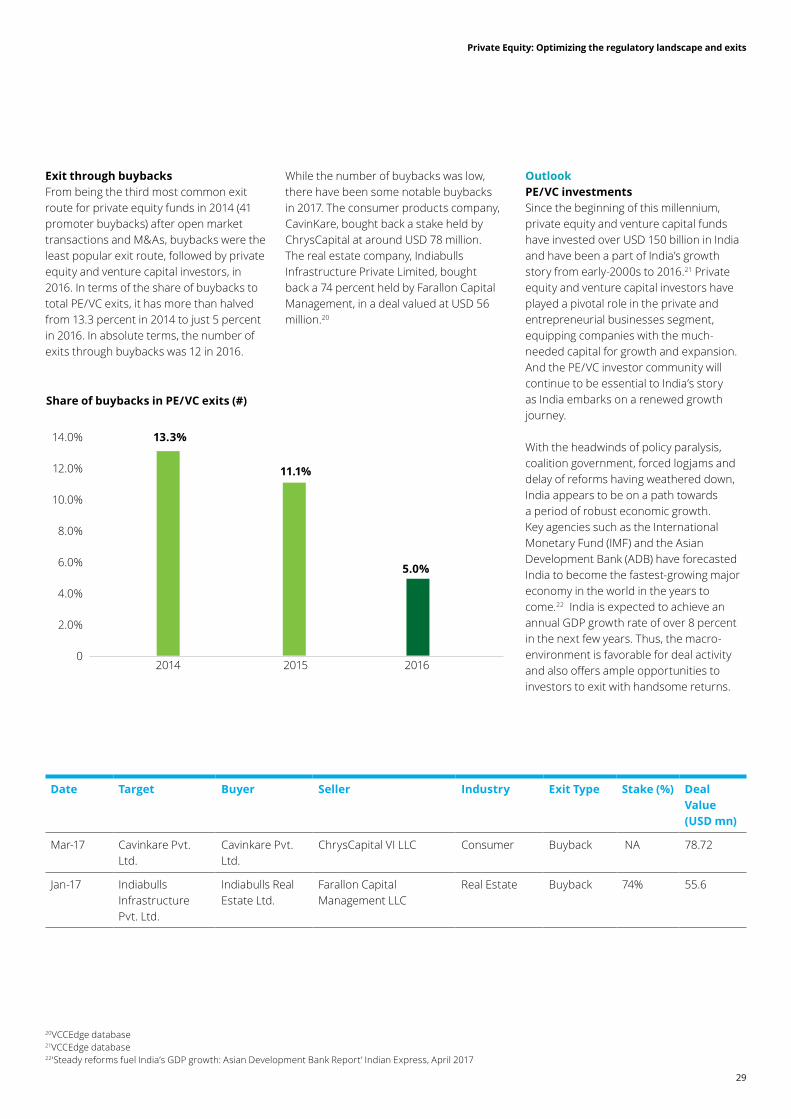
Exit through buybacksFrom being the third most common exit route for private equity funds in 2014 (41 promoter buybacks) after open market transactions and M&As, buybacks were the least popular exit route, followed by private equity and venture capital investors, in 2016. In terms of the share of buybacks to total PE/VC exits, it has more than halved from 13.3 percent in 2014 to just 5 percent in 2016. In absolute terms, the number of exits through buybacks was 12 in 2016.
While the number of buybacks was low, there have been some notable buybacks in 2017. The consumer products company, CavinKare, bought back a stake held by ChrysCapital at around USD 78 million. The real estate company, Indiabulls Infrastructure Private Limited, bought back a 74 percent held by Farallon Capital Management, in a deal valued at USD 56 million.20
OutlookPE/VC investmentsSince the beginning of this millennium, private equity and venture capital funds have invested over USD 150 billion in India and have been a part of India’s growth story from early-2000s to 2016.21 Private equity and venture capital investors have played a pivotal role in the private and entrepreneurial businesses segment, equipping companies with the much-needed capital for growth and expansion. And the PE/VC investor community will continue to be essential to India’s story as India embarks on a renewed growth journey.
With the headwinds of policy paralysis, coalition government, forced logjams and delay of reforms having weathered down, India appears to be on a path towards a period of robust economic growth. Key agencies such as the International Monetary Fund (IMF) and the Asian Development Bank (ADB) have forecasted India to become the fastest-growing major economy in the world in the years to come.22 India is expected to achieve an annual GDP growth rate of over 8 percent in the next few years. Thus, the macro-environment is favorable for deal activity and also offers ample opportunities to investors to exit with handsome returns.
Date Target Buyer Seller Industry Exit Type Stake (%) Deal Value (USD mn)
Mar-17 Cavinkare Pvt. Ltd.
Cavinkare Pvt. Ltd.
ChrysCapital VI LLC Consumer Buyback NA 78.72
Jan-17 Indiabulls Infrastructure Pvt. Ltd.
Indiabulls Real Estate Ltd.
Farallon Capital Management LLC
Real Estate Buyback 74% 55.6
20VCCEdge database21VCCEdge database22‘Steady reforms fuel India’s GDP growth: Asian Development Bank Report’ Indian Express, April 2017
Share of buybacks in PE/VC exits (#)
0
2.0%
4.0%
6.0%
8.0%
10.0%
14.0%
12.0%
13.3%
2014
11.1%
2015
5.0%
2016

Private Equity: Optimizing the regulatory landscape and exits
30
The market barometers—the BSE’s Sensex and the NSE’s Nifty50—have both climbed over 12 percent in the year till date ( January to March 2017). As of early April 2017, both the indices have scaled all-time high levels of 29,700 points and 9,200 points, respectively.23
The year 2016 ended on a stronger note with indications in the last two quarters that private equity investment activity could pick up in the near-term. There are strong tailwinds that are expected to boost investment activity. On the one hand, there are government-led actions such as the implementation of the GST reforms, additional FDI limit relaxation in key sectors (for example, pharma), focused infrastructure spending, the push for digitisation and other micro-reforms such as demonetisation driven digitisation (driving fintech, banking sectors). And, on the other hand, there are underlying socioeconomic and demographic changes (rapid urbanisation, young demographic, rising consumption).
Even on the supply side, a number of private equity institutions have raised fresh India-focused funds. It is reported that, in 2016, the top five private equity and venture capital funds alone raised about USD 2.4 billion across their India-dedicated funds.24
PE/VC India-focused fund Amount raised
Sequoia Capital Sequoia Capital India Fund V USD 920 million
Multiples PE Multiples PE Fund II USD 690 million
Accel Accel India V USD 430 million
Oman India JIF First close USD 220 million
Lighthouse India 2020 Fund II USD 138 million
Thematic funds such as the Brookfield-SBI Stressed asset JV (USD 1.04 billion fund) and the proposed Piramal-Bain Capital platform are expected to focus on specific opportunities in asset reconstruction.25 Similarly, several sector-focused platforms such as the KKR-CA Media fund (USD 300 million Asia fund) are expected to drive deal activities across target sectors.
Private equity buyout is another deal theme that is expected to gain traction in the near future. The year 2016 saw private equity funds take big bets on companies in India. Brookfield Asset Management invested USD 1.6 billion in Towercom Infrastructure Private Limited. Blackstone invested USD 0.8 billion in Mphasis. And, AION along with other investors bought GE Capital Services India for USD 330 million. This trend is also expected to continue as 2017 unfolds.
However, as Indian promoters continue to have high valuation expectations, and the universe of investible and investment-grade private companies and assets continues to be small, private equity and venture capital funds are expected to be cautious in making deals. At the same time, with over USD 7 billion of dry powder26 lying with private equity and venture capital
23Google Finance, accessed in April 201724‘PE and VC firms raised $4.9 billion via India-focused funds in 2016’, Livemint, December 201625‘Piramal Enterprises announces stressed asset investment fund with Bain Capital’, Livemint, August 2016
funds focused on India, the year 2017 could see a significant deployment of capital, and result in a rise in deal activity.
Outlook for PE exitsEven though private equity and venture capital funds have done exits worth over USD 17 billion cumulatively in the last three years (2014 to 2016), along with the first three months of 2017 having already yielded over USD 750 million worth of exits,27 this is insignificant compared to the current investments (based on value of investment) held by funds in India.If we look at only large-ticket private equity and venture capital investments (greater than USD 50 million in investment size) done between 2006 and 2015, then there are investments worth USD 41 billion (at investment value) across over 300 invested companies that have either not been exited yet or just partially exited. This implies a large need as well as opportunity for exits in the near future.
Within this USD 41 billion worth of un-exited and partially exited investments pool, there are large ticket investments (greater than USD 50 million) with greater than five years of vintage account for 54 percent of the un-exited or partially exited investment value and 58 percent of such investments by count.

Private Equity: Optimizing the regulatory landscape and exits
31
The investments done pre-2012 are particularly under pressure because these would have been made when the United States Dollar (USD) was traded at around 45 Indian Rupees (INR), as against the prevailing exchange rate of 65 rupees (early 2017).28 This translates into an annualized depreciation of 6 percent that would have a direct implication on the funds’ dollar-returns.
While it is expected that a fair proportion of investments from a recent vintage (two to five years) would be un-exited given the typical private equity investment horizon of around five years, private equity and venture capital investors that invested in 2012, 2013 and 2014 will also start preparing for potential exits
of their investments. These account for around USD 19 billion in investment value across over 120 un-exited or partially exited investments done between 2012 and 2014.29
In terms of sectors that could see strong exit activity, un-exited or partially exited investments that are more than two years in vintage see a higher concentration of the IT/ITeS sector (including e-commerce), energy and mining, banking and financial services, telecom and consumer sector. These five sector groups account for 75 percent of the un-exited and partially exited investments in value terms (greater than USD 50 million investment size), and 64 percent in terms of the number of such investments.
28www.Investing.com accessed in April 201729VCCEdge database
0 0
1.0 10
2.0 20
3.0 30
50
4.0 40
70
5.0
60
90
6.0
7.0
9.0
8.0
10.0
80
100
2.7
4.0 4.2
1.6
3.7
5.55.0
5.4
8.6
Investment amount (USD billion) # of Investments
Un-exited or partially exited PE/VC investments (>USD 50 million) from 2006 to 2014
15
37 38
18
25
43
32
5+ years vintage: USD 22 billion 2-5 yrs: USD 19 billion
34
62
2006 2007 2008 20112009 20122010 2013 2014

Private Equity: Optimizing the regulatory landscape and exits
32
Since investment themes have evolved over the years and sectoral attractiveness is driven by multiple factors that are perennially changing, the mix of un-exited businesses varies by vintage. If we look at the sector-mix of un-exited and partially exited private equity and venture capital investments across two cohorts—investments greater than five years old and investments between two and five years old—we see a clear difference in the mix of sectors.
In the five year plus vintage of un-exited deals, energy and mining is the largest accounting for 23 percent un-exited investments, followed by banking and
financial services (BFSI) at 17 percent, consumer at 11 percent, and telecom and manufacturing at 8 percent each. But, post-2014, there has been a significant jump in the focus towards e-commerce, information technology (IT) and healthcare sectors. Therefore, the sector profile of un-exited and partially exited private equity and venture capital investments in the two to five years’ vintage is vastly different from the other cohort (five years plus). IT & ITeS, including e-commerce and technology, accounts for 26 percent of the un-exited businesses. This is followed by 16 percent in healthcare and BFSI each. Energy and mining is considerably lower at around 12 percent. Also, the concentration of the top
five sectors groups alone goes up from 67 percent in the five plus years’ cohort to a high of 78 percent in the two to five years’ cohort.
Therefore, in 2017 and beyond, one would expect a significant exits-related deal activity in these key sectors including IT & ITEs, BFSI, consumer, and healthcare and life sciences. The choice of exit routes for these maturing investments would depend on a host of internal and external factors.
Top sectors with un-exited or partially exited PE/VC investments (>USD 50 million), in USD billion
9.9
IT & ITES
6.8
Energy and
mining
4.3
Telecom
5.8
BFSI
2.2
Engg.and
construction
2.9
Consumer
2.1
Healthcare & Life
Science
2.7
Manu-facturing
1.2
Media & Enter-
tainment
0.8
Travel &Transport
0.9
Others
1.0
Shipping &
Logistics

Private Equity: Optimizing the regulatory landscape and exits
33
BFSI17%
Consumer11%
Consumer9%
BFSI16%
Telecom8%
Energy and mining12%
Manufacturing8%
Others33%
Others22%
Exit routes for PEsThe trend in the rise of M&As as a favorable route for exits is expected to continue in the near future. Consolidation, restructuring and asset sales are expected from Indian companies which are highly leveraged. This is expected to influence the rise of M&A activity in India. Moreover, M&A activity in India is also expected to be fuelled by foreign players looking at a foothold in the Indian market and an increasing preference for inorganic entry. Private equity funds will closely eye this opportunity to use M&As to exit their investments.
Historically, IPOs have not been amongst the most favored exit routes for private equity funds in India. Compared to China, where historical and academic research30 has proven that IPOs are the more prevalent exit channel, M&As have been more dominant in India. Traditionally, it has been easier for Indian companies to get listed in India than in China (including Hong Kong). Even currently, about 1,800 companies are listed on the Hong Kong Stock Exchange,31 and there are just over 1,000 listings on the Shanghai Stock Exchange32 compared to over 4,000 active listed companies on the Bombay Stock Exchange in India,33 notwithstanding the relative sizes of the two markets and the underlying economies.
However, many PE-backed companies are expected to tap into the capital markets in 2017. Examples include the Goldman Sachs backed ReNew Power that is mulling a USD 600 million IPO34 and the National Stock exchange that is proposing a USD 600 million IPO offering full or partial exits to more than six private equity investors.35 There are many other large and mid-sized listings of PE-backed companies that are planned in 2017.
30‘Private Equity Exits in India and China’, Faculty & Research Working Paper, INSEAD, 201131HKSE Factbook 2016 Listing Statistics32‘Brief Intro’, Shanghai Stock Exchange, August 201633 BSE India factsheet, accessed in April 201734‘ReNew Power plans IPO to raise up to $600 million’, The Economic Times, April 201635‘NSE public offer may see largest PE exit’, Business Standard, August 201636 VCCEdge database
Sector mix (top 5 and others) of un-exited or partially exited PE/VC investments (>USD 50 million) 5+ years vintage
Sector mix (top 5 and others) of un-exited or partially exited PE/VC investments (>USD 50 million) 2-5 years vintage
Energy and mining23%
IT & ITES26%
Healthcare & Life Science16%

Private Equity: Optimizing the regulatory landscape and exits
34
36 VCCEdge database
Company PE investor(s) Proposed IPO
ReNew Power Goldman Sachs USD 600 million
National Stock Exchange Norwest Ventuer Partners, General Atlantic, SAIF Partners, Goldman Sachs, Tiger Global, Morgan Stanley, ChrysCap
USD 600 million
Aster DM Healthcare Olympus Capital, India Value Fund USD 300 million
Hinduja Leyland Finance Everstone Capital USD 80 million
Prataap Snacks Sequoia Capital USD 50 million
Secondary sales and open market exits would also continue to be amongst the key exit routes for private equity and venture capital investors. If trends in the first three months of 2017 are an indication, open market exits will continue to account for a lion’s share of private equity exits.
Date Target Buyer Seller Industry Exit Type Stake (%) Deal Value (USD mn)
Feb-17 Idea Cellular Ltd. NA Providence Equity Partners LLC
Telecom Open Market
3.33% 193
Mar-17 Apollo Hospitals Enterprise Ltd.
NA Khazanah Nasional Berhad
Life Sciences and Healthcare
Open Market
6.07% 160
Mar-17 Edelweiss Financial Services Ltd.
NA Carlyle Asia Growth Partners III LP
Financial Services
Open Market
8.19% 130
Jan-17 IndusInd Bank Ltd.
NA Norwest Venture Partners X LP
Financial Services
Open Market
1.26% 125

Private Equity: Optimizing the regulatory landscape and exits
35
In SummaryThe year 2016 marked a slowdown in the private equity and venture capital investment activity in India, but trends towards the end of 2016 and early 2017 indicate a strong growth outlook. With the underlying India growth story intact, deal activity is expected to continue on an upward journey. Private equity and venture capital firms are also raising funds and gearing up to invest in India.
Private equity exits, on the other hand, have witnessed a steady growth in exits in value terms. With M&A activity reaching a five-year high of USD 61 billion in 201637 courtesy a bagful of multi-billion dollar deals, M&As have emerged as the most favorable route for PE exits. Continued global interest in India, and consolidation and debt-reduction by Indian companies, is expected to offer M&A exit opportunities to PE/VC funds in the future, too. Equity capital markets, particularly IPO listings, have also seen robust activity, lending a bullish outlook to IPOs as an exit route for existing private equity investors.
In summary, the current macro-economic situation of the economy, the abundance of investment opportunities and the availability of capital ready to be pumped into India offer a positive outlook for the private equity and venture capital market, particularly exits.

Private Equity: Optimizing the regulatory landscape and exits
36
3. Developing Fund of Funds Industry in India
Setting the contextA "fund of funds" (FOF) is an investment strategy of holding a portfolio of other investment funds rather than investing directly in stocks, bonds or other securities. Private equity FOF are investment vehicles that pool in capital from people to invest in several different private equity funds. Through these funds, investors can create a highly diversified and comprehensive portfolio of indirect investments in several companies from some or all of the categories of private equity.
In India, FOF has been used as an entry strategy by several large private equity and sovereign wealth funds, to test the Indian markets, before setting up full-fledged advisory operations in India.
The FOF industry has not taken off in India as compared to other markets. Traditionally, high net worth individuals (HNIs) have directly set up family offices such as Wipro’s
Azim Premji (PremjiInvest) and Infosys’ Narayan Murthy (Catamaran Ventures). Over the years, they have built significant direct fund management platforms. 90 of the largest single family offices (SFOs) alone manage private wealth in excess of USD 100 billion, as estimated by an internal study conducted by the Association of International Wealth Management of India (AIWMI).38
Apart from SIDBI, there have not been any other notable FOFs that have come up in India. SIDIBI’s fund of funds has contributed to the corpus of 88 venture capital funds that have catalysed investments of nearly USD 1 billion to more than 400 MSMEs.39 The FOF industry is a key source of capital for the private equity industry. In 2006, for example, it was estimated that FOF investments in private equity funds amounted to 14 percent of all committed capital in the global private equity market.40
38‘Corporate hotshots like Azim Premji, Narayan Murthy’s family offices on the rise’, Economic Times, July 201639SIDBI Venture Fund website, accessed in April 201740Preqin Global Private Equity & Venture Capital Report41‘Texas Permanent School Fund’, Texas Education Agency portal, accessed in April 201742‘Who holds the wealth of nations?’, Andrew Rozanov, State Street Global Advisors, August 200543Fund Rankings 2016, SWFI, accessed in April 2017
Sovereign wealth fundsThe concept of sovereign wealth funds dates back to the mid-nineteenth century in the United States, when non-federal funds were used to support specific public services, such as public schools in Texas.41 While the term ‘Sovereign wealth funds’ has gained currency only in the last few decades,42 many commodity-rich and export-driven economies with current account surpluses have set up and dramatically scaled their sovereign wealth funds, in the last fifty years.
Notable commodity export-led sovereign wealth funds include those of Norway (Government Pension Fund—Norway), United Arab Emirates (Abu Dhabi Investment Authority) and Kuwait (Kuwait Investment Authority). Some of the largest non-commodity based sovereign wealth funds include those of China (China Investment Corporation, SAFE Investment Company) and Singapore (GIC Private Limited).43

Private Equity: Optimizing the regulatory landscape and exits
37
Closer home, emerging economies such as Malaysia (Khazanah Nasional), Indonesia (Government Investment Unit of Indonesia) and Vietnam (State Capital Investment Corporation) have also set up sovereign wealth funds.
In India’s context, the jury is still out on whether India should set up a sovereign wealth fund, given the current account deficit that the country runs, and whether it is a prudent use of the foreign exchange (forex) reserves that India holds in the form of US government bonds and institutional bonds. The examples of countries that run large sovereign wealth funds indicate these to be either commodity-led nations or export-driven economies, and India is neither of them.
However, it can also be argued that India could better utilise the USD 346 billion worth of non-gold forex reserves (as of March 31, 2017),44 that are predominantly denominated in the United States Dollar, and improve the returns earned on the corpus along with generating an investment income that could be directed towards federal capital expenditure. Another compelling business case for sovereign wealth funds is the strategic geo-political and economic advantage they offer. Interestingly, when Singapore established Temasek Holdings and the Government Investment Corporation (GIC) in 1974 and 1981 respectively, it was running a current account deficit.45
Top-5 commodity based funds
Country Inception AUM (Jun’16) Top-5 non-commodity based funds
Country Inception AUM (Jun’16)
Government Pension fund – Global
Norway 1990 USD 850 billion
China Investment Corporation
China 2007 USD 814 billion
Abu Dhabi Investment Authority
UAE 1976 USD 792 billion
SAFE Investment Company
China 1997 USD 474 billion
Kuwait Investment Authority
Kuwait 1953 USD 592 billion
HK Monetary Authority Investment Portfolio
Hong Kong 1993 USD 457 billion
SAMA Foreign Holdings
Saudi Arabia 1952 USD 582 billion
GIC Private Limited
Singapore 1981 USD 350 billion
Qatar Investment Authority
Qatar 2003 USD 335 billion
National Social Security Fund
China 2000 USD 295 billion
43Fund Rankings 2016, SWFI, accessed in April 201744Foreign Exchange Reserves - RBI Weekly Statistical Supplement, April 201745‘The Case for an Indian Sovereign Wealth Fund’ Edwin M. Truman, Peterson Institute for International Economics, September 2010

Private Equity: Optimizing the regulatory landscape and exits
38
Regulatory perspectiveOn the regulatory front, allowing foreign investors to invest in AIF under the automatic route is a welcome step and would go a long way in promoting FOF. Further, since investments of India managed AIF would be considered as domestic investment, with foreign investment restrictions not being applicable, regardless of the source of monies in such AIFs, this opens up a new avenue for FOF to access Indian markets in a much broader manner. It would help if clarity is issued to ADs permitting repatriation of returns from AIFs to foreign investors under the automatic route, without any approval. While the position under law is clear, there may still be certain operational glitches, and any clarification on this matter would help.
On the tax side, there are a few issues that need to be ironed out, to further boost the FOF investment in India—either in AIF or offshore India dedicated funds. The same have been listed below.
Exemption from filing of return of income to foreign investors
• Category I and II AIFs are passed through trusts. The income accruing/arising to these AIFs is taxable in the hands of investors. Such AIFs are required to withhold tax at the rates in force on the distribution of fund income to non-resident investors.
• In case of non-resident investors in AIFs, the entire tax in respect of income from investment in AIF is discharged by way of withholding tax. Hence, such investors, should not be subject to further burden of tax filing in India, as long as income from AIF is their only Indian sourced income.
Indirect transfer
• It was mentioned in the 2017 budget speech that a separate clarification will be issued that indirect transfer provision shall not apply in the case of redemption of shares or interests outside India as a result of or arising out of redemption or sale of investment in India which is chargeable to tax in India. However, no such amendment has been made to the Act. This continues to be a matter of concern to FOF investments in India dedicated to offshore funds.
Availability of tax credit to FOFFOF, that are taxable entities in their home countries, need to have a mechanism to claim credit for Indian taxes paid in respect of their share of income by the offshore funds in which the FOF would have invested. For this purpose, a separate definition of FOF needs to be introduced and in certain situations, on fulfilment of certain specified conditions, proof of proportionate taxes paid in India can be issued in the name of FOF, instead of the offshore fund investing in India.

Private Equity: Optimizing the regulatory landscape and exits
39

Private Equity: Optimizing the regulatory landscape and exits
40
We believe that we’re only as good as the good we do.
All the facts and figures that talk to our size and diversity and years of history, as notable and important as they may be, are secondary to the truest measure of Deloitte: the impact we make in the world.
So, when people ask, “what’s different about Deloitte?” the answer resides in the many specific examples of where we have helped Deloitte member firm clients, our people, and sections of society to achieve remarkable goals, solve complex problems or make meaningful progress. Deeper still, it’s in the beliefs, behaviors and fundamental sense of purpose that underpin all that we do.
Our hard work and commitment to making a real difference, our organization has grown in scale and diversity—more than 245,000 people in 150 countries, providing multidisciplinary services yet our shared culture remains the same.
For us, good isn’t good enough. We aim to excel at all that we do—to help clients realize their ambitions; to make a positive difference in society; and to maximize the success of our people. This drive fuels the commitment and humanity that run deep through our every action.
That’s what makes us truly different at Deloitte. Not how big we are, where we are, nor what services we offer. What really defines us is our drive to make an impact that matters in the world.In India, Deloitte member firms are spread across 13 locations with more than 40,000 professionals who take pride in their ability to deliver to clients the right combination of local insight and international expertise.
(C) 2017 Deloitte Touche Tohmatsu India LLP
About Deloitte
Andy KhannaPartner and Head Private Equity, Financial Advisory ServicesTel: +91-124-679 2167Email: [email protected]
Pooja BharwaniAssociate DirectorTel: +91-22-6185 [email protected]
Puneet KokruManager, Financial Advisory ServicesTel: +91-22-6185 6363Email: [email protected]
Authors

Private Equity: Optimizing the regulatory landscape and exits
41
About ASSOCHAMThe knowledge architect of corporate IndiaEvolution of value creatorASSOCHAM initiated its endeavour of value creation for Indian industry in 1920. Having in its fold more than 400 Chambers and Trade Associations, and serving more than 4,50,000 members from all over India. It has witnessed upswings as well as upheavals of Indian Economy, and contributed significantly by playing a catalytic role in shaping up the Trade, Commerce and Industrial environment of the country.
Today, ASSOCHAM has emerged as the fountainhead of Knowledge for Indian industry, which is all set to redefine the dynamics of growth and development in the technology driven cyber age of ‘Knowledge Based Economy’.
ASSOCHAM is seen as a forceful, proactive, forward looking institution equipping itself to meet the aspirations of corporate India in the new world of business. ASSOCHAM is working towards creating a conducive environment of India business to compete globally.
ASSOCHAM derives its strength from its Promoter Chambers and other Industry/Regional Chambers/Associations spread all over the country.
VisionEmpower Indian enterprise by inculcating knowledge that will be the catalyst of growth in the barrierless technology driven global market and help them upscale, align and emerge as formidable player in respective business segments.
MissionAs a representative organ of Corporate India, ASSOCHAM articulates the genuine, legitimate needs and interests of its members. Its mission is to impact the policy and legislative environment so as to foster balanced economic, industrial and social development. We believe
education, IT, BT, Health, Corporate Social responsibility and environment to be the critical success factors.
Members – Our StrengthASSOCHAM represents the interests of more than 4,50,000 direct and indirect members across the country. Through its heterogeneous membership, ASSOCHAM combines the entrepreneurial spirit and business acumen of owners with management skills and expertise of professionals to set itself apart as a Chamber with a difference.
Currently, ASSOCHAM has more than 100 National Councils covering the entire gamut of economic activities in India. It has been especially acknowledged as a significant voice of Indian industry in the field of Biotechnology, Banking & Finance, Corporate Social Responsibility, Civil Aviation, Company Law, Corporate Finance, Competency Building & Skill Development, Corporate Governance, Defence, Environment & Safety, Energy & Power, Education, Economic and International Affairs, HR & Labour Affairs, Information Technology, Infrastructure, Luxury, Legal Reforms, Mergers & Acquisitions, Real Estate and Rural Development, Sports, Telecom, Tourism to mention a few.
Insight into ‘New Business Models’ASSOCHAM has been a significant contributory factor in the emergence of new-age Indian Corporates, characterized by a new mindset and global ambition for dominating the international business. The Chamber has addressed itself to the key areas like India as Investment Destination, Achieving International Competitiveness, Promoting International Trade, Corporate Strategies for Enhancing Stakeholders Value, Government Policies in sustaining India’s Development, Infrastructure Development for enhancing India’s Competitiveness, Building Indian MNCs, Role of Financial Sector the Catalyst for India’s Transformation.
ASSOCHAM derives its strengths from the following Promoter Chambers: Bombay Chamber of Commerce & Industry, Mumbai; Cochin Chambers of Commerce & Industry, Cochin: Indian Merchant’s Chamber, Mumbai; The Madras Chamber of Commerce and Industry, Chennai; PHD Chamber of Commerce and Industry, New Delhi.
Together, we can make a significant difference to the burden that our nation carries and bring in a bright, new tomorrow for our nation.
D. S. RawatSecretary [email protected]
The Associated Chambers of Commerce and Industry of IndiaASSOCHAM Corporate Office:5, Sardar Patel Marg, Chanakyapuri, New Delhi-110 021Tel: 011-46550555 (Hunting Line) • Fax: 011-23017008, 23017009 Email: [email protected] Website: www.assocham.org
ASSOCHAM

Private Equity: Optimizing the regulatory landscape and exits
42
Notes
........................................................................................................................................................................................................................................................................................................................................
..........................................................................................................................................................................................................................................................................................................................................
..........................................................................................................................................................................................................................................................................................................................................
..........................................................................................................................................................................................................................................................................................................................................
..........................................................................................................................................................................................................................................................................................................................................
..........................................................................................................................................................................................................................................................................................................................................
..........................................................................................................................................................................................................................................................................................................................................
..........................................................................................................................................................................................................................................................................................................................................
..........................................................................................................................................................................................................................................................................................................................................
..........................................................................................................................................................................................................................................................................................................................................
..........................................................................................................................................................................................................................................................................................................................................
..........................................................................................................................................................................................................................................................................................................................................
..........................................................................................................................................................................................................................................................................................................................................
..........................................................................................................................................................................................................................................................................................................................................
..........................................................................................................................................................................................................................................................................................................................................
..........................................................................................................................................................................................................................................................................................................................................
..........................................................................................................................................................................................................................................................................................................................................
..........................................................................................................................................................................................................................................................................................................................................
..........................................................................................................................................................................................................................................................................................................................................
..........................................................................................................................................................................................................................................................................................................................................
..........................................................................................................................................................................................................................................................................................................................................
..........................................................................................................................................................................................................................................................................................................................................
..........................................................................................................................................................................................................................................................................................................................................
..........................................................................................................................................................................................................................................................................................................................................
..........................................................................................................................................................................................................................................................................................................................................
..........................................................................................................................................................................................................................................................................................................................................
..........................................................................................................................................................................................................................................................................................................................................
..........................................................................................................................................................................................................................................................................................................................................


Deloitte refers to one or more of Deloitte Touche Tohmatsu Limited, a UKprivate company limited by guarantee (“DTTL”), its network of member firms,and their related entities. DTTL and each of its member firms are legallyseparate and independent entities. DTTL (also referred to as “Deloitte Global”)does not provide services to clients. Please see www.deloitte.com/about for amore detailed description of DTTL and its member firms.
This material is prepared by Deloitte Touche Tohmatsu India LLP (DTTILLP).This material (including any information contained in it) is intended to providegeneral information on a particular subject(s) and is not an exhaustivetreatment of such subject(s) or a substitute to obtaining professionalservices or advice. This material may contain information sourced frompublicly available information or other third party sources. DTTILLP doesnot independently verify any such sources and is not responsible for anyloss whatsoever caused due to reliance placed on information sourcedfrom such sources. None of DTTILLP, Deloitte Touche Tohmatsu Limited, itsmember firms, or their related entities (collectively, the “Deloitte Network”)is, by means of this material, rendering any kind of investment, legal or otherprofessional advice or services. You should seek specific advice of the relevantprofessional(s) for these kind of services. This material or information is notintended to be relied upon as the sole basis for any decision which may affectyou or your business. Before making any decision or taking any action thatmight affect your personal finances or business, you should consult a qualifiedprofessional adviser.
No entity in the Deloitte Network shall be responsible for any loss whatsoeversustained by any person or entity by reason of access to, use of or reliance on,this material. By using this material or any information contained in it, the useraccepts this entire notice and terms of use.
©2017 Deloitte Touche Tohmatsu India LLP. Member of Deloitte ToucheTohmatsu Limited


