Embed Size (px)
Citation preview
American Economic Review 2014, 104(12): 3956–3990 http://dx.doi.org/10.1257/aer.104.12.3956
3956
Private Equity, Jobs, and Productivity †
By Steven J. Davis, John Haltiwanger, Kyle Handley, Ron Jarmin, Josh Lerner, and Javier Miranda *
Private equity critics claim that leveraged buyouts bring huge job losses and few gains in operating performance. To evaluate these claims, we construct and analyze a new dataset that covers US buyouts from 1980 to 2005. We track 3,200 target firms and their 150,000 establishments before and after acquisition, comparing to controls defined by industry, size, age, and prior growth. Buyouts lead to modest net job losses but large increases in gross job cre-ation and destruction. Buyouts also bring TFP gains at target firms, mainly through accelerated exit of less productive establishments and greater entry of highly productive ones. (JEL D24, G24, G32, G34, J23, J63, L25)
Leveraged buyouts by private equity firms arouse intense concern and strongly held views. For instance, former Danish Prime Minister Poul Rasmussen—architect of the European Commission’s Alternative Investment Fund Managers Directive—contends that “‘leveraged buy-outs’ leave the company saddled with debt and inter-est payments, its workers are laid off, and its assets are sold, … benefiting neither workers nor the real economy” (Rasmussen 2008, p. 132). The Service Employees International Union, prominent critic of private equity on both sides of the Atlantic, offers this assessment: “Typically it’s easier to decrease costs quickly by cut-ting heads, which is why buyouts have typically been accompanied by layoffs.”1
1 Wong, Grace. 2007. “Private Equity and the Job Cut Myth.” CNNMoney.com, May 2. http://money.cnn.com/2007/05/02/markets/pe_jobs/index.htm (accessed August 25, 2011). Remarks attributed to John Adler.
* Davis: University of Chicago Booth School, 5807 South Woodlawn Avenue, Chicago, IL 60637 (e-mail: [email protected]); Haltiwanger: Department of Economics, University of Maryland, College Park, MD 20742 (e-mail: [email protected]); Handley: University of Michigan Ross School, 701 Tappan Street, Ann Arbor, MI 48109 (e-mail: [email protected]); Jarmin: US Census Bureau, 4600 Silver Hill Road, Washington DC 20233 (e-mail: [email protected]); Lerner: Harvard Business School, Rock 314, Boston, MA 02163 (e-mail: [email protected]); Miranda: Center for Economic Studies, US Census Bureau, 4600 Silver Hill Road, Suitland, MD 20746 (e-mail: [email protected]). Davis, Haltiwanger, and Lerner are research associates with the National Bureau of Economic Research. This paper incorporates material from two earlier working papers by the authors, “Private Equity and Employment” (2011) and “Private Equity, Jobs, and Productivity” (2012). We thank Chris Allen, Paul Bailey, Ronald Davis, and Sarah Woolverton for research assistance, and Per Stromberg for data on the classification of private equity transactions. Francesca Cornelli, Per Stromberg, three anonymous referees, several practitioners, and numerous participants in conferences and research seminars provided many helpful comments. The World Economic Forum, Kauffman Foundation, Harvard Business School’s Division of Research, Initiative on Global Markets at the University of Chicago Booth School of Business, and the US Census Bureau provided generous financial support for this research. One of the authors has advised institutional inves-tors in private equity funds, private equity groups, and governments designing policies relevant to private equity. The analysis and results herein are attributable to the authors and do not necessarily reflect concurrence by the US Census Bureau. All results have been reviewed to ensure that no confidential information is disclosed. All errors and omissions are our own.
† Go to http://dx.doi.org/10.1257/aer.104.12.3956 to visit the article page for additional materials and author disclosure statement(s).
06_A20111124_10412.indd 3956 11/10/14 3:24 PM
3957Davis et al.: Private equity, Jobs, anD ProDuctivityvol. 104 no. 12
Responding to similar contentions, several industry-sponsored studies claim posi-tive employment and other effects of private equity. Examples include European Private Equity and Venture Capital Association (2005), British Private Equity and Venture Capital Association (2006), A.T. Kearney (2007), and Shapiro and Pham (2008).
Efforts to bring data to these issues are highly welcome, but these studies have several limitations. First, they rely on surveys with incomplete and perhaps selective responses, raising doubts about representativeness and accuracy. Second, the under-lying data offer little scope to control for concurrent changes at comparable firms. When a firm backed by private equity sheds 5 percent of employment, the interpre-tation depends greatly on whether comparable firms grow by 3 percent or shrink by 10 percent. Third, these studies do not distinguish cleanly between changes at firms backed by venture capital and firms backed by other forms of private equity. Both are interesting, but the controversy involves buyouts, not venture capital. Fourth, these studies face major challenges in measuring organic job growth because they lack establishment-level data. As a result, it is hard to disentangle organic changes from the acquisition and sale of particular facilities and business units. Fifth, the lack of establishment-level data also precludes a breakdown of firm-level employ-ment changes into job creation and job destruction components, i.e., gains and losses at the establishment level. As we show, private equity buyouts have quite different effects on these two margins of employment change.2
In this study, we construct and analyze a dataset that overcomes these limita-tions and, at the same time, encompasses a much larger set of private equity buy-outs and controls. We rely on the Longitudinal Business Database (LBD) at the US Census Bureau to track employment and earnings before and after buyouts at firms and establishments—i.e., specific factories, offices, retail outlets, and other distinct physical locations where business takes place. The LBD covers the entire nonfarm private sector and contains annual data for about five million firms and six million establishments. To obtain high-quality productivity measures, we turn to the Annual Survey of Manufactures (ASM) and the Census of Manufactures (CM). In addition to their other strengths, the establishment-level information in the LBD, ASM, and CM enables us to explore important aspects of within-firm restructuring activity in the wake of private equity buyouts.
We combine the LBD, ASM, and CM with data from CapitalIQ and other sources to identify and characterize private equity transactions. The resulting matched sam-ple contains about 3,200 US firms acquired in buyouts from 1980 to 2005 (“target firms”) and 150,000 US establishments operated by these firms as of the buyout year (“target establishments”). We match each target firm to other firms that are comparable in terms of industry, age, size, and single/multi-establishment status, and then follow targets and matched controls over time. We take a similar approach to controls for target establishments.
2 See Service Employees International Union (2007) and Hall (2007) for other critiques. We discuss the broader academic literature on the economic effects of private equity in Section I. Few academic studies of private equity focus on employment outcomes, and the main exceptions consider data for France and the United Kingdom. To our knowledge, no previous studies exploit linked firm-level and establishment-level data to examine the within-firm reallocation effects of private equity buyouts and their relationship to productivity gains at target firms.
06_A20111124_10412.indd 3957 11/10/14 3:24 PM
3958 THE AMERICAN ECONOMIC REVIEW dECEMbER 2014
To clarify the scope of our study, we consider later-stage changes in owner-ship and control executed and partly financed by private equity firms. In these transactions, the (lead) private equity firm acquires a controlling stake in the target firm and retains a significant oversight role until it “exits” by selling its stake. The buyout event typically involves a shift toward greater leverage in the capital struc-ture of the target firm and, sometimes, a change in its management. We exclude management-led buyouts that do not involve an acquisition by a private equity firm. We also exclude startup firms backed by venture capitalists.
Our establishment-level analysis yields three main findings: First, employment shrinks more rapidly, on average, at target establishments than at controls after private equity buyouts. The average cumulative difference in favor of controls is about 3 percent of initial employment over two years and 6 percent over five years. Second, the larger post-buyout employment losses at target establishments entirely reflect higher rates of job destruction at shrinking and exiting establishments. In fact, targets exhibit greater post-buyout creation of new jobs at expanding establish-ments. Adding controls for pre-buyout growth history shrinks the estimated employ-ment responses to private equity buyouts but does not change the overall pattern. Third, earnings per worker at continuing target establishments fall by an average of 2.4 percent relative to controls over two years post buyout.
The establishment-level analysis misses job creation at newly opened establish-ments, whether by target or control firms. To capture this activity, we move to a firm-level analysis and identify new establishments opened post buyout. The com-bination of firm and establishment data in the LBD is what enables us to isolate and quantify “greenfield” job creation at facilities opened post buyout. For this part of our analysis, we shorten the time window to two years post buyout. Lengthening the window involves a greater incidence and complexity of ownership changes, threatening the integrity of our firm-level longitudinal linkages or forcing us to narrow the sample. We find that target firms engage in more greenfield job cre-ation than control firms, with a cumulative two-year difference of nearly 2 per-cent of initial employment. That is, greater greenfield job creation partly offsets the relative employment drop at target establishments. Our firm-level analysis also yields another interesting result: Private equity targets engage in more acquisi-tions and more divestitures than controls. Summing over job creation and destruc-tion at continuing establishments, job losses at shuttered establishments, job gains at greenfield establishments, and contributions of acquisitions and divestitures, employment shrinks by less than 1 percent at target firms relative to controls in the first two years after private equity buyouts.
We uncover a much larger response in the pace of job reallocation. Specifically, over the first two years post buyout, establishment-level job gains and losses at tar-get firms exceed gains and losses at controls by 14 percent of initial employment. This extra job creation and destruction activity amounts to 25 percent of base-line job reallocation at control firms. A more rapid pace of organic job creation and destruction accounts for 45 percent of the extra reallocation activity at target firms, and greater acquisitions and divestitures account for the rest. These results indicate that private equity buyouts catalyze the creative destruction process, as measured by job creation and destruction and by the transfer of production units between firms.
06_A20111124_10412.indd 3958 11/10/14 3:24 PM
3959Davis et al.: Private equity, Jobs, anD ProDuctivityvol. 104 no. 12
Our productivity findings reinforce this view. Specifically, compared to control firms, target firms more aggressively close manufacturing plants in the lower part of the total factor productivity (TFP) distribution. They also open new plants in the upper part of the TFP distribution at nearly twice the rate of control firms, and they are much less likely to open low productivity establishments. On average, over the first two years post buyout, we estimate that private equity buyouts raise TFP by 2.1 log points. (Baseline TFP growth for controls is slightly negative.) Three quarters of the post-buyout TFP gains reaped by target firms reflect a greater propensity to close low productivity plants and to open new, high productivity plants. In short, buyouts improve productivity mainly through the directed reallocation of resources across units within target firms. These TFP results and our results on worker earnings imply that private equity buyouts materially improve operating margins at target firms.
The next section briefly reviews related research and offers additional motiva-tion for our study. Section II describes the construction of our analysis datasets, and Section III explains our empirical methods. Sections IV and V present our main establishment-level and firm-level analyses of employment and job reallo-cation effects. Section VI considers effects on TFP and earnings per worker, and Section VII offers concluding remarks.
I. Related Work and Additional Motivation
Economists hold a longstanding interest in how ownership changes affect produc-tivity and employment. Examples include Siegel and Lichtenberg (1987); Long and Ravenscraft (1993); McGuckin and Nguyen (2001); and Harris, Siegel, and Wright (2005). One ownership change that attracts particular attention is the acquisition of firms by professional private equity firms. Jensen (1989) and Shleifer and Summers (1988), among others, discuss the economic effects of private equity buyouts based largely on case study evidence. Kaplan and Strömberg (2009) provide a useful over-view of research on the economic effects of private equity.
Few previous studies focus on the employment effects of private equity, and the exceptions typically rely on small samples dictated by data availability. Kaplan (1989a) considers 76 public-to-private leveraged buyouts (LBOs) during the 1980s. He finds that the median firm lost 12 percent of employment on an industry-adjusted basis from the end of the fiscal year prior to the private equity transaction to the end of the fiscal year after the transaction. After dropping target firms with asset sales or purchases that exceed 10 percent of total value, the adjusted employment decline is 6.2 percent for the remaining 24 firms. Muscarella and Vetsuypens (1990) consider 72 firms that completed an initial public offering (IPO) after an LBO between 1983 and 1987. For the 26 firms they can track, employment declines by an average of 0.6 percent between the LBO and the IPO.
Lichtenberg (1990) uses US Census Bureau data to examine changes in employ-ment at the manufacturing plants of 131 firms undergoing buyouts between 1981 and 1986. On an industry-adjusted basis, employment falls by 1.2 percent per year after buyout, as compared to a 1.9 percent rate of decline beforehand. Declines are larger for nonproduction workers than blue-collar workers. Wright, Thompson, and Robbie (1992) and Amess and Wright (2007) similarly find that buyouts in the UK lead to modest employment declines. These studies follow overall employment at a
06_A20111124_10412.indd 3959 11/10/14 3:24 PM
3960 THE AMERICAN ECONOMIC REVIEW dECEMbER 2014
set of firms, and contrast it with aggregate employment at matching firms.3 Boucly, Sraer, and Thesmar (2011) find that employment grows much more rapidly at target firms than at controls in the wake of French private equity buyouts, a result they attribute to an important role for private equity in relaxing financing constraints.
These studies share certain weaknesses. First, most focus on the company-wide employment of firms backed by private equity. Thus, the sale of a division or other business unit is typically counted as an employment loss, even if the sold business unit continues with the same number of employees under new ownership. Likewise, the acquisition of a division or other business unit is counted as an employment gain, even if there is no employment change at the business unit itself. Several stud-ies attempt to address this issue by dropping buyouts that involve substantial asset sales, but this sample restriction may greatly influence the results, given the extent of “asset shuffling” by firms backed by private equity. The handful of previous US studies that treat establishments as the unit of observation are typically restricted to the manufacturing sector, and even then have limited ability to track establishment or firm closings.
Second, previous studies of US private equity deals rely on highly selected sam-ples—potentially an important source of bias in the findings. The public-to-private buyouts that dominate earlier samples account for less than one-quarter of the employees directly impacted by private equity buyouts and only 12 percent of the deals (Table 2). Most previous US studies consider deals before the 1990s only, but fundraising by US private equity groups rose 36-fold from 1985 to 1998 and more than 100-fold by 2006.4 The tremendous growth in private equity activity allows us to examine a much larger set of deals. Moreover, the nature of private equity activity has also changed over time—competition for attractive deals has intensified, and many private equity firms now have a strong operational orientation, as opposed to the financial engineering approach that characterized many groups during the 1980s.
Our study overcomes these weaknesses, as we have explained. In addition, we exploit the establishment-level aspect of our data to examine job creation and job destruction outcomes, as well as net employment changes. In this regard, we are moti-vated in part by previous work that documents a rapid pace of establishment-level job creation and destruction. Davis and Haltiwanger (1999) review work in this area. Earlier empirical work also shows that the reallocation of jobs and workers across establishments plays a major role in medium-term productivity gains. Many important theoretical models also feature distinct roles for the creation and destruc-tion margins of employment adjustment. Caballero (2007) provides an insightful, detailed analysis and extensive references to the relevant literature.
Numerous case studies provide detailed descriptions and analyses of particular private equity deals. By our reading, these studies deliver four sets of insights.
First, private equity groups sometimes generate few or no productivity gains because they fail to achieve their goals for target firms. For instance, when Berkshire
3 The samples in these UK studies include management-led deals (management buyouts), which need not involve a financial sponsor that acquires a controlling stake in the target firm. Management-led deals potentially differ substantially from the traditional private equity buyouts that we consider.
4 Using inflation-adjusted dollars and data from Thomson Reuters VentureXpert, https://vx.thomsonib.com/VxComponent/vxhelp/VentureXpert_Fact_Sheet.pdf.
06_A20111124_10412.indd 3960 11/10/14 3:24 PM
3961Davis et al.: Private equity, Jobs, anD ProDuctivityvol. 104 no. 12
Partners bought Wisconsin Central, it had an ambitious plan to raise productivity. However, technological problems arose soon after the buyout and prevented the deployment of a computerized control system that was crucial for planned cost sav-ings. As a result, the numbers in an ambitious business plan were never met (Jensen, Burkhardt, and Barry 1990). In the Revco transaction, a crippling debt load, man-agement disarray, an inexperienced LBO sponsor, and a disastrous midstream shift in strategy led to a failure to achieve performance goals (Wruck 1991).
Second, the Revco case also points to tax savings as the primary source of private value creation in certain buyouts. Consistent with this view, Kaplan (1989b, p. 611) provides evidence that greater leverage and other organizational shifts imposed by private equity investors can yield substantial tax savings that are “an important source of the wealth gains in leveraged buyouts.” If tax savings are the principal motive for buyouts, there is no compelling reason to anticipate positive effects on productivity at target firms.
Third, many case studies find substantial productivity gains at target firms through improvements to existing operations. In the Hertz buyout, for instance, Clayton, Dubilier, and Rice (CDR) addressed operational inefficiencies to increase profitabil-ity. Specifically, CDR lowered overhead costs by reducing inefficient labor expenses and cutting noncapital investments to industry standard levels, and more closely aligned managerial incentives with return on capital (Luehrman 2007). Similarly, the buyout of O.M. Scott and Sons led to substantial improvements in the firm’s existing operations, partly through powerful incentives offered to management and partly through specific suggestions by the private equity investors (Baker and Wruck 1989). In examples like these, profitability increases and private value creation are likely to go hand in hand with productivity gains.
Finally, in a number of other cases, private equity targets achieved substantial effi-ciency improvements not by enhancing existing operations, but rather by divesting units. Beatrice had acquired a large number of unrelated businesses as part of a con-glomerate strategy, many of which operated in segments in which it had little exper-tise. Its private equity investor, Kohlberg, Kravis, and Roberts, divested many of these laggard operations (Baker 1992). Similarly, the buyout group that purchased Kaiser Steel shut down its outdated and inefficient steel operations. The group focused its operational attention on Kaiser’s coal mines, which it regarded as the firm’s “hidden jewel” (Luehrman 1992). Greater profitability and private value creation are also likely to involve productivity gains in these examples, though mainly through productivity-enhancing reallocation rather than operational improvements within continuing units.
These case studies illustrate a wide range of motives for and effects of private equity transactions. Our study can be seen as an effort to determine which of these stories best characterizes the impact of private equity buyouts on average, especially with respect to employment and productivity outcomes.
II. Constructing the Analysis Samples
Our analysis requires a comprehensive database of private equity transactions and the matching of target firms to firm-level and establishment-level records in the LBD, ASM, and CM. This section describes the data construction process and the resulting samples.
06_A20111124_10412.indd 3961 11/10/14 3:24 PM
3962 THE AMERICAN ECONOMIC REVIEW dECEMbER 2014
A. Identifying Private Equity Buyout Transactions
CapitalIQ has specialized in tracking private equity deals on a worldwide basis since 1999 and, through extensive research, backfilled transactions prior to 1999.5 We consider all recorded transactions in CapitalIQ that closed between January 1980 and December 2005. Integrating the CapitalIQ data with firm-level Census data to track outcomes before and after the transactions requires much care, as we discuss below. Our data integration work, a major undertaking, covers a 26-year sample period and yields a much larger, more comprehensive set of buyout targets and controls than previous studies. It would be interesting in future work to extend our sample to consider deals executed in the buyout boom of 2006–2007 and to examine their performance during and after the financial crisis and recession of 2008–2009.
We impose two main sample requirements. First, we omit transactions that do not involve a financial sponsor, i.e., a private equity firm. Second, we restrict atten-tion to transactions that entail some use of leverage. Many transactions that do not involve leverage are venture capital investments rather than investments in mature firms. Given our focus, we omit transactions not classified by CapitalIQ as “going private,” “leveraged buyout,” “management buyout,” “platform,” or a similar term. This approach excludes “growth buyouts” and “expansion capital” investments to purchase a minority stake using little or no leverage. Such transactions may share some characteristics of private equity deals but do not fit the classic profile of lever-aged buyouts.
After restricting the sample in these two ways, the resulting database contains about 11,000 transactions worldwide. Dropping transactions that involve firms with foreign headquarters leaves about 5,000 US target firms acquired in private equity buyouts between 1980 and 2005. (We do not consider US establishments operated by foreign targets.) To fill out our information about private equity deals and tar-get firms, we supplement the data drawn from CapitalIQ with data from Dealogic, Thomson Reuters SDC, VentureXpert databases, and news stories. Dealogic, in par-ticular, often contains greater detail about transaction characteristics. Other use-ful information in the supplementary sources includes alternative names associated with target firms and their later acquisitions and sales. Tables 1 and 2 below report summary statistics on enterprise values, which are available for about half the buy-out deals, but we do not use the value data in our main analyses.
B. Matching to LBD Records
The LBD derives from the Census Bureau’s Business Register, which contains annual data on US businesses with paid employees. The LBD covers the entire nonfarm private sector and contains, in more recent years, over six million establish-ment records and almost five million firm records per year. We use LBD data from 1976 to 2005. The Business Register and the LBD draw on administrative records
5 Most data services tracking private equity transactions were not established until the late 1990s. The most comprehensive exception, SDC VentureXpert, mainly focused on capturing venture capital transactions until the mid-1990s. See Strömberg (2007) for a discussion of the completeness of the CapitalIQ database.
06_A20111124_10412.indd 3962 11/10/14 3:24 PM
3963Davis et al.: Private equity, Jobs, anD ProDuctivityvol. 104 no. 12
and survey sources for data on firms and their establishments. Core data items include employment, payroll, four-digit Standard Industrial Classification (SIC) or six-digit North American Industrial Classification (NAICS), employer identification numbers, business names, and information about location.6 Identifiers in the LBD files enable us to compute growth rate measures for establishments and firms and to track their entry and exit and ownership changes. Firms in the LBD are defined
6 Sales data in the Business Register are available annually from 1994 and once every five years in earlier years.
Table 1—Value of Private Equity Buyout Targets, Total and Matched by Decade ($millions)
1980–1989 1990–1999 2000–2005
Matched 138,111 212,387 363,395Total 199,166 280,746 529,595
Note: Enterprise values (debt plus equity) as of the transaction are imputed for about half the buyout targets based on deal type, industry, and transaction year, as detailed in online Appendix A.
Table 2—Private Equity Buyouts in the Analysis Samples
Number of transactions(target firms)
Value of transactions, millions of
2005 dollars
Target establishments,transaction year
Target employment,
transaction year
All, 1980–2005 3,218 713,892 151,529 5,828,532 Private to private 1,350 149,509 59,865 2,224,530 Public to private 390 272,599 36,717 1,371,129 Divisional sales 918 158,580 35,259 1,359,139 Secondary sales 396 108,324 13,455 637,591 Other 164 24,880 6,233 236,143
All, 1980–2003 2,265 530,786 103,671 4,323,558 Excluding EIN cases 1,874 465,657 79,131 3,410,598 Two-year continuers, excluding EIN cases
1,374 333,519 76,271 3,187,171
Private to private 686 91,247 37,283 1,470,447 Public to private 248 133,727 20,380 872,206 Divisional sales 206 45,683 7,922 391,705 Secondary sales 160 47,627 7,957 353,325 Other 74 15,235 2,729 99,488
All, 1980–2000 1,306 395,020 54,729 2,385,163 Private to private 647 99,973 24,593 901,284 Public to private 171 173,500 18,454 854,779 Divisional sales 342 74,487 6,557 416,055 Secondary sales 107 35,742 3,885 161,557 Other 39 11,318 1,240 51,488
Mfg., 1980–2003 539 138,006 9,174 805,328 Multi-unit firms only 427 126,572 9,062 792,864 Multi-unit with TFP 286 82,076 2,053 496,699
Notes: We exclude single-unit matched targets from our analysis of the manufacturing sector. They account for only 112 of 9,744 target manufacturing establishments and less than 1.5 percent of target manufacturing employment.The last row in the table reports data for matched multi-unit targets for which we can obtain data on total factor pro-ductivity in the transaction year from the Census of Manufactures or the Annual Survey of Manufactures.
06_A20111124_10412.indd 3963 11/10/14 3:24 PM
3964 THE AMERICAN ECONOMIC REVIEW dECEMbER 2014
based on operational control, and all establishments majority owned by a parent firm are included in the parent’s activity measures.
To merge data on buyouts into the LBD, we match names and addresses of private equity portfolio firms (i.e., target firms) to LBD name and address records. To cope with timing differences between datasets, we search over a three-year window in the LBD centered on the transaction year for each target firm. We adopt a conserva-tive approach to matching that requires either an exact match on name and address or an approximate match on both name and address according to probability-based matching algorithms. Our procedures match about 65 percent of target firms to the LBD, 71 percent on a value-weighted basis, yielding about 3200 matched target firms.7 Once matched, firm-establishment links in the LBD serve to identify all establishments owned by target firms as of the private equity buyout year. Matched target firms operate about 150,000 US establishments as of the buyout year. LBD longitudinal links allows us to follow firms and establishments over time. Tracking firms is more challenging, as we discuss below, which influences the design of our firm-level analysis sample.
Given our interest in employment dynamics, the relationship of the LBD employ-ment measure to the timing of private equity transactions requires careful treatment. The LBD reports total employment in the payroll period containing the week of March 12th. Accordingly, for buyout transactions that close before October 1, LBD employment in March of the same calendar year serves as our contemporaneous employment measure. We assign transactions that close on or after October 1 in year t to year t + 1 for purposes of our analysis, treating the LBD employment value in March of t + 1 as the contemporaneous measure. October is the natural cutoff because it lies midway between March-to-March employment changes in the LBD.
Figure 1 shows the number of US target firms acquired by year and the number matched to the LBD. It is apparent that the number of private equity buyouts grew rapidly beginning in the mid-1990s. Table 1 reports the enterprise value of private equity targets and matched targets by decade. The enterprise value of acquisitions is very large in the later years, reaching 530 billion in the 2000–2005 period. Figure 2 displays employment data for our matched target firms. For example, target firms acquired in 2005 and matched to the LBD account for 0.83 percent of total non-farm business employment in 2005. Given the extent of unmatched targets, the full set of firms that came under private equity control in 2005 accounts for more than 1 percent of private sector employment. Based on our data, we infer that more than 7 percent of private employment came under private equity control at some point in the ten-year period from 1998 to 2007.8
According to Figure 1, match rates vary slightly over time: 65 percent in the 1980s, 70 percent in 1990s, and 63 (65) percent from 2000 to 2005 (2003). To explore rep-resentativeness of our sample, we compare the characteristics of matched buyouts
7 Puri and Zarutskie (2012) obtain somewhat higher match rates to the LBD for firms involved in venture capital (VC) deals, even though their matching methods are similar to ours. Matching is easier for VC deals than buyout deals, because buyouts usually involve larger, more complex organizations and deals, and they often involve the sale of divisions rather than whole firms.
8 We arrive at this inference by summing the employment percentages of matched targets from 1998 to 2005, dividing the sum by 0.7 to account for unmatched targets, and making the assumption (supported by other data sources) that private equity activity continued at record levels in 2006 and the first half of 2007.
06_A20111124_10412.indd 3964 11/10/14 3:24 PM

3965Davis et al.: Private equity, Jobs, anD ProDuctivityvol. 104 no. 12
to all buyouts along several dimensions. Tables A.1 to A.3 in the online Appendix show that, in each decade, matched buyouts and all buyouts are similar with respect to industry, deal type, and average enterprise value. These results suggest that our sample of matched buyouts is representative of all buyouts.
C. Analysis Samples
Our study considers several related analysis samples. For descriptive statistics on the number and volume of private equity buyouts and their distribution by industry and firm characteristics, we consider all matched targets through 2005. For our main establishment-level analysis, we consider buyouts from 1980 to 2000. This sample allows us to track target (and control) establishments for five years before and after the buyout year. For our firm-level analysis sample, we consider buyouts from 1980 to 2003, so that we can track firm-level outcomes for two years post buyout. We also consider various subsamples, the most important of which focuses on buyouts in
0
100
200
300
400
500
600
700
800
900
1980
19
81
1982
19
83
1984
19
85
1986
19
87
1988
19
89
1990
19
91
1992
19
93
1994
19
95
1996
19
97
1998
19
99
2000
20
01
2002
20
03
2004
20
05
All targets
Matched targets
Figure 1. Number of Target Firms in US Private Equity Buyouts, 1980 to 2005
0
200
400
600
800
1,000
1,200
0
0.1
0.2
0.3
0.4
0.5
0.6
0.7
0.8
0.9
Percent of LBD employment
Target employment in thousands, right axis
1980
19
81
1982
19
83
1984
19
85
1986
19
87
1988
19
89
1990
19
91
1992
19
93
1994
19
95
1996
19
97
1998
19
99
2000
20
01
2002
20
03
2004
20
05
Figure 2. Employment at Matched Targets as of the Buyout Year, 1980 to 2005
06_A20111124_10412.indd 3965 11/10/14 3:24 PM
3966 THE AMERICAN ECONOMIC REVIEW dECEMbER 2014
the manufacturing sector from 1980 to 2003. For the manufacturing subsample, we draw on ASM and CM data to construct plant-level TFP measures. Table 2 reports summary statistics on matched targets for our analysis samples.
III. Empirical Methods
This section describes key methodological choices in our empirical study. The first relates to the unit of analysis. Section IV considers establishments owned by target firms in the buyout year. We track these units over time, irrespective of their ownership in earlier or later years. For example, if the target firm goes public or sells an establishment, we continue to track that establishment and associate it with the buyout event. Section V takes a different approach, treating the firm as the unit of analysis, which lets us capture greenfield job creation and the acquisition and sale of establishments after the buyout event.
The second key choice relates to controls. We need suitable controls because the distribution of private equity buyouts across industries and business characteristics is not random. For example, practitioner accounts often suggest a concentration of transactions in industries undergoing significant restructurings due to regula-tory action, foreign competition, or technological change. Target firms in our data are disproportionately concentrated in manufacturing, information services, and accommodation and food services, as shown in Figure B.1 of the online Appendix. Target firms are also considerably larger and older than the average firm, as shown in online Appendix Figure B.2.9 The literature on firm dynamics concludes that growth and volatility vary systematically with firm size and age. See, for example, Caves (1998); Davis et al. (2007); and Haltiwanger, Jarmin, and Miranda (2013). Thus, it is important to control for these characteristics when evaluating the reallocation and other effects of private equity buyouts.
The huge number of firms and establishments in the LBD allows us to control for a full set of interactions among industry, size, age, multi-unit status, and year of the buyout transaction. We sort target firms into cells defined by the cross prod-uct of these characteristics.10 We then identify all firms in the LBD not backed by private equity that fall into the same cell as a given target firm, and we treat those firms as controls. Specifically, we control for the interaction of 72 two-digit indus-tries, 10 firm size categories, 6 firm age categories, a dummy for firms with multiple establishments, and 24 distinct transaction years. The cross product of these cat-egorical variables yields over 8,000 control cells per year. Of course, many cells are unpopulated, but the richness of our controls is evident. In our regression analysis, we also control for pre-buyout employment growth histories. We follow the same approach in the establishment-level analysis. To obtain controls for a given target establishment, we select all establishments in the same control cell from among the set of active establishments in the transaction year, excluding establishments owned by a firm under private equity control.
9 Firms with 500 or more employees account for 96 percent of employment at matched targets, as compared to 51 percent of all LBD employment in the 1980–2005 period. Firms 10 years or older account for 91 percent of employment at matched targets as compared to 64 percent in the LBD.
10 We define industry for multi-unit firms based on the modal industry of their establishments, computed on an employment-weighted basis.
06_A20111124_10412.indd 3966 11/10/14 3:24 PM
3967Davis et al.: Private equity, Jobs, anD ProDuctivityvol. 104 no. 12
A related choice involves our statistical approach to estimating the effects of buyouts on employment outcomes. We consider nonparametric comparisons that control for the cross-product of our categorical variables, semi-parametric regres-sions that include additional controls, and propensity score methods. Ideally, we seek to estimate the average treatment effect on the treated, i.e., the average effect of buyouts on target firms. As discussed in Woolridge (2002, ch. 18), consistent estimation of average treatment effects requires conditional mean independence: conditional on the controls and the treatment indicator, outcomes for the treated and nontreated are independently distributed. Compared to previous research, our rich set of controls lends greater plausibility to this identifying assumption. Even if one questions the conditional mean independence assumption, our study yields a rich set of new findings about outcomes at private equity targets. These findings throw light on alternative views about the economic role of private equity, as we discuss below. Our findings also provide useful evidence for formulating and evaluating theoretical models of private equity behavior and effects.
A fourth choice relates to the time window around private equity transactions. Our establishment-level analysis considers employment outcomes for five years on either side of a private equity transaction. Five years is a typical holding period for target firms (Strömberg 2007). For our firm-level analysis, we must confront the reorganization of firms through mergers, ownership changes, partial divesti-tures, and acquisitions of establishments from other firms. Because it tracks both firms and establishments over time and contemporaneously links establishments to firms, the LBD offers greater scope for identifying these changes than most other business-level datasets. Nevertheless, some private equity targets undergo complex post-buyout restructurings that challenge the maintenance of high-integrity longi-tudinal links. We deal with this challenge in two ways. First, our firm-level analy-sis considers a relatively short window of two years after each buyout transaction, thereby limiting the linkage issues that arise from complex firm-level reorganiza-tions. Second, we use our establishment-level data to assess the impact of potential sample selection bias in our firm-level analysis.
Before proceeding, we define our employment and growth rate measures. Let E it be employment at establishment or firm i in year t; i.e., the number of workers on the payroll in the pay period covering March 12. The employment growth rate is g it = ( E it − E it−1 )/ X it , where X it = 0.5 × ( E it − E it−1 ).11 Employment growth at any higher level of aggregation is the weighted mean of establishment or firm growth rates given by g t = ∑ i
( X it / X t ) g it , where X t = ∑ i
X it . We consider the contributions
of expanding and shrinking establishments, establishment entry and exit, and acqui-sitions and divestitures to firm-level employment changes, and compare outcomes between targets and controls on each of these adjustment margins.
11 This growth rate measure has become standard in analyses of establishment and firm dynamics, because it shares some useful properties of log differences while also accommodating entry and exit. See Davis, Haltiwanger, and Schuh (1996) and Törnqvist, Vartia, and Vartia (1985) for discussions.
06_A20111124_10412.indd 3967 11/10/14 3:24 PM
3968 THE AMERICAN ECONOMIC REVIEW dECEMbER 2014
IV. Establishment-Level Analysis of Employment Outcomes
A. Nonparametric Comparisons
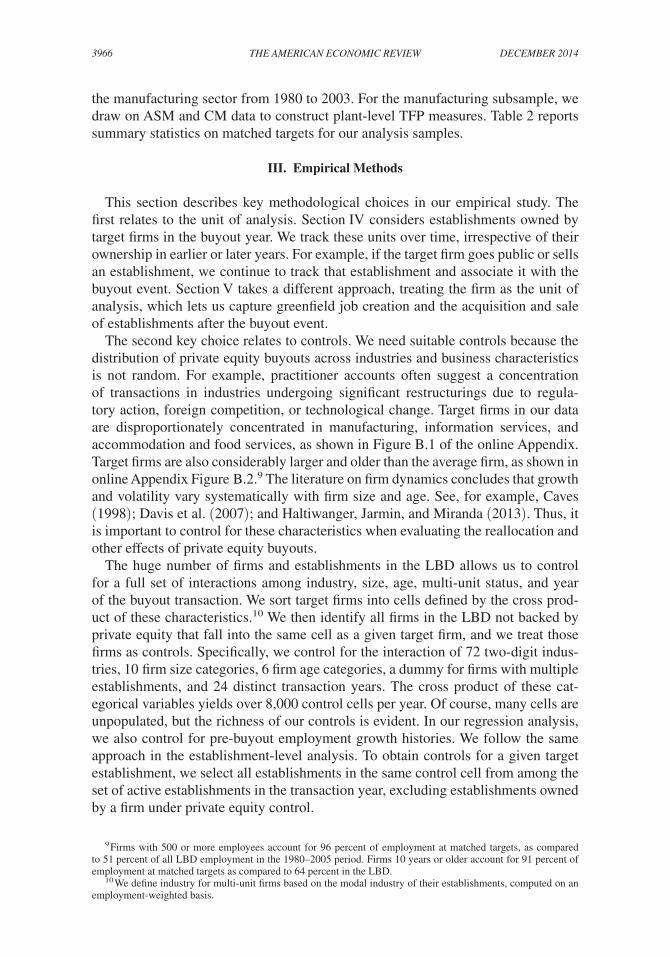
We begin with an “event study” that compares employment outcomes at target establishments to outcomes at control establishments. To encompass a window of five years before and after buyouts, we consider transactions in the 1980–2000 period. As discussed above, we construct control cells as the cross product of industry, size of parent firm, age of parent firm, multi-unit status, and buyout year. Our firm size categories are 1–4, 5–9, 10–19, 20–49, 50–99, 100–249, 250–499, 500–999, 1,000–2,499, 2,500–4,999, 5,000–9,999, and 10,000 or more employees. Our firm age categories are 0–5 years, 6–10, 11–15, 16–20, and 21 or more years.12 We use firm size and age measures to facilitate comparisons to our firm-level analy-sis below. Replacing firm size and age measures with measures based on establish-ment size and age yields similar results.
The solid curve in Figure 3A shows the employment path of target establishments around the buyout year. Establishments that came under private equity ownership between 1980 and 2000 employed 2.3 million workers as of the buyout year. The dashed curve shows the counterfactual path of employment at targets had they grown at the same rate as controls. To construct this counterfactual, we first rescale the employment of controls to match that of targets cell by cell in the buyout year. We then apply the actual growth rates of the controls to generate the dashed curve.13 Comparing the solid and dashed curves highlights the critical need to evaluate tar-get outcomes relative to controls. In particular, a simple comparison of outcomes at target firms before and after buyout events would produce a highly misleading impression about the employment effects of private equity.
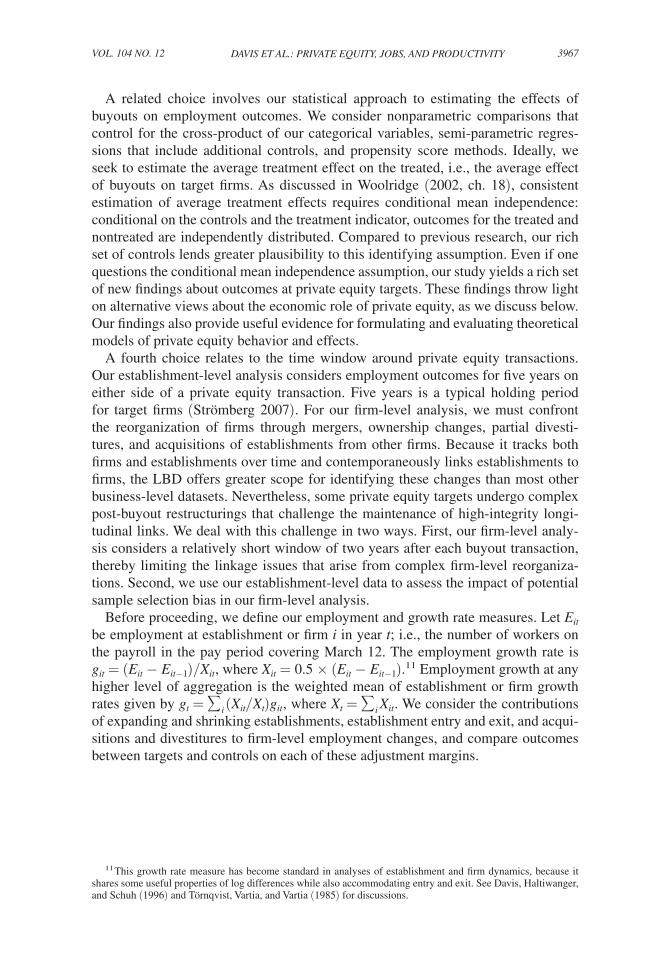
Figure 3B tracks mean employment growth rate differences between target and control establishments from 5 years before to 5 years after the buyout year. Perhaps surprisingly, Figure 3B shows no systematic pattern of slower job growth at targets in the years leading up to buyouts. In the buyout year itself, employment growth at targets is actually 2 percentage points higher than at controls. However, there is a clear pattern of slower growth at targets post buyout, with growth differentials rang-ing from 0.5 percent to 2 percent per year. The differentials cumulate to 3.2 percent of employment in the first two years post buyout and 6.4 percent over five years. These results accommodate heterogeneous treatment effects over the cross product of industry, firm size, firm age, multi-unit status, and year of buyout. They recover the average treatment effect on the treated under the assumption of conditional mean independence, as we discussed above.14
12 Following Davis et al. (2009), when a firm first appears in the LBD, we assign it the age of its oldest establish-ment. We then increment the firm’s age by one year for each year it continues as a legal entity in the LBD. In this way, we avoid arbitrary increases or decreases in firm age due to the sale and purchase of establishments.
13 To be precise, we calculate the weighted mean growth rate over cells using the weights defined at the end of Section III. The cell-level weights evolve over time in line with the growth experiences of targets (solid curve) and controls (dashed curve). For cells with multiple controls, each control receives equal weight.
14 To be sure, consistent estimation of treatment effects also rests on the stable unit treatment value assump-tion (SUTVA): applying the treatment to one unit has no effect on outcomes at other units. This assumption fails if, for example, treatment effects on targets systematically alter equilibrium output and employment at controls. Given that controls greatly outnumber targets in our setting, equilibrium effects of this sort are unlikely to mat-ter much. Moreover, the productivity effects we estimate below work to offset any output changes implied by
06_A20111124_10412.indd 3968 11/10/14 3:24 PM
3969Davis et al.: Private equity, Jobs, anD ProDuctivityvol. 104 no. 12
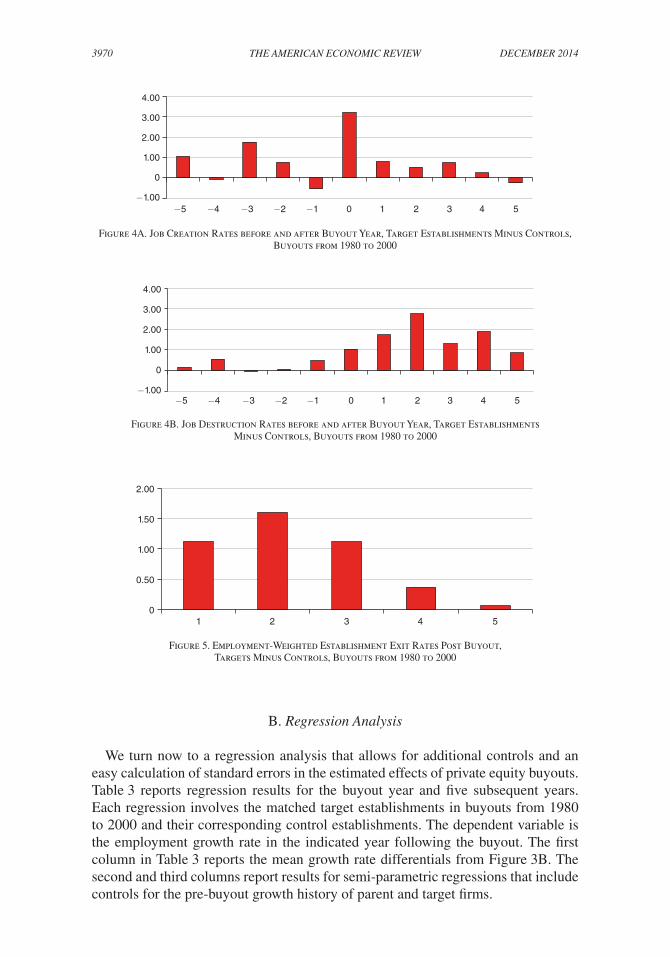
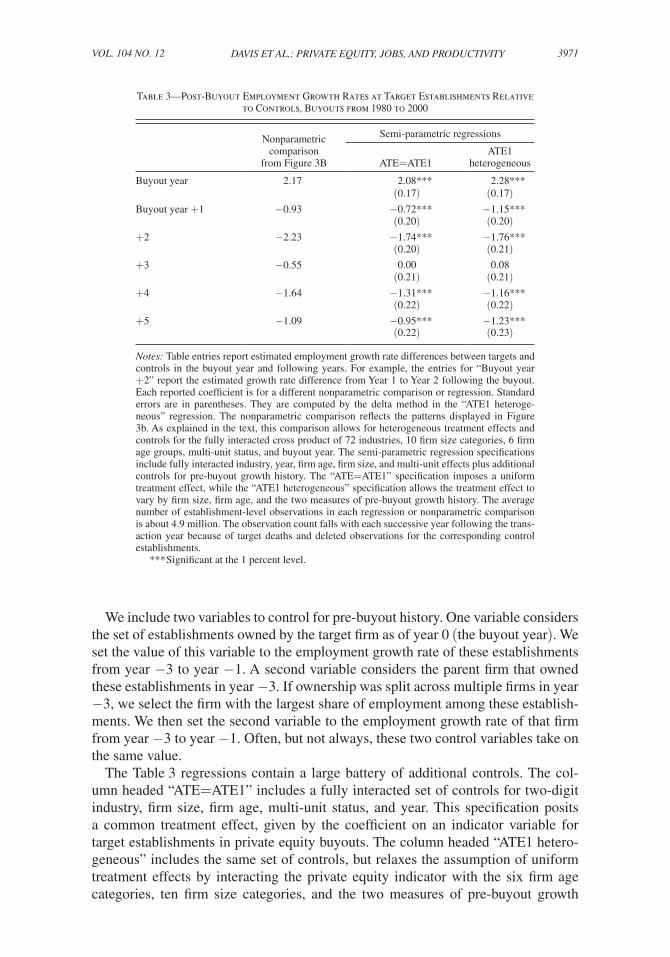
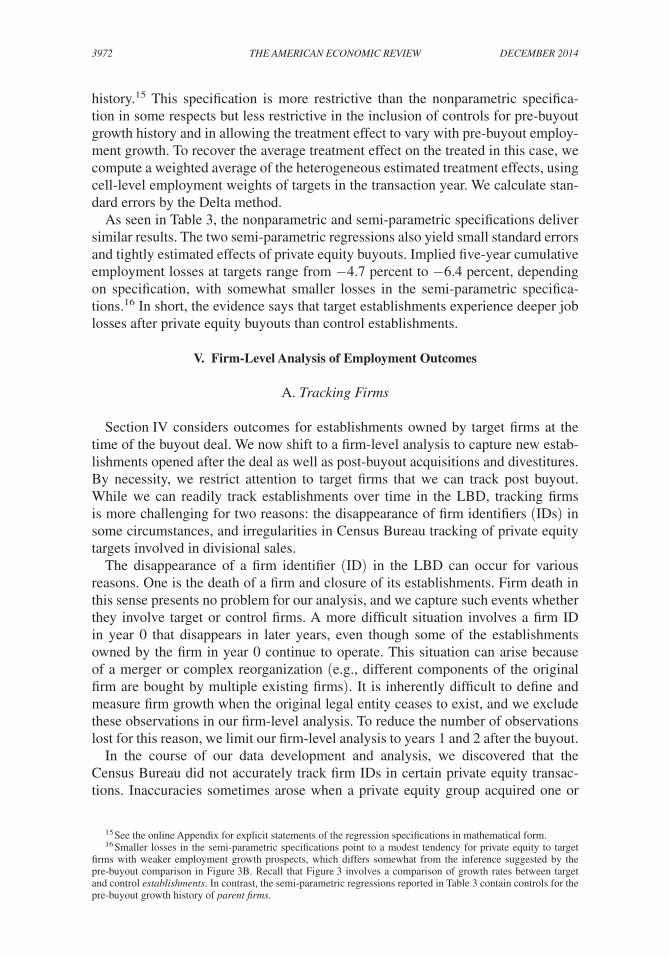
Previous research finds large gross job flows relative to net employment changes (Davis and Haltiwanger 1999), raising the question of how employment responds to private equity buyouts on job creation and destruction margins. Figures 4A and 4B tell an important story in this regard: Slower employment growth at private equity targets post buyout entirely reflects a greater pace of job destruction. Indeed, gross job creation rates are greater at target establishments in the wake of buyouts. These results are interesting for at least two reasons. First, they indicate that buyouts accelerate the pace of employment change on destruction and creation margins, a theme we return to below. Second, Figure 4B confirms that jobs at target establish-ments are at greater risk post buyout than jobs at controls. As seen in Figure 5, about half of this greater risk reflects a higher post-buyout shutdown propensity at target establishments.
the estimated employment effects on target firms, further lessening the scope for equilibrium employment effects on controls.
Figure 3B. Employment Growth Rate Differences Before and After the Buyout Year, Target Establishments Minus Controls, Buyouts from 1980 to 2000
1,600,000
1,800,000
2,000,000
2,200,000
2,400,000
−5 −4 −3 −2 −1 0 1 2 3 4 5
Employment in controls normalized to target level as of year 0, the buyout year
Targets
Controls
Figure 3A. Comparison of Employment Trajectory for Target Establishments to Controls, Buyouts from 1980 to 2000
−3.00
−2.00
−1.00
0
1.00
2.00
3.00
−5 −4 −3 −2 −1 0 1 2 3 4 5
Diff
eren
ce, p
erce
nt o
f em
ploy
men
t
06_A20111124_10412.indd 3969 11/10/14 3:24 PM
3970 THE AMERICAN ECONOMIC REVIEW dECEMbER 2014
B. Regression Analysis
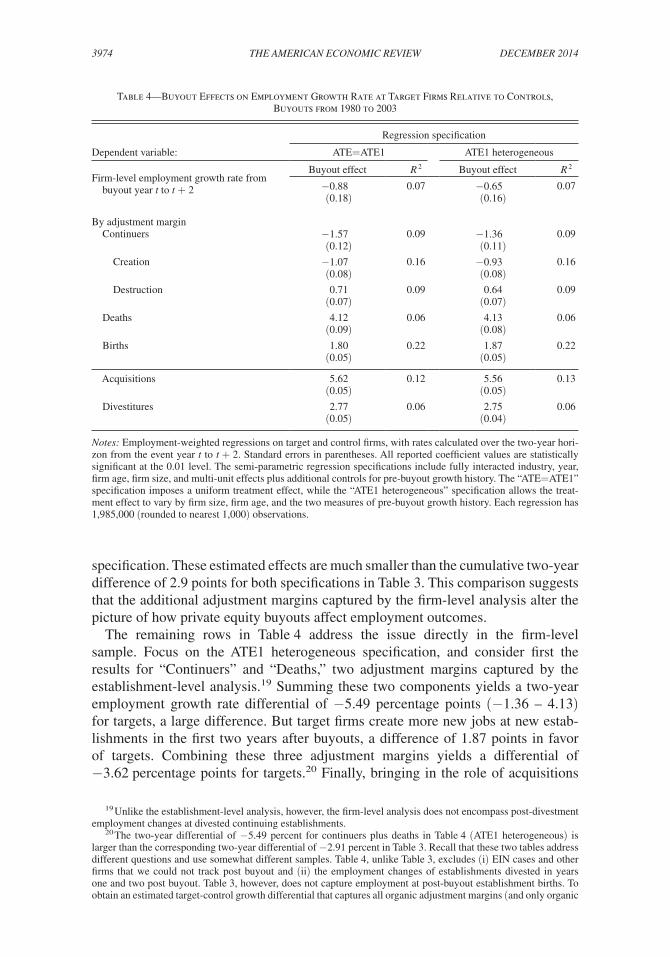
We turn now to a regression analysis that allows for additional controls and an easy calculation of standard errors in the estimated effects of private equity buyouts. Table 3 reports regression results for the buyout year and five subsequent years. Each regression involves the matched target establishments in buyouts from 1980 to 2000 and their corresponding control establishments. The dependent variable is the employment growth rate in the indicated year following the buyout. The first column in Table 3 reports the mean growth rate differentials from Figure 3B. The second and third columns report results for semi-parametric regressions that include controls for the pre-buyout growth history of parent and target firms.
−1.00
0
1.00
2.00
3.00
4.00
−5 −4 −3 −2 −1 0 1 2 3 4 5
Figure 4A. Job Creation Rates before and after Buyout Year, Target Establishments Minus Controls, Buyouts from 1980 to 2000
Figure 4B. Job Destruction Rates before and after Buyout Year, Target Establishments Minus Controls, Buyouts from 1980 to 2000
−1.00
0
1.00
2.00
3.00
4.00
−5 −4 −3 −2 −1 0 1 2 3 4 5
Figure 5. Employment-Weighted Establishment Exit Rates Post Buyout, Targets Minus Controls, Buyouts from 1980 to 2000
0
0.50
1.00
1.50
2.00
1 2 3 4 5
06_A20111124_10412.indd 3970 11/10/14 3:24 PM
3971Davis et al.: Private equity, Jobs, anD ProDuctivityvol. 104 no. 12
We include two variables to control for pre-buyout history. One variable considers the set of establishments owned by the target firm as of year 0 (the buyout year). We set the value of this variable to the employment growth rate of these establishments from year −3 to year −1. A second variable considers the parent firm that owned these establishments in year −3. If ownership was split across multiple firms in year −3, we select the firm with the largest share of employment among these establish-ments. We then set the second variable to the employment growth rate of that firm from year −3 to year −1. Often, but not always, these two control variables take on the same value.
The Table 3 regressions contain a large battery of additional controls. The col-umn headed “ATE=ATE1” includes a fully interacted set of controls for two-digit industry, firm size, firm age, multi-unit status, and year. This specification posits a common treatment effect, given by the coefficient on an indicator variable for target establishments in private equity buyouts. The column headed “ATE1 hetero-geneous” includes the same set of controls, but relaxes the assumption of uniform treatment effects by interacting the private equity indicator with the six firm age categories, ten firm size categories, and the two measures of pre-buyout growth
Table 3—Post-Buyout Employment Growth Rates at Target Establishments Relative to Controls, Buyouts from 1980 to 2000
Nonparametriccomparison
from Figure 3B
Semi-parametric regressions
ATE=ATE1ATE1
heterogeneous
Buyout year 2.17 2.08*** 2.28*** (0.17) (0.17)
Buyout year +1 −0.93 −0.72*** −1.15*** (0.20) (0.20)
+2 −2.23 −1.74*** −1.76*** (0.20) (0.21)
+3 −0.55 0.00 0.08 (0.21) (0.21)
+4 −1.64 −1.31*** −1.16*** (0.22) (0.22)
+5 −1.09 −0.95*** −1.23*** (0.22) (0.23)
Notes: Table entries report estimated employment growth rate differences between targets and controls in the buyout year and following years. For example, the entries for “Buyout year +2” report the estimated growth rate difference from Year 1 to Year 2 following the buyout. Each reported coefficient is for a different nonparametric comparison or regression. Standard errors are in parentheses. They are computed by the delta method in the “ATE1 heteroge-neous” regression. The nonparametric comparison reflects the patterns displayed in Figure 3b. As explained in the text, this comparison allows for heterogeneous treatment effects and controls for the fully interacted cross product of 72 industries, 10 firm size categories, 6 firm age groups, multi-unit status, and buyout year. The semi-parametric regression specifications include fully interacted industry, year, firm age, firm size, and multi-unit effects plus additional controls for pre-buyout growth history. The “ATE=ATE1” specification imposes a uniform treatment effect, while the “ATE1 heterogeneous” specification allows the treatment effect to vary by firm size, firm age, and the two measures of pre-buyout growth history. The average number of establishment-level observations in each regression or nonparametric comparison is about 4.9 million. The observation count falls with each successive year following the trans-action year because of target deaths and deleted observations for the corresponding control establishments.
*** Significant at the 1 percent level.
06_A20111124_10412.indd 3971 11/10/14 3:24 PM
3972 THE AMERICAN ECONOMIC REVIEW dECEMbER 2014
history.15 This specification is more restrictive than the nonparametric specifica-tion in some respects but less restrictive in the inclusion of controls for pre-buyout growth history and in allowing the treatment effect to vary with pre-buyout employ-ment growth. To recover the average treatment effect on the treated in this case, we compute a weighted average of the heterogeneous estimated treatment effects, using cell-level employment weights of targets in the transaction year. We calculate stan-dard errors by the Delta method.
As seen in Table 3, the nonparametric and semi-parametric specifications deliver similar results. The two semi-parametric regressions also yield small standard errors and tightly estimated effects of private equity buyouts. Implied five-year cumulative employment losses at targets range from −4.7 percent to −6.4 percent, depending on specification, with somewhat smaller losses in the semi-parametric specifica-tions.16 In short, the evidence says that target establishments experience deeper job losses after private equity buyouts than control establishments.
V. Firm-Level Analysis of Employment Outcomes
A. Tracking Firms
Section IV considers outcomes for establishments owned by target firms at the time of the buyout deal. We now shift to a firm-level analysis to capture new estab-lishments opened after the deal as well as post-buyout acquisitions and divestitures. By necessity, we restrict attention to target firms that we can track post buyout. While we can readily track establishments over time in the LBD, tracking firms is more challenging for two reasons: the disappearance of firm identifiers (IDs) in some circumstances, and irregularities in Census Bureau tracking of private equity targets involved in divisional sales.
The disappearance of a firm identifier (ID) in the LBD can occur for various reasons. One is the death of a firm and closure of its establishments. Firm death in this sense presents no problem for our analysis, and we capture such events whether they involve target or control firms. A more difficult situation involves a firm ID in year 0 that disappears in later years, even though some of the establishments owned by the firm in year 0 continue to operate. This situation can arise because of a merger or complex reorganization (e.g., different components of the original firm are bought by multiple existing firms). It is inherently difficult to define and measure firm growth when the original legal entity ceases to exist, and we exclude these observations in our firm-level analysis. To reduce the number of observations lost for this reason, we limit our firm-level analysis to years 1 and 2 after the buyout.
In the course of our data development and analysis, we discovered that the Census Bureau did not accurately track firm IDs in certain private equity transac-tions. Inaccuracies sometimes arose when a private equity group acquired one or
15 See the online Appendix for explicit statements of the regression specifications in mathematical form.16 Smaller losses in the semi-parametric specifications point to a modest tendency for private equity to target
firms with weaker employment growth prospects, which differs somewhat from the inference suggested by the pre-buyout comparison in Figure 3B. Recall that Figure 3 involves a comparison of growth rates between target and control establishments. In contrast, the semi-parametric regressions reported in Table 3 contain controls for the pre-buyout growth history of parent firms.
06_A20111124_10412.indd 3972 11/10/14 3:24 PM

3973Davis et al.: Private equity, Jobs, anD ProDuctivityvol. 104 no. 12
more divisions of a corporate entity, but not the whole firm. In principle, the Annual Company Organization Survey (sent to all large multi-unit companies) lets Census track these divisional sales. However, we identified divisional sales in which the firm ID of the (new) target firm remained the same as the ID of the selling firm. This problem did not affect the establishment-level analysis in Section IV, because we could rely on an alternative identifier—the Employer Identification Number (EIN)—to accurately identify, as of the transaction year, establishments involved in divisional sales. Unfortunately, EINs are unsuitable for tracking firms because new and acquired establishments may obtain new EINs. We therefore exclude divisional cases from our firm-level analysis for those cases when the LBD does not have an accurate ID for the target firm.17
For the firm-level analysis, we expand the sample period of buyout events to run through 2003. (A firm-level analysis for the period running from 1980 to 2000 yields similar results.) As reported in Table 2, our full matched sample contains 2,265 target firms from 1980 to 2003. They account for about 4.3 million workers and 104,000 establishments as of the buyout year. Excluding the divisional EIN cases that lack accurate firm IDs yields 1,874 target firms with about 3.4 million workers and 79,000 establishments.18 Further restricting attention to firms that we can track for two years after the buyout year, including deaths, yields a sample of 1,374 firms and 3.2 million workers. This sample represents 73 percent of the matched sample with accurate firm IDs and 93 percent of their employment. The latter statistic is more relevant given our focus on employment-weighted outcomes.
B. Firm-Level Employment Results
Our firm-level analysis considers the same type of semi-parametric regression specifications as in Table 3. Now, however, we explore employment responses on several adjustment margins, including the entry of new establishments post buyout. As before, the regressions include the pre-buyout growth variables and the cross product of industry, firm size categories, firm age categories, multi-unit status, and buyout year as controls. We weight observations by employment, as before. To obtain the effect of interest, we rely on indicator variables for target firms.
Table 4 presents firm-level regression results for cumulative responses over the first two years post buyout. Again, we report results for an ATE=ATE1 specification that posits a uniform treatment effect, and for an ATE1 heterogeneous specification that allows treatment effects to vary with pre-buyout history and across firm age and size categories. The top row in Table 4 says that target firms shrink more rapidly than controls in the two-year period after buyouts—by 0.88 percentage points in the ATE=ATE1 specification and 0.65 percentage points in the ATE1 heterogeneous
17 We more fully discuss tracking issues related to divisional sales and our use of EINs in the online Appendix. Online Appendix Table A.4 repeats the Section IV analysis excluding establishments owned by divisional targets with inaccurate IDs, yielding results similar to Table 3 in Section IV, but with somewhat smaller relative employ-ment losses at targets. The similarity of establishment-based results for the full sample and the subsample suggests that our firm-level analysis is not seriously distorted by the inability to accurately track firm IDs for some divisional sales.
18 Although our firm-level analysis sample excludes some transactions covered by the establishment-level analy-sis, extending the sample period through 2003 captures a large number of more recent buyouts, as seen in Figures 1 and 2. As a result, the firm-level analysis sample actually covers more employment.
06_A20111124_10412.indd 3973 11/10/14 3:24 PM
3974 THE AMERICAN ECONOMIC REVIEW dECEMbER 2014
specification. These estimated effects are much smaller than the cumulative two-year difference of 2.9 points for both specifications in Table 3. This comparison suggests that the additional adjustment margins captured by the firm-level analysis alter the picture of how private equity buyouts affect employment outcomes.
The remaining rows in Table 4 address the issue directly in the firm-level sample. Focus on the ATE1 heterogeneous specification, and consider first the results for “Continuers” and “Deaths,” two adjustment margins captured by the establishment-level analysis.19 Summing these two components yields a two-year employment growth rate differential of −5.49 percentage points (−1.36 – 4.13) for targets, a large difference. But target firms create more new jobs at new estab-lishments in the first two years after buyouts, a difference of 1.87 points in favor of targets. Combining these three adjustment margins yields a differential of −3.62 percentage points for targets.20 Finally, bringing in the role of acquisitions
19 Unlike the establishment-level analysis, however, the firm-level analysis does not encompass post-divestment employment changes at divested continuing establishments.
20 The two-year differential of −5.49 percent for continuers plus deaths in Table 4 (ATE1 heterogeneous) is larger than the corresponding two-year differential of −2.91 percent in Table 3. Recall that these two tables address different questions and use somewhat different samples. Table 4, unlike Table 3, excludes (i) EIN cases and other firms that we could not track post buyout and (ii) the employment changes of establishments divested in years one and two post buyout. Table 3, however, does not capture employment at post-buyout establishment births. To obtain an estimated target-control growth differential that captures all organic adjustment margins (and only organic
Table 4—Buyout Effects on Employment Growth Rate at Target Firms Relative to Controls, Buyouts from 1980 to 2003
Dependent variable:
Regression specification
ATE=ATE1 ATE1 heterogeneous
Firm-level employment growth rate from buyout year t to t + 2
Buyout effect R 2 Buyout effect R 2 −0.88(0.18)
0.07 −0.65(0.16)
0.07
By adjustment margin Continuers −1.57
(0.12)0.09 −1.36
(0.11)0.09
Creation −1.07(0.08)
0.16 −0.93(0.08)
0.16
Destruction 0.71(0.07)
0.09 0.64(0.07)
0.09
Deaths 4.12(0.09)
0.06 4.13(0.08)
0.06
Births 1.80(0.05)
0.22 1.87(0.05)
0.22
Acquisitions 5.62(0.05)
0.12 5.56(0.05)
0.13
Divestitures 2.77(0.05)
0.06 2.75(0.04)
0.06
Notes: Employment-weighted regressions on target and control firms, with rates calculated over the two-year hori-zon from the event year t to t + 2. Standard errors in parentheses. All reported coefficient values are statistically significant at the 0.01 level. The semi-parametric regression specifications include fully interacted industry, year, firm age, firm size, and multi-unit effects plus additional controls for pre-buyout growth history. The “ATE=ATE1” specification imposes a uniform treatment effect, while the “ATE1 heterogeneous” specification allows the treat-ment effect to vary by firm size, firm age, and the two measures of pre-buyout growth history. Each regression has 1,985,000 (rounded to nearest 1,000) observations.
06_A20111124_10412.indd 3974 11/10/14 3:24 PM
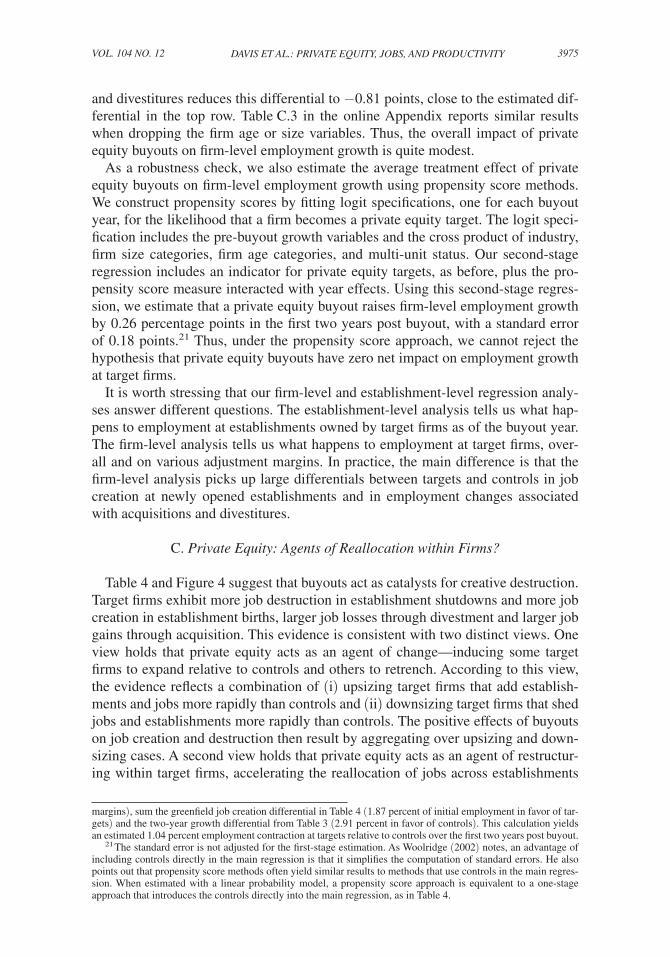
3975Davis et al.: Private equity, Jobs, anD ProDuctivityvol. 104 no. 12
and divestitures reduces this differential to −0.81 points, close to the estimated dif-ferential in the top row. Table C.3 in the online Appendix reports similar results when dropping the firm age or size variables. Thus, the overall impact of private equity buyouts on firm-level employment growth is quite modest.
As a robustness check, we also estimate the average treatment effect of private equity buyouts on firm-level employment growth using propensity score methods. We construct propensity scores by fitting logit specifications, one for each buyout year, for the likelihood that a firm becomes a private equity target. The logit speci-fication includes the pre-buyout growth variables and the cross product of industry, firm size categories, firm age categories, and multi-unit status. Our second-stage regression includes an indicator for private equity targets, as before, plus the pro-pensity score measure interacted with year effects. Using this second-stage regres-sion, we estimate that a private equity buyout raises firm-level employment growth by 0.26 percentage points in the first two years post buyout, with a standard error of 0.18 points.21 Thus, under the propensity score approach, we cannot reject the hypothesis that private equity buyouts have zero net impact on employment growth at target firms.
It is worth stressing that our firm-level and establishment-level regression analy-ses answer different questions. The establishment-level analysis tells us what hap-pens to employment at establishments owned by target firms as of the buyout year. The firm-level analysis tells us what happens to employment at target firms, over-all and on various adjustment margins. In practice, the main difference is that the firm-level analysis picks up large differentials between targets and controls in job creation at newly opened establishments and in employment changes associated with acquisitions and divestitures.
C. Private Equity: Agents of Reallocation within Firms?
Table 4 and Figure 4 suggest that buyouts act as catalysts for creative destruction. Target firms exhibit more job destruction in establishment shutdowns and more job creation in establishment births, larger job losses through divestment and larger job gains through acquisition. This evidence is consistent with two distinct views. One view holds that private equity acts as an agent of change—inducing some target firms to expand relative to controls and others to retrench. According to this view, the evidence reflects a combination of (i) upsizing target firms that add establish-ments and jobs more rapidly than controls and (ii) downsizing target firms that shed jobs and establishments more rapidly than controls. The positive effects of buyouts on job creation and destruction then result by aggregating over upsizing and down-sizing cases. A second view holds that private equity acts as an agent of restructur-ing within target firms, accelerating the reallocation of jobs across establishments
margins), sum the greenfield job creation differential in Table 4 (1.87 percent of initial employment in favor of tar-gets) and the two-year growth differential from Table 3 (2.91 percent in favor of controls). This calculation yields an estimated 1.04 percent employment contraction at targets relative to controls over the first two years post buyout.
21 The standard error is not adjusted for the first-stage estimation. As Woolridge (2002) notes, an advantage of including controls directly in the main regression is that it simplifies the computation of standard errors. He also points out that propensity score methods often yield similar results to methods that use controls in the main regres-sion. When estimated with a linear probability model, a propensity score approach is equivalent to a one-stage approach that introduces the controls directly into the main regression, as in Table 4.
06_A20111124_10412.indd 3975 11/10/14 3:24 PM
3976 THE AMERICAN ECONOMIC REVIEW dECEMbER 2014
in these firms and their pace of acquisition and divestment. These two views are not exclusive because private equity could accelerate both types of creative destruction.
To evaluate these views, we now estimate buyout effects on firm-level realloca-tion measures. A firm’s job reallocation is the sum of its gross job gains due to new, expanding, and acquired establishments and gross job losses due to exiting, shrinking, and divested establishments. Its excess reallocation is the difference between job reallocation and the absolute value of its net job growth.22 If a given firm changes employment in the same direction at all of its establishments, it has zero excess reallocation. To the extent that a firm expands employment at some units and contracts employment at others, it has positive excess reallocation. If the firm adds jobs at some of its establishments and cuts an equal number of jobs at other establishments, excess reallocation equals job reallocation. So, if private equity acts exclusively as agents of change, the entire creative destruction response of target firms involves higher job reallocation but no impact on excess reallocation. At the other extreme, if private equity acts exclusively as agents of restructuring within target firms, firm-level job reallocation and excess reallocation rates respond by the same amount to buyouts.
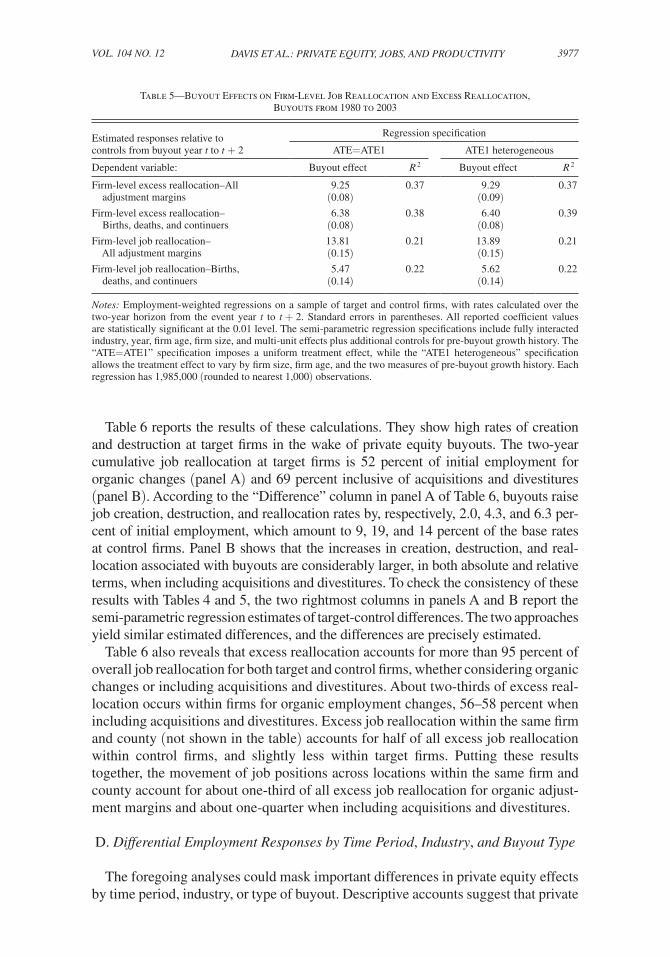
Table 5 reports regression results for firm-level job reallocation and excess real-location rates using the same specifications and two-year horizon as in Table 4. In the ATE1 heterogeneous specification, the job reallocation rate is 13.9 percentage points higher at target firms, and the excess reallocation rate is 9.3 points higher. Thus, two-thirds of the extra job reallocation associated with private equity buyouts reflects an accelerated pace of restructuring within target firms. For organic changes, the impact of buyouts on excess reallocation—6.4 percent of initial employment over two years—is actually greater than the impact on total job reallocation.23 In short, and especially for organic employment changes, Table 5 implies that private equity acts predominantly as an agent of (accelerated) restructuring within target firms.
The regression results in Tables 3, 4, and 5 identify only the differential responses of targets relative to controls. To recover information about the levels of creation and destruction activity, we return to the nonparametric approach of Section IVA and consider a counterfactual exercise along the lines of Figure 3. Specifically, we sort target and control observations in our 1980–2003 firm-level analysis sample into cells defined by the same cross product of industry, size, age, multi-unit status, and buyout year as before. For each cell, we calculate cumulative two-year changes post buyout for each employment adjustment margin. We then generate the weighted average outcomes for targets and controls using the same approach to weighting as in Figure 3. These calculations reveal the extent of creation and destruction activity on each adjustment margin at target firms, and they tell us how target firm activity would differ if targets exhibited the same behavior as controls.
22 This concept of excess reallocation is used often in the literature on gross job flows to quantify job realloca-tion within industries, regions and business categories. See Dunne, Roberts, and Samuelson (1989), Davis and Haltiwanger (1992), and, for a review of the literature, Davis and Haltiwanger (1999). Our approach here applies the same concept to the reallocation of jobs across production units within firms.
23 By definition, overall job reallocation equals or exceeds excess job reallocation for a given firm or group of firms. Our comparison here, however, involves the difference between job reallocation and excess reallocation responses for two distinct sets of firms, targets, and controls.
06_A20111124_10412.indd 3976 11/10/14 3:24 PM
3977Davis et al.: Private equity, Jobs, anD ProDuctivityvol. 104 no. 12
Table 6 reports the results of these calculations. They show high rates of creation and destruction at target firms in the wake of private equity buyouts. The two-year cumulative job reallocation at target firms is 52 percent of initial employment for organic changes (panel A) and 69 percent inclusive of acquisitions and divestitures (panel B). According to the “Difference” column in panel A of Table 6, buyouts raise job creation, destruction, and reallocation rates by, respectively, 2.0, 4.3, and 6.3 per-cent of initial employment, which amount to 9, 19, and 14 percent of the base rates at control firms. Panel B shows that the increases in creation, destruction, and real-location associated with buyouts are considerably larger, in both absolute and relative terms, when including acquisitions and divestitures. To check the consistency of these results with Tables 4 and 5, the two rightmost columns in panels A and B report the semi-parametric regression estimates of target-control differences. The two approaches yield similar estimated differences, and the differences are precisely estimated.
Table 6 also reveals that excess reallocation accounts for more than 95 percent of overall job reallocation for both target and control firms, whether considering organic changes or including acquisitions and divestitures. About two-thirds of excess real-location occurs within firms for organic employment changes, 56–58 percent when including acquisitions and divestitures. Excess job reallocation within the same firm and county (not shown in the table) accounts for half of all excess job reallocation within control firms, and slightly less within target firms. Putting these results together, the movement of job positions across locations within the same firm and county account for about one-third of all excess job reallocation for organic adjust-ment margins and about one-quarter when including acquisitions and divestitures.
D. Differential Employment Responses by Time Period, Industry, and Buyout Type
The foregoing analyses could mask important differences in private equity effects by time period, industry, or type of buyout. Descriptive accounts suggest that private
Table 5—Buyout Effects on Firm-Level Job Reallocation and Excess Reallocation, Buyouts from 1980 to 2003
Estimated responses relative to controls from buyout year t to t + 2
Regression specification
ATE=ATE1 ATE1 heterogeneous
Dependent variable: Buyout effect R 2 Buyout effect R 2 Firm-level excess reallocation–All adjustment margins
9.25 0.37 9.29 0.37(0.08) (0.09)
Firm-level excess reallocation– Births, deaths, and continuers
6.38 0.38 6.40 0.39(0.08) (0.08)
Firm-level job reallocation– All adjustment margins
13.81 0.21 13.89 0.21(0.15) (0.15)
Firm-level job reallocation–Births, deaths, and continuers
5.47 0.22 5.62 0.22(0.14) (0.14)
Notes: Employment-weighted regressions on a sample of target and control firms, with rates calculated over the two-year horizon from the event year t to t + 2. Standard errors in parentheses. All reported coefficient values are statistically significant at the 0.01 level. The semi-parametric regression specifications include fully interacted industry, year, firm age, firm size, and multi-unit effects plus additional controls for pre-buyout growth history. The “ATE=ATE1” specification imposes a uniform treatment effect, while the “ATE1 heterogeneous” specification allows the treatment effect to vary by firm size, firm age, and the two measures of pre-buyout growth history. Each regression has 1,985,000 (rounded to nearest 1,000) observations.
06_A20111124_10412.indd 3977 11/10/14 3:24 PM

3978 THE AMERICAN ECONOMIC REVIEW dECEMbER 2014
equity groups shifted to a more operational orientation over time, which could lead to time-varying effects on target employment. The scale of private buyout activity also increased enormously over time, which could alter the character of the marginal target and its post-buyout performance. Motivated by these observations, Figure C.2 in the online Appendix displays the evolution of target-control growth rate differ-ences for buyouts that took place in the 1980s, 1990–1994, and 1995–2000. In each period, employment contracts more rapidly at targets than at controls in the years following private equity buyouts.
Some accounts of private equity paint a picture of aggressive cost cutting through layoffs. This characterization suggests a potential for greater post-buyout job destruc-tion rates in labor-intensive industries, reflecting a view that cost cutters focus on the largest cost sources. More generally, there are major differences in factor cost shares, market structure, demand conditions, and labor relations that might lead to important industry differences in the responses to private equity buyouts. Motivated by these ideas, online Appendix Figure C.3 displays the evolution of target-control growth differences for three industry sectors that cover most private equity buyouts. Employment falls modestly at target establishments relative to controls post buyout in Manufacturing. Retail Trade exhibits a markedly different response pattern. In the years leading up to buyout transactions, controls and targets in Retail Trade exhibit similar growth rates. Post buyout, however, employment at target establishments falls by nearly 12 percent relative to controls over five years. The Service sector exhibits yet a different pattern. Targets grow more rapidly than controls before the buyout year but more slowly afterwards. These large industry differences serve as a caution against painting with an overly broad brush when characterizing employ-ment outcomes in the wake of private equity buyouts.
Table 6—Cumulative Two-Year Job Reallocation at Target Firms and Controls, Buyouts from 1980 to 2003
Rates expressed as a percent of employment Target firms Control firms Difference
From Tables 4 and 5
Difference Standard error
Panel A. Organic changes, excluding acquisitions and divestituresJob creation 24.96 22.96 2.00 0.94 (0.10) Continuers 11.51 11.74 −0.22 −0.93 (0.07) Births (entrants) 13.44 11.22 2.22 1.87 (0.05)Job destruction 26.89 22.62 4.27 4.69 (0.11) Continuers 13.28 12.65 0.63 0.64 (0.06) Deaths (exits) 13.60 9.96 3.64 4.13 (0.08)Employment growth −1.93 0.34 −2.27 −3.75 (0.16)Job reallocation 51.85 45.58 6.27 5.62 (0.14)Excess reallocation 49.91 45.23 4.68 Within-firm 33.09 27.02 6.06 6.40 (0.08)
Panel B. All adjustment margins, including acquisitions and divestituresJob creation 35.86 28.42 7.44 6.25 (0.11)Job destruction 33.21 26.67 6.53 7.03 (0.13)Employment growth 2.65 1.75 0.90 −0.65 (0.16)Job reallocation 69.07 55.10 13.97 13.89 (0.15)Excess reallocation 66.41 53.35 13.07 Within-firm 38.82 29.82 9.01 9.29 (0.09)
Notes: For Target firms and Control firms, we aggregate over cells using the employment shares of targets. For cells with multiple controls, each control receives equal weight.
06_A20111124_10412.indd 3978 11/10/14 3:24 PM
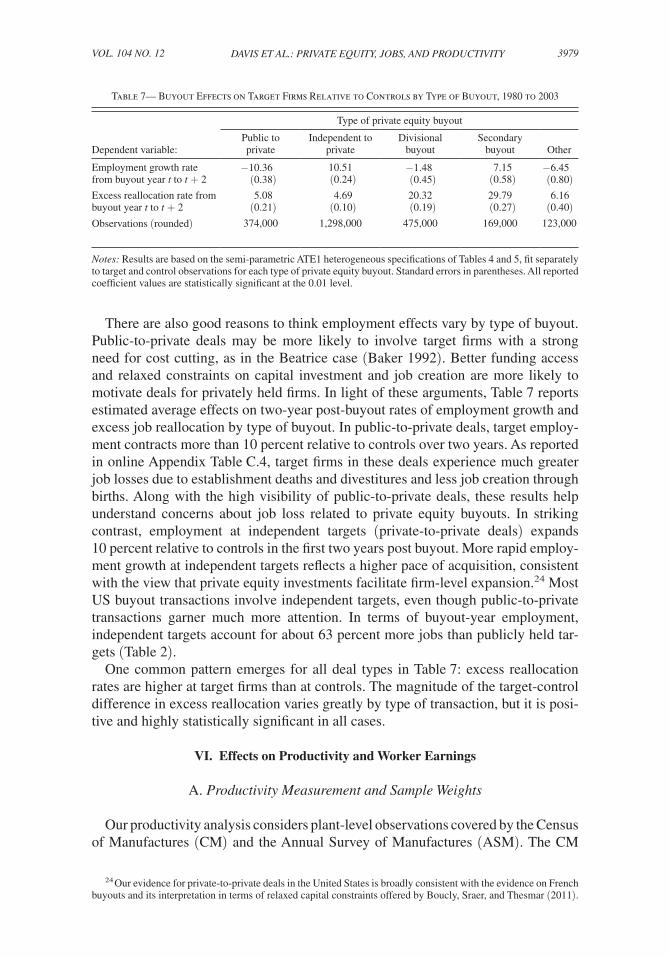
3979Davis et al.: Private equity, Jobs, anD ProDuctivityvol. 104 no. 12
There are also good reasons to think employment effects vary by type of buyout. Public-to-private deals may be more likely to involve target firms with a strong need for cost cutting, as in the Beatrice case (Baker 1992). Better funding access and relaxed constraints on capital investment and job creation are more likely to motivate deals for privately held firms. In light of these arguments, Table 7 reports estimated average effects on two-year post-buyout rates of employment growth and excess job reallocation by type of buyout. In public-to-private deals, target employ-ment contracts more than 10 percent relative to controls over two years. As reported in online Appendix Table C.4, target firms in these deals experience much greater job losses due to establishment deaths and divestitures and less job creation through births. Along with the high visibility of public-to-private deals, these results help understand concerns about job loss related to private equity buyouts. In striking contrast, employment at independent targets (private-to-private deals) expands 10 percent relative to controls in the first two years post buyout. More rapid employ-ment growth at independent targets reflects a higher pace of acquisition, consistent with the view that private equity investments facilitate firm-level expansion.24 Most US buyout transactions involve independent targets, even though public-to-private transactions garner much more attention. In terms of buyout-year employment, independent targets account for about 63 percent more jobs than publicly held tar-gets (Table 2).
One common pattern emerges for all deal types in Table 7: excess reallocation rates are higher at target firms than at controls. The magnitude of the target-control difference in excess reallocation varies greatly by type of transaction, but it is posi-tive and highly statistically significant in all cases.
VI. Effects on Productivity and Worker Earnings
A. Productivity Measurement and Sample Weights
Our productivity analysis considers plant-level observations covered by the Census of Manufactures (CM) and the Annual Survey of Manufactures (ASM). The CM
24 Our evidence for private-to-private deals in the United States is broadly consistent with the evidence on French buyouts and its interpretation in terms of relaxed capital constraints offered by Boucly, Sraer, and Thesmar (2011).
Table 7— Buyout Effects on Target Firms Relative to Controls by Type of Buyout, 1980 to 2003
Type of private equity buyout
Dependent variable:Public to private
Independent to private
Divisionalbuyout
Secondarybuyout Other
Employment growth rate from buyout year t to t + 2
−10.36(0.38)
10.51(0.24)
−1.48(0.45)
7.15(0.58)
−6.45(0.80)
Excess reallocation rate from buyout year t to t + 2
5.08(0.21)
4.69(0.10)
20.32(0.19)
29.79(0.27)
6.16(0.40)
Observations (rounded) 374,000 1,298,000 475,000 169,000 123,000
Notes: Results are based on the semi-parametric ATE1 heterogeneous specifications of Tables 4 and 5, fit separately to target and control observations for each type of private equity buyout. Standard errors in parentheses. All reported coefficient values are statistically significant at the 0.01 level.
06_A20111124_10412.indd 3979 11/10/14 3:24 PM
3980 THE AMERICAN ECONOMIC REVIEW dECEMbER 2014
surveys all but the smallest manufacturing plants once every five years. The ASM, a rotating panel of manufacturing plants, samples the largest units with certainty and other units with probabilities increasing in size. Following Baily, Hulten, and Campbell (1992) and others, we compute plant-level log TFP as ln TF P it = ln Q it − α K ln K it − α L ln L it − α M ln M it , where i and t index plant and year, respectively, Q is real output, K is real capital, L is labor input, M is materials, and α denotes factor elasticities. Operationally, we measure plant output as shipments plus the change in inventories, deflated by industry-level price indices. We measure capital separately for structures and equipment using perpetual inventory methods. Labor is total hours of production and non-production workers. We measure and deflate energy and other materials separately, and we measure the factor elasticities using industry-level cost shares.25
Because the CM takes place every five years and the ASM over samples larger plants, our study of productivity outcomes adjusts for the probability that a given observation appears in a given analysis sample. To do so, we first create indicator variables for whether each observation appears in a given analysis sample.26 We then fit year-by-year logit models to the indicator variables, obtaining estimated sample inclusion probabilities for each observation. Explanatory variables are dum-mies for industry (4-digit SIC or 6-digit NAICS), payroll size classes, employment size classes, multi-unit status, target status, and interactions between multi-unit sta-tus and industry. The LBD contains data on these explanatory variables for every plant-year observation. We set the propensity weight for each observation to the reciprocal of its model-implied sample inclusion probability.27
B. Do Target Firms Direct Reallocation to More Productive Plants?
Section V shows that private equity buyouts accelerate job reallocation. Much of the extra reallocation involves establishment births and deaths. We now consider whether target firms direct this reallocation activity in ways that affect productivity. To that end, we first sort target plants and controls into terciles of the same-industry/same-year TFP distribution. We then investigate how plant entry and exit probabili-ties vary by location in the TFP distribution for targets in comparison to controls.
Panel A in Table 8 reports estimated exit probabilities in the first two years post buyout. We obtain these probabilities from a logit model fit to an exit indicator variable, where the explanatory variables are dummies for TFP terciles interacted
25 See Foster, Grim, and Haltiwanger (2013) for details on our measurement of inputs and outputs. As discussed in Syverson (2011), alternative methods for measuring the factor elasticities tend to yield similar plant-level TFP values even when they produce somewhat different elasticity values.
26 Our assignment of controls to target plants for the productivity analysis is similar to the approach adopted in Section IV. Starting from our establishment-level analysis sample, we restrict attention to manufacturing plants operated by two-year continuing firms (i.e., two years from the buyout year) and industry-year cells for which the ASM/CM data contain at least one target and one control observation. We drop a few observations for which the ASM/CM employment figure differs from the LBD figure by more than 1,000. We also drop control observa-tions on plants with more than 10,000 employees, of which there are none among target manufacturing plants.
27 Plant and firm age measures did not improve the logit models for sample inclusion—perhaps not surprisingly, given that Census mainly relies on industry, size, and multi-unit status in the ASM sample design. We checked that the propensity-weighted analysis samples adequately match the firm size, firm age, and industry distributions of employment in the populations of targets and controls, and that they adequately reproduce changes along each adjustment margin—births, deaths, continuers, etc.
06_A20111124_10412.indd 3980 11/10/14 3:24 PM
3981Davis et al.: Private equity, Jobs, anD ProDuctivityvol. 104 no. 12
with target and control dummies. Two results stand out: First, exit probabilities decline much more steeply with TFP for target plants than for controls. Second, targets exhibit greater exit probabilities in the bottom and middle terciles of the own-industry TFP distribution. The target-control exit differential is 5 percentage points in both terciles and significant at the 2.5 percent level in the bottom tercile.
Panel B provides information about the location of new plants in the TFP distribu-tion, where new plants are those that enter in the first or second year post buyout. We obtain entry probabilities from a logit model fit to an entry indicator variable, where, as before, the explanatory variables are dummies for TFP terciles interacted with target and control dummies. The panel B results uncover a striking contrast between targets and controls in the productivity of new plants: The prevalence of new plants in the bottom TFP tercile is only half as large for targets as controls, and the preva-lence of new plants in the top tercile is nearly twice as large for targets. New plants are concentrated in the upper part of the TFP distribution at firms backed by private equity. The opposite pattern holds at control firms.28
28 Previous work by Foster, Haltiwanger, and Krizan (2001), among others, highlights rapid productivity gains among young plants through learning and selection effects. Thus, the concentration of control entrants in the
Table 8—Entry and Exit of Manufacturing Plants by Location in Own-Industry Distribution of Total Factor Productivity, Buyouts from 1980 to 2003
Panel A. Plant exit probabilities in the first two years post buyout (logistic specification)
Location in own-industry TFP distribution as of the buyout year t
Probability of plant exit by year t + 2 p-value for difference between targets and
controlsTargets Controls
Bottom tercile 0.143(0.023)
0.091(0.002)
0.025
Middle tercile 0.112(0.034)
0.062(0.002)
0.139
Top tercile 0.078(0.015)
0.067(0.002)
0.487
Panel B. Plant entry probabilities in the first two years post buyout (logistic specification)
Location in own-industry TFP distribution in t + 2, two years after buyout
Probability that a plant operating in t + 2 entered in t + 1 or t + 2
p-value for difference between targets and
controlsTargets Controls
Bottom tercile 0.056(0.015)
0.121(0.006)
0.000
Middle tercile 0.071(0.016)
0.078(0.003)
0.590
Top tercile 0.127(0.029)
0.072(0.003)
0.058
Notes: Predicted probabilities implied by logistic regressions, using the propensity weights described in Section VIA. Standard errors are in parentheses. All reported coefficient values are statistically significant at the 0.01 level. The dependent variable in panel A equals 1 if the plant exits in the first or second year after the buyout year, zero oth-erwise. The dependent variable in panel B equals 1 if the establishment enters in the first or second year post buy-out, zero otherwise. Entry and exit outcomes are determined using the full LBD. Explanatory variables are terciles of the own-industry × year TFP distribution interacted with target and control dummies. Terciles are defined based on a plant’s position in the same-industry/same-year distribution of total factor productivity, using 4-digit SIC and 6-digit NAICS industry definitions. The panel A regression has about 107,000 observations, and the panel B regres-sion has about 91,000 observations.
06_A20111124_10412.indd 3981 11/10/14 3:24 PM
3982 THE AMERICAN ECONOMIC REVIEW dECEMbER 2014
C. Quantifying Buyout Effects on Total Factor Productivity
We can briefly summarize the evidence in Tables 5, 6, 7, and 8 as follows: Private equity buyouts accelerate job reallocation within target firms, and target firms direct reallocation activity in ways that raise TFP. We now develop additional evidence on the relationship of private equity buyouts to TFP. We then pull together several results to quantify and decompose the effects of buyouts on firm-level TFP growth.
Table 9 reports results for propensity-weighted OLS regressions that compare log TFP between target and control plants in the same industry-year. In addition to the full set of industry-year effects, the regressions include an extensive set of firm size and age effects.29 Panels A and B consider productivity outcomes in buyout years t and t + 2, respectively, and panel C considers TFP log changes for continuers. The most striking results involve entrant productivity: target entrants are 18 log points more productive in year t + 2 than continuing control plants and 22 log points more productive than control entrants. These large TFP advantages reflect a concentration of target entrants in the upper part of the TFP distribution and the opposite pattern for control entrants (Table 8). Although the effects are smaller and the evidence less powerful, Table 9 also confirms that plant exit patterns raise TFP at target firms, absolutely and relative to control firms. In contrast, we find no evidence that tar-get continuers experience more rapid TFP growth than control continuers. Panel C makes this point directly: the estimated target-control differential for TFP growth is one log point, with a standard error of 11 log points. If private equity buyouts improve relative TFP in continuing plants, the effects are either too small to reli-ably discern in our sample, or the gains mount too slowly to capture in our two-year tracking interval.30
To quantify the overall effect of private equity buyouts on firm-level TFP and assess the role of various adjustment margins, consider the difference-in-difference Δ P t − Δ ̃ P t where
Δ P t = [ S t+2 C P t+2
C − S t
C P t C ] + [ S t+2
N P t+2
N − S t
X P t X ] + [ S t+2
A P t+2
A − S t
D P t D ]
is the average two-year change in TFP among target firms, S denotes an employment share, P denotes a TFP value, and C, N, X, A, and D denote continuers, entrants, exits, acquisitions, and divestitures, respectively. For example, P t+2
C is the average
TFP among continuing target plants two years post buyout, where each plant’s TFP is expressed as a deviation from mean log TFP in the same industry-year cell. The average two-year TFP differential for controls, Δ ̃ P t , is defined analogously. Now express the TFP terms as deviations about same-year TFP values for control con-tinuers, cancel terms in Δ P t − Δ ̃ P t , and rearrange to obtain
bottom tercile of the TFP distribution should not be seen as evidence that entry lowers industry-level TFP over time. Nevertheless, panel B in Table 8 reveals that new plants opened by private equity targets significantly out perform new plants opened by control firms—at least with respect to early-life TFP.
29 Adding covariates for firm size and age moves us away from an exact matching estimator but, in our view, is preferable to (i) omitting the size and age effects or (ii) a pure matching estimator that uses very coarse size-age-industry-year cells. See chapter 3 in Angrist and Pischke (2009) for a discussion of this issue.
30 A recent study by Bharath, Dittmar, and Sivadasan (2013) considers 406 publicly held US manufacturing firms that went private in recent decades, including 115 through private equity buyouts. Consistent with our results, they find no evidence that public-to-private transitions generate productivity gains in continuing plants.
06_A20111124_10412.indd 3982 11/10/14 3:24 PM
3983Davis et al.: Private equity, Jobs, anD ProDuctivityvol. 104 no. 12
(1) Δ P t − Δ ̃ P t = S t+2 C ( P t+2
C − ̃ P t+2
C ) − S t
C ( P t C − ̃ P t
C )
+ S t+2 N ( P t+2
N − ̃ P t+2
C ) − ̃ S t+2
N ( ̃ P t+2
N − ̃ P t+2
C )
− S t X ( P t
X − ̃ P t C ) + ̃ S t
X ( ̃ P t
X − ̃ P t C )
+ S t+2 A ( P t+2
A − ̃ P t+2
C ) − ̃ S t+2
A ( ̃ P t+2
A − ̃ P t+2
C )
− S t D ( P t
D − ̃ P t C ) + ̃ S t
D ( ̃ P t D − ̃ P t
C ) .
Table 9—Productivity of Manufacturing Plants, Targets and Controls, Buyouts from 1980 to 2003
Panel A. TFP in buyout year t by plant status in year t + 2p-value for difference between targets and
controls
Dependent variable: Plant-level log TFP in year t
Plant status Targets Controls
Continuers 0.016(0.012)
Omitted group0.180
Exits −0.075**(0.035)
−0.032***(0.008)
0.232
Divestitures −0.023***(0.027)
−0.044***(0.007)
0.462
R 2 0.538
Panel B. TFP in year t + 2, two years after buyout, by plant status in year t + 2p-value for difference between targets and
controls
Dependent variable: Plant-level log TFP in year t + 2
Plant status Targets Controls
Continuers 0.020*(0.011)
Omitted group 0.076
Entrants 0.182***(0.055)
−0.039***(0.011)
0.000
Acquisitions −0.010(0.047)
−0.030***(0.007)
0.668
R 2 0.523
Panel C. TFP growth at continuing plants, from buyout year t to t + 2
p-value for difference between targets and
controls
Dependent variable: Change in plant-level log TFP from buyout year t to t + 2
Targets Controls
Continuers 0.001(0.011)
Omitted group 0.954
R 2 0.071
Notes: OLS regressions using the propensity weights described in Section VIA. The omitted group is continuing control plants. All specifications include industry-year effects as well as firm size and age effects. Standard errors in parentheses. There are about 107,000 observations in the panel A regression, 91,000 in the panel B regression, and 62,000 in the panel C regression. On a propensity-weighted basis, 83 percent of the target observations in panel A are continuers, 8 percent are entrants, and 7 percent are divestitures. Continuers account for 86 percent of target observations in panel B, entrants for 8 percent, and acquisitions for 6 percent. Plant status is determined using the full LBD. Since target plants are overwhelmingly (99 percent) part of multi-unit firms, this analysis focuses on tar-gets and controls part of multi-unit firms. By design, this table considers firms that continue from the buyout year t to t + 2. If we add firm exits to the sample, the “Exits” row of panel A changes slightly: the coefficient becomes −0.085 (0.034) for Targets and −0.042 (0.007) for Controls.
*** Significant at the 1 percent level. ** Significant at the 5 percent level. * Significant at the 10 percent level.
06_A20111124_10412.indd 3983 11/10/14 3:24 PM

3984 THE AMERICAN ECONOMIC REVIEW dECEMbER 2014
The top line of (1) isolates the contribution of target-control differences among continuing plants, the second and third lines isolate the contribution of plant entry and exit (births and deaths), and the fourth and fifth lines isolate the contribution of acquisitions and divestitures.
This decomposition is new to the literature to our knowledge and has some attrac-tive features. It shows how to combine difference in differences estimates with an accounting decomposition that appears often in the empirical literature on firm-level productivity dynamics. To see this point, note that the expressions in parentheses can be read directly from Table 9. The shares S can be retrieved from the job cre-ation and destruction statistics reported in online Appendix Table C.2, the manufac-turing analogue to Table 6. Related, (1) lets us exploit the full LBD to compute the share variables, while relying on the ASM-CM sample to obtain the difference in differences estimates. The decomposition also sidesteps any need to compare TFP across industries or years, because all productivity terms in (1) are based on plant-level TFP deviations about industry-year means.
Table 10 exploits (1) to obtain the average TFP growth differential between tar-get and control firms and its decomposition by margin of adjustment. Target firms outperform controls with respect to post-buyout TFP growth by 2.14 log points over two years, a large gain compared to the change of −0.38 log points among control continuers. Summing over terms in the second line of (1) yields a value of 1.59, implying that plant entry and exit effects account for 74 percent of the superior TFP growth at target firms. This result confirms the importance of the target-control dif-ferences on the entry and exit margins documented in Tables 8 and 9.
For additional insight into the nature of the entry and exit effects, we replace S N and ̃ S N with their average in (1), do the same for S X and ̃ S X , and then recalculate the second line of (1) to obtain a value of 1.56 log points. This calculation corresponds to a counterfactual that turns off target-control differences in the pace of job real-location to isolate the role of differences in its direction. The message is clear: The stronger directedness of job reallocation in target firms accounts for almost all of the entry and exit contribution to (1) and, indeed, more than 70 percent of Δ P t − Δ ̃ P t .
Two other remarks help put this finding in perspective. First, while directional dif-ferences are central to our explanation for superior TFP growth at target firms, they matter because entry and exit involve sizable rates of job creation and destruction. In this respect, both the pace of job reallocation and the target-control directional dif-ferences are essential. Second, reallocation rates are considerably higher outside the manufacturing sector, as readily seen by comparing Tables 6 and C.2. This fact has potentially important implications for the TFP effects of buyouts in the private sec-tor as a whole. If we plug private sector share values from Table 6 into (1) alongside difference in differences estimates from Table 9, the implied TFP growth advantage of targets is 3.05 log points, 81 percent of which is due to entry and exit effects.
D. Effects on Earnings Per Worker
Tables 8–10 provide strong evidence that, on average, private equity buyouts improve operating performance, at least in the manufacturing sector. To investigate whether buyouts also affect operating margins via unit input costs, we now con-sider LBD data on annual earnings per worker (EPW) at the establishment level.
06_A20111124_10412.indd 3984 11/10/14 3:24 PM
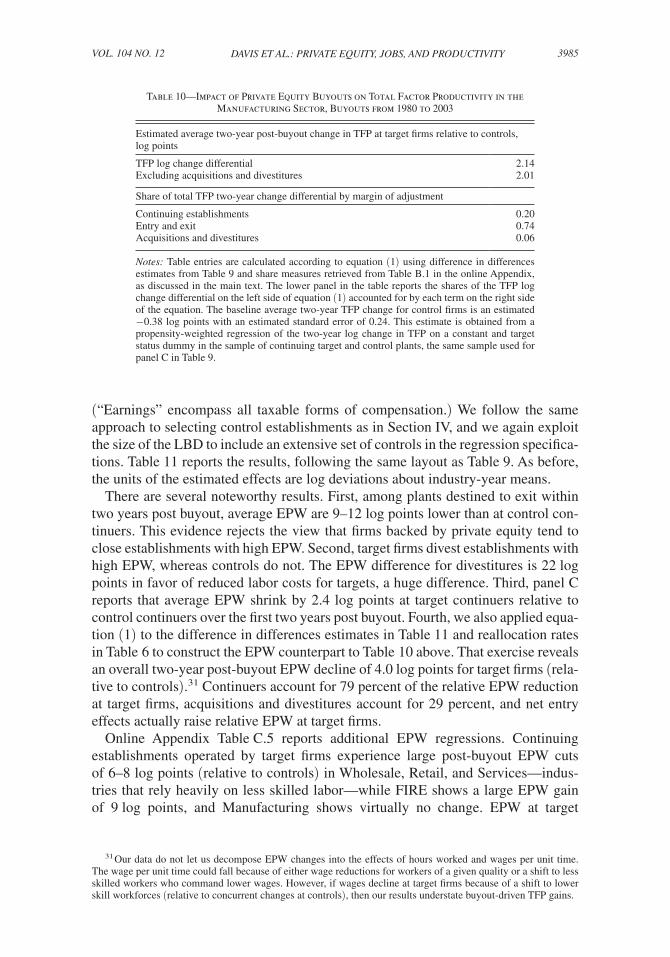
3985Davis et al.: Private equity, Jobs, anD ProDuctivityvol. 104 no. 12
(“Earnings” encompass all taxable forms of compensation.) We follow the same approach to selecting control establishments as in Section IV, and we again exploit the size of the LBD to include an extensive set of controls in the regression specifica-tions. Table 11 reports the results, following the same layout as Table 9. As before, the units of the estimated effects are log deviations about industry-year means.
There are several noteworthy results. First, among plants destined to exit within two years post buyout, average EPW are 9–12 log points lower than at control con-tinuers. This evidence rejects the view that firms backed by private equity tend to close establishments with high EPW. Second, target firms divest establishments with high EPW, whereas controls do not. The EPW difference for divestitures is 22 log points in favor of reduced labor costs for targets, a huge difference. Third, panel C reports that average EPW shrink by 2.4 log points at target continuers relative to control continuers over the first two years post buyout. Fourth, we also applied equa-tion (1) to the difference in differences estimates in Table 11 and reallocation rates in Table 6 to construct the EPW counterpart to Table 10 above. That exercise reveals an overall two-year post-buyout EPW decline of 4.0 log points for target firms (rela-tive to controls).31 Continuers account for 79 percent of the relative EPW reduction at target firms, acquisitions and divestitures account for 29 percent, and net entry effects actually raise relative EPW at target firms.
Online Appendix Table C.5 reports additional EPW regressions. Continuing establishments operated by target firms experience large post-buyout EPW cuts of 6–8 log points (relative to controls) in Wholesale, Retail, and Services—indus-tries that rely heavily on less skilled labor—while FIRE shows a large EPW gain of 9 log points, and Manufacturing shows virtually no change. EPW at target
31 Our data do not let us decompose EPW changes into the effects of hours worked and wages per unit time. The wage per unit time could fall because of either wage reductions for workers of a given quality or a shift to less skilled workers who command lower wages. However, if wages decline at target firms because of a shift to lower skill workforces (relative to concurrent changes at controls), then our results understate buyout-driven TFP gains.
Table 10—Impact of Private Equity Buyouts on Total Factor Productivity in the Manufacturing Sector, Buyouts from 1980 to 2003
Estimated average two-year post-buyout change in TFP at target firms relative to controls, log points
TFP log change differential 2.14Excluding acquisitions and divestitures 2.01
Share of total TFP two-year change differential by margin of adjustment
Continuing establishments 0.20Entry and exit 0.74Acquisitions and divestitures 0.06
Notes: Table entries are calculated according to equation (1) using difference in differences estimates from Table 9 and share measures retrieved from Table B.1 in the online Appendix, as discussed in the main text. The lower panel in the table reports the shares of the TFP log change differential on the left side of equation (1) accounted for by each term on the right side of the equation. The baseline average two-year TFP change for control firms is an estimated −0.38 log points with an estimated standard error of 0.24. This estimate is obtained from a propensity-weighted regression of the two-year log change in TFP on a constant and target status dummy in the sample of continuing target and control plants, the same sample used for panel C in Table 9.
06_A20111124_10412.indd 3985 11/10/14 3:24 PM

3986 THE AMERICAN ECONOMIC REVIEW dECEMbER 2014
continuers decline by 7 log points in public-to-private deals and by 2 points in private-to-private deals. Divestitures contribute to relative EPW reductions at tar-get firms for all private equity deal types, with an especially pronounced divesti-ture effect in private-to-private deals. In summary, while the details of the EPW results differ somewhat by industry and buyout type, the prevailing pattern is one of reduced EPW at target firms in the wake of private equity buyouts. Related work by Neumark and Sharpe (1996) and Bertrand and Mullainathan (1999), for exam-ple, finds mixed results for the effects of hostile takeovers on worker earnings. We believe there is much room for additional research on how ownership changes affect labor costs and worker earnings.
Table 11—Earnings per Worker (EPW) at Target and Control Establishments, Buyouts from 1980 to 2003
Panel A. EPW in buyout year t by establishment status in year t + 2
Dependent variable: Establishment log real EPW in year t p-values for difference between targets and
controlsEstablishment status Targets Controls
Continuers 0.011(0.003)
Omitted group 0.000
Exits −0.085(0.006)
−0.115(0.004)
0.000
Divestitures 0.163(0.009)
−0.055(0.006)
0.000
R 2 0.448
Panel B. EPW in year t + 2, two years after buyout, by establishment status in year t + 2
p-values for difference between targets and
controls
Dependent variable: Establishment log real EPW in year t + 2
Establishment status Targets Controls
Continuers −0.031(0.003)
Omitted group 0.000
Entrants 0.015(0.006)
−0.011(0.004)
0.000
Acquisitions 0.010(0.007)
−0.015(0.006)
0.000
R 2 0.421
Panel C. EPW growth at continuing establishments, from buyout year t to t + 2p-values for difference
between targets and controls
Dependent variable: Change in establishment log real EPW from buyout year t to t + 2
Targets Controls
Continuers −0.024(0.002)
Omitted group 0.000
R 2 0.200
Notes: All specifications include the full cross product of industry, year, firm size, and firm age effects. Standard errors in parentheses. Reported coefficient values are statistically significant at the 0.01 level. The reported results are for weighted regressions equivalent to a nonparametric matching estimator in panel C and approximately equiv-alent in panels A and B. The observation for each control establishment is weighted by the ratio of targets to controls in the same industry-year-size-age cell. Similar results obtain with equal weighting of all observations. There are about 1.7 million observations in the panel A regression, 1.8 million in the panel B regression, and 1.3 million in the panel C regression. Like Table 9, this analysis focuses on target and control plants part of multi-unit firms. Results (available upon request) including SU plants are very similar. By design, this table considers firms that continue from the buyout year t to t + 2. If we add firm exits to the sample, the “Exits” row of panel A changes slightly: the coefficient remains −0.085 (0.006) for Targets and becomes −0.120 (0.004) for Controls.
06_A20111124_10412.indd 3986 11/10/14 3:24 PM
3987Davis et al.: Private equity, Jobs, anD ProDuctivityvol. 104 no. 12
VII. Concluding Remarks
Our study develops new evidence on the responses of employment, job reallo-cation, productivity, and worker earnings to private equity buyouts. Compared to previous research, we exploit a much larger sample of buyouts, a much more exten-sive set of controls, and a novel ability to track outcomes at firms and establish-ments. These advantages enable us to overcome important limitations in previous research and address controversies about the effects of private equity buyouts on jobs and operating performance. We also exploit the strengths of our data to explore new questions about private equity’s role in the creative destruction process and its impact on restructuring activity inside target firms.
Our findings support the view that private equity buyouts lead to greater job loss at establishments operated by target firms as of the buyout year. Employment at these establishments shrinks by 3 percent relative to controls in the two-year period post buyout and by 6 percent over five years. Gross job destruction at target estab-lishments outpaces destruction at controls by a cumulative 10 percentage points over five years post buyout. Thus, pre-existing employment positions are at greater risk of loss in the wake of private equity buyouts.
While noteworthy, these results make up only part of a richer story. Using our abil-ity to track each firm’s constituent establishments, we examine how jobs respond to buyouts on several adjustment margins, including job creation at greenfield estab-lishments opened post buyout. This aspect of our analysis reveals that target firms create new jobs in newly opened establishments at a faster pace than control firms. Accounting for the purchase and sale of establishments as well, the target-control growth differential is less than 1 percent of initial employment over two years.
Private equity buyouts involve much larger effects on the gross creation and destruction of jobs. The job reallocation rate at target firms exceeds that of controls by 14 percentage points over two years post buyout. About 45 percent of the extra job reallocation reflects a more rapid pace of organic employment adjustments, and the rest reflects acquisitions and divestitures. We find greater job reallocation in the wake of private equity buyouts for public-to-private deals, private-to-private deals, divisional sales, and secondary sales. These novel findings provide evidence that pri-vate equity buyouts catalyze the creative destruction process as measured by gross job flows and the purchase and sale of business establishments. Digging deeper, we also address two distinct views about the nature of the increased reallocation activ-ity associated with private equity buyouts. One view sees private equity as agents of change in the sense that buyouts accelerate retrenchments at some target firms, while accelerating expansion at others. Another view sees private equity as agents of restructuring in the sense that buyouts accelerate the reallocation of jobs across establishments within target firms. We show the restructuring effect predominates, and it is the entire story for organic employment changes.
Our investigation into the effects of private equity buyouts on TFP growth in the manufacturing sector yields a highly complementary set of results. Relative to controls, target firms more aggressively close plants with low TFP, and they more aggressively open new plants with high TFP. In other words, target firms direct job reallocation activity on the plant entry and exit margins in ways that raise TFP. On average, target firms outperform control firms with respect to TFP growth by 2.1 log points over
06_A20111124_10412.indd 3987 11/10/14 3:25 PM
3988 THE AMERICAN ECONOMIC REVIEW dECEMbER 2014
two years post buyout. More than 70 percent of the estimated TFP gains arise from private equity influence on the direction of job reallocation on plant entry and exit margins. These results refute the view that the returns to private equity rest entirely on private gains to financial engineering and wealth transfers from other stakeholders.
We also find sizable reductions in earnings per worker in the first two years post buyout. Specifically, we estimate an average two-year post-buyout reduction in earnings per worker of 4 log points at target firms relative to controls, mostly due to reductions at continuing plants. In sum, our evidence indicates that private equity buyouts improve operating margins at target firms by raising productivity and by lowering unit labor costs. The resulting gains in profitability are magnified in their impact on corporate earnings per share by the leveraged capital structures that char-acterize firms acquired in private equity buyouts.
By identifying a large sample of private equity transactions and linking them to the LBD, ASM, and CM, this paper also sets the stage for new research into buyout effects on capital expenditures, other input costs, profitability, and other outcomes. A rich array of input and outcome measures are available at the firm and establish-ment level in Census Bureau datasets that can be linked to the LBD and our data on private equity transactions. Our plans for future work also include further investiga-tion into how and why buyout effects differ by industry and type of buyout, and an examination of outcomes in corporations that sell to private equity groups. Many divisional buyouts involve divestitures of underperforming units that may place heavy demands on senior management. Schoar (2002) documents that acquisitions can lead managers to neglect core businesses, what she calls the “new toy” effect. The LBD allows us to investigate whether the same phenomenon operates in reverse when firms sell underperforming or poorly fitting divisions, thereby freeing senior management to focus on core activities.
REFERENCES
Amess, Kevin, and Mike Wright. 2007. “The Wage and Employment Effects of Leveraged Buyouts in the UK.” International Journal of the Economics of Business 14 (2): 179–95.
Angrist, Joshua D., and Jörn-Steffen Pischke. 2009. Mostly Harmless Econometrics: An Empiricist’s Companion. Princeton: Princeton University Press.
A.T. Kearney. 2007. Creating New Jobs and Value with Private Equity. Chicago: A.T. Kearney, Inc.Baily, Martin Neil, Charles Hulten, and David Campbell. 1992. “Productivity Dynamics in Manufac-
turing Plants.” In Brookings Papers on Economic Activity: Microeconomics, edited by Clifford Win-ston and Martin Neil Baily, 187–249. Washington, DC: Brookings Institution Press.
Baker, George P. 1992. “Beatrice: A Study in the Creation and Destruction of Value.” Journal of Finance 47 (3): 1081–1119.
Baker, George P., and Karen H. Wruck. 1989. “Organizational Changes and Value Creation in Lever-aged Buyouts: The Case of the O.M. Scott & Sons Company.” Journal of Financial Economics 25 (2): 163–90.
Bertrand, Marianne, and Sendhil Mullainathan. 1999. “Is There Discretion in Wage Setting? A Test Using Takeover Legislation.” RAND Journal of Economics 30 (3): 535–54.
Bharath, Sreedhar, Amy Dittmar, and Jagadees Sivadasan. 2013. “Do Going Private Transactions Affect Plant Productivity?” Unpublished.
Boucly, Quentin, David Sraer, and David Thesmar. 2011. “Growth LBOs.” Journal of Financial Eco-nomics 102 (2): 432–53.
British Private Equity and Venture Capital Association (BVCA). 2006. The Economic Impact of Pri-vate Equity in the UK. London: BVCA.
Caballero, Ricardo J. 2007. Specificity and the Macroeconomics of Restructuring. Cambridge, MA: MIT Press.
06_A20111124_10412.indd 3988 11/10/14 3:25 PM
3989Davis et al.: Private equity, Jobs, anD ProDuctivityvol. 104 no. 12
Caves, Richard E. 1998. “Industrial Organization and New Findings on the Turnover and Mobility of Firms.” Journal of Economic Literature 36 (4): 1947–82.
Davis, Steven J., and John C. Haltiwanger. 1992. “Gross Job Creation, Gross Job Destruction, and Employment Reallocation.” Quarterly Journal of Economics 107 (3): 819–63.
Davis, Steven J., and John Haltiwanger. 1999. “Gross Job Flows.” In Handbook of Labor Economics. Volume 3B, edited by Orley C. Ashenfelter and David Card, 2711–805. Amsterdam: Elsevier, B.V.
Davis, Steven J., John C. Haltiwanger, Kyle Handley, Ron S. Jarmin, Josh Lerner, and Javier Miranda. 2012. “Private Equity, Jobs and Productivity.” Unpublished.
Davis, Steven J., John Haltiwanger, Kyle Handley, Ron Jarmin, Josh Lerner, and Javier Miranda. 2014. “Private Equity, Jobs, and Productivity: Dataset.” American Economic Review. http://dx.doi.org/10.1257/aer.104.12.3956.
Davis, Steven J., John Haltiwanger, Ron S. Jarmin, C.J. Krizan, Javier Miranda, Alfred Nucci, and Kristin Sandusky. 2009. “Measuring the Dynamics of Young and Small Businesses: Integrating the Employer and Non-employer Business Universes.” In Producer Dynamics: New Evidence from Micro Data, edited by Timothy Dunne, J. Bradford Jensen, and Mark J. Roberts, 329–68. Chicago: University of Chicago Press.
Davis, Steven J., John C. Haltiwanger, Ron S. Jarmin, Josh Lerner, and Javier Miranda. 2011. “Private Equity and Employment.” National Bureau of Economic Research Working Paper 17399.
Davis, Steven J., John Haltiwanger, Ron S. Jarmin, and Javier Miranda. 2007. “Volatility and Disper-sion in Business Growth Rates: Publicly Traded versus Privately Held Firms.” In NBER Macroeco-nomics Annual 2006. Vol. 21, edited by Daron Acemoglu, Kenneth Rogoff, and Michael Woodford, 107–80. Cambridge: MIT Press.
Davis, Steven J., John C. Haltiwanger, and Scott Schuh. 1996. Job Creation and Destruction. Cam-bridge: MIT Press.
Dunne, Timothy, Mark J. Roberts, and Larry Samuelson. 1989. “Plant Turnover and Gross Employ-ment Flows in the U.S. Manufacturing Sector.” Journal of Labor Economics 7 (1): 48–71.
European Private Equity and Venture Capital Association (EVCA). 2005. Employment Contribution of Private Equity and Venture Capital in Europe. Zaventum: EVCA.
Foster, Lucia, Cheryl Grim, and John Haltiwanger. 2013. “Reallocation in the Great Recession: Cleans-ing or Not?” US Census Bureau Center for Economic Studies Working Paper CES-WP-13-42.
Foster, Lucia, John C. Haltiwanger, and C. J. Krizan. 2001. “Aggregate Productivity Growth: Les-sons from Microeconomic Evidence.” In New Directions in Productivity Analysis, edited by Charles R. Hulten, Edwin R. Dean, and Michael J. Harper, 303–72. Chicago: University of Chicago Press.
Hall, David. 2007. “Methodological Issues in Estimating the Impact of Private Equity Buyouts on Employment.” Unpublished.
Haltiwanger, John, Ron S. Jarmin, and Javier Miranda. 2013. “Who Creates Jobs? Small vs. Large vs. Young.” Review of Economics and Statistics 95 (2): 347–61.
Harris, Richard, Donald S. Siegel, and Mike Wright. 2005. “Assessing the Impact of Management Buyouts on Economic Efficiency: Plant-Level Evidence from the United Kingdom.” Review of Eco-nomics and Statistics 87 (1): 148–53.
Jensen, Michael C. 1989. “The Eclipse of the Public Corporation.” Harvard Business Review 67 (5): 61–74.
Jensen, Michael C., Willy Burkhardt, and Brian K. Barry. 1990. “Wisconsin Central Ltd. Railroad and Berkshire Partners (A): Leveraged Buyouts and Financial Distress.” Harvard Business School Case no. 9-190-062.
Kaplan, Steven N. 1989a. “The Effects of Management Buyouts on Operating Performance and Value.” Journal of Financial Economics 24 (2): 217–54.
Kaplan, Steven N. 1989b. “Management Buyouts: Evidence on Taxes as a Source of Value.” Journal of Finance 44 (3): 611–32.
Kaplan, Steven N., and Per Strömberg. 2009. “Symposium: Private Equity: Leveraged Buyouts and Private Equity.” Journal of Economic Perspectives 23 (1): 121–46.
Lichtenberg, Frank R. 1990. “The Effects of Leveraged Buyouts on Productivity and Related Aspects of Firm Behavior.” Journal of Financial Economics 27 (1): 165–94.
Long, William F., and David J. Ravenscraft. 1993. “The Financial Performance of Whole Company LBOs.” US Census Bureau, Center for Economic Studies Working Paper CES-WP-93-16.
Luehrman, Timothy A. 2007. “The Hertz Corporation (A).” Harvard Business School Case no. 208-030.
Luehrman, Timothy A., and William A. Teichner. 1992. “Kaiser Steel Corporation, 1987.” Harvard Business School Case no. 293-019.
McGuckin, Robert H., and Sang V. Nguyen. 2001. “The Impact of Ownership Changes: A View from Labor Markets.” International Journal of Industrial Organization 19 (5): 739–62.
06_A20111124_10412.indd 3989 11/10/14 3:25 PM
3990 THE AMERICAN ECONOMIC REVIEW dECEMbER 2014
Muscarella, Chris J., and Michael R. Vetsuypens. 1990. “Efficiency and Organizational Structure: A Study of Reverse LBOs.” Journal of Finance 45 (5): 1389–413.
Neumark, David, and Steven A. Sharpe. 1996. “Rents and Quasi Rents in the Wage Structure: Evi-dence from Hostile Takeovers.” Industrial Relations 35 (2): 145–79.
Puri, Manju, and Rebecca Zarutskie. 2012. “On the Lifecycle Dynamics of Venture-Capital- and Non-Venture-Capital-Financed Firms.” Journal of Finance 67 (6): 2247–93.
Rasmussen, Poul Nyrup. 2008. “Taming the Private Equity ‘Locusts’.” Project Syndicate/Europe’s World 8 (Spring): 130–3.
Schoar, Antoinette. 2002. “Effects of Corporate Diversification on Productivity.” Journal of Finance 57 (6): 2379–403.
Service Employees International Union (SEIU). 2007. Behind the Buyouts: Inside the World of Private Equity. Washington, DC: SEIU.
Shapiro, Robert J., and Nam D. Pham. 2008. American Jobs and the Impact of Private Equity Trans-actions. Washington, DC: Sonecon.
Shleifer, Andrei, and Lawrence H. Summers. 1988. “Breach of Trust in Hostile Takeovers.” In Corpo-rate Takeovers: Causes and Consequences, edited by Alan J. Auerbach, 33–68. Chicago: University of Chicago Press.
Siegel, Donald, and Frank R. Lichtenberg. 1987. “Productivity and Changes in Ownership of Manu-facturing Plants.” Brookings Papers on Economic Activity 3: 643–83.
Strömberg, Per. 2007. “The New Demography of Private Equity.” Unpublished.Syverson, Chad. 2011. “What Determines Productivity?” Journal of Economic Literature 49 (2): 326–
65.Törnqvist, Leo, Pentti Vartia, and Yrjö Vartia. 1985. “How Should Relative Change Be Measured?”
American Statistician 39 (1): 43– 46.Woolridge, Jeffrey M. 2002. Econometric Analysis of Cross Section and Panel Data. Cambridge, MA:
MIT Press.Wright, Mike, Steve Thompson, and Ken Robbie. 1992. “Management-Led Leveraged Buy-Outs: A
European Perspective,” Journal of Business Venturing 7 (1): 47–71.Wruck, Karen H. 1991. “What Really Went Wrong at Revco?” Journal of Applied Corporate Finance
4 (2): 79–92.
06_A20111124_10412.indd 3990 11/10/14 3:25 PM