Embed Size (px)
Citation preview

Presented at the NOAA, GMD, ESRL, GMAC, May, 21, 2013
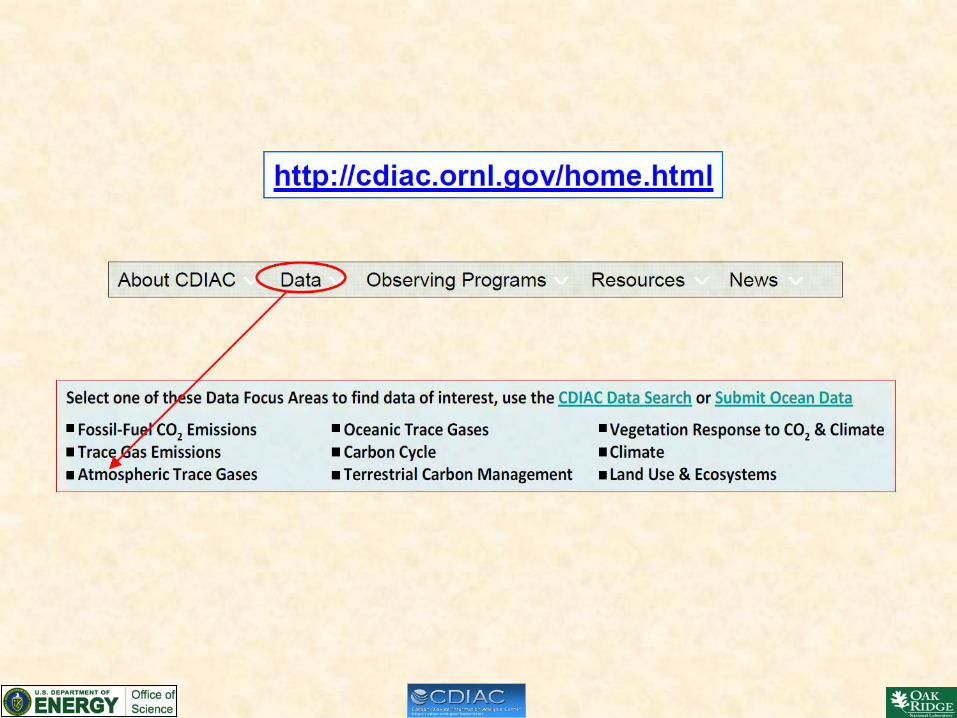
http://cdiac.ornl.gov/home.html

Obtaining and organizing atmospheric chemistry data from several institutions.
Discovery
Extraction
Importation
Examination
Organization
http://cdiac.ornl.gov/home.html

Present data sets to the public, along with some explanation of how the data were obtained and comments about trends.
http://cdiac.ornl.gov/home.html

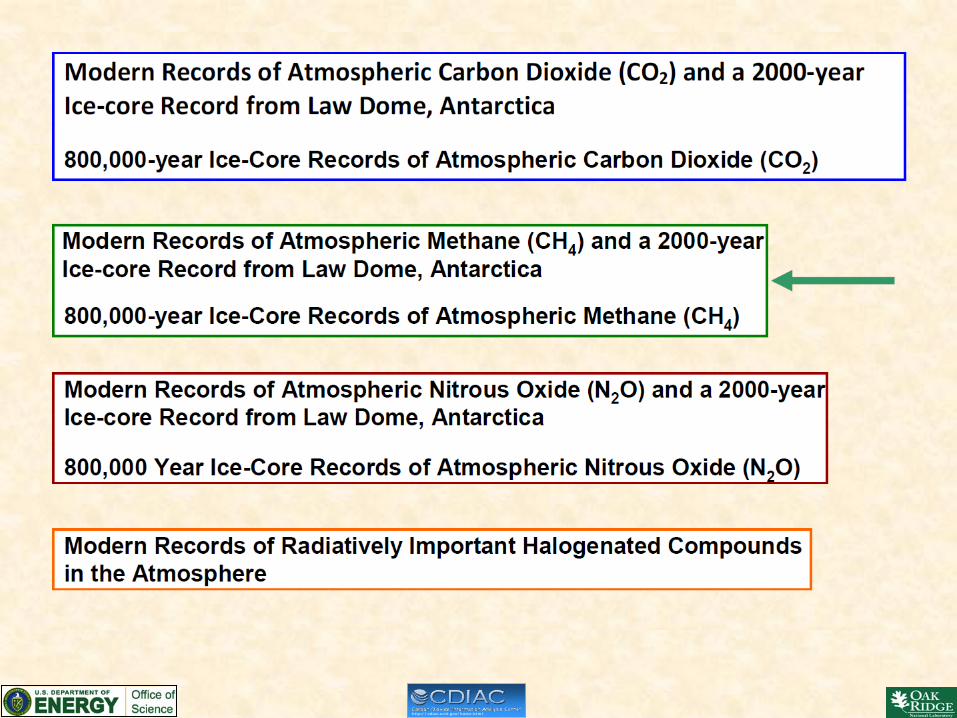
Atmospheric Measurements of Climate-Relevant SpeciesCDIAC's data collection includes measurements of the following climate-relevant chemical species. Asummary of recent greenhouse gas concentrations is also available. To determine how compoundsare named, see the CDIAC “Name that compound” page.
Sulfur Hexaflouride (SF6) Tetrachloroethane (C2Cl4)Trifluoromethyl Sulfur Pentafluoride (SF5CF3)
Butane (C4H10)Carbon Dioxide (CO2)Carbon IsotopesCarbon Monoxide (CO)Carbon Tetrachloride (CCl4)Chlorofluorocarbons
Methane (CH4)
http://cdiac.ornl.gov/home.html
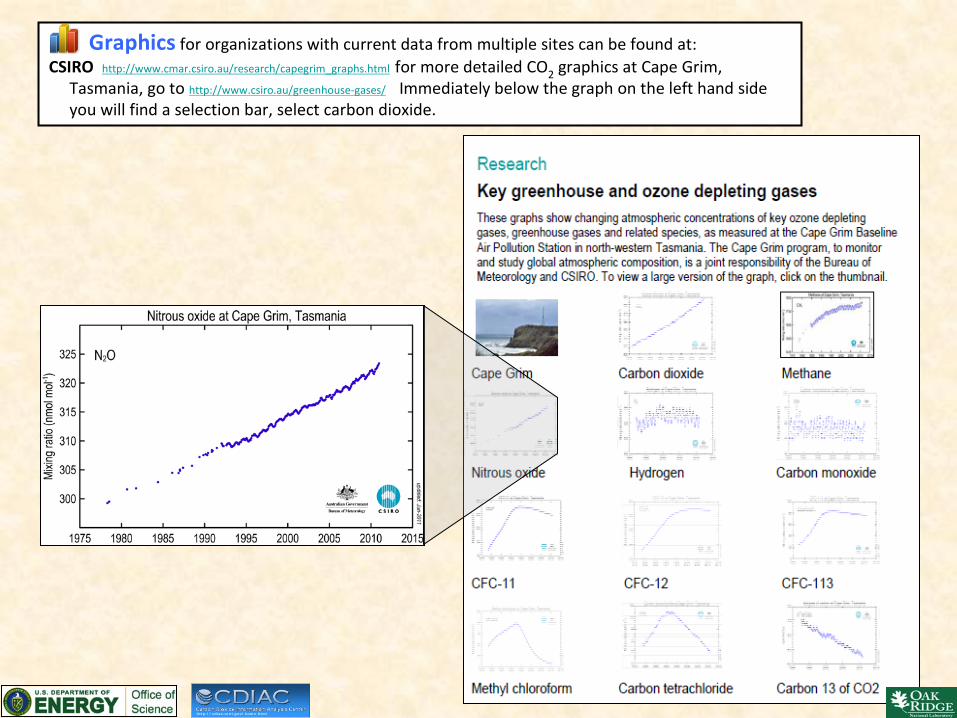
Graphics for organizations with current data from multiple sites can be found at:CSIRO http://www.cmar.csiro.au/research/capegrim_graphs.html for more detailed CO2 graphics at Cape Grim,
Tasmania, go to http://www.csiro.au/greenhouse-gases/ Immediately below the graph on the left hand sideyou will find a selection bar, select carbon dioxide.
http://cdiac.ornl.gov/home.html
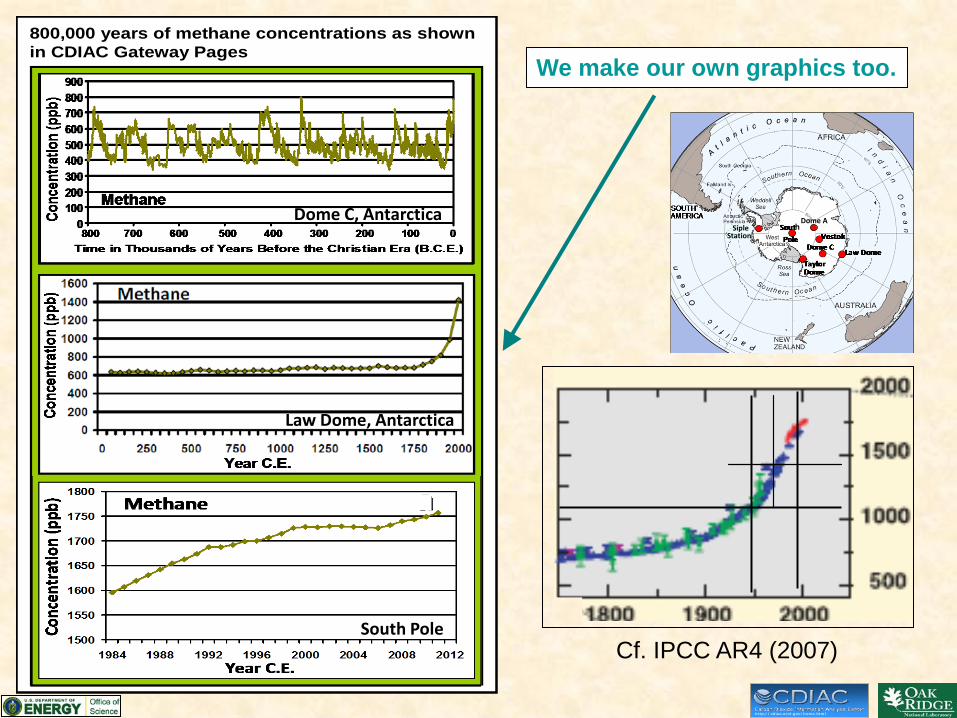
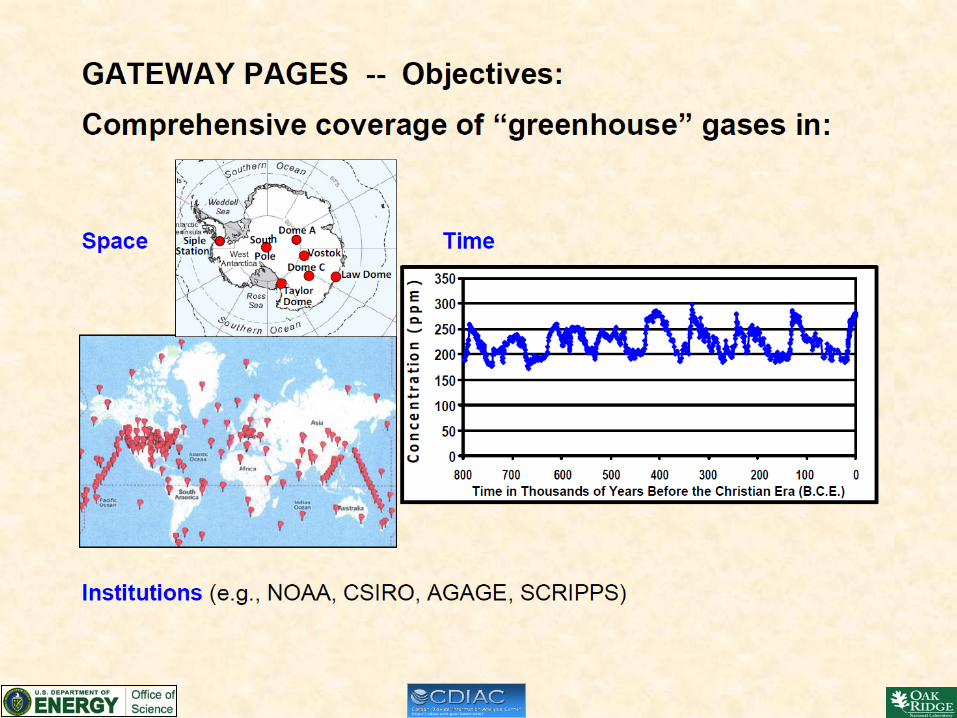
800,000 years of methane concentrations as shown in CDIAC Gateway Pages
We make our own graphics too.
Cf. IPCC AR4 (2007)
South Pole
Law Dome, Antarctica
Dome C, Antarctica Siple
Stationh
Dome A
http://cdiac.ornl.gov/home.html

NOAA http://www.esrl.noaa.gov/gmd/dv/data/ select carbon dioxide in the second column of the selection chart and select stations of interest. Information about station codes is at: http://www.esrl.noaa.gov/gmd/dv/site/site_table2.html
# comment: ************ DATA DESCRIPTION *************** # comment: # description_site-code: mlo # description_project-abbr: ccg_surface # description_strategy-abbr: flask # comment: # comment: ************ DATA DOCUMENTATION *************** # comment: # comment: Please refer to the species-specific README file in the # comment: appropriate directory folder at ftp://ftp.cmdl.noaa.gov/ccg. # comment: # data_fields: site year month value MLO 1969 8 322.93 MLO 1969 9 321.36 MLO 1969 10 320.71 MLO 1969 11 322.00 MLO 1969 12 323.77 MLO 1970 1 325.13 MLO 1970 2 325.54 MLO 1970 3 325.68 MLO 1970 4 326.58 MLO 1970 5 327.68 MLO 1970 6 327.30 MLO 1970 7 326.13 MLO 1970 8 324.91 MLO 1970 9 322.98 MLO 1970 10 322.61 MLO 1970 11 323.97 MLO 1970 12 325.46
http://cdiac.ornl.gov/home.html
Greenhouse Gases (358) Carbon Dioxide (358) Flask (188) Hourly Averages (153) ABP (2) Insitu (1) Discrete (107) •Insitu Tower (9) Monthly Averages (94) MLO (42)
Daily Averages (4) •ZEP (2)
Information about site codes can be found here
?
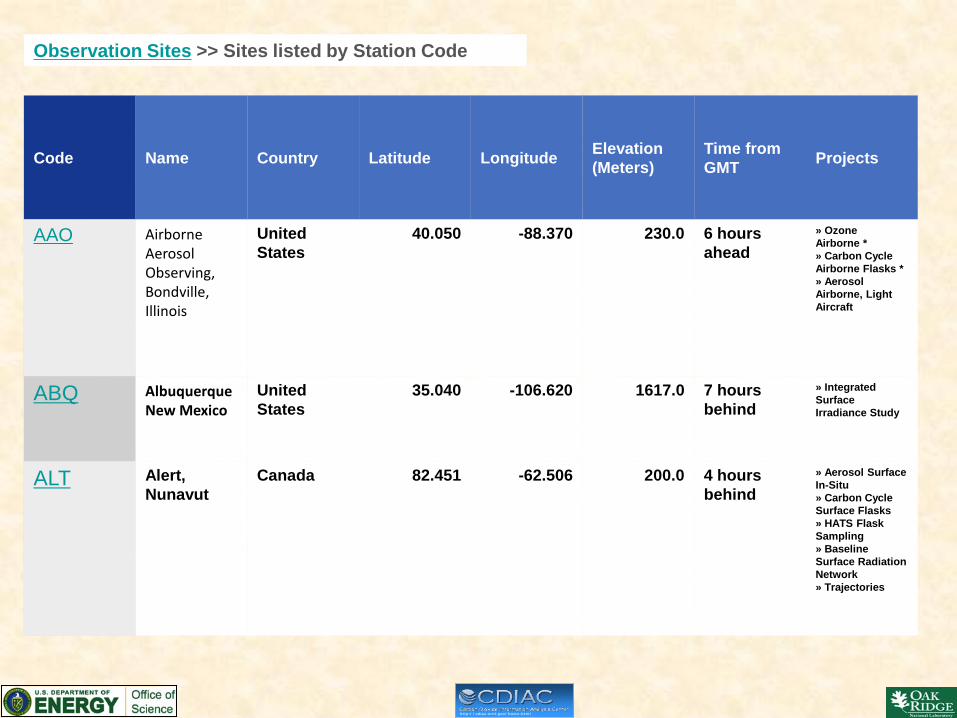
Code Name Country Latitude Longitude Elevation (Meters)
Time from GMT Projects
AAO Airborne Aerosol Observing, Bondville, Illinois
United States
40.050 -88.370 230.0 6 hours ahead
» Ozone Airborne * » Carbon Cycle Airborne Flasks * » Aerosol Airborne, Light Aircraft
ABQ AlbuquerqueNew Mexico
United States
35.040 -106.620 1617.0 7 hours behind
» Integrated Surface
Irradiance Study
ALT Alert, Nunavut
Canada 82.451 -62.506 200.0 4 hours behind
» Aerosol Surface In-Situ » Carbon Cycle Surface Flasks » HATS Flask Sampling » Baseline Surface Radiation Network » Trajectories
Observation Sites >> Sites listed by Station Code
http://cdiac.ornl.gov/home.html

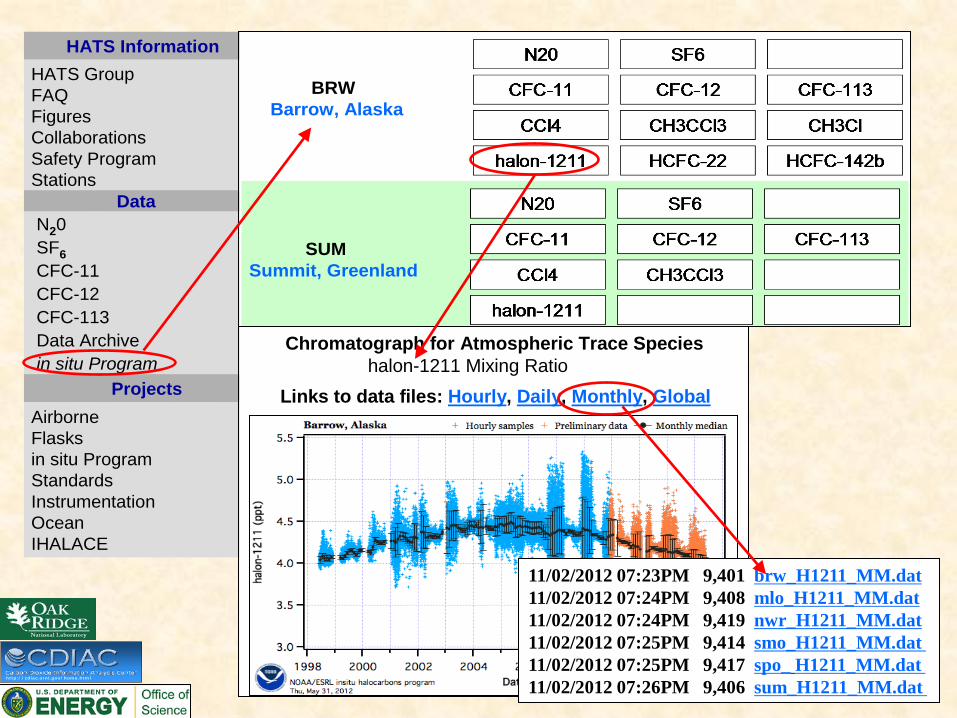
N20 SF6CFC-11 CFC-12 CFC-113 Data Archive in situ Program
HATS InformationHATS GroupFAQFiguresCollaborationsSafety ProgramStations
Data
ProjectsAirborneFlasksin situ ProgramStandardsInstrumentationOceanIHALACE
FTP directory /hats/ at ftp.cmdl.noaa.gov
To view this FTP site in Windows Explorer, click Page, and then click Open FTP Site in Windows Explorer.
Up to higher level directory06/09/2010 12:00AM 6,148 DS Store10/01/2012 07:48PM Directory INX04/11/2012 12:00AM Directory Total Cl Br01/14/2011 12:00AM Directory airborne 11/09/2012 09:11PM Directory carbonyl sulfide
02/19/2009 12:00AM Directory halons
Up to higher level directory02/19/2009 12:00AM Directory .10/01/2012 07:47PM Directory ..08/17/2012 09:42PM Directory flasks 05/03/2001 12:00AM Directory insituGCs
05/03/2001 12:00AM Directory . 02/19/2009 12:00AM Directory .. 05/03/2001 12:00AM Directory CATS
05/03/2001 12:00AM Directory . 05/03/2001 12:00AM Directory .. 10/19/2009 12:00AM Directory daily 12/22/2009 12:00AM Directory global 10/19/2009 12:00AM Directory hourly 10/19/2009 12:00AM Directory monthly
11/02/2012 07:23PM 9,401 brw_H1211_MM.dat 11/02/2012 07:24PM 9,408 mlo_H1211_MM.dat 11/02/2012 07:24PM 9,419 nwr_H1211_MM.dat 11/02/2012 07:25PM 9,414 smo_H1211_MM.dat 11/02/2012 07:25PM 9,417 spo_ H1211_MM.dat 11/02/2012 07:26PM 9,406 sum_H1211_MM.dat
?!
http://cdiac.ornl.gov/home.html
N20 SF6CFC-11 CFC-12 CFC-113 Data Archive in situ Program
HATS InformationHATS GroupFAQFiguresCollaborationsSafety ProgramStations
Data
ProjectsAirborneFlasksin situ ProgramStandardsInstrumentationOceanIHALACE
BRWBarrow, Alaska
SUMSummit, Greenland
Chromatograph for Atmospheric Trace Specieshalon-1211 Mixing Ratio
Links to data files: Hourly, Daily, Monthly, Global
11/02/2012 07:23PM 9,401 brw_H1211_MM.dat 11/02/2012 07:24PM 9,408 mlo_H1211_MM.dat 11/02/2012 07:24PM 9,419 nwr_H1211_MM.dat 11/02/2012 07:25PM 9,414 smo_H1211_MM.dat 11/02/2012 07:25PM 9,417 spo_ H1211_MM.dat 11/02/2012 07:26PM 9,406 sum_H1211_MM.dat
http://cdiac.ornl.gov/home.html

http://cdiac.ornl.gov/home.html
Flame Ionization Electron Capture
Accelerator Mass Spectrometry
Halogen


Why is Climate Information Lost in Very Deep Ice?
The stratigraphic record from the GISP2 and GRIP ice cores agree for most of the ice depth, indicating that the variations are indeed related to climate However, isolated small folds can be seen below about 2400 m depth, and the records appear to become uncorrelated below about 2800 m depth. Because of irregular bedrock topography, inhomogeneities in the ice, and changes in ice flow direction, layers in the ice can be overturned and disrupted by ice flow.
Ice dynamics models are needed to predict areas and conditions of likely disruption for future ice cores. This figure shows where perturbed layers are likely to become overturned and where they are likely to be flattened.
Disruptions that are larger than the ice core diameter may be detected by geophysical tools such as radar remote sensing and/or borehole sonic measurements.
http://cdiac.ornl.gov/home.html


![hawaii's rainwater catchment services directory - ctahr directory... · [ Page 1 ] Hawaii’s Rainwater atchment Services Directory HAWAII’S RAINWATER CATCHMENT SERVICES DIRECTORY](https://img.dokumen.tips/doc/110x75/5a81030c7f8b9a38478ceb57/hawaiis-rainwater-catchment-services-directory-ctahr-directory-page-1-hawaiis.jpg)