Embed Size (px)
Citation preview

Eo
Sa
b
a
ARRA
KVDE
1
iataAfttms[
flivOt
0d
J. Non-Newtonian Fluid Mech. 158 (2009) 73–84
Contents lists available at ScienceDirect
Journal of Non-Newtonian Fluid Mechanics
journa l homepage: www.e lsev ier .com/ locate / jnnfm
xperimental investigation of the spreading of viscoplastic fluidsn inclined planes
. Cocharda,∗, C. Anceyb
Department of Mathematics, University of British Columbia, Vancouver, CanadaSchool of Architecture, Civil and Environmental Engineering, École Polytechnique Fédérale de Lausanne, 1015 Lausanne, Switzerland
r t i c l e i n f o
rticle history:eceived 11 April 2008eceived in revised form 28 July 2008ccepted 14 August 2008
eywords:iscoplastic fluidsam breaks
a b s t r a c t
We report experimental results related to the dam-break problem for viscoplastic fluids. Using imageprocessing techniques, we were able to accurately reconstruct the free-surface evolution of fixed volumesof fluid suddenly released a plane. We used Carbopol Ultrez 10 as a viscoplastic material; its rheologicalbehavior was closely approximated by a Herschel–Bulkley model for a fairly wide range of shear-rates.Varying the Carbopol concentration allowed us to change the yield stress and bulk viscosity. The yieldstress ranged from 78 to 109 Pa, producing Bingham numbers in the 0.07–0.35 range. We investigatedthe behavior of a 43-kg mass released on a plane, whose inclination ranged from 0◦ to 18◦. For each run,we observed that the behavior was nearly the same: at short times, the mass accelerated vigorously on
xperimental resultsgate opening and very quickly reached a nearly constant velocity. At time t = 1 s, independently of planeinclination and yield stress, the mass reached a near-equilibrium regime, where the front position variedas a power function of time over several decades. We did not observe any run-out phase, during which themass would have gradually come to a halt. The similarity in the flow behavior made it possible to derivean empirical scaling for the front position in the form xf = t0.275(sin ˛)1/3(sin ˛)5/4, where ˛ and t denote, resp
mflssfsthtap3uuad
plane inclination and time
. Introduction
Numerous applications in industrial processes and naturenvolve the release of a finite volume of viscoplastic materials onto
surface. In civil engineering, the slump test is commonly usedo determine the flow features of concrete and has given rise tobundant literature on empirical yield stress measurement [1–6].similar test, referred to as the Bostwick test, is widely used in the
ood industry to characterize the consistency of food products. Thisest has also attracted attention over recent years, mostly in rela-ion to interpretation of test results [7–10]. Geophysical flows offer
any examples of finite volumes of plastic materials spreading on alope. Typical examples include snow avalanches and debris flows11,12] as well as volcanic lava [13].
While much of the earlier work has focused on time-dependentows of viscous fluids over a rigid boundary [14–17], a grow-
ng attention has been paid to the corresponding problem withiscoplastic fluids from the theoretical point of view [18–29].n rare occasions, exact or asymptotic analytical solutions to
he governing equations can be worked out [10,21,30–34], but
∗ Corresponding author.E-mail address: [email protected] (S. Cochard).
tiC
iemfl
377-0257/$ – see front matter © 2008 Elsevier B.V. All rights reserved.oi:10.1016/j.jnnfm.2008.08.007
ectively, and which holds for sloping beds (˛ > 0).© 2008 Elsevier B.V. All rights reserved.
ost of the time, solutions must be computed numerically usingow-depth averaged equations of motion (the equivalent of thehallow-water equations in hydraulics) [35–37], nonlinear diffu-ion equations when inertial terms are negligible [19,21], or theull set of equations of motion (using a finite-element approach ormooth-particle-hydrodynamics techniques). Surprisingly, despitehe substantial interest in the spreading of viscoplastic fluids, thereave been to date very few experimental investigations reportinghe flow behavior of a finite volume of viscoplastic fluids downsurface. Debiane [38] tracked the front position and flow-depthrofiles of fixed volumes of Carbopol released down a 3-m long,0-cm wide flume. The flow-depth profile was estimated usingltrasonic devices while the position of the front was monitoredsing a high speed camera mounted on a mobile carriage. Sivigliand Cantelli [37] investigated the effect of bed curvature on flowynamics. Chanson et al. [32] studied the dam-break problem withhixotropic viscoplastic fluids using a 2-m long, 0.34-m wide flumenclined at 15◦. The free-surface elevation was measured using aCD camera and a series of laser sheets.
In this paper, we report experimental results of dam-break flowsnvolving fixed volumes of viscoplastic materials. The dam-breakxperiment consists of the sudden release of a finite volume ofaterial down a slope or onto a horizontal surface. Initially, the
uid is placed in a reservoir at the top of the plane, as sketched

74 S. Cochard, C. Ancey / J. Non-Newtonian Fluid Mech. 158 (2009) 73–84
F ervoir closed by a lock gate. (b) The gate is opened at time t = 0 and the fluid flows downt
idfl(asuasseeetisstiAiAooabfIptreirs
2
2
mrzTwot(
b
F
Tw4drrsa
iB(The camera recorded how regular patterns projected onto the sur-face were deformed when the free surface moved (see Fig. 3).We developed algorithms to process the image data, determinethe spreading rate, and reconstruct whole-field three-dimensional
ig. 1. Sketch of the experimental setup. (a) Initially the fluid is contained in the reshe inclined plane.
n Fig. 1. It is then unleashed by lifting the lock gate and flows,riven by gravitational forces. The initial conditions (volume ofuid, rheological features, density) and the boundary conditionsslope angle, surface roughness, topography) can easily be alterednd controlled, which makes this test very appropriate to under-tand time-dependent flows. In particular, this setting has beensed as a benchmark for testing theory against data for inviscidnd Newtonian fluids [15,16,39]; in that case, experimentalists wereatisfied with the measurement of the front position over timeince on the one hand, this position can be accurately monitoredxperimentally and on the other hand, one can predict the frontvolution using similarity theory. The situation is markedly differ-nt for non-Newtonian fluids, for which one is interested in bothhe front position and free-surface shape, which is a delicate exper-mental task. To take up this challenge, we built a new imagingystem, which makes it possible to accurately reconstruct the freeurface of an avalanching mass of fluid. In Section 2.1, we outlinehe techniques developed for this purpose; the interested readers referred to an earlier publication for further information [40].nother substantial challenge posed by non-Newtonian fluids lies
n the proper characterization and control of rheological properties.n equation such as the Herschel–Bulkley model is an idealizationf how a viscoplastic material behaves. In this respect, a numberf physical features such as viscoelasticity and thixotropy are notccounted for; furthermore, disturbing effects (e.g., slipping, shearanding) are substantial impediments that may spoil the most care-ul experiments. Taking a closer look at these issues is thus essential.n Sections 2.2 and 2.3, we describe how the fluid samples were pre-ared and characterized rheometrically. In Section 2.4, we presenthe experimental procedure. Great care was brought to ensure accu-acy and reproducibility of experiments. Section 3 is devoted toxperimental results. There we present the data obtained with thenclined plane; a companion paper [41] includes experimental dataelated to channelized flows. A few conclusions are drawn in the lastection.
. Experimental procedure
.1. Experimental setup
To investigate avalanching masses of fluid, we built an experi-ental setup made up of a high-rigidity metal frame supporting a
eservoir, a 6-mm-thick aluminium plate, and a horizontal run-outone. This full facility was 5.5 m long, 1.8 m wide, and 3.5 m high.he plate could be inclined from 0◦ to 45◦ (see Fig. 2). Its positionas accurately controlled using a digital inclinometer with a res-
lution of 0.1◦. Since Carbopol slipped on aluminium, we paintedhe aluminum plate with Krautol Zink-und-Alugrund-3363 paintprovided by Selma AG, Schwerzenbach, Switzerland).The reservoir was positioned at the top of the inclined planeehind the lock gate. The reservoir was 51 cm long and 30 cm wide.
ig. 2. View of the inclined plane during a test with Carpobol. Courtesy of C. Blaser.
he maximum capacity of the reservoir was 120 kg. The dam wallas composed of a 1.6 m × 0.8 m ultralight carbon plate (which was-cm-thick). Two pneumatic jacks opened the sluice gate to theesired aperture within 0.8 s. An ultralight lock gate was needed toeduce gate inertia and plane vibration. The two jacks were quicklyaised by injecting pressurized air at 7 MPa. Two electromagneticensors were located at the tip of each jack to control its positionnd start the clock.
To measure the free-surface shape, we developed a novel imag-ng system, which consisted of a high-speed digital camera (aasler A202k) coupled to a synchronized micro-mirror projectora modified z-Snapper provided by ViALUX, Chemnitz, Germany).
Fig. 3. The Sketch of the experimental setup and the measurement system.

S. Cochard, C. Ancey / J. Non-Newtonian Fluid Mech. 158 (2009) 73–84 75
Table 1Rheological characteristics and composition of the Carbopol samples used (for a 60-kg mass)
Concentration
0.25% 0.30% 0.35% 0.40%
Ultrez 10 [g] 150.00 ± 0.05 180.00 ± 0.05 210.00 ± 0.05 240.00 ± 0.05NaOH [g] 62.20 ± 0.05 74.64 ± 0.05 87.09 ± 0.05 99.53 ± 0.05H2O [kg] 59.79 ± 0.04 59.07 ± 0.04 58.92 ± 0.04 58.77 ± 0.04Solution [kg] 60.00 ± 0.04 60.00 ± 0.04 60.00 ± 0.04 60.00 ± 0.04
� ± 1K ± 1.7n ± 0.0
sa4b
tppp1m
2
gaUTpH2twi
2
BTpt
spltt
cc
adbtotdtbahst
rirwsTd
•
•
In the Couette inverse problem, we have to retrieve the shear-stress/shear-rate relation �(�̇) from torque/rotational-velocitymeasurements ω(T). These quantities are related to each other by
c [Pa] 78 ± 1 89[Pa s−n] 32.1 ± 2.3 47.68
0.388 ± 0.023 0.415
hapes of the free surface. The free surface was reconstructed withn accuracy of 1 mm over a surface of 1.4 m × 1.4 m at a rate of5 Hz (further details of the experimental procedure are providedy [40]).
In terms of computation time, for a typical 3-min experiment,he post-processing phase required almost one week on a single-rocessor machine. To reduce computation time, we ran the post-rocessing phase on a cluster of two Mac-Pro computers with 8-rocessor cores. Parallel computation reduced processing time today, which enabled us to conduct more experiments and applyore sophisticated processing algorithms.
.2. Fluid
We used Carbopol Ultrez 10, a viscoplastic stable polymericel. This is a carbomer polymeric gel produced by Noveon. Here-fter and unless specified otherwise, Carbopol refers to Carbopolltrez 10. Carbopol was used at four different concentrations.able 1 summarizes the concentration of the different com-onents used. We also report the rheological parameters of aerschel–Bulkley equation fit to the rheometrical data (see Section.3). Anhydrous NaOH Pellets RPE-ACS-ISO was used to neutralizehe Carbopol solution to a pH of 7. The solvent was demineralizedater. A full description of the preparation procedure is described
n [42].
.3. Rheometry
The flow curve of the viscoplastic gel was determined using aohlin CVOR rheometer equipped with a Couette cell (see Fig. 4).he inner and the outer cylinder cell walls were covered with water-roof sandpaper 180 to reduce slip. The dimensions of the cell andhe rotating bob are reported in Fig. 4.
We first determined the yield stress using a creep test. The
ample was sheared under constant shear-stress for 6 min and com-liance J was recorded as a function of time t. We started with aow shear-stress value and we incremented it by 1-Pa steps untilhe curve J(t) diverged from the previous records. Fig. 5 showshe results of a series of creep tests for a Carbopol sample at the
Fig. 4. The Couette geometry used in our experiments.Fi
102 ± 1 109 ± 158.91 ± 1.7 75.84 ± 1.9
21 0.505 ± 0.027 0.579 ± 0.033
oncentration of 0.40% (only every second curve is presented forlarity).
In 1985, Barnes and Walters [43] came up with a provocativerticle in which they concluded that the yield stress is a myth andoes not exist. Coussot et al. [44] provided evidence for an interplayetween yield stress and thixotropy. Møller et al. [45] concludedhat yield stress and thixotropy of a fluid have the same physicalrigin. The measurement of the yield stress not only depends onhe duration of the experiment, but also on the history of the fluideformation. In 2007, Piau [46] measured, with MRI-rheometeryechnique, and compared results for different concentration of Car-opol 940 and 980 at very low shear-rate and found, instead ofyield stress, two Newtonian plateaus. Even if in the yield stressas been questioned as a physical property, the concept of a yieldtress still remains very useful for a wide range of applications. Inhis paper, we used a 6 min creep test to define the yield stress.
We then determined the flow curve, i.e., the shear-stress/shear-ate relation. To that end, we used a standard technique, whichnvolved imposing a step-like ramp of stress and recording theesulting deformation until equilibrium was reached (i.e. shear-rateas constant). The initial stress was 10 Pa higher than the yield
tress and was then progressively increased by 2-Pa increments.he shear-stress range covered one decade. From the raw data, weetermined the flow curve:
we solved the Couette inverse problem using Tikhonov regular-ization techniques; and thenwe adjusted an empirical equation (the Herschel–Bulkley equa-tion) on the data.
ig. 5. Creep test of Carbopol Ultrez 10 at a 0.4% concentration. The yield stress wasn the 109 ± 1 Pa range.

76 S. Cochard, C. Ancey / J. Non-Newtonian Fluid Mech. 158 (2009) 73–84
F
t
ω
wAotfh�a‖o
Hi
�
wditEvr�
afawsatstcm1a
thfja
Fr
srcarolt
rpsgataae
Iavftwoirsb
vbpgKflibflr
ig. 6. Herschel–Bulkley model for a sample of Carbopol at a concentration of 0.30%.
he Couette equation [47,48]
(�) = (A�̇)(�) = 12
∫ �
ˇ�
�̇(S)S
dS, (1)
here ˇ = di/do is the ratio of the inner to outer cylinder diameters,the integral operator, and S = �(di/2r)2 represents the distributionf shear-stress across the cell gap (r denotes the radial dis-ance from the inner cylinder). The shear-stress is directly derivedrom the torque T using � = 2M/(�d2
i h) with h the inner cylindereight. Tikhonov regularization consists in recovering shear-rate
˙ from rotational velocity measurement ω(T) using a least-squarepproach: instead of solving ω = A�̇ , one minimizes the residualω − A�̇‖, usually subject to an additional constraint on the normf ‖�̇‖ or its derivative to control the smoothness of the solution.
To describe the rheological behavior of Carbopol, we used theerschel–Bulkley model, whose expression for a simple-shear flow
s
= �c + K�̇n, (2)
ith �c the yield stress, K the consistency, and n an index. Weetermined the value of these parameters from rheometrical exper-
ments as follows: �c was set to the value determined by the creepest while K and n were computed using a least-square approach.q. (2) can be integrated across the gap to provide the theoreticalariation in the torque as a function of the rotational velocity. Theesulting equation can then be used to fit the raw data and derivec, n, and K values.
Fig. 6 gives an example of results obtained for Carbopol Ultrez 10t a concentration of 0.30%. The dashed line represents the resultsrom the Couette rheometer using Tikhonov’s method. The dash-nd-dot line is the best-fit line when the parameters �c, K, and nere free: � = 96.7 + 47.9�̇0.54. We also considered that the yield-
tress value was measured independently with the creep test (seebove) and we sought K and n using the least-square method; inhat case we obtained � = 90.0 + 47.6�̇0.43 (solid line in Fig. 6). Aseen on this log-linear plot, there is little difference between thehree curves for �̇ ranging from 0.02 to 0.5 s−1. Small deviationsan be observed in the low-shear-rate regime (�̇ < 0.1 s−1), butuch larger differences are seen for large shear-rate values (�̇ >s−1), which shows how important it is to select an appropriatedjustment procedure.
Carbopol exhibits little thixotropy. In our case, to evaluate the
hixotropy influence on the rheological behavior, we ran standardysteresis loop tests. These tests are known to be insufficient forully characterizing thixotropy, but satisfactory when the intent isust to appreciate the influence of thixotropy [49]. We first appliedlinear shear-rate ramp (from zero to a maximum value) to our
s
2
ig. 7. Creep test and recovery period on a sample of Carbopol with a 40-mm ser-ated parallel on a sample of Carbopol at a concentration C of 0.30%.
ample, then we decreased the shear-rate while following the sameamp backward. The procedure was repeated several times until aonstant loop behavior was produced. The area between the uppernd lower curves is a measure of thixotropy. The test was alsoepeated with 120 and 180-s ramps. The curves are close to eachther (within the measurement error) and the loop area is small,eading to the conclusion that our Carbopol samples were weaklyhixotropic.
Another test consisted in imposing a 10-s creep followed by aecovery period. To that end, we used a 40-mm serrated parallel-late geometry to reduce inertia and enhance accuracy. The appliedtress was just above the yield stress. The time to reach equilibriumave an indication of how thixotropic the sample was. Fig. 7 shows120- and 150-Pa creep test for a Carbopol sample at the concen-
ration of 0.30%. Equilibrium was reached, for both tests, withinpproximately 1 s after stress application and within less than 1 sfter stress removal. This short relaxation time provided furthervidence that Carbopol was weakly thixotropic.
Slip can affect rheometrical measurements with Carbopol [50].ndeed, under some circumstances the Carbopol polymer chainsre repelled from the walls owing to repulsion forces arising fromarious physico-chemical interactions (e.g., electrostatic and stericorces) between the polymer chains and wall. Molecular migra-ion creates a depletion layer, i.e. a very thin layer of water at theall, causing slip on the macroscopic level. Since slip could seri-usly affect our measurements, we paid special attention to thisssue. Two techniques are classically used to avoid or reduce slip:oughening or coating the walls [51,52]. Another technique involveshearing the material with a vane (a shaft equipped with four or sixlades) [51].
Roughening the wall with water resistant sandpaper 180 pro-ided a satisfactory expedient for the Couette cell (provided thatoth inner and outer cylinders were covered), but not for thearallel-gap geometry (probably because of inaccuracies in theap measurement). In contrast, coating the cylinder with PVP-90TM high-molecular-weight polyvinyl-pyrrolidone (producedrom International Specialty Products and provided by ISP Switzer-and AG, Baar, Switzerland) as suggested by Wu et al. [53] gave,n our case, poor results. Not only the flow curves obtained wereelow the ones obtained with the sandpaper, but they were alsouctuating. A 6-blade vane also proved not to be appropriate. Theotating vane irreversibly fractured the gel and then spun without
hearing it..4. Experimental procedure
For each run, we proceeded as follows:

S. Cochard, C. Ancey / J. Non-Newtonian Fluid Mech. 158 (2009) 73–84 77
Fd
(
(
(
(
((
tawldg
ite[rfbWdclmol
rw(
B
rdU
Fig. 9. Results from two similar tests with m = 43 kg, ˛ = 12◦ and C = 0.30%. (a) Frontpositions xf (solid and dashed lines) and deviation �xf (dashed–dotted line). (b)Flow depths h.
FC
3
3
r
ig. 8. Three-dimensional view of 43 kg of Ultrez 10 at a concentration C of 0.25%own a 6◦ slope at time t = 900 s.
1) The fluid was gently poured into the reservoir, while the planewas kept in the horizontal position. The mass of fluid was fixedto 43 kg.
2) The upper plane was then inclined at an inclination ˛ to thehorizontal. The initial flow-depth at the lock gate ranged from30 to 36 cm depending on plane inclination.
3) The free surface was flattened out by hand. Note that this stepis essential to ensuring good reproducibility.
4) A few minutes before starting the test, we collected a fluid sam-ple and tested it using a Bohlin rheometer to characterize itsrheological properties (see Section 2.3).
5) The acquisition system was turned on.6) The clock was set to zero and the acquisition procedure was
launched on lifting up the lock gate.
We then reconstructed the three-dimensional shape using theechniques described in Section 2.1. For particular applications, welso extracted the flow-depth profile at the centerline (see Fig. 8) asell as the contour of the mass (referred to as the contact line). The
atter was determined by seeking the points where the flow depthropped below a given threshold (in practice, a value of 0.5 mmave good results).
To test out the accuracy, sensitivity and robustness of the exper-mental apparatus, we repeated many experiments and comparedhe results. A typical example is provided in Fig. 9, where two differ-nt batches of Carbopol prepared with the same protocol were used42]. The mass and concentration were the same (43 kg and 0.30%,espectively) and the plane inclination was 12◦. Fig. 9(a) shows bothront positions xf during the first 60 s as well as the deviation �xfetween them. In absolute value, �xf ranged from 2.5 to 6 mm.hen scaled with the maximum distance traveled by the mass
uring the test, the maximum deviation was below 0.4%, which wasonsidered negligible. Fig. 9(b) shows the flow profile at the center-ine for both tests. The profiles were similar in both cases since the
aximum deviation �z(x,t) between both profiles is on the orderf 3 mm. The contact lines are reported in Fig. 10 and again showittle difference.
To test our system, we also verified that the surge was symmetricelative to the centerline. As shown in Fig. 10, the flow is symmetricith respect to y-axis, with the maximum difference in the y values
for the same elevation) within 5 mm.Note that in our experiments, the Bingham number
i = �c
K(U∗/H∗)n (3)
anged from 0.07 to 0.35. In the above equation, H∗ denotes a flow-epth scale (here set to the initial flow depth at the lock gate) and
∗ = (�g sin ˛/K)1/nH1+1/n∗ is a velocity scale.
rtwwSc˛
ig. 10. Position of the contact lines for two tests with m = 43 kg, ˛ = 12◦ and= 0.30%.
. Experimental results
.1. Flow regimes observed
The spreading of the avalanching mass depended on the fluidheological parameters (�c, K, and n), the plane inclination (˛), theeservoir dimensions, and the mass (m). To evaluate the influence ofhe rheological parameters and plane inclination on propagation,
e kept the mass (43 kg) and the reservoir dimensions constanthile the concentration and the plane inclination were varied.ixteen tests were carried out with a 43 kg mass of Carbopol at con-entrations C = 0.25%, 0.30%, 0.35%, and 0.40% for plane inclinationof 0◦, 6◦, 12◦, and 18◦.
78 S. Cochard, C. Ancey / J. Non-Newtonian Fluid Mech. 158 (2009) 73–84
F %) ant
FwaFt
(
F(
(
ig. 11. Three-dimensional view of a 43-kg avalanching mass of Carbopol (C = 0.30= 52 min.
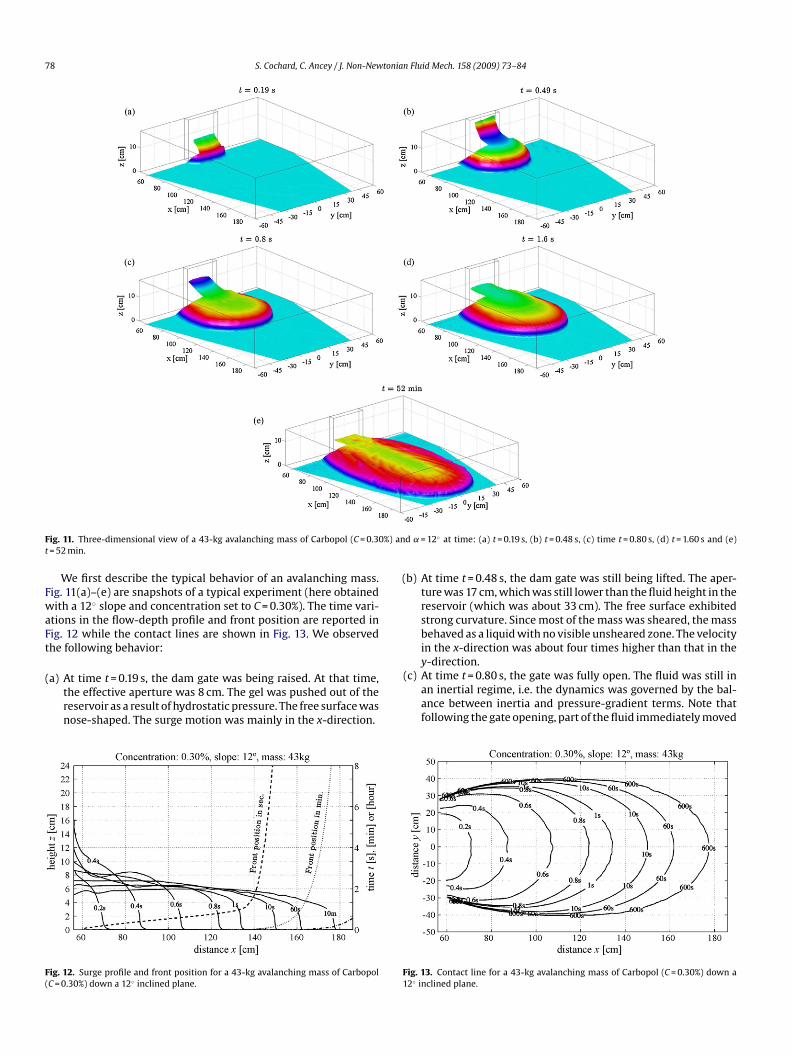
We first describe the typical behavior of an avalanching mass.ig. 11(a)–(e) are snapshots of a typical experiment (here obtainedith a 12◦ slope and concentration set to C = 0.30%). The time vari-
tions in the flow-depth profile and front position are reported inig. 12 while the contact lines are shown in Fig. 13. We observedhe following behavior:
a) At time t = 0.19 s, the dam gate was being raised. At that time,the effective aperture was 8 cm. The gel was pushed out of thereservoir as a result of hydrostatic pressure. The free surface wasnose-shaped. The surge motion was mainly in the x-direction.
ig. 12. Surge profile and front position for a 43-kg avalanching mass of CarbopolC = 0.30%) down a 12◦ inclined plane.
F1
d ˛ = 12◦ at time: (a) t = 0.19 s, (b) t = 0.48 s, (c) time t = 0.80 s, (d) t = 1.60 s and (e)
b) At time t = 0.48 s, the dam gate was still being lifted. The aper-ture was 17 cm, which was still lower than the fluid height in thereservoir (which was about 33 cm). The free surface exhibitedstrong curvature. Since most of the mass was sheared, the massbehaved as a liquid with no visible unsheared zone. The velocityin the x-direction was about four times higher than that in they-direction.
(c) At time t = 0.80 s, the gate was fully open. The fluid was still inan inertial regime, i.e. the dynamics was governed by the bal-ance between inertia and pressure-gradient terms. Note thatfollowing the gate opening, part of the fluid immediately moved
ig. 13. Contact line for a 43-kg avalanching mass of Carbopol (C = 0.30%) down a2◦ inclined plane.

tonian
(
F2C
S. Cochard, C. Ancey / J. Non-New
downstream in the form of a forward wave, while a wavepropagating upstream separated moving fluid from static fluid
upslope. The latter reached the rear end at t = 0.6 s.d) At time t = 1.60 s, the gel had slowed down drastically (seeFig. 12). Time variations in the velocity became increasinglysmaller, indicating that the gel reached a near-equilibrium
(
ig. 14. Flow-depth profiles and contact line at t = 0.4 (dashed line), 0.8 (dashed–dotted li0,000 s (dashed line). Time variation in the front position. Experimental conditions: (a)= 0.30%. (e) ˛ = 0◦ and C = 0.35%. (f) ˛ = 6◦ and C = 0.35%. (g) ˛ = 0◦ and C = 0.40%. (h) ˛ = 6◦
Fluid Mech. 158 (2009) 73–84 79
regime where the dominant forces were the viscous forces andgravity acceleration. The flow-depth gradient in the streamwise
direction was close to zero except for the tip region.e) At time t = 52 min, the gel was still moving at 12 cm/h. Channel-ization could be observed, as described in Section 3.3 in moredetail.
ne), 2 (solid line), 20 (dashed line), 200 (dashed–dotted line), 2000 (solid line) and˛ = 0◦ and C = 0.25%. (b) ˛ = 6◦ and C = 0.25%. (c) ˛ = 0◦ and C = 0.30%. (d) ˛ = 6◦ andand C = 0.40%.

8 tonia
tsft
tlb
3
It
F2a
0 S. Cochard, C. Ancey / J. Non-New
In brief, we observed two regimes: at the very beginning (t ≤ 1 s),he flow was in an inertial regime; the front velocity was nearly con-tant. Then, quite abruptly, a pseudo-equilibrium regime occurred,or which the front velocity decayed as a power-law function ofime.
The inertial regime depends on the mass of fluids as well ashe initial height. The same mass of fluid, in a different reservoir,eading to another initial height would have resulted in a differentehavior of the inertial regime.
t(i0
ig. 15. Flow-depth profiles and contact line at t = 0.4 (dashed line), 0.8 (dashed–dotted li0,000 s (dashed line). Time variation in the front position. Experimental conditions: (a)nd C = 0.30%. (e) ˛ = 12◦ and C = 0.35%. (f) ˛ = 18◦ and C = 0.35%. (g) ˛ = 12◦ and C = 0.40%. (h
n Fluid Mech. 158 (2009) 73–84
.2. Front position, contact line, and flow-depth profile
Figs. 14 and 15 summarize the measurements taken for each run.n a condensed form, we plot the flow-depth profile (measured athe centerline), the contact line, and the evolution of the front posi-
ion. Each column in Figs. 14 and 15 is related to a fixed inclination0◦, 6◦, 12◦, and 18◦) while the rows present results correspond-ng to the same Carbopol concentration (0.25%, 0.30%, 0.35% and.40%). For each plot, the flow-depth profiles taken at time t = 0.4,ne), 2 (solid line), 20 (dashed line), 200 (dashed–dotted line), 2000 (solid line) and˛ = 12◦ and C = 0.25%. (b) ˛ = 18◦ and C = 0.25%. (c) ˛ = 12◦ and C = 0.30%. (d) ˛ = 18◦
) ˛ = 18◦ and C = 0.40%.

S. Cochard, C. Ancey / J. Non-Newtonian Fluid Mech. 158 (2009) 73–84 81
0pthoN4mptx
ctF
•
•
•
F
•
•
Balmforth et al. [10] for the dam-break problem on horizontalplanes.
Fig. 16. Front position xf in function of the time t for a slope angle ˛ = 12◦ .
.8, 2, 20, 200, 2 × 10³, and 2 × 10⁴ s are reported in the upper halfart; the left axis gives elevation z. The contact lines measured athe same time as the flow-depth profiles are plotted in the loweralf part of the plot. The front position xf is plotted as a functionf time in a log-linear diagram; time t is reported on the right axis.ote that x = 0 corresponds to the rear end of the reservoir, while the-cm-thick gate is located at x = 51–55 cm. To guaranty an accurateeasurement of the surge free-surface, the acquisition setup was
ositioned to record from x = 55 cm (the position of the dam-gate)o x = 190 cm. The acquisition was stopped once the front positionf had reached 190 cm or after 8 h.
As expected, we observed that gels with the lowest Carbopoloncentrations flowed faster and farther. Similarly, the steeperhe inclination was, the faster the flows. Comparing the plots inigs. 14 and 15 leads to further interesting observations:
The typical duration Ti of the inertia-dominated regime was onthe order of 1 s. Taking a closer look at our data reveals a slightdependence of Ti on plane inclination. Strikingly enough, Ti seemsto be independent of Carbopol concentration C, although thefront position and velocity were influenced by C. A typical exam-ple is provided in Fig. 16, where we report the front positionas a function of time for ˛ = 12◦ and different C values. For allconcentrations, Ti was about 1 s. The distance at which the transi-tion from an inertial to a near-equilibrium regimes was observeddepended on solid concentration: it increased from 120 to 145 cmwhen the concentration was increased from 0.25% to 0.4%.During the inertial phase, the front velocity was nearly constant(e.g., see Fig. 12). This contrasts somehow with what we knowof inertial flows. For inviscid fluids instantaneously released ona dry horizontal plane, dam-break theory predicts that the frontvelocity uf does not vary with time, but solely with the initialflow depth h0: uf =
√2gh0 (Ritter’s solution); for sloping beds,
the front is continuously accelerating [54]. If we take the exampleof Fig. 12, the front velocity was about 70 cm/s, whereas an esti-mate of the front velocity for the Ritter solution is uf = 2.4 m/s,i.e. a factor of 3.5 higher than the velocity was observed. Thisclearly shows that even in the inertia-dominated regime, viscousdissipation played a non-negligible role.The shape of the free surface depended a great deal on slope, but
weakly on Carbopol concentration. Fig. 17 reports the flow-depthprofile together with the contact line for four different concen-trations in Carbopol. All measurements were taken for a 12◦inclination and when the front reached the position xf = 138 cm. F
ig. 17. Surge profile and contact line for a front position xf = 138 cm and ˛ = 12◦ .
Note that all profiles were quite similar. Interestingly enough,we can also point out that the flows were in a near-equilibriumregime except for the flow at C = 0.25% (which was still in aninertia-dominated regime). The maximum height difference wason the order of 6 mm, while the maximum difference in the lat-eral spread was lower than 2 cm. As shown in Fig. 18, where weplot the flow-depth profile and contact line for ˛ = 6◦ and 18◦
(other parameters being the same), slope has great influence onthe free-surface shape.Lateral spreading mostly occurred during the inertial phase, asseen on each plot of Figs. 14 and 15. Plane inclination had littleinfluence on lateral spreading, as illustrated in Fig. 19, where thecontact lines are reported for different slopes ˛ = 0◦, 6◦, 12◦, and18◦; the Carbopol concentration was the same (C = 0.3%) and thecontact lines were recorded at the same time t = 1.6 s.We did not observe any avalanching mass coming to a halt, evenat shallow slope and with large-yield-stress fluids. This supportsthe theoretical analysis carried out by Matson and Hogg [33] and
ig. 18. Surge profile and contact line for a front position xf = 138 cm and ˛ = 12◦ .

82 S. Cochard, C. Ancey / J. Non-Newtonian Fluid Mech. 158 (2009) 73–84
Fi
rsea
Fp
FC
ig. 19. Contact line at time t = 1.6 s for Carbopol at a concentration of 0.30% downnclined planes.
Another striking observation is that all front-position curveseported in Figs. 14 and 15 are V-shaped. This shape similarityuggests that we can rescale the front position to obtain a crude,
mpirical scaling of xf as a function of the flow parameters. By trialnd error, we found that if we introduce the following dimension-ig. 20. (a) Front position xf as a function of the time t for all runs. (b) Scaled frontosition x̂f as a function of the time t̂ for all runs.
l
t̂
x
wecitHdtte
emfl
3
nmttalodtt
4
fm
ig. 21. Top view of surface structure formation at time t = 2932 s of a test with= 0.25% and ˛ = 12◦ .
ess variables:
= t
Ti, (4)
ˆf = xf
2.561t0.275(sin ˛)1/3(sin ˛)5/4
(�c − 67.66
10.736
)0.141, (5)
here Ti = 1 s is the duration of the inertia-dominated regime, txpressed in s, ˛ in ◦, xf in m, and �c in Pa s, then the data nearlyollapse on the same master curve, as shown in Fig. 20. The collapses not perfect, indicating that this scaling is gross and holds only forhe narrow range of flow conditions explored in our experiments.owever, since similarity theory (or other theoretical arguments)oes not provide any similarity form for the short- and long-ime evolution of the front position (except for limiting cases),his empirical scaling provides some clues to appreciate the influ-nce of the flow parameters on the bulk dynamics. In particular, it
mbodies a time dependency in the form xf ∝ t0.275(sin ˛)5/4, which is
arkedly different from the long-time scaling observed for viscousuids for which xf ∝ t1/3.
.3. Surface structure formation
For all tests, surface structure formation was observed for theear-equilibrium regime (see Fig. 21). Here, ‘surface structure for-ation’ means that several channels formed at the margin of
he avalanching mass. The higher the Carbopol concentration andhe steeper the plane inclination were, the faster the channelsppeared. The channels were almost symmetric about the center-ine and aligned with the flow direction. These structures were notbserved when the mass was confined in a flume [41]. This may beue to surface instabilities, but except for this scenario, we failedo find any reasonable explanation why regular patterns formed onhe free surface.
. Conclusion
To gain insight into the complex behavior of time-dependent,ree-surface flows of viscoplastic materials, we built up an experi-
ental setup, which makes it possible to carefully investigate the

tonian
driasa
sCctrkwvifait
aceziuawtpoinarit
cTmd[
A
Sp(ucf
R
[
[[
[
[
[
[
[
[
[
[
[
[
[
[
[
[
[
[
[
[
[
[
[
[
[
[
[
[
[
[
S. Cochard, C. Ancey / J. Non-New
am-break problem on horizontal and sloping beds in the labo-atory. To track the free-surface evolution, we designed a novelmaging system made up of a high-speed digital camera coupled tosynchronized micro-mirror projector. The precision of our mea-
urement system is on the order of 1 mm on a 1.4 m × 1.4 m surfacet a rate of 45 Hz.
Here we focused on the behavior of a large mass of Carbopoluddenly released on a sloping plane. As a first approximation,arbopol behaves like a Herschel–Bulkley fluid. Sixteen tests werearried out with a 43 kg mass of Carbopol at four different concen-rations, C = 0.25%, 0.30%, 0.35%, and 0.40%. The plane inclinationange from 0◦ to 18◦. The mass and the reservoir dimensions wereept constant. Comparing all runs, we observed that the behavioras nearly the same: at the very beginning, the mass accelerated
igorously on gate opening. We referred to this flow regime as thenertia-dominated regime. Although it had some similarities withully inertial phases observed for inviscid and Newtonian fluids, welso observed substantial differences; in particular, the front veloc-ty was constant and much lower than the front velocity given byhe Ritter solution to the dam-break problem.
Strikingly enough, there was systematically a transition towardsnother flow regime at time t = 1 s whatever the slope or Carbopoloncentration. The latter regime was referred to as the near-quilibrium regime since the flow-depth gradient being close toero, the flow dynamics was dictated by the balance between grav-tational and viscous forces, as in a steady uniform flow. Since wesed fixed volumes of Carbopol, we could have expected to observerun-out phase, where the mass came to a halt. Such a regimeas never observed in our experiments. A remarkable feature of
he near-equilibrium regime is that the front position varied as aower function of time over several decades. Another interestingbservation concerns flow organization: lateral spreading occurredn the first instants, in the inertia-dominated regime, then becameegligible. Because of yield stress, part of the fluid was abandonedt the lateral margins and formed levees that confined the yieldedegion, giving the appearance of a self-channelized flow. Surpris-ngly enough, the free surface became increasingly corrugated overime owing to “valley” formation in the streamwise direction.
Our results may be of significance to numericists and theoreti-ians investigating non-Newtonian flows in complex geometries.he present work may also interest geophysicists since viscoplasticodels are commonly used to describe natural gravity-driven flows
own steep slopes such as mud flows [11,57,58], snow avalanches59,60], and lava flows [13].
cknowledgements
The work presented here was supported by the Swiss Nationalcience Foundation under grant number 200021-105193, the com-etence center in Mobile Information and Communication Systemsa center supported by the Swiss National Science Foundationnder grant number 5005-67322, MICS project), the competenceenter in Environmental Sciences (TRAMM project), and specificunds provided by EPFL (vice-présidence à la recherche).
eferences
[1] N. Pashias, D. Boger, A fifty cent rheometer for yield stress measurement, J.Rheol. 40 (1996) 1179–1189.
[2] W. Schowalter, G. Christensen, Toward a rationalization of the slump test for
fresh concrete: comparisons of calculations and experiments, J. Rheol. 42 (1999)865–870.[3] C. Ancey, H. Jorrot, Yield stress for particle suspensions within a clay dispersion,J. Rheol. 45 (2001) 297–319.
[4] A. Saak, H. Jennings, S. Shah, A generalized approach for the determination ofyield stress by slump and slump flow, Cem. Concr. Res. 34 (2004) 363–371.
[
[
Fluid Mech. 158 (2009) 73–84 83
[5] N. Roussel, P. Coussot, “Fifty-cent rheometer” for yield stress measurements:from slump to spreading flow, J. Rheol. 49 (2005) 705–718.
[6] J.-M. Piau, Consistometry slump and spreading tests: practical comments, J.Non-Newtonian Fluid Mech. 135 (2006) 177–178.
[7] P. Perona, Bostwick degree and rheological properties: an up-do-date view-point, Appl. Rheol. 15 (2005) 218–229.
[8] J.-M. Piau, Axisymmetric slump and spreading of cohesive plastic soft mate-rials: a yield stress measurement by consisto-rheometry, J. Rheol. 49 (2005)1253–1276.
[9] R. Milczarek, K. McCarthy, Relationship between the Bostwick measurementand fluid properties, J. Texture Stud. 37 (2006) 640–654.
10] N. Balmforth, R. Craster, P. Perona, A. Rust, R. Sassi, Viscoplastic dam breaks andthe Bostwick consistometer, J. Non-Newtonian Fluid Mech. 142 (2007) 63–78.
11] P. Coussot, Mudflow Rheology and Dynamics, Balkema, Rotterdam, 1997.12] C. Ancey, Plasticity and geophysical flows: a review, J. Non-Newtonian Fluid
Mech. 142 (2007) 4–35.13] R. Griffiths, The dynamics of lava flows, Annu. Rev. Fluid Mech. 32 (2000)
477–518.14] P. Smith, A similarity solution for slow viscous flow down an inclined channel,
J. Fluid Mech. 58 (1973) 275–288.15] H. Huppert, The propagation of two-dimensional and axisymetric viscous
gravity currents over a rigid horizontal surface, J. Fluid Mech. 121 (1982)43–58.
16] J. Lister, Viscous flows down an inclined plane from point and line sources, J.Fluid Mech. 242 (1992) 631–653.
17] J. Simpson, Gravity Currents in the Environment and the Laboratory, CambridgeUniversity Press, Cambridge, 1997.
18] K. Liu, C. Mei, Slow spreading of a sheet of Bingham fluid on an inclined plane,J. Fluid Mech. 207 (1990) 505–529.
19] C. Mei, M. Yuhi, Slow flow of a Bingham fluid in a shallow channel of finitewidth, J. Fluid Mech. 431 (2001) 135–159.
20] N. Balmforth, A. Burbridge, R. Craster, Viscoplastic models of isothermal lavadomes, J. Fluid Mech. 403 (2000) 37–65.
21] N. Balmforth, R. Craster, R. Sassi, Shallow viscoplastic flow on an inclined plane,J. Fluid Mech. 470 (2002) 1–29.
22] N. Balmforth, R. Craster, R. Sassi, Dynamics of cooling viscoplastic domes, J.Fluid Mech. 499 (2004) 149–182.
23] N. Balmforth, R. Craster, A. Rust, R. Sassi, Viscoplastic flow over an inclinedsurface, J. Non-Newtonian Fluid Mech. 142 (2007) 219–243.
24] S. Wilson, S. Burgess, The steady, spreading flow of a rivulet of mud, J. Non-Newtonian Fluid Mech. 79 (1998) 77–85.
25] S. Wilson, B. Duffy, R. Hunt, A slender rivulet of a powder-law fluid driven byeither gravity or a constant shear stress at the free surface, Quart. J. Mech. Appl.Math. 55 (2002) 385–408.
26] P. Coussot, S. Proust, Slow, unconfined spreading of a mudflow, J. Geophys. Res.B101 (1996) 25217–25229.
27] P. Coussot, S. Proust, C. Ancey, Rheological interpretation of deposits of yieldstress fluids, J. Non-Newtonian Fluid Mech. 66 (1996) 55–70.
28] D. Osmond, R. Griffiths, The static shape of yield strength fluids slowly emplacedon slopes, J. Geophys. Res. B 106 (2001) 16241–16250.
29] M. Yuhi, C. Mei, Slow spreading of fluid mud over a conical surface, J. FluidMech. 519 (2004) 337–358.
30] X. Huang, M. Garcìa, A perturbation solution for Bingham-plastic mudflows, J.Hydraul. Eng. 123 (1997) 986–994.
31] X. Huang, M. Garcìa, A Herschel–Bulkley model for mud flow down a slope, J.Fluid Mech. 374 (1998) 305–333.
32] H. Chanson, S. Jarny, P. Coussot, Dam break wave of thixotropic fluid, J. Hydraul.Eng. 132 (2006) 280–293.
33] G. Matson, A. Hogg, Two-dimensional dam break flows of Herschel–Bulkleyfluids: the approach to the arrested state, J. Non-Newtonian Fluid Mech. 142(2007) 79–94.
34] A. Hogg, D. Pritchard, The effects of hydraulic resistance on dam-break andother shallow inertial flows, J. Fluid Mech. 501 (2004) 179–212.
35] D. Laigle, A.-F. Hector, J. Hübl, D. Rickenmann, Comparison of numerical sim-ulation of muddy debris flow spreading to records of real events, in: D.Rickenmann, C. Chen (Eds.), Debris Flow Hazard and Mitigation, ASCE, Davos,2003.
36] M. Pastor, M. Quecedo, E. González, M. Herreros, J. Fernández, P. Mira, Simpleapproximation to bottom friction for Bingham fluid depth integrated models,J. Hydraul. Eng. 130 (2004) 149–155.
37] A. Siviglia, A. Cantelli, Effect of bottom curvature on mudflow dynamics: theoryand experiments, Water Resour. Res. 41 (2005) W11423.
38] K. Debiane, Hydraulique des écoulements laminaires à surface libre dans uncanal pour des milieux visqueux ou viscoplastiques, Ph.D. thesis, UniversitéJoseph Fourier Grenoble, 2000.
39] P. Stansby, A. Chegini, T. Barnes, The initial stages of dam-break flow, J. FluidMech. 370 (1998) 203–220.
40] S. Cochard, C. Ancey, Tracking the free surface of time-dependent flows: imageprocessing for the dam-break problem, Exper. Fluids 44 (2008) 59–71.
41] C. Ancey, S. Cochard, The dam-break problem for Herschel–Bulkley viscoplas-tic fluids down steep flumes, J. Non-Newtonian Fluid Mech 158 (2009)18–35.
42] S. Cochard, Measurements of time-dependent free-surface viscoplastic flowsdown steep slopes, Ph.D. thesis, Ecole Polytechnique Fédérale de Lausanne,2007.

8 tonia
[
[
[
[
[
[
[
[
[
[
[
[
[
4 S. Cochard, C. Ancey / J. Non-New
43] H. Barnes, K. Walters, The yield stress myth? Rheol. Acta 24 (1985)324–326.
44] P. Coussot, Q. Nguyen, H. Huynh, D. Bonn, Avalanche behavior in yield stressfluids, Phys. Rev. Lett. 88 (2002) 175501.
45] P. Møller, J. Mewis, D. Bonn, Yield stress and thixotropy: on the difficulty ofmeasuring yield stresses in practice, Soft Matter 2 (2006) 274–283.
46] J.-M. Piau, Carbopol gels: elastoviscoplastic and slippery glasses made ofindividual swollen sponges meso- and macroscopic properties, constitutiveequations and scaling laws, J. Fluid Mech. 144 (1) (2007) 1–29.
47] Y. Yeow, W. Ko, P. Tang, Solving the inverse problem of Couette viscometry byTikhonov regularization, J. Rheol. 44 (2000) 1335–1351.
48] C. Ancey, Solving the Couette inverse problem by using a waveletvaguelettedecomposition, J. Rheol. 49 (2005) 441–460.
49] H.A. Barnes, Thixotropy—a review, J. Non-Newtonian Fluid Mech. 70 (1997)1–33.
50] G. Roberts, H. Barnes, New measurements of the flow-curves for Carbopol dis-persions without slip artefacts, Rheol. Acta 40 (2001) 499–503.
[[
[
n Fluid Mech. 158 (2009) 73–84
51] H. Barnes, Q. Nguyen, Rotating vane rheometry—a review, J. Non-NewtonianFluid Mech. 98 (2001) 1–14.
52] C.-S. Wu, Y. Kwak, Characterization of microgels by Brookfield viscometry withcylindrical, t-bar, and flags impeller spindles, J. Appl. Polym. Sci. 71 (1999)67–74.
53] C. Wu, G. Huang, Y. Zheng, Theoretical solution of dam-break shock wave, J.Hydraul. Eng. 125 (1999) 1210–1220.
54] C. Ancey, M. Rentschler, R. Iverson, R.P. Denlinger, An exact solution for idealdam-break floods on steep slopes, Water Resour. Res. 44 (2008)W01430.
57] A. Johnson, J. Rodine, Debris flow, in: D. Brunsden, D. Prior (Eds.), Slope Insta-bility, John Wiley & Sons, Chichester, 1984, pp. 257–362.
58] Z. Wan, Z. Wang, Hypercontrated Flow, Balkema, Rotterdam, 1994.59] J. Dent, T. Lang, Experiments on the mechanics of flowing snow, Cold Regions
Sci. Technol. 5 (1982) 243–248.60] C. Ancey, Snow avalanches, in: N. Balmforth, A. Provenzale (Eds.), Geomorpho-
logical Fluid Mechanics: Selected Topics in Geological and GeomorphologicalFluid Mechanics, Springer, Berlin, 2001, pp. 319–338.