Embed Size (px)
Citation preview

Contents lists available at SciVerse ScienceDirect
Journal of Financial Economics
Journal of Financial Economics 106 (2012) 91–113
0304-40
http://d
$ We
Gary G
Willen,
Board, F
London
Pennsyl
Researc
particip
Yale Fi
Society
editor
Waldoc
research
School.
Science
cially gr
for assi
swap dn Corr
E-m
journal homepage: www.elsevier.com/locate/jfec
Securitization without adverse selection: The case of CLOs$
Efraim Benmelech a, Jennifer Dlugosz b,n, Victoria Ivashina c
a Harvard University and NBER, Littauer Center, Cambridge, MA 02138, USAb Federal Reserve Board, 20th & C St. NW, Washington, DC 20551, USAc Harvard Business School, Baker Library 233, Boston, MA 02163, USA
a r t i c l e i n f o
Article history:
Received 6 December 2010
Received in revised form
8 August 2011
Accepted 6 September 2011Available online 22 May 2012
JEL classification:
G21
G23
G24
Keywords:
Structured finance
Collateralized loan obligations (CLOs)
CDOs
Syndicated loans
5X/$ - see front matter Published by Elsevier
x.doi.org/10.1016/j.jfineco.2012.05.006
thank Darrell Duffie, Paul Gompers, Jerem
orton, Charlotte Ostergaard, Amit Seru, Ja
seminar participants at Harvard University, t
ederal Reserve Bank of New York, University
School of Economics, Wharton School at
vania, University of Florida, Berkeley, N
h Associates, the World Bank, and the B
ants at the American Finance Association a
nancial Crisis Conference, and the Financ
annual meeting, and especially an anonymo
(Bill Schwert) for helpful comments. Jessi
k provided excellent research assistance.
support from the Division of Research at
Benmelech is grateful for financial support
Foundation under CAREER award SES-0847
ateful to the Loan Syndications & Trading Ass
sting us with secondary market loan prices
ata.
esponding author.
ail address: [email protected] (J. Dlug
a b s t r a c t
In this paper, we investigate whether securitization was associated with risky lending
in the corporate loan market by examining the performance of individual loans held by
collateralized loan obligations. We employ two different data sets that identify loan
holdings for a large set of CLOs and find that adverse selection problems in corporate
loan securitizations are less severe than commonly believed. Using a battery of
performance tests, we find that loans securitized before 2005 performed no worse
than comparable unsecuritized loans originated by the same bank. Even loans
originated by the bank that acts as the CLO underwriter do not show under-
performance relative to the rest of the CLO portfolio. While some evidence exists of
under-performance for securitized loans originated between 2005 and 2007, it is not
consistent across samples, performance measures, and horizons. Overall, we argue that
the securitization of corporate loans is fundamentally different from securitization of
other assets classes because securitized loans are fractions of syndicated loans. There-
fore, mechanisms used to align incentives in a lending syndicate are likely to reduce
adverse selection in the choice of CLO collateral.
Published by Elsevier B.V.
B.V.
y Stein, Greg Nini,
mes Vickery, Paul
he Federal Reserve
of North Carolina,
the University of
ational Economic
rattle Group, and
nnual meeting, the
ial Intermediation
us referee and the
ca Dias and Kate
We acknowledge
Harvard Business
from the National
392. We are espe-
ociation and Markit
and credit default
osz).
1. Introduction
In the third quarter of 2007, structured finance mar-kets ground to a halt after nearly a decade of phenomenalgrowth. Mortgage-backed securities (MBSs) and collater-alized debt obligations (CDOs) suffered a major blow totheir reputation after being tied to a record-breakingwave of downgrades and bank losses. Both academicsand practitioners have blamed securitization for encoura-ging risky lending and for being responsible, in part, forthe recent credit crisis. In particular, several empiricalstudies of MBSs (Keys, Mukherjee, Seru, and Vig, 2010;Drucker and Mayer, 2008; Nadauld and Sherlund, 2009)show that securitization resulted in lower lending stan-dards, which led to adverse selection in the collateralpools underlying these products.
In this paper, we focus on collateralized loan obliga-tions (CLOs), which are CDOs backed by corporate loans.We analyze the performance of loans purchased by CLOs

0
5
10
15
20
25
Bill
ions
of
dolla
rs
Fig. 1. Weekly collateralized loan obligation (CLO) pipeline, 2007–2010.
The figure is compiled using weekly CLO calendars published by Reuters
Gold Sheets. The pipeline indicates CLOs that have not yet closed
(i.e., been issued.).
E. Benmelech et al. / Journal of Financial Economics 106 (2012) 91–11392
between 1997 and 2007 using a battery of performancetests.1 Contrary to the findings in studies of other forms ofsecuritization, we find no consistent evidence that secur-itized corporate loans were riskier than similar loans thatwere not securitized. When looking separately at the early(1997–2004) and late (2005–2007) periods of securitiza-tion, we find mixed evidence concerning the underper-formance of securitized loans originated during the latterperiod. This result is sensitive to the choice of the sample,the horizon over which we measure performance, and theperformance measure we use. Thus, even for the laterperiod of securitization, no consistent evidence exists thatadverse selection played an important role in securitizedlending. Further, when we examine a subset of securitizedloans for which we expect agency problems to be parti-cularly pronounced—loans purchased by the CLO from itsunderwriter—we also find no evidence of under-perfor-mance regardless of the time horizon, sample, or perfor-mance measures used.
While the overall result can be viewed as a negativefinding—we find that securitization is not statisticallysignificant in predicting poor performance—there areimportant positive results in our paper: Adverse selectionis not an inevitable consequence of securitization, and notall securitized markets are the same. The fact that theonly evidence of under-performance of securitized loansis weak and concentrated in the second year among loansoriginated in the 2005–2007 period could be due to thepassive nature of CLOs and overheated market conditionsdriven by large CLO issuance and institutional investors’demand for corporate loans more broadly (Ivashina andSun, 2011a).2 Recent findings by Bord and Santos (2011)indicate, that overheated market conditions during thisperiod were also connected to the reduction in the shareof the loan (‘‘skin in the game’’) retained by the originat-ing bank.3
A potential explanation for the different findingsbetween our paper and those that study mortgage secur-itization has to do with the fact that corporate loans areonly partially securitized. Corporate loans are signifi-cantly larger than mortgages and are typically syndicated;that is, at origination, the loans are funded by a group ofbanks and institutional investors. Fractions of the sameunderlying loan are simultaneously held by multiple CLOsas well as by other institutional investors and banks. Inaddition, the bank that originated the loan (the lead bank)typically retains a fraction of the loan on its balance sheetand each underlying loan is rated. In contrast, subprimemortgages are typically sold in one piece to MBS issuerswith little to no risk retention by the originator. Largecorporate loans, therefore, involve a greater number of
1 Throughout the paper we refer to loans with CLO lenders in the
syndicate as securitized loans or loans purchased by CLOs.2 Consistent with this interpretation, following the 2007–2009
economic crisis, low borrowing costs and loose credit standards
returned ahead of the CLO market’s recovery. See Wall Street Journal
(2010) and Financial Times (2011).3 The time pattern of shrinkage in skin in the game is clearly shown
in Ivashina and Scharfstein (2010).
formal and informal screeners whose reputation is atstake and the loan originator has skin in the game.
We argue that the size of the loan and the syndicationprocess make corporate loans less prone to adverseselection when securitized. Our view is consistent witha large body of research studying the mechanisms thatmitigate asymmetric information in the market for cor-porate loans (Gorton and Pennacchi, 1995; Dennis andMullineaux, 2000; Sufi, 2007; Drucker and Puri, 2009;Ivashina, 2009). These studies find that the lead bank’sretained share and reputation are the key mechanisms forreducing information asymmetry between the originatingbank and other lenders in loan syndication. Therefore,syndication before securitization reduces the potential foradverse selection. Moreover, in contrast to residentialmortgages, corporate loans are large. The average secur-itized corporate loan is roughly $522 million (and theminimum syndicate participation amount is $1–$5 mil-lion) compared with an average loan size of only $150thousand–$190 thousand for residential mortgages. Weargue that if there are fixed costs of monitoring aborrower, investors are more likely to monitor largerloans or assets that make their collateral pools lesssusceptible to adverse selection.
Is it trivial then that securitization of syndicatedcorporate loans is adverse selection–proof? Judging bythe sudden contraction in CLO issuance (along with otherstructured issuance) in the third quarter of 2007 and theabsence of a subsequent rebound, the answer is no (seeFigs. 1 and 2). A simultaneous disconnect between yieldson existing CLO tranches and corporate bonds withsimilar ratings suggests that the market perceived theunderlying problem as specific to structured finance.The disappearance of CLO issuance coincided with thewidespread fear that strong demand for securitizable assetscould have led to risky lending in the corporate sector.4
4 See for example Reuters (2007) ‘‘In the old days of relationship
banking, banks relied on credit quality control and huge balance sheets
to ride out any problems, but CLO investors may be more short-term
oriented. Lack of credit quality control by some managers of CLOs is
particularly frightening to veteran private equity investors. ‘What all of
this will show—and it will show more as CLOs become more popular—is
that risk management has not been very well practiced,’ said billionaire
financier Wilbur Ross, founder of private equity firm WL Ross & Co.’’ See
also Wall Street Journal (2007) ‘‘Investors searching for higher yields
have put so much money into CLOs that even weak companies can get
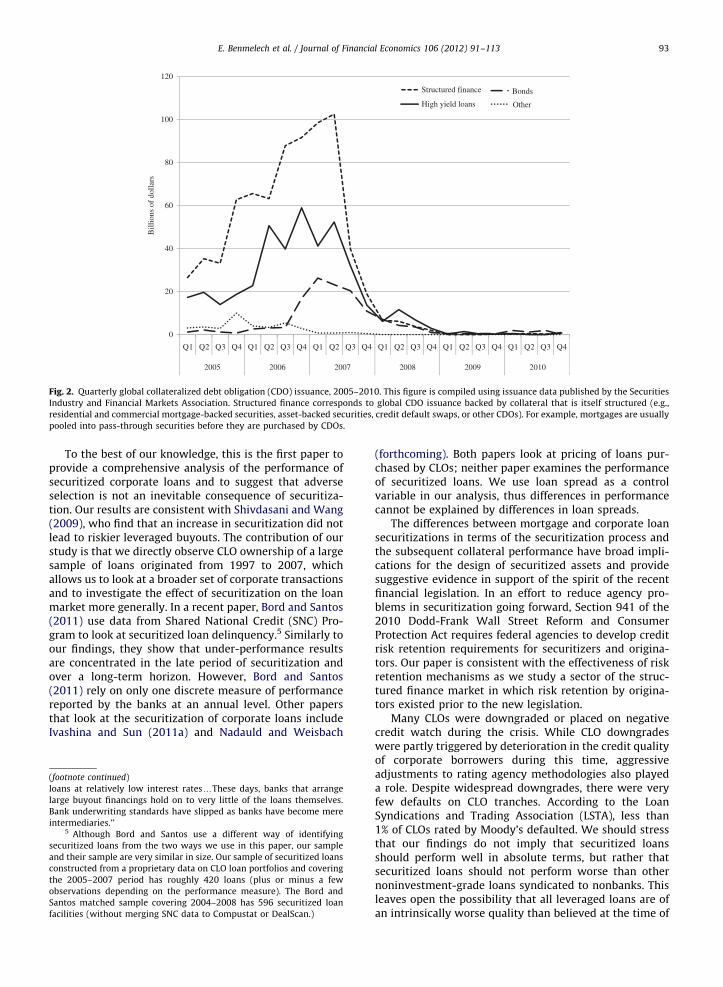
Fig. 2. Quarterly global collateralized debt obligation (CDO) issuance, 2005–2010. This figure is compiled using issuance data published by the Securities
Industry and Financial Markets Association. Structured finance corresponds to global CDO issuance backed by collateral that is itself structured (e.g.,
residential and commercial mortgage-backed securities, asset-backed securities, credit default swaps, or other CDOs). For example, mortgages are usually
pooled into pass-through securities before they are purchased by CDOs.
E. Benmelech et al. / Journal of Financial Economics 106 (2012) 91–113 93
To the best of our knowledge, this is the first paper toprovide a comprehensive analysis of the performance ofsecuritized corporate loans and to suggest that adverseselection is not an inevitable consequence of securitiza-tion. Our results are consistent with Shivdasani and Wang(2009), who find that an increase in securitization did notlead to riskier leveraged buyouts. The contribution of ourstudy is that we directly observe CLO ownership of a largesample of loans originated from 1997 to 2007, whichallows us to look at a broader set of corporate transactionsand to investigate the effect of securitization on the loanmarket more generally. In a recent paper, Bord and Santos(2011) use data from Shared National Credit (SNC) Pro-gram to look at securitized loan delinquency.5 Similarly toour findings, they show that under-performance resultsare concentrated in the late period of securitization andover a long-term horizon. However, Bord and Santos(2011) rely on only one discrete measure of performancereported by the banks at an annual level. Other papersthat look at the securitization of corporate loans includeIvashina and Sun (2011a) and Nadauld and Weisbach
(footnote continued)
loans at relatively low interest ratesyThese days, banks that arrange
large buyout financings hold on to very little of the loans themselves.
Bank underwriting standards have slipped as banks have become mere
intermediaries.’’5 Although Bord and Santos use a different way of identifying
securitized loans from the two ways we use in this paper, our sample
and their sample are very similar in size. Our sample of securitized loans
constructed from a proprietary data on CLO loan portfolios and covering
the 2005–2007 period has roughly 420 loans (plus or minus a few
observations depending on the performance measure). The Bord and
Santos matched sample covering 2004–2008 has 596 securitized loan
facilities (without merging SNC data to Compustat or DealScan.)
(forthcoming). Both papers look at pricing of loans pur-chased by CLOs; neither paper examines the performanceof securitized loans. We use loan spread as a controlvariable in our analysis, thus differences in performancecannot be explained by differences in loan spreads.
The differences between mortgage and corporate loansecuritizations in terms of the securitization process andthe subsequent collateral performance have broad impli-cations for the design of securitized assets and providesuggestive evidence in support of the spirit of the recentfinancial legislation. In an effort to reduce agency pro-blems in securitization going forward, Section 941 of the2010 Dodd-Frank Wall Street Reform and ConsumerProtection Act requires federal agencies to develop creditrisk retention requirements for securitizers and origina-tors. Our paper is consistent with the effectiveness of riskretention mechanisms as we study a sector of the struc-tured finance market in which risk retention by origina-tors existed prior to the new legislation.
Many CLOs were downgraded or placed on negativecredit watch during the crisis. While CLO downgradeswere partly triggered by deterioration in the credit qualityof corporate borrowers during this time, aggressiveadjustments to rating agency methodologies also playeda role. Despite widespread downgrades, there were veryfew defaults on CLO tranches. According to the LoanSyndications and Trading Association (LSTA), less than1% of CLOs rated by Moody’s defaulted. We should stressthat our findings do not imply that securitized loansshould perform well in absolute terms, but rather thatsecuritized loans should not perform worse than othernoninvestment-grade loans syndicated to nonbanks. Thisleaves open the possibility that all leveraged loans are ofan intrinsically worse quality than believed at the time of

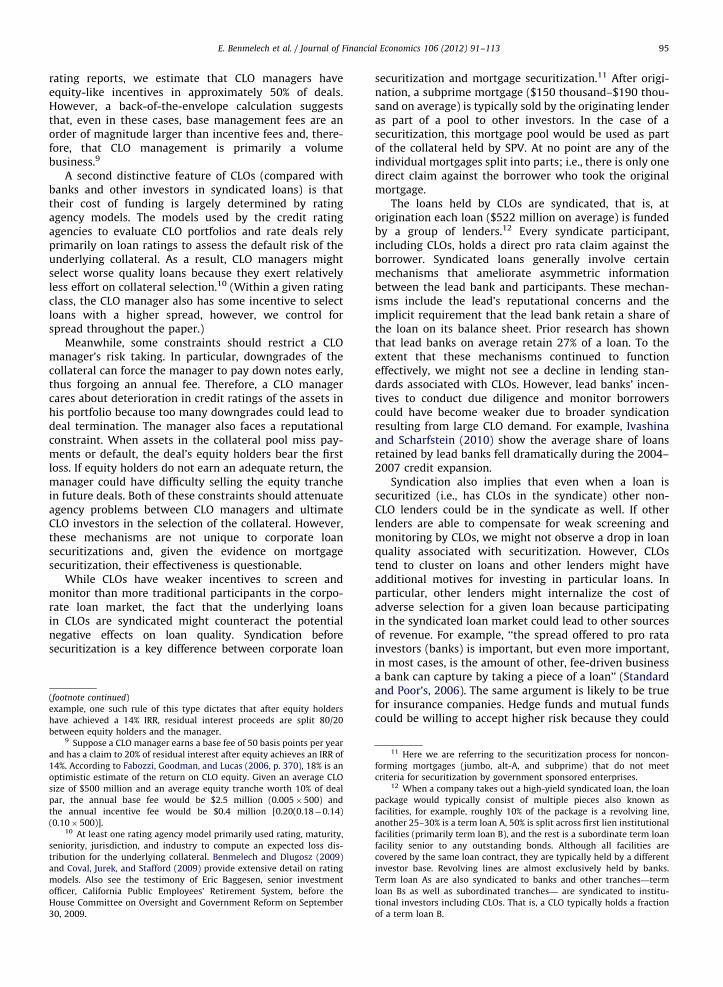
Fig. 3. Collateralized loan obligation (CLO) structuring. This figure illustrates different steps involved in the securitization of corporate loans and
highlights involvement of different agents (CLO manager, underwriter, etc.) during the separate stages of the process.
(footnote continued)
of securitization. This type of CLO in which the issuer did not originate
the loans is referred to as an arbitrage CLO.7 When talking about lenders or investors in loans, we use the term
‘‘CLO investor’’ to refer to special purpose vehicles that directly invest in
syndicated loans. ‘‘Ultimate investors in CLOs’’ refers to individuals,
funds, or companies that purchase the securities issued by the CLO (e.g.,
insurance companies that bought AAA-rated CLO tranches). The differ-
ence between these two entities is illustrated in Fig. 3. We classify a loan
E. Benmelech et al. / Journal of Financial Economics 106 (2012) 91–11394
loan origination. Also, by design, CLOs primarily acquirenoninvestment-grade securities so the pool of securitizedloans should be expected to under-perform the overallpopulation of loans.
The rest of the paper is organized as follows. Section 2highlights the key informational frictions involved in thesecuritization of corporate loans. Section 3 describes thedata, including how we identify securitized loans andmeasure performance. Section 4 presents the empiricalresults, and Section 5 concludes.
2. Collateralized loan obligations and adverse selection
Our results are organized around two hypothesesrelated to the central channels that could lead to adverseselection in the quality of CLO collateral:
H1 (extensive margin). Loans syndicated to CLOs (securi-
tized loans) are worse quality than other syndicated loans
(unsecuritized loans).
H2 (intensive margin). Securitized loans arranged by the
bank underwriting the CLO are worse quality than other
securitized loans within the same portfolio. (This hypothesis
is conditional on securitization.)
Because adverse selection in CLO collateral may beobservable only ex post, we focus on ex post performancecontrolling for loan characteristics at origination,
2.1. CLOs and the effects of securitization (H1)
The key friction underlying the securitization processis asymmetric information about loan quality. Fig. 3illustrates the different steps in the securitization processand the agents involved. To structure a CLO, a collateralmanager—(typically an investment management compa-ny)—sets up a bankruptcy-remote special purpose vehicle(SPV).6 The collateral manager then assembles a collateralportfolio by acquiring pieces of syndicated corporate
6 A bank can structure a CLO backed by loans it originated to reduce
its risk exposure. However, the Securities Industry and Financial Markets
Association reports that, in 2007, 97% of CLOs were structured by
financial institutions that did not originate loans and instead acquired
pieces of loans at syndication or in the secondary market for the purpose
loans, engages with the underwriter and credit ratingagency to structure and rate the deal, and issues securitiesto investors backed by the principal and interest pay-ments from the loans. (These CLOs, also known as cashflow or cash CLOs, are the focus of our paper.) A CLO’scollateral pool typically consists of more than a hundredparticipations in different syndicates. The average CLOsize is $500 million, and the average size of an individualloan holding in a CLO portfolio is $2 million to $3 million.(While the average size of a high-yield syndicated loan is$522 million, each participant in the syndicate financesonly a fraction of the loan, hence the small size ofindividual loan holdings in a CLO portfolio.) Becausemultiple agents are involved, there is between the origi-nating banks, the CLO manager, and the ultimate inves-tors in the CLO, an information cascade, where theoriginating bank is best informed and ultimate investorsin the CLO are worst informed about loan quality.7 CLOsdiffer from other institutions that participate in the high-yield loan market in several ways that could result in CLOmanagers having weaker incentives to screen and moni-tor than other market participants. First, CLO managers’compensation is only weakly tied to deal performance.CLO managers receive a base fee on the order of 40–50basis points (bps) per year, typically senior to all notes(Tavakoli, 2003, p. 120). CLO managers are not required tohold equity in the deal, but in some cases they own ashare of the equity, receive an incentive fee that issubordinate to equity, or have a partial claim on theresidual interest.8 Judging from a random sample of CLO
as securitized if it was acquired by an SPV. In the data, we do not observe
the ultimate investors in CLOs.8 An example of an incentive management fee taken from the
Benmelech and Dlugosz (2009) sample is that the manager receives an
incentive fee after equity has achieved an internal rate of return (IRR) of
14%. A manager can have a partial claim on the residual interest without
owning equity if the cash flow waterfall specifies profit sharing. For
E. Benmelech et al. / Journal of Financial Economics 106 (2012) 91–113 95
rating reports, we estimate that CLO managers haveequity-like incentives in approximately 50% of deals.However, a back-of-the-envelope calculation suggeststhat, even in these cases, base management fees are anorder of magnitude larger than incentive fees and, there-fore, that CLO management is primarily a volumebusiness.9
A second distinctive feature of CLOs (compared withbanks and other investors in syndicated loans) is thattheir cost of funding is largely determined by ratingagency models. The models used by the credit ratingagencies to evaluate CLO portfolios and rate deals relyprimarily on loan ratings to assess the default risk of theunderlying collateral. As a result, CLO managers mightselect worse quality loans because they exert relativelyless effort on collateral selection.10 (Within a given ratingclass, the CLO manager also has some incentive to selectloans with a higher spread, however, we control forspread throughout the paper.)
Meanwhile, some constraints should restrict a CLOmanager’s risk taking. In particular, downgrades of thecollateral can force the manager to pay down notes early,thus forgoing an annual fee. Therefore, a CLO managercares about deterioration in credit ratings of the assets inhis portfolio because too many downgrades could lead todeal termination. The manager also faces a reputationalconstraint. When assets in the collateral pool miss pay-ments or default, the deal’s equity holders bear the firstloss. If equity holders do not earn an adequate return, themanager could have difficulty selling the equity tranchein future deals. Both of these constraints should attenuateagency problems between CLO managers and ultimateCLO investors in the selection of the collateral. However,these mechanisms are not unique to corporate loansecuritizations and, given the evidence on mortgagesecuritization, their effectiveness is questionable.
While CLOs have weaker incentives to screen andmonitor than more traditional participants in the corpo-rate loan market, the fact that the underlying loansin CLOs are syndicated might counteract the potentialnegative effects on loan quality. Syndication beforesecuritization is a key difference between corporate loan
(footnote continued)
example, one such rule of this type dictates that after equity holders
have achieved a 14% IRR, residual interest proceeds are split 80/20
between equity holders and the manager.9 Suppose a CLO manager earns a base fee of 50 basis points per year
and has a claim to 20% of residual interest after equity achieves an IRR of
14%. According to Fabozzi, Goodman, and Lucas (2006, p. 370), 18% is an
optimistic estimate of the return on CLO equity. Given an average CLO
size of $500 million and an average equity tranche worth 10% of deal
par, the annual base fee would be $2.5 million (0.005�500) and
the annual incentive fee would be $0.4 million [0.20(0.18�0.14)
(0.10�500)].10 At least one rating agency model primarily used rating, maturity,
seniority, jurisdiction, and industry to compute an expected loss dis-
tribution for the underlying collateral. Benmelech and Dlugosz (2009)
and Coval, Jurek, and Stafford (2009) provide extensive detail on rating
models. Also see the testimony of Eric Baggesen, senior investment
officer, California Public Employees’ Retirement System, before the
House Committee on Oversight and Government Reform on September
30, 2009.
securitization and mortgage securitization.11 After origi-nation, a subprime mortgage ($150 thousand–$190 thou-sand on average) is typically sold by the originating lenderas part of a pool to other investors. In the case of asecuritization, this mortgage pool would be used as partof the collateral held by SPV. At no point are any of theindividual mortgages split into parts; i.e., there is only onedirect claim against the borrower who took the originalmortgage.
The loans held by CLOs are syndicated, that is, atorigination each loan ($522 million on average) is fundedby a group of lenders.12 Every syndicate participant,including CLOs, holds a direct pro rata claim against theborrower. Syndicated loans generally involve certainmechanisms that ameliorate asymmetric informationbetween the lead bank and participants. These mechan-isms include the lead’s reputational concerns and theimplicit requirement that the lead bank retain a share ofthe loan on its balance sheet. Prior research has shownthat lead banks on average retain 27% of a loan. To theextent that these mechanisms continued to functioneffectively, we might not see a decline in lending stan-dards associated with CLOs. However, lead banks’ incen-tives to conduct due diligence and monitor borrowerscould have become weaker due to broader syndicationresulting from large CLO demand. For example, Ivashinaand Scharfstein (2010) show the average share of loansretained by lead banks fell dramatically during the 2004–2007 credit expansion.
Syndication also implies that even when a loan issecuritized (i.e., has CLOs in the syndicate) other non-CLO lenders could be in the syndicate as well. If otherlenders are able to compensate for weak screening andmonitoring by CLOs, we might not observe a drop in loanquality associated with securitization. However, CLOstend to cluster on loans and other lenders might haveadditional motives for investing in particular loans. Inparticular, other lenders might internalize the cost ofadverse selection for a given loan because participatingin the syndicated loan market could lead to other sourcesof revenue. For example, ‘‘the spread offered to pro ratainvestors (banks) is important, but even more important,in most cases, is the amount of other, fee-driven businessa bank can capture by taking a piece of a loan’’ (Standardand Poor’s, 2006). The same argument is likely to be truefor insurance companies. Hedge funds and mutual fundscould be willing to accept higher risk because they could
11 Here we are referring to the securitization process for noncon-
forming mortgages (jumbo, alt-A, and subprime) that do not meet
criteria for securitization by government sponsored enterprises.12 When a company takes out a high-yield syndicated loan, the loan
package would typically consist of multiple pieces also known as
facilities, for example, roughly 10% of the package is a revolving line,
another 25–30% is a term loan A, 50% is split across first lien institutional
facilities (primarily term loan B), and the rest is a subordinate term loan
facility senior to any outstanding bonds. Although all facilities are
covered by the same loan contract, they are typically held by a different
investor base. Revolving lines are almost exclusively held by banks.
Term loan As are also syndicated to banks and other tranches—term
loan Bs as well as subordinated tranches— are syndicated to institu-
tional investors including CLOs. That is, a CLO typically holds a fraction
of a term loan B.

13 Amendments and the signing lenders are typically disclosed as a
part of 10-Q and 10-K Securities and Exchange Commission filings (see
Ivashina and Sun, 2011b). The focus on the first loan amendment is to
assure that it is close to the loan origination date, i.e., we are capturing
loans that were intended to be securitized at origination.
E. Benmelech et al. / Journal of Financial Economics 106 (2012) 91–11396
use information obtained in the loan market to trade inother securities (Ivashina and Sun, 2011b). In general, thesyndicated loan market is a private market, and access todeal flow might be another reason that investors wouldbe willing to pay an additional cost on some loans.Ultimately, whether securitization led to risky lending inthe corporate loan market is an empirical question.
2.2. Effects of underwriting in securitization (H2)
In addition to the collateral manager, a CLO has anunderwriter (typically a bank) responsible for screeningthe loan portfolio and working with the rating agencies toget CLO tranches rated, priced, and allocated. In essence,the role of an underwriter in CLO deals is similar to therole of an underwriter in stock or bond issuance. Ascompensation, the underwriter receives a fee on thenotional value of the deal. While the collateral managerhas formal authority over asset selection, the underwritercould exert influence over collateral choice. Although thepresence of an underwriter should improve the screeningof the underlying collateral, underwriting banks could usethis channel to sell fractions of their own riskier loans toCLOs. Put differently, even if CLOs do not end up withworse quality loans than other loan investors on average,they could end up with worse quality loans when theybuy them from the underwriter of their deal. We estimatethat about 10% of loans sold to CLOs were originated bythe CLO underwriter.
3. Data
To test the first hypothesis we employ two differentsamples that identify loans held by CLOs. The first sample(the at-origination sample) includes loans originatedbetween 1997 and May 2007. In this sample, we deter-mine whether a loan was securitized by checking for thepresence of CLOs in the lending syndicate at the time oforigination and at the time of the first loan amendment.
The second sample (the portfolio sample) is con-structed using a proprietary source that enables us toobserve the complete portfolios of a comprehensive set ofCLOs. These data consist of monthly CLO trustee reportscovering the period between July 2008 and January 2010.Loans that appear in the CLOs’ portfolios are labeled assecuritized.
3.1. The first sample: at-origination sample
To identify loans that were purchased by CLOs atorigination we start with the sample of loans to UScompanies (public and private) reported in Reuters’ Deal-Scan containing term loan B or C facilities. We alsoinclude all term loans with a credit rating that havenonbank institutions, such as hedge funds, mutual funds,pension funds, distressed funds, or structured financialvehicles, in the lending syndicate.
Generally speaking, two distinct investor groups existin the loan market: banks (the traditional investors) andinstitutional investors. Institutional investors, includingCLOs, primarily participate in the noninvestment-grade
(leveraged) segment of the loan market and compete forthe same loans. Term loans B and C are specificallystructured for nonbank, institutional investors. The termloan B or C label refers to a facility within a loan package.Data used in the analysis are collapsed to one observation(one facility) per loan. That is, we use the term loan Bfacility where it exists. In cases in which institutionalinvestors are part of the syndicate but there is no termloan B facility, we use term loan C or other term loanfacilities, in that order.
We follow two steps to identify CLO ownership ofloans. First, we search the list of lenders at the time ofsyndication available through DealScan. As a second step,we search the list of lenders at the time of the first loanamendment.13 The identity of the lenders (names of SPVs)is cross-checked with a list of CLOs constructed bycombining information from Reuters CDO pipeline, Stan-dard & Poor’s (S&P) Quarterly CDO Deal List, and S&P’sRatingsDirect.
We supplement the primary market information fromDealScan with data from loan amendments to fullycapture all securitized loans. Information available atthe time of origination might under report CLO ownershipof loans in the presence of warehousing (when banks orother institutions temporarily hold loans with the intentof selling them to CLOs). Not being able to observe CLOownership perfectly might lead us to misclassify secur-itized loans as unsecuritized, biasing the results againstfinding differences in performance between the twogroups.
We mitigate this concern by detecting warehousingthrough loan amendments. Material loan amendments—
changes affecting the spread, maturity, or loan amount—require the unanimous approval of all lenders. In suchcases, the signatures and identities of all the lenders appearat the bottom of the document. We collect the firstmaterial amendment for each loan in our sample andsearch the signers for CLOs. Loan amendments are avail-able to us from 1997 through 2007; accordingly, weconstrain the overall loan sample to this period.
We classify loans as securitized if there is at least oneCLO in the lending syndicate at the time of loan origina-tion or at the first loan amendment. The final samplecontains 487 loans, 302 of which we classify as secur-itized or having CLO investors. Because 185 loans did nothave any CLOs in the syndicate at origination or at thetime of amendment, we classify them as unsecuritized;these loans constitute our control group. The set ofunsecuritized loans is conditional on having a materialloan amendment, which explains the relatively smallsample size. We ran all of the reported tests confiningthe at-origination sample to the 292 loans (out of 302)that had CLOs in the syndicate in DealScan. Perhaps notsurprisingly, the results are practically identical and donot affect the conclusions.

E. Benmelech et al. / Journal of Financial Economics 106 (2012) 91–113 97
For 104 of the 302 securitized loans (34%), we detectCLOs in the syndicate through amendments in addition tothose picked up by DealScan. However, of these 302securitized loans, 292 (97%) had at least one CLO in thesyndicate at origination according to DealScan. In otherwords, most loans that appear in CLOs at the time ofamendment also had at least one CLO in the syndicate atorigination, which should diminish concerns about under-identifying securitization because of warehousing.
We consider several potential sources of selection bias.Tests of the first hypothesis are based on a comparison ofsecuritized (treatment group) and unsecuritized (controlgroup) loans. To ensure that loans in the control groupwere not intended for sale to a CLO at origination, ourcontrol group was constrained to loans with amend-ments.14 Yet, our treatment group includes loans withand without loan amendments, as long as they had a CLOin the syndicate at origination. If amended and una-mended loans are fundamentally different, then ourresults could be biased. However, it is unclear whetherthe presence of an amendment reflects positive or nega-tive news. If observable amendments are a reflection ofsuccessful renegotiations and loans without amendments,in fact, reflect failed renegotiations, then our controlgroup is on average of better quality. Alternatively, ifmost of the firms soliciting amendments and receivingamendments are troubled firms, then our treatmentgroup is on average of better quality. We address thisissue empirically by reexamining the results limiting thesample to amended loans; the results do not change ourconclusions.
Overall, we identify 555 unique CLO investors corre-sponding to 302 securitized loans. On average, our samplecontains six loans per CLO. The median size of a CLOissued during that period was $460 million (Benmelechand Dlugosz, 2009), and the average minimum invest-ment in the institutional loan market is $5 million, hence,as a lower bound, six loans represent roughly 6% of thecollateral pool.15 While the at-origination sample pro-vides only a partial look at each CLO’s collateral pool, weidentify some loans for approximately 60% of outstandingUS CLOs.
3.2. The second sample: portfolio sample
The second sample used in the analysis comesfrom Creditflux, a leading global information source forcredit trading and investing which maintains a compre-hensive database of CDOs and credit hedge funds. Wehave access to the entire Creditflux CLO database, whichincludes monthly trustee reports detailing the complete
14 This is a conservative criterion because all but ten loans that had
CLOs in the syndicate at the time of amendment also had CLOs in the
syndicate at origination; that is, the presence of a CLO in the syndicate at
origination appears to be a reliable proxy of whether the loan is
securitized.15 Many CLOs are not 100% invested or hold other types of securities
in addition to corporate loans. Most CLOs are structured as revolving
pools that allow the manager to turnover 10% to 20% of the collateral per
year during the reinvestment period which is typically the first five to
seven years of the 12 year life of a CLO.
investment portfolios for a large set of CLOs covering theperiod between July 2008 and January 2010. We hand-match the loan portfolios to DealScan and Compustat.Matching to DealScan returns 1,084 unique US corporateloans. The sample covers 277 US CLOs issued between1999 and 2008. Using the total CLO volume tracked by theSecurities Industry and Financial Markets Association(SIFMA), and assuming that CLOs, on average, have a parvalue of $500 million, we estimate that our sample covers46% of CLOs issued between 2003 and 2007. (This is alower-bound estimate of coverage because the SIFMAstatistics include synthetic CLOs.) Comparing this samplewith the one in Benmelech and Dlugosz (2009) indicatesthat the new sample covers 65% of deals issued between2003 and 2007. [This is likely to be an upper-boundbecause Benmelech and Dlugosz (2009) look only atS&P-rated vehicles.]
In this sample, any loan that appears in a CLO’s portfoliois categorized as securitized. As before, a sample ofunsecuritized loans is drawn from the set of loans inDealScan that have term loan B or C facilities or are heldby other institutional investors more broadly. We limit thetreatment and control groups to loans originated betweenJanuary 2005 and July 2007 that mature between 2010 and2015 for two reasons. First, our CLO portfolio observationsspan the period from 2008 to 2010. We could misclassifyearlier loans as unsecuritized if they matured before ourCLO portfolio observations start. Second, the focus of ourstudy is the performance of loans that were originatedwith the intent of being sold to CLOs. Securitization (CLOs’purchases of loans) in the corporate loan market is acontinuous process as opposed to a one-shot deal as inthe MBS market. CLOs are allowed to turnover a limitedportion of their collateral for the first few years of their lifeand loans trade on the secondary market. As a result, loansthat were not owned by CLOs at origination might end upin a CLO portfolio later on. This is especially true for theperiod of 2008 and beyond. Over this period, very few newloans were originated and many companies went bank-rupt, expanding CLOs’ penetration of the loan market.Thus, the potential challenge in the portfolio sample isthe opposite of the one we face in the at-originationsample; we are concerned that we could misclassify loansas securitized (type II error). Limiting the treatment andcontrol groups to loans originated between January 2006and July 2007 renders similar results.
We should also consider the reverse, that is, thepossibility that a loan that was held by CLOs at originationcould later be sold. Using data from our portfolio sample,we find that CLOs tend to hold loans for long periods oftime. If a CLO holds a loan in a given month, theprobability of this loan remaining in the CLO portfolio inthe next month—conditional on the loan remainingoutstanding—is 96% (93% three months later and 89%six months later). This is consistent with Benmelech andDlugosz (2009), who study CLO rating reports and findthat the average CLO permits only limited trading duringthe first third to half of the deal maturity. Thus, only asmall fraction of the CLO portfolio is sold and, therefore,our methodology unlikely to introduce type I error, that is,misclassification of loans as securitized.

16 LSTA looks at each loan that traded in a given quarter and
compares the transaction and MTM price on trade date. For example,
according to the study for the first quarter of 2011, the mean absolute
differential between all trade and MTM prices was 49 bps; the median,
25 bps.
E. Benmelech et al. / Journal of Financial Economics 106 (2012) 91–11398
4. Results
4.1. Measuring performance
Both of our hypotheses are motivated by the asym-metry of information between different parties involvedin the securitization process. Because we cannot directlyobserve the more informed party’s true opinion of a givenloan ex ante, we proxy for it by examining ex postperformance, controlling for observables at the time ofloan origination. For example, if loans sold to CLOs areunobservably worse quality than other syndicated loans,they should perform worse controlling for loan andborrower characteristics at origination.
We use a battery of loan and borrower performancemeasures for our analysis. These measures are: secondarymarket loan prices, loan-level credit rating changes,changes in the borrower’s market-assessed probabilityof default as measured by changes in credit default swap(CDS) spreads, borrower credit quality measured byimplied default probability from a reduced form versionof the Merton (1974) distance-to-default model, andviolations of loan covenants. We use only one facilityper loan because loans are securitized at the facility level.Loan market prices are facility-level. Credit ratings corre-spond to the senior (first-lien) facilities within a loanpackage including the facility that we consider for theanalysis. CDS spreads also correspond to senior debt.Covenant violations affect all facilities under the loanpackage. Implied default probability is a borrower-levelmeasure.
Secondary market loan prices and CDS spreads aredynamically updated, forward-looking measures of per-formance. One advantage of these measures is that theyare not restricted to publicly traded companies. Many ofthe loans in our sample are related to a leveraged buyoutfor which publicly available information ceases to existafter the firms go private. However, loans and CDScontracts continue to trade even if a company is takenprivate, allowing us to measure performance for privatefirms as well. Still, secondary market loan prices and CDSspreads are available only for large and liquid names thusrestricting the sample to the largest borrowers. To over-come this problem we also look at changes in creditratings, implied default probability, and covenant viola-tions. Credit ratings are not updated continuously and area discrete measure of performance, thus implied defaultprobability and covenant violations provide finer mea-sures of performance. While each of these performancemeasures has its limitations, taken together they providea comprehensive evaluation of the performance ofsecuritized loans.
4.1.1. Secondary market loan prices
Secondary market loan prices are the most directmeasure of loan performance. We obtain loan price datafrom two sources. Data for 2006–2010 are from the LoanSyndications and Trading Association Thomson Reuters’Loan Pricing Corporation (LPC) Mark-to-Market (MTM)Pricing which contains monthly averages for bid and askquotes by facility. The data for 1998 through 2004 are
from Altman, Gande, and Saunders (2010). The daily datastart in November 1999; before that the data are monthlyand weekly quotes. Taken together, we have secondarymarket loan prices from 1998 to 2010 excluding 2005.
The LSTA reports quotes and not traded prices, butthese are the numbers used for MTM purposes. LSTA runsa quarterly study on accuracy by comparing MTM pricesto trade prices. According to LSTA MTM prices historicallyhave been a ‘‘very accurate’’ proxy of the transactionprices.16 On a daily basis, dealers price what LSTArequests, which is based on the loans held by the lenderbase. According to LSTA, the pricing service requestspricing on essentially all leveraged syndicated bank loans.As of May 2011, LSTA was pricing 2,600 individual loanfacilities from 1,325 US borrowers. Generally the way theprocess works is that one (or many) customers of theservice add a new loan to their portfolio and then thepricing analysts research the deal and request pricingfrom the lead banks that arranged the deal. Multipledealers price the loans. For a quote to be reported, atleast two dealers are required to report information. LSTAreports equally weighted average quotes across all report-ing dealers.
Not all the loans are traded and not all traded loans aresufficiently liquid to have quotes. Our results usingsecondary market loan prices are conditional on loansbeing traded; furthermore they are conditional on loansbeing traded in the first year following loan originationfor at least six consecutive months. 40% of loans in the at-origination sample and 16% of loans in the portfoliosample meet this requirement and have loan price data.The average first bid in our sample is 99.9 bps (median,100.3 bps). Gupta, Singh, and Zebedee (2008) classifyfacilities as liquid ‘‘if on any day after origination thereis a price quote for that loan in our secondary marketdatabase, and its first quoted bid price is greater than 98(par loan)’’. In the overall DealScan sample, 15% of facil-ities meet these criteria. In our sample, all traded loansmeet these criteria and hence are liquid. This is alsoconfirmed by the fact that the bid-ask spread for loansin our sample is below 1 bp. Overall this is consistent withthe fact that secondary market liquidity is largely drivenby institutional investors as we focus on loans syndicatedto institutional investors (Loan Syndications and TradingAssociation, 2007).
To standardize the data over the entire sample, weconvert everything to monthly averages. For each of thefacilities in our sample, we calculate the percentagechange in loan prices in the two years after loan origina-tion (two windows, year one and year two). To constructthe secondary market price change for a given yearwe calculate the percentage difference between the aver-age mid-quotes in the first and last month within ayear window (mid-quotes are an average of bid and ask).Thus, for a loan originated on January 5, 2005 that starts

E. Benmelech et al. / Journal of Financial Economics 106 (2012) 91–113 99
to trade immediately and trades for the next two years,the first year price change is computed using averagemid-quotes corresponding to January 2006 and January2005. To assure that the price changes are not driven byoutliers we control for the annual price volatility com-puted using monthly averages.
4.1.2. Credit ratings
The second measure we examine is downgrades andupgrades of Moody’s and S&P’s loan ratings. Loan ratingscorrespond to senior-secured loan facilities and comefrom Thomson Reuters Gold Sheets. Ratings data coverthe period between May 2001 and April 2010. We countrating changes if at least one of the rating agenciesmodified its assessment of the loan. Our rating scaleincorporates credit watches so that downgrades includeplacements onto negative credit watch and upgradesinclude placements onto positive credit watch.
Over 99% of facilities in both the at-origination sampleand the portfolio sample are senior-secured making theseratings the appropriate measure of performance.17 Senior-ity is assigned at the loan facility level. If several facilitieswithin the same loan package are senior-secured, thesefacilities are governed by the same loan contract and theyreceive the same priority in repayment. The exception tothis rule are second-lien (subordinated or mezzanine)facilities. However, these represent a very small factionof syndicated loans. Moreover, term loan Bs, the focus ofour study, are by definition first-lien loans. Also, when asyndicated loan is outstanding, seniority is constrained tofirst-lien facilities within the loan package as no otherdebt with the same seniority can be outstanding or issuedlater due to the negative covenants included in a typicalloan contract. In that sense, changes in senior-securedcredit ratings reflect performance of the first-lien facilitiesand, specifically, the institutional facilities in our sample.
Using credit ratings as a measure of performancepotentially introduces a bias against finding under-perfor-mance of securitized loans, as CLO managers would like topick borrowers that will have stable ratings. Credit ratingsare central inputs to the CLO evaluation models used bythe rating agencies and models are typically re-run atregular intervals after issuance to check compliance.In addition, most CLOs include covenants that restrict themanager’s asset allocation by credit rating. Violating thesecovenants or failing a ratings test can trigger acceleratedpay-down of the notes or require the manager to adjust thecollateral pool through sales and purchases.
4.1.3. Credit default swaps
We obtain CDS data from Markit for the periodbetween 2003 and June 2009. CDS spreads measure theamount an investor would have to pay to insure against acompany’s default. As a company’s default risk rises, itsCDS spread increases. We use daily quotes for the CDS
17 Benmelech and Dlugosz (2009) also report that most CLOs are
required to hold no less than 90% of their portfolio in senior secured
loans. Given that CLOs typically hold 5–10% of nonloan collateral in their
portfolios, the share of loans in CLOs that is senior secured is even
higher.
corresponding to the five-year contract on senior unse-cured debt. Thus, changes in these CDS spreads reflectchanges in the default risk of obligations at the same levelof seniority as the institutional facilities in our sample.
For each of the loans in our sample, we calculate thepercentage change in CDS spreads in the two years afterloan origination (two windows, year one and year two).Within a given window, we use first and last CDS quotesto construct our measure. We also control for annualvolatility computed using daily CDS quotes in the sixmonths prior to the beginning of the performancewindow.
4.1.4. Implied probability of default
Because only a subset of the companies in our samplehave CDS trading, we also calculate implied default prob-abilities using the reduced form Merton (1974)-style modeldescribed in Bharath and Shumway (2008). Specifically, welook at the change in the borrower’s implied one-yeardefault probability following loan origination (two win-dows, year one and year two). The t�1 implied defaultprobability (Pt�1) is measured as of month-end in themonth before loan origination. For example, for a loanoriginated on January 5, 2005, the t�1 implied defaultprobability is measured as of month end of December 2004.The change in the implied default probability over year oneis the difference between the values as of month-endDecember 2005 and month-end December 2004. The yeartwo change is calculated as the difference between month-end December 2006 and month-end December 2005.
This measure is based on accounting and stock infor-mation, so we can compute it only for firms with dataavailable in Compustat and the Center for Research inSecurity Prices. Furthermore this is the most indirectmeasure of loan performance as it reflects overall bor-rower creditworthiness. But, unlike credit ratings andcovenant violations, it is a continuous measure ofperformance.
4.1.5. Loan covenant violations
Data on loan covenant violations are compiled fromreading remarks for the loan amendments as reported inDealScan.18 Covenant structure is typically set at the loanpackage level. In other words, a covenant violation wouldaffect every facility under the loan package. Similar tocredit ratings and implied default probability, covenantviolations are not constrained to firms with traded loansor CDS. Given that covenant violations do not necessarylead to credit rating downgrades, they represent a finermeasure of performance. However, covenant violationsare rare (although not as rare as corporate defaults).Due to the limited number of observations, we restrictthe analysis to univariate results and report it as arobustness check.
18 These remarks record waivers of covenant violations in addition
to any changes to the loan contract that might or might not be triggered
by a covenant violation. We read through the comments that contain
search words ‘‘waive,’’ ‘‘failure,’’ ‘‘violation,’’ or ‘‘non-compliance’’ to
assure that these involved financial covenant violations.

Table 1Summary statistics.
This table reports summary statistics for both samples. The at-origination sample contains loans originated between 1997 and May 2007. The portfolio sample contains loans originated between January 2005
and July 2007. Statistics are also split based on the two main hypotheses tested in the paper. Same bank (H2) indicates loans that appeared in a collateralized loan obligation underwritten by their lead arranger.
Loan variables are constructed using DealScan. Minimum assignment is the minimum investment for syndicate participants. Sales at close is taken at the time the loan is closed. Leverage (loan) is the size of the
loan divided by the borrower’s sales at close. All-in-drawn spread is defined as total (fees and interest) annual spread, in basis points, paid over LIBOR for each dollar drawn down from the loan net of upfront fees.
Senior debt rating and Loan rating come from Reuters Gold Sheets (compiled from S&P and Moody’s). Performance pricing dummy indicates that the spread on the loan is tied to the firm’s financial indicators. LBO,
M&A, and Debt repayment dummies indicate the purpose of the loan. In Panel B, financial data correspond to the fiscal year that ended just prior to loan origination. Industries are measured at the two-digit SIC
code level and industry-adjusted figures have the industry median subtracted for the corresponding fiscal year. Compustat variables are as follows: Leverage is Total Long-Term Debt plus Debt in Current
Liabilities divided by Total Assets. Loan size/Assets is the loan size from DealScan divided by Compustat’s Total Assets. Interest coverage is EBITDA divided by Interest and Related Expense. Return on assets (ROA) is
EBITDA divided by Total Assets. Q is [AssetsþMarket Value of Equity – Book Value of Equity – Deferred Taxes]/Assets. Z-score is defined as in Altman (1968). In Panel B, the number of observations corresponds to
the loans for which pre-origination assets are available. All dollar figures are measured in millions.
Panel A: Loan terms
H1: Effects of securitization H2: Effects of underwriting
At-origination sample Portfolio sample At-origination sample
Securitized Diff. Securitized Diff. Same bank Diff.
Yes No t-stat Yes No t-stat Yes No t-stat
Number of loans 302 185 1,084 2,508 104 198
Loan size—mean 522 623 1.96 738 346 9.39 614 474 2.61
Minimum assignment—mean 3.5 3.4 0.56 3.3 3.5 1.33 3.1 3.8 2.42
Sales at loan close—mean 1,788 1,680 0.38 2,617 1,280 3.51 1,711 1,831 0.30
Leverage (loan)—mean 0.72 0.87 1.65 1.09 1.02 0.93 0.70 0.73 0.35
All-in-drawn spread (bps)—mean 304 313 0.81 288 278 1.82 289 313 1.62
All-in-drawn spread (bps)—median 275 300 275 250 275 300
Senior debt rating (borrower)—mean Bþ/B Bþ/B 1.58 Bþ/B Bþ 4.32 Bþ Bþ/B 1.79
Senior debt rating (borrower)—median Bþ Bþ B B Bþ Bþ
Loan rating—mean BB�/Bþ BB�/Bþ 1.29 Bþ BB�/Bþ 3.27 BB�/Bþ BB�/Bþ 0.91
Loan rating—25th percentile BB� BB� BB� BB� BB� BB�
Loan rating—median BB�/Bþ BB� Bþ Bþ BB� Bþ
Loan rating—75th percentile Bþ Bþ B B Bþ Bþ
Performance pricing (dummy)—mean 0.38 0.40 0.52 0.14 0.11 2.14 0.41 0.36 0.95
LBO loan (dummy)—mean 0.44 0.29 3.35 0.61 0.39 12.5 0.45 0.43 0.38
M&A loan (dummy)—mean 0.13 0.18 1.80 0.10 0.12 1.47 0.14 0.12 0.70
Debt repayment loan (dummy)—mean 0.09 0.13 1.75 0.03 0.01 3.93 0.05 0.12 1.94
Panel B: Borrower characteristics (sample matched to Compustat)
At-origination sample Portfolio sample
Securitized loans Unsecuritized loans Diff. Securitized loans Unsecuritized loans Diff.
(N¼220) (N¼166) (N¼347) (N¼634)
Median Mean Std. Dev. Median Mean Std. Dev. t-stat Median Mean Std. Dev. Median Mean Std. Dev. t-stat
Total assets 944 2,184 3,742 804 2,107 4,179 0.19 1,253 8,180 46,292 882 3,140 8,216 2.67
Net sales 782 2,022 3,406 611 1,642 2,790 1.17 1,110 4,405 15,641 698 2,447 8,141 3.51
Market cap. 576 1,144 2,206 603 1,314 2,075 0.66 1,048 2,326 3,568 800 2,543 5,737 0.57
E.
Ben
melech
eta
l./
Jou
rna
lo
fFin
an
cial
Eco
no
mics
10
6(2
01
2)
91
–1
13
10
0

Loa
nsi
ze/A
sse
ts0
.42
0.5
50
.50
0.4
40
.63
0.6
31
.41
0.4
91
1.2
11
50
.38
3.1
85
0.9
1.5
1
Lev
era
ge
0.5
10
.53
0.3
60
.42
0.4
40
.29
2.7
00
.43
0.5
61
.53
0.3
70
.48
1.2
50
.92
Inte
rest
cov
era
ge
2.7
85
.60
11
.93
.06
13
.66
0.7
1.8
73
.53
24
.82
49
4.3
93
1.1
43
10
.24
Re
turn
on
ass
ets
0.1
20
.12
0.0
70
.12
0.1
20
.09
0.1
10
.11
0.0
70
.85
0.1
20
.09
0.6
50
.41
Z-s
core
2.1
24
.15
14
.72
.26
9.7
04
0.0
1.5
42
.63
13
.71
15
2.9
51
9.4
11
30
.62
Q1
.33
1.5
00
.62
1.4
11
.54
0.6
80
.42
1.6
02
.15
3.8
01
.53
2.0
73
.31
0.3
2
Re
turn
on
eq
uit
y0
.07
0.0
11
.23
0.0
70
.55
4.0
31
.90
0.0
90
.01
3.0
50
.10
�0
.03
2.3
40
.20
PP
E/A
sse
ts0
.44
0.5
20
.36
0.4
20
.50
0.3
40
.73
0.4
40
.53
0.4
30
.46
0.5
50
.41
0.5
9
Lev
era
ge
(in
d.
ad
j.)
0.2
30
.27
0.3
70
.17
0.2
10
.29
1.8
70
.21
0.3
31
.54
0.1
40
.26
1.2
50
.79
Inte
rest
cov
era
ge
(in
d.
ad
j.)
�0
.31
2.3
01
1.7
0.1
01
0.3
60
.31
.88
�0
.89
20
.02
50
�0
.45
25
.94
33
0.2
3
Re
turn
on
ass
ets
(in
d.
ad
j.)
0.0
40
.05
0.1
00
.03
0.0
60
.10
0.0
60
.02
�0
.02
0.8
60
.02
0.0
10
.66
0.4
8
Z-s
core
(in
d.
ad
j.)
�0
.92
0.7
11
4.8
�1
.26
5.6
04
0.0
1.3
6�
1.2
89
.41
11
5�
0.9
31
5.0
11
30
.61
E. Benmelech et al. / Journal of Financial Economics 106 (2012) 91–113 101
4.2. Summary statistics
We begin by reporting descriptive statistics for bothsamples. As shown in Table 1, Panel A, institutional loansare large loans made to large borrowers; the average loansize is roughly $600 million and the average borrower hadroughly $1.7 billion in sales at the time of loan origination.Generally speaking, loans purchased by CLOs are noninvest-ment-grade senior-secured loans with ratings in the BB or Brange and spreads in the neighborhood of 300 bps.19
In comparing the two samples, it is important to keepin mind their relative differences. The at-originationsample covers a longer period of time (loans originated1997–2007 versus 2005–2007). However, it conditions onthe presence of a loan amendment (i.e., availability of SECfilings), which effectively eliminates some smaller loans(the average loan in the at-origination sample is $560million and the average loan in the portfolio sample is$464 million). Table 1, Panel B presents a more extensivedescription of the borrowers, using Compustat data forthe fiscal year ending prior to loan origination. Looking atthe portfolio sample, securitized loans and borrowers arelarger than their unsecuritized counterparts on average,but they are not significantly different on other dimen-sions. In the at-origination sample, securitized loans aresmaller (as a result of conditioning on amendment) butborrowers are not significantly different in size. Secur-itized borrowers look riskier on some dimensions, how-ever, including leverage and interest coverage.
Table 2 examines how ex ante loan and borrowercharacteristics influence the probability of securitization. Thisrepeats the analysis in Table 1 in a multivariate setting. Weestimate a probit model in which the dependent variable is adummy equal to one if a loan was securitized and zerootherwise. The independent variables are loan and borrowercharacteristics at origination. All regressions include leadarranger fixed effects, in addition to fixed effects for theborrower’s industry, credit rating at loan origination, and theyear of loan origination. On balance, larger loans are morelikely to be sold to CLOs, though the effect is morepronounced in the portfolio sample as expected given thesample construction. In the portfolio sample, a 1 standarddeviation increase in the log of loan size (1.3) is associatedwith an 11 percentage point increase in the probability ofsecuritization. Also in the portfolio sample, various other loancharacteristics are significant in predicting securitization. LBOloans, loans to public companies, and loans with higherspreads are more likely to be sold to CLOs.
4.3. Hypothesis 1. does securitization predict worse futureperformance?
4.3.1. Benchmark results
The first set of tests examines whether securitizedloans are worse quality than comparable unsecuritized
19 Benmelech and Dlugosz (2009) find that CLOs are typically
backed by collateral pools with a weighted average rating of BB�/Bþ/
B. Many restrict the amount of securities rated below CCCþ to 5–7% of
the pool, suggesting that the average loan held by a CLO has a BB or B
rating.

Table 2Determinants of securitization: loan and borrower characteristics at origination.
This table examines the impact of loan and borrower characteristics on the probability that a loan is sold to a CLO. The dependent variable is a dummy
that equals one if a loan was sold to a CLO and zero if not. The at-origination sample contains loans originated between 1997 and May 2007. The portfolio
sample contains loans originated between January 2005 and July 2007. Borrower financials are taken from Compustat for the fiscal year ending prior to
loan origination and industry adjustment is done at the two-digit SIC level. The Compustat dummy equals one when a company has pre-origination data
available in Compustat. Other variable definitions are the same as in Table 1. All specifications include fixed effects for the year of loan origination, the
borrower’s industry (two-digit SIC code) and rating at origination, and the identity of the loan lead arranger. We use the most granular rating
information; e.g., we include separate dummies for BBþ , BB, and BB-. Rating fixed effects are relative to the omitted category unrated. The second
specification substitutes Z-score in the place of leverage and interest coverage. The coefficients shown are marginal effects. Standard errors are clustered
by loan lead arranger in all specifications. Significance at the 1%, 5%, and 10% level is indicated by nnn, nn, and n, respectively.
At-origination sample Portfolio sample
Coeff. z-stat Coeff. z-stat Coeff. z-stat Coeff. z-stat
Borrower characteristics
Log(Assetst�1) 0.05 1.65 n�0.09 3.36 nnn
�0.02 1.09 �0.03 1.76 n
ROAt�1 (ind. adj.) �0.50 1.24 0.87 2.23 nn�0.19 2.04 nn
�0.01 0.30
Leveraget�1 (ind. adj.) 0.50 3.83 nnn – – �0.08 1.71 n – –
Coveraget�1 (ind. adj.) 0.01 1.76 n – – 0.00 1.48 – –
Z-scoret�1 (ind. adj.) – – �0.01 3.82 nnn – – �0.00 0.35
Compustat (dummy) �0.45 3.34 nnn 0.21 0.98 0.30 1.75 n 0.29 1.61
Loan characteristics
Log (Loan maturity) �3.35 2.60 nnn�3.84 3.11 nnn 5.15 4.53 nnn 4.54 2.88 nnn
Log(Loan size) �0.08 1.87 n 0.00 0.03 0.09 4.29 nnn 0.11 3.75 nnn
All-in-drawn spread (bps) �0.00 0.64 �0.00 0.08 0.00 1.03 0.00 1.31
Perf. pricing (dummy) �0.07 1.14 �0.15 2.48 nn 0.01 0.13 0.02 0.31
LBO loan (dummy) 0.04 0.40 �0.07 0.49 0.17 3.16 nnn 0.21 2.77 nnn
M&A loan (dummy) 0.10 0.77 0.12 0.83 0.05 0.78 0.06 0.69
Debt repayment (dummy) 0.01 0.15 0.02 0.17 0.09 1.09 0.20 1.89 n
Fixed effects
Borrower: Industry/Rating Yes/Yes Yes/Yes Yes/Yes Yes/Yes
Loan: Year/Lead Yes/Yes Yes/Yes Yes/Yes Yes/Yes
Pseudo R-squared 0.29 0.35 0.26 0.30
Observations 361 265 738 539
20 We also run our benchmark results excluding the spread from the
right-hand side. However, this change has no effect on the results for H1
and limited effect on H2. More broadly, ratings (or any other observable
information) are not a sufficient statistic for explaining the spreads.
Ivashina (2009) models spreads in which she controls for rating and
many other observables at the time of origination. The R-squared of such
model is approximately 0.55.
E. Benmelech et al. / Journal of Financial Economics 106 (2012) 91–113102
loans. All regressions are estimated at the loan level withlead arranger fixed effects so the coefficient on thesecuritization dummy can be interpreted as the marginaleffect of securitization on performance among loansoriginated by a given bank. The at-origination sampleincludes loans originated between January 1997 and May2007. The portfolio sample includes loans originatedbetween January 2005 and July 2007. To allow for thecomparison of coefficients across samples, we include twosecuritization dummies, Securitized and Securitized in
2005–2007, in the at-origination sample regressions.Securitized in 2005–2007 is essentially an interaction termreflecting the marginal effect for securitized loansoriginated between 2005 and 2007. The total effect ofsecuritization for loans originated in 2005–2007 in theat-origination sample is given by the sum of thesecoefficients (Securitized and Securitized in 2005–2007).For each regression on this sample, we provide thep-value corresponding to the statistical test that thesum of these coefficients is equal to zero (i.e., the nullhypothesis that there is no difference in the performanceof securitized and unsecuritized loans originated duringthe later period). Each specification includes year fixedeffects, so we control for level effects in 2005, 2006, and2007 individually. We also include industry effects whenthe dependent variable is not already industry-adjustedand fixed effects for credit ratings at loan origination.
Other controls include log of loan maturity measuredin years, the log of loan size measured in millions ofdollars, and the loan’s spread over the London InterbankOffered Rate (LIBOR) contracted at loan origination andmeasured in basis points. (Our results are not sensitive towhether we use log transformations of particular expla-natory variables or not.) The spread contracted at loanorigination controls for the risk that is priced by a broadinvestor base at that time. For example, a loan originatedin 2006 paying 150 bps over LIBOR could be classified asrisky or highly levered even if no other information wereavailable. If we ignore the contracted spread we mightmiss this fact.20 We also include an indicator variableequal to one if the contract includes performance pricing.Performance pricing allows for the original spread to beadjusted based on the financial performance of theborrower. Presence of performance pricing is likely toindicate borrowers with more transparent accountingperformance. When looking at loan prices (a facility-level

Table 3Does securitization predict worse future performance? (H1): secondary market loan prices.
This table compares the change in secondary market loan prices for securitized loans and unsecuritized loans. The unit of observation for the analysis is
a loan. For each loan we use prices corresponding to the relevant facility (i.e., we use only one facility per loan). The dependent variable is the percentage
change in the average monthly mid-quote price (the average between the bid and ask price) in a given period after the loan origination. Facility-level
controls include facility size as a percentage of the total deal size, and a dummy equal to one when the facility starts after the loan origination date (the
coefficient on the latter is not reported because it affects only one specification). The at-origination sample contains loans originated between 1997 and
May 2007. The portfolio sample contains loans originated between January 2005 and July 2007. Securitized in 2005–2007 is essentially an interaction term
reflecting the marginal effect for loans securitized between 2005 and 2007, which we include for comparison across the two samples. The p-value
corresponds to the statistical test of the null hypothesis that SecuritizedþSecuritized in 2005–2007 is equal to zero. Other variable definitions are the same
as in Table 1. All specifications include fixed effects for the year of loan origination, the borrower’s industry (two-digit SIC code) and rating at origination,
and the identity of the loan lead arranger. We use the most granular rating information; e.g., we include separate dummies for BBþ , BB, and BB-. Rating
fixed effects are relative to the omitted category unrated. Standard errors are clustered by loan lead arranger. Significance at the 1%, 5%, and 10% level is
indicated by nnn, nn, and n, respectively.
At-origination sample Portfolio sample
0–12 months post-event 13–24 months post-event 0–12 months post-event 13–24 months post-event
Coeff. t-stat Coeff. t-stat Coeff. t-stat Coeff. t-stat
Securitized (dummy) �0.011 1.34 0.048 2.35 nn – – – –
Securitized in 2005–2007 �0.007 0.90 �0.027 0.20 0.003 1.39 �0.020 2.45 nnn
Borrower characteristics
Realized price volatility �2.262 4.02 nnn�1.229 4.86 nnn
�2.835 10.5 nnn�1.553 3.46 nnn
Loan characteristics
Log(Loan maturity) 0.004 0.31 0.022 0.71 �0.077 0.91 0.140 0.60
Log(Loan size) 0.009 1.36 �0.007 0.54 0.001 1.57 �0.004 0.63
All-in-drawn spread 0.000 0.91 �0.000 0.88 0.000 0.69 0.000 0.04
Perf. pricing (dummy) 0.000 0.05 �0.025 1.91 n�0.003 0.84 �0.007 0.95
LBO loan (dummy) �0.001 0.09 0.044 1.78 n 0.002 0.31 0.003 0.16
M&A loan (dummy) 0.004 0.27 0.036 1.18 �0.000 0.07 0.012 0.69
Debt repayment (dummy) 0.001 0.06 0.074 2.45 nnn 0.001 0.24 �0.030 2.10 nn
Facility size (% of deal) 0.000 1.07 �0.001 2.18 nn 0.000 0.98 �0.001 1.40
Fixed effects
Borrower: Industry/Rating Yes/Yes Yes/Yes Yes/Yes Yes/Yes
Loan: Year/Lead Yes/Yes Yes/Yes Yes/Yes Yes/Yes
F-test (p-value) 0.12 0.86 – –
Adjusted R-squared 0.81 0.81 0.89 0.65
Observations 142 129 263 275
E. Benmelech et al. / Journal of Financial Economics 106 (2012) 91–113 103
variable) we include facility-level size controls. By construc-tion our sample includes only term loan facilities.21 Through-out the analysis we control for loan purpose. Specifically, welook at whether the loan was issued to fund an LBO, a mergeror acquisition, or debt repayment (i.e., recapitalization). Theomitted categories of loan purpose—working capital andgeneral corporate purpose—can be broadly grouped as realinvestments.
Table 3 examines whether securitized and unsecuri-tized loans perform differently on the secondary marketpost-origination, controlling for observables. The depen-dent variable is the percentage change in the mid-quoteprice (the average of the bid and ask price) in a windowaround origination. The key explanatory variables are thesecuritization indicators: Securitized and Securitized in
2005–2007. The results suggest that securitized loansoriginated before 2005 outperform unsecuritized loansfrom the same lead bank on the secondary market. The
21 Holdings of revolving lines by CLOs are very rare (we confirm this
in the portfolio sample). Furthermore, because our measure of secur-
itization is a dummy, it would be very unlikely that in a given loan
package CLOs hold a revolving line but not a term loan.
outperformance is significant only in the second year,when these loans experience price appreciation 4.8 per-centage points greater than that of unsecuritized loans onaverage. The results are mixed for loans originatedbetween 2005 and 2007, depending on the sample. Inthe at-origination sample, there appears to be a trend ofdeterioration over time, as evidenced by the negativecoefficients on Securitized in 2005–2007 however, this isonly a marginal effect. The total effect of securitization forloans originated 2005–2007 in this sample is given bythe sum of the securitization coefficients (Securiti-
zedþSecuritized in 2005–2007). As shown by the p-valuefor the F-test, we cannot reject the hypothesis that thesum of these coefficients is equal to zero. In other words,securitized loans issued during the late period do notunder-perform in the at-origination sample. However,they do underperform in the portfolio sample. In theportfolio sample, securitized loans experience a decreasein price 2.0 percentage points greater than comparableunsecuritized loans in the same window. These differ-ences are economically significant because the meanchange in loan price over the horizon is 3% for the at-origination sample and �6% for the portfolio sample and

E. Benmelech et al. / Journal of Financial Economics 106 (2012) 91–113104
the standard deviations are 11% and 13%, respectively.However, given the significant drop in liquidity in thesecondary loan market around the financial crisis, we
Table 4Does securitization predict worse future performance? (H1): loan rating chang
This table compares downgrades and upgrades in loan ratings for securitized an
dependent variable in the regressions is a dummy that indicates whether a loan w
ratings have been converted into a numerical scale (1¼AAA, 2¼AAþ , 3¼AA, etc.)
Borrowers are considered to be downgraded or upgraded when the numerical rat
S&P and Moody’s) and covers the period from May 2001 through April 2010. The at
The portfolio sample contains loans originated between January 2005 and July 2007
2007 and zero otherwise. Securitized in 2005–2007 is essentially an interaction term
The p-value corresponds to the statistical test of the null hypothesis that Securitized
same as in Table 1. All specifications include fixed effects for the year of loan origin
and the identity of the loan lead arranger. We use the most granular rating inform
effects are relative to the omitted category unrated. All specifications are estimated
for the at-origination sample (in this table and in Table 9) require interaction effec
regressions, which do not feature an interaction effect, are qualitatively unchang
arranger. Significance at the 1%, 5%, and 10% level is indicated by nnn, nn, and n, re
At-origination sample
1-year horizon 2-year h
Coeff t-stat Coeff t
Panel A: Downgrades
Securitized (dummy) 0.03 0.61 �0.01 0
Securitized in 2005–2007 0.10 0.49 0.15 0
Borrower characteristics
Log(Assetst�1) 0.01 0.20 0.03 0
ROAt�1 (ind. adj.) �1.21 1.66 n�1.39 2
Leveraget�1 (ind. adj.) �0.10 0.61 �0.18 0
Coveraget�1 (ind. adj.) 0.00 1.43 0.01 2
Loan characteristics
Log(Loan maturity) 0.02 0.24 �0.06 0
Log(Loan size) 0.01 0.09 �0.06 0
All-in-drawn spread �0.00 0.97 �0.00 1
Perf. pricing (dummy) �0.13 1.82 n�0.14 3
LBO loan (dummy) �0.06 0.50 �0.01 0
M&A loan (dummy) �0.10 0.76 �0.21 1
Debt repayment (dummy) 0.03 0.34 �0.14 1
Fixed effects
Borrower: Industry/Rating Yes/Yes Yes/Yes
Loan: Year/Lead Yes/Yes Yes/Yes
F-test (p-value) 0.43 0.52
Adjusted R-squared 0.09 0.09
Observations 213 227
Panel B: Upgrades
Securitized (dummy) 0.08 0.73 0.04 0
Securitized in 2005–2007 �0.14 0.77 �0.35 2
Borrower characteristics
Log(Assetst�1) �0.07 1.39 �0.07 1
ROAt�1 (ind. adj.) 0.15 0.29 0.09 0
Leveraget�1 (ind. adj.) 0.10 0.31 0.21 0
Coveraget�1 (ind. adj.) �0.00 0.21 0.00 0
Loan characteristics
Log(Loan maturity) 0.00 0.04 0.06 0
Log(Loan size) 0.10 2.00 nn 0.10 1
All-in-drawn spread �0.00 0.01 0.00 0
Perf. pricing (dummy) 0.09 2.16 nn 0.12 2
LBO loan (dummy) 0.04 0.28 �0.07 0
M&A loan (dummy) �0.05 0.53 �0.18 1
Debt repayment (dummy) 0.08 1.08 �0.10 0
Fixed effects
Borrower: Industry/Rating Yes/Yes Yes/Yes
Loan: Year/Lead Yes/Yes Yes/Yes
F-test (p-value) 0.62 0.01
Adjusted R-squared 0.15 0.02
Observations 213 227
cannot definitively attribute the under-performance ofsecuritized loans to deterioration in fundamentals. Foradditional evidence, we turn to other measures.
es.
d unsecuritized loans. The unit of observation for the analysis is a loan. The
as downgraded or upgraded in a given period after loan origination. Letter
where credit watch negative or positive counts at þ or �0.5, respectively.
ing changes. Ratings data comes from Reuters Gold Sheets (compiled from
-origination sample contains loans originated between 1997 and May 2007.
. The 2005–2007 dummy equals one for loans originated between 2005 and
reflecting the marginal effect for loans securitized between 2005 and 2007.
þSecuritized in 2005–2007 is equal to zero. Other variable definitions are the
ation, the borrower’s industry (two-digit SIC code) and rating at origination,
ation; e.g., we include separate dummies for BBþ , BB, and BB-. Rating fixed
using a linear model to maintain consistency across samples; specifications
ts that present issues in nonlinear models. Results for the portfolio sample
ed using a probit specification. Standard errors are clustered by loan lead
spectively.
Portfolio sample
orizon 1-year horizon 2-year horizon
-stat Coeff t-stat Coeff t-stat
.11 – – – –
.61 0.00 0.09 0.12 2.35 nn
.46 0.02 1.20 �0.02 0.61
.12 nn 0.28 1.59 0.03 0.09
.93 �0.06 0.65 �0.13 1.80 n
.42 nn 0.00 0.30 �0.00 0.71
.64 �0.10 0.82 �0.12 0.98
.80 �0.01 0.25 0.03 0.83
.79 n 0.00 1.13 0.00 0.50
.02 nnn�0.06 1.57 �0.06 1.47
.07 �0.05 0.86 �0.09 0.96
.71 n 0.01 0.26 �0.05 0.75
.14 �0.10 1.34 0.01 0.09
Yes/Yes Yes/Yes
Yes/Yes Yes/Yes
– –
0.07 0.03
414 420
.46 – – – –
.26 nn�0.04 0.83 �0.00 0.00
.02 0.03 1.72 n 0.03 1.36
.15 �0.11 0.50 �0.55 2.18 nn
.78 �0.01 0.11 �0.03 0.32
.53 0.00 0.10 0.00 0.78
.47 �0.03 0.21 �0.07 0.42
.57 0.01 0.55 0.02 0.78
.47 �0.00 0.52 0.00 0.13
.38 nn 0.04 0.96 0.04 0.77
.48 0.06 0.94 0.05 1.65 n
.25 �0.01 0.12 �0.00 0.03
.79 �0.05 0.61 0.00 0.07
Yes/Yes Yes/Yes
Yes/Yes Yes/Yes
– –
0.02 0.10
414 420

Table 5Does securitization predict worse future performance? (H1): CDS spreads.
This table compares the change in spreads on senior debt CDS for securitized loan borrowers with that of unsecuritized borrowers. The unit of
observation for the analysis is a loan. The dependent variable is the percentage change in a borrower’s CDS spread in a given period after the loan
origination. CDS data come from Markit and correspond to five-year contracts. CDS quotes are available for the period 2003 through June 2009. The at-
origination sample contains loans originated between 1997 and May 2007. The portfolio sample contains loans originated between January 2005 and July
2007. Securitized in 2005–2007 is essentially an interaction term reflecting the marginal effect for loans securitized between 2005 and 2007. The p-value
corresponds to the statistical test of the null hypothesis that SecuritizedþSecuritized in 2005–2007 is equal to zero. Other variable definitions are the same
as in Table 1. Specifications include fixed effects for the year of loan origination, the borrower’s industry (two-digit SIC code) and rating at origination,
and the identity of the loan lead arranger. We use the most granular rating information; e.g., we include separate dummies for BBþ , BB, and BB-. Rating
fixed effects are relative to the omitted category unrated. In the at-origination sample, we omit some of the borrower-level fixed effects due to the small
sample size. Standard errors are clustered by loan lead arranger. Significance at the 1%, 5%, and 10% level is indicated by nnn, nn, and n, respectively.
At-origination sample Portfolio sample
0–12 months post-event 13–24 months post-event 0–12 months post-event 13–24 months post-event
Coeff. t-stat Coeff. t-stat Coeff. t-stat Coeff. t-stat
Securitized (dummy) �0.91 1.04 0.42 0.89 – – – –
Securitized in 2005–2007 �0.01 0.00 �2.21 2.28 nn 0.34 1.36 0.24 0.78
Borrower characteristics:
Realized CDS volatility 0.02 1.25 0.00 0.94 0.00 0.67 0.01 4.09 nnn
Loan characteristics
Log(Loan maturity) �1.62 2.87 nnn�0.16 0.75 �0.05 0.08 �0.64 1.27
Log(Loan size) �0.40 0.25 �0.32 3.15 nnn 0.06 0.73 �0.08 0.62
All-in-drawn spread �0.01 1.75 n�0.00 3.12 nnn
�0.00 0.23 �0.00 0.23
Performance pricing �1.24 0.65 0.14 0.75 0.04 0.30 0.50 2.55 nn
LBO loan (dummy) 0.74 0.49 0.72 1.25 0.21 0.99 0.42 0.57
M&A loan (dummy) 4.30 3.72 nnn 3.97 10.7 nnn 0.27 1.06 �0.04 0.05
Debt repayment (dummy) �2.41 1.97 nn 1.55 2.13 nn�0.50 1.34 0.41 0.98
Fixed effects
Borrower: Industry/Rating No/No No/Yes Yes/Yes Yes/Yes
Loan: Year/Lead Yes/Yes Yes/Yes Yes/Yes Yes/Yes
F-test (p-value) 0.71 0.02 – –
Adjusted R-squared 0.54 0.73 0.62 0.59
Observations 24 44 157 170
22 We do not control for Compustat variables here because con-
ditioning on companies being public would reduce the sample. One of
the main benefits of using CDS spreads is that they exist for private
companies.
E. Benmelech et al. / Journal of Financial Economics 106 (2012) 91–113 105
In Table 4, we examine whether securitized loansare more likely to be downgraded or less likely tobe upgraded than comparable unsecuritized loansoriginated by the same lead bank. Panel A presents thedowngrade results, and Panel B presents the upgraderesults. In specifications for the at-origination sample,Securitized in 2005–2007 is an interaction term betweenSecuritized and the 2005–2007 loan origination window.Due to the issues with interaction effects in nonlinearmodels (Ai and Norton, 2003)—specifically, that thecoefficients on interaction terms cannot be interpretedas marginal effects and could even have the oppositesign—all regressions are estimated with a linear modelto maintain consistency across specifications. Control-ling for loan and borrower characteristics at origination,we find no support for the hypothesis that securitizationpredicts deterioration in credit ratings for loans origi-nated before 2005. As before, the results are mixed forloans originated between 2005 and 2007. The results arestatistically significant only in the portfolio sample,indicating that, for loans originated between 2005 and2007, downgrades are more likely particularly in thesecond year following loan origination. Our resultssuggest that loans securitized in 2005–2007 are 12percentage points more likely to be downgraded in atwo-year window after origination than comparableunsecuritized loans. This is economically significant
because the unconditional probability of a downgradeover this period is 25%. Although upgrades appear to beless likely for the same subsample, the estimates are notstatistically different from zero. However, upgrades aresignificantly less likely for loans originated in 2005–2007 in the at-origination sample.
Our third measure of performance is CDS spreads.The dependent variable in Table 5 is the percentage changein a borrower’s CDS spread in a given window followingloan origination. A positive coefficient indicates an increasein CDS spreads or deterioration in credit quality. We omitindustry fixed effects in the at-origination sample due tothe small sample size. Controlling for the borrower’scredit rating and lagged CDS volatility, we find thatsecuritized loans originated before 2005 experience simi-lar performance to unsecuritized loans.22 The results forthe subset of loans originated between 2005 and 2007 aremixed with evidence of outperformance, although notconsistently across the two samples. In the at-originationsample, borrowers with securitized loans originated in2005–2007 experience a decline in CDS spreads that isabout 180 percentage points larger than that of

E. Benmelech et al. / Journal of Financial Economics 106 (2012) 91–113106
comparable unsecuritized borrowers. This differential iseconomically large given that the average change in CDSspreads for our sample in this window was a 25% increase.(While the average change itself seems large, as a point ofcomparison, between mid-2007 and year-end 2008, themedian CDS spread for all speculative-grade companiesincreased from under 250 bps to nearly 750 bps.) However,because of the small sample size and the presence ofseveral large outliers—15% of companies have their CDSspreads more than double—we down-weight this resultin our interpretation.
Next we examine another measure of default prob-ability that is available for a wider range of borrowers:implied default probability from a reduced-form Merton(1974) model. Table 6 compares changes in one-yearimplied default probabilities for securitized and unsecur-itized borrowers around loan origination. Again we findno significant difference in performance between secur-itized and unsecuritized borrowers in either sampleregardless of the period in which the loan was originated.
None of these performance measures is perfect. How-ever, taken together, the four different measures provide a
Table 6Does securitization predict worse future performance? (H1): implied probabili
This table compares post-origination changes in implied probability of defau
loans were not securitized. Implied default probabilities are calculated using th
Shumway (2008). The unit of observation for the analysis is a loan. The depen
probability over the window. The t�1 implied default probability (Pt–1) is
at-origination sample contains loans originated between 1997 and May 2007. T
July 2007. Securitized in 2005–2007 is essentially an interaction term reflecting
p-value corresponds to the statistical test of the null hypothesis that Securitized
the same as in Table 1. All specifications include fixed effects for the year of loa
origination, and the identity of the loan lead arranger. We use the most granula
BB-. Rating fixed effects are relative to the omitted category unrated. Standard e
at the 1%, 5%, and 10% level is indicated by nnn, nn, and n, respectively.
At-origination sample
0-12 months post-event 13-24 months p
Coeff. t-stat Coeff. t-st
Securitized (dummy) �0.01 0.19 0.11 1
Securitized in 2005–2007 �0.01 0.03 �0.11 0.
Borrower characteristics
Log(Assetst�1) �0.08 1.46 0.08 0
ROAt�1 (ind. adj.) �0.32 0.81 �0.77 1
Leveraget�1 (ind. adj.) 0.32 1.73 n 0.27 1
Coveraget�1 (ind. adj.) 0.00 0.71 �0.00 0
P t�1 (ind. adj.) �0.69 3.09 nnn�0.36 1
Loan characteristics
Log(Loan maturity) �0.26 1.39 0.33 3
Log(Loan size) 0.15 3.12 nnn�0.11 1
All-in-drawn spread �0.00 0.16 0.00 1
Perf. pricing 0.05 0.67 �0.05 0
LBO loan (dummy) �0.10 1.93 n�0.05 0
M&A loan (dummy) �0.03 0.24 �0.02 0
Debt repayment (dummy) �0.02 0.24 �0.02 0
Fixed effects
Borrower: Industry/Rating Yes/Yes Yes/Yes
Loan: Year/Lead Yes/Yes Yes/Yes
F-test (p-value) 0.92 0.99
Adjusted R-squared 0.49 0.34
Observations 146 136
comprehensive overview of performance. To summarize,controlling for observables at the time of loan origination,securitized loans originated before 2005 perform similarlyto other institutional loans from the same lead arrangerthat are unsecuritized. We find some evidence thatsecuritized loans originated in the later period under-perform over the two year horizon, but only in theportfolio sample (as discussed earlier, this sample issensitive to type II error). No evidence exists of under-performance for securitized loans originated between2005 and 2007 in the at-origination sample. Furthermore,even for the portfolio sample, results across differentperformance measures do not consistently indicateunder-performance.
The results indicate that agency problems in corporateloan securitization could be less important than commonlybelieved. Despite the fact that CLOs are subject to additionallayers of agency and adverse selection problems, theirinvestment choices appear no different than the investmentchoices of other nonbank institutions (in terms of ex postperformance). The results on securitized loans originatedduring the boom years of 2005–2007 are mixed, depending
ty of default.
lt (P) for borrowers whose loans were securitized and borrowers whose
e reduced form Merton (1974)-style approach described in Bharath and
dent variable is the change in the borrower’s implied one-year default
measured as of month-end in the month before loan origination. The
he portfolio sample contains loans originated between January 2005 and
the marginal effect for loans securitized between 2005 and 2007. The
þSecuritized in 2005–2007 is equal to zero. Other variable definitions are
n origination, the borrower’s industry (two-digit SIC code) and rating at
r rating information; e.g., we include separate dummies for BBþ , BB, and
rrors are clustered by loan lead arranger in all specifications. Significance
Portfolio sample
ost-event 0-12 months post-event 13-24 months post-event
at Coeff. t-stat Coeff. t-stat
.42 – – – –
387 0.02 0.68 0.03 0.75
.92 �0.04 1.65 n 0.05 1.54
.22 �0.04 0.13 �0.58 1.95 n
.68 n�0.04 0.53 0.15 1.37
.01 0.00 1.64 n 0.00 0.88
.41 �0.60 5.84 nnn�0.22 2.16 nn
.16 nnn 0.12 1.30 0.05 0.35
.28 0.01 0.37 �0.03 0.78
.17 0.00 1.59 0.00 1.65 n
.39 0.02 0.83 0.01 0.27
.53 �0.03 0.38 0.04 0.55
.09 �0.06 1.41 0.10 1.99 nn
.15 �0.04 0.92 0.05 0.65
Yes/Yes Yes/Yes
Yes/Yes Yes/Yes
– –
0.30 0.28
262 244

E. Benmelech et al. / Journal of Financial Economics 106 (2012) 91–113 107
on the sample and the performance metric. We find someweak evidence of under-performance in loan prices andcredit ratings. The fact that the performance difference isconcentrated among loans originated in 2005–2007 and inthe second-year performance window raises issues aboutoverheated market conditions and the passive nature ofCLOs and not necessarily incentive problems inherentto the corporate loan securitization model. We interpretthese findings as indicative of the contribution of CLOsto overall demand pressure by institutional investorsthat led to a deterioration in lending standards (e.g.,Ivashina and Sun, 2011a) and was also associated withshrinking loan retention by originating banks (see Ivashinaand Scharfstein (2010) and, more recently, Bord and Santos(2011)).
4.3.2. Addressing selection
In both samples, we limit attention to loans that arelikely candidates for securitization to assure that secur-itized and unsecurititized loans are comparable. However,in the absence of a clear mechanism that explains theselection of loans into CLOs, there might be some residualconcern that the treatment and control subsets are notcomparable. To address this issue, in Table 7 we explore aquasi-experimental setting, where we rely on temporary
Table 7Loan selection under CLO demand pressure (quasi-experiment).
This table seeks to address a potential selection bias. We replicated results in
basic idea is to look at the marginal quality of loans securitized in periods when
the analysis in Tables 3–6 we include a fund-flow proxy and its interaction wi
flow proxies are omitted for compactness of presentation. The table reports c
measures of demand). CLO issuance (in billions) is equivalent to CLO fund flow. Dexcess demand for loans by CLOs. CLO issuance scaled by total term loan issuan
report results for net cash flow into institutional accounts scaled by total term l
more broadly. The analysis is done using the at-origination sample which con
available from 2001 through 2009. Significance at the 1%, 5%, and 10% level is
Table Dependent variable Explanatory variable
CLO issuan
Coeff. Stat
3 DLoan price (0–12 month) Securitized �0.011 1.48
SecuritizednCLO demand 0.000 0.51
3 DLoan price (13�24 month) Securitized 0.107 1.01
SecuritizednCLO demand �0.014 1.23
4.a Downgrade (1-year) Securitized �0.152 1.98
SecuritizednCLO demand 0.021 1.51
4.a Downgrade (2-year) Securitized �0.287 1.84
SecuritizednCLO demand 0.032 1.98
4.b Upgrade (1-year) Securitized 0.092 0.66
SecuritizednCLO demand �0.008 0.84
4.b Upgrade (2-year) Securitized 0.081 0.47
SecuritizednCLO demand �0.021 1.35
5 DCDS (0–12 month) Securitized 0.065 0.09
SecuritizednCLO demand �0.128 0.79
5 DCDS (13-24 month) Securitized 0.776 0.90
SecuritizednCLO demand �0.125 1.29
6 DP (0–12 month) Securitized –0.127 1.80
SecuritizednCLO demand 0.030 2.92
6 DP (13–24 month) Securitized –0.054 0.32
SecuritizednCLO demand 0.002 0.09
imbalances between CLO demand for loans and loanoriginations. The argument is that CLOs face an invest-ment constraint that they cannot smooth over time. Weconsider several proxies for the aggregate imbalancebetween supply and demand at the quarterly frequency:CLO issuance (CLO fund flow); the change in the CLOpipeline, which reflects CLO volume that is not yet closed;and CLO issuance scaled by total term loan issuance.For robustness, we also look at the overall net cash flowinto institutional accounts scaled by total term loanissuance. An increase in any of these variables representsan increase in either CLO demand or institutional demand.CLO flow data are compiled using CLO calendars pub-lished by Reuters Gold Sheets. Institutional fund flow dataare from S&P Leveraged Commentary & Data (S&P LCD)Quarterly Review covering activity in the leveraged loanmarket. Total term loan issuance is constructed usingDealScan. Both types of fund flow data are available from2001 through 2009.
Aggregate trends, in particular at the overall institu-tional level, are likely to be exogenous to the loan selectionmade by any individual CLO. The basic intuition is that anincrease in aggregate demand for loans should push CLOsto invest in loans that would typically be held by otherinstitutional investors. If the loans typically held by CLOs
Tables 3–6 using three alternative proxies for CLO demand for loans. The
CLO’s demand for loans is generally high. In addition to controls used in
th the Securitized dummy. Coefficients on benchmark controls and fund-
oefficients of interest for 40 different regressions (10 specifications�4
CLO pipeline (in billions) is the accumulation of CLOs in the pipeline, i.e.,
ce is also likely to reflect imbalances in demand. For robustness, we also
oan issuance, which reflects imbalances in institutional demand for loans
tains loans originated between 1997 and May 2007. Fund-flow data are
indicated by nnn, nn, and n, respectively.
CLO demand proxy: Net cash flows into
inst. investors/ Term
loan issuancece DCLO pipeline CLO issuance/
Term loan
issuance
. Coeff. Stat. Coeff. Stat. Coeff. Stat.
�0.008 2.11 nn�0.011 0.65 �0.003 0.39
0.000 0.14 0.036 0.24 �0.050 0.74
0.011 0.41 0.107 0.93 0.063 0.95
�0.039 1.23 �0.684 0.56 0.166 0.30nn�0.024 0.38 0.031 0.15 0.039 0.49
�0.009 0.16 �0.339 0.15 �0.211 0.15n�0.076 0.63 �0.033 0.13 �0.059 0.36
nn�0.052 1.03 �0.544 0.26 �0.420 0.22
0.032 0.35 0.034 0.27 0.071 0.63
0.021 0.99 0.084 0.09 �1.273 1.39
�0.075 0.74 �0.026 0.22 �0.066 0.53
0.036 1.25 �0.299 0.30 0.425 0.35
�1.063 0.91 0.494 0.35 �1.285 1.12
0.119 0.26 �22.71 0.81 �0.929 0.16
0.382 1.10 2.105 0.94 �0.391 0.75
�0.431 3.04 nnn�20.53 0.95 4.238 0.86
n 0.005 0.11 –0.156 0.89 0.045 0.87nnn 0.009 0.39 1.944 1.06 0.216 0.49
–0.013 0.13 –0.323 1.77 n –0.095 0.81
0.070 1.21 3.002 2.22 nn 0.242 0.15

Table 8Does securitization by the originator predict worse future performance? (H2): secondary market loan prices.
This table compares the change in secondary market loan prices following loan origination for borrowers whose loans were securitized by their lead
arranger versus other securitized loans in the same CLO portfolio. The sample contains only securitized loans. The unit of observation for the analysis is
CLO x loan. For each loan we use prices corresponding to the relevant facility (i.e., we use only one facility per loan). The dependent variable is the
percentage change in the average monthly loan price in a given period after loan origination. We use mid-quotes (i.e., the average between bid and ask
spread). Facility level controls include facility size as a percentage of the total deal size and a dummy equal to one when facility starts after the loan
origination date (coefficient on the latter is not reported because it only affects one specification.) The focus is on the Same bank dummy equal to one
when a loan appears in a CLO underwritten by its lead arranger and zero otherwise. Same bank 2005–2007 is essentially an interaction term reflecting the
marginal effect for loans originated between 2005 and 2007. The p-value corresponds to the statistical test of the null hypothesis that Same bankþSame
bank 2005–2007 is equal to zero. All specifications include fixed effects for the year of loan origination, the borrower’s industry (two-digit SIC code) and
rating at origination, and the identity of the loan lead arranger. We use the most granular rating information; e.g., we include separate dummies for BBþ ,
BB, and BB� . Rating fixed effects are relative to the omitted category unrated. Standard errors are clustered by loan. Significance at the 1%, 5%, and 10%
level is indicated by nnn, nn, and n, respectively.
At-origination sample
0–12 months post-event 13–24 months post-event
Coeff. t-stat Coeff. t-stat
Same bank (dummy) 0.001 1.99 nn 0.009 2.24 nn
Same bank, 2005–2007 0.001 1.04 �0.014 2.11 nn
Borrower characteristics
Realized price volatility �1.855 36.5 nnn 0.487 0.86
Loan characteristics
Log(Loan maturity) 0.387 2.45 nn 0.903 1.93 n
Log(Loan size) �0.011 2.10 nn 0.018 0.88
All-in-drawn spread 0.001 4.50 nnn 0.001 1.66 n
Performance pricing 0.004 0.86 0.049 2.05 nn
LBO loan (dummy) �0.030 3.32 nnn�0.106 2.74 nnn
M&A loan (dummy) �0.064 7.12 nnn�0.028 0.60
Debt repayment (dummy) �0.012 0.92 0.179 4.50 nnn
Facility size (% of deal) �0.000 1.17 �0.005 5.85 nnn
Fixed effects
Borrower: Industry/Rating Yes/Yes Yes/Yes
Loan: Year/Lead Yes/Yes Yes/Yes
F-test (p-value) 0.14 0.18
Adjusted R-squared 0.99 0.99
Observations 877 791
23 In addition to the results reported in Table 7, we look within the
sample of the loans held by CLOs and test whether, controlling for loan
size, the number of CLOs in the syndicate or the share of the loan
allocated to CLOs predicts future loan performance. Because corporate
loans are not fully securitized and are held by other investors including
banks, we expect that larger CLO presence is associated with worse
quality loans. However, the intensity of CLO investment has no pre-
dictive power for performance in our regressions.
E. Benmelech et al. / Journal of Financial Economics 106 (2012) 91–113108
are of a different quality (than unsecuritized loans), wewould expect the marginal loans purchased by CLOs duringthese times to differ from the average quality of CLOcollateral. (Given the exogenous nature of the demandproxies, the quality of the overall pool of potentiallysecuritizable loans is likely to be unchanged. In otherwords, under pressure, CLOs reach into the pockets ofother institutional investors.) Table 7 replicates the testspresented for the first hypothesis (Tables 3–6) with thealternative proxies for CLO demand for loans. In addition tocontrols used in the analysis in Tables 3–6, we include ademand proxy and its interaction with the Securitized
dummy. These interaction terms are the coefficients ofinterest. Coefficients on benchmark controls and fund-flowproxies are omitted for compactness of presentation.Because we use several proxies for high CLO demand, the2005–2007 interaction term—i.e., an indicator for theheight of the securitization boom—would be redundant.
Out of 40 coefficients of interest (40 interaction termsfrom 40 different regressions), 36 are not statisticallydifferent from zero. This indicates that when temporarilyhigher loan demand by CLOs pushes them to invest inloans that would typically be held by other institutionalinvestors, these loans are no better or worse than averagesecuritized loan. Among the significant coefficients, three
out of four indicate that securitized loans are on averagebetter quality than unsecuritized loans because theirmarginal investments during times of demand pressureunderperform. This evidence is consistent with thefindings in Tables 3–6. Loans with CLO investors areno different than loans held by other institutionalinvestors.23
4.4. Hypothesis 2. does securitization by the originatorpredict worse future performance?
In this sub-section, we examine the performance of asubset of securitized loans for which we expect agencyproblems to be particularly pronounced. Adverse selec-tion problems could be particularly acute when banksengage on both sides of the loan market—originatingloans and underwriting CLOs that purchase loans for

E. Benmelech et al. / Journal of Financial Economics 106 (2012) 91–113 109
collateral. This presents the greatest opportunity for abank to sell poor quality loans to a CLO, because there isone fewer monitor of loan quality at the CLO level.
Table 9Does securitization by the originator predict worse future performance? (H2):
This table compares the post-origination downgrade and upgrade frequency o
securitized in the same portfolio. The sample contains only securitized loans.
variable in the regressions is a dummy that indicates whether a loan was downg
ratings have been converted into a numerical scale (1¼AAA, 2¼AAþ , 3¼AA
respectively. Borrowers are considered to be ‘‘downgraded’’ or ‘‘upgraded’’ wh
equal to 1 when a loan appears in a CLO underwritten by its lead arranger an
reflecting the marginal effect for loans originated between 2005 and 2007. The p
bankþSame bank 2005–2007¼0. All specifications are estimated using a linear m
and Moody’s) and covers the period from May 2001 through April 2010. Variab
effects for the year of loan origination, the borrower’s industry (2-digit SIC co
We use the most granular rating information; e.g., we include separate dummi
category unrated. Standard errors are clustered by loan. Significance at the 1%
1-year horizon
Coeff. t-stat
Panel A: Downgrades
Same bank (dummy) 0.06 1.45
Same bank, 2005–2007 �0.01 0.14
Borrower characteristics
Log(Assetst�1) 0.06 0.96
ROAt�1 (ind. adj.) �1.06 1.85
Leveraget�1 (ind. adj.) �0.02 0.12
Coveraget�1 (ind. adj.) 0.01 1.77
Loan characteristics
Log(Loan maturity) 0.13 1.01
Log(Loan size) �0.06 0.82
All-in-drawn spread 0.00 1.26
Perf. pricing (dummy) �0.17 1.58
LBO loan (dummy) 0.01 0.09
M&A loan (dummy) 0.01 0.05
Debt repayment (dummy) 0.22 1.82
Fixed effects
Borrower: Industry/Rating Yes/Yes
Loan: Year/Lead Yes/Yes
F-test (p-value) 0.47
Adjusted R-squared 0.49
Observations 1,228
Panel B: Upgrades
Same bank (dummy) �0.04 1.03
Same bank, 2005–2007 �0.001 0.01
Borrower characteristics
Log(Assetst�1) �0.20 2.96
ROAt�1 (ind. adj.) 0.24 0.56
Leveraget�1 (ind. adj.) �0.32 2.21
Coveraget�1 (ind. adj.) �0.01 2.51
Loan characteristics
Log(Loan maturity) �0.03 0.27
Log(Loan size) 0.06 0.84
All-in-drawn spread �0.00 0.77
Perf. pricing (dummy) 0.15 1.84
LBO loan (dummy) �0.15 0.93
M&A loan (dummy) �0.44 3.26
Debt repayment (dummy) 0.18 1.04
Fixed effects
Borrower: Industry/Rating Yes/Yes
Loan: Year/Lead Yes/Yes
F-test (p-value) 0.50
Adjusted R-squared 0.43
Observations 1,228
Because we cannot identify the seller of loans in thesecondary market, we limit the sample to primary marketpurchases for this part of the analysis (hence, we use only
Loan rating changes.
f loans sold to a CLO underwritten by their lead arranger with other loans
The unit of observation for the analysis is CLO x loan. The dependent
raded or upgraded in a given period after the loan origination date. Letter
, etc.) where credit watch negative or positive counts at þ or �0.5,
en the numerical rating changes. The focus is on the Same bank dummy
d 0 otherwise. Same bank 2005-2007 is essentially an interaction term
-value corresponds to the statistical test of the null hypothesis that Same
odel. Ratings data comes from Reuters Gold Sheets (compiled from S&P
le definitions are the same as in Table 1. All specifications include fixed
de) and rating at origination, and the identity of the loan lead arranger.
es for BBþ , BB, and BB� . Rating fixed effects are relative to the omitted
, 5%, and 10% level is indicated by nnn, nn, and n, respectively.
At-origination sample
2-year horizon
Coeff. t-stat
0.004 0.10
0.08 0.83
0.17 2.34 nn
n�0.77 1.29
�0.04 0.26n 0.01 2.47 nn
�0.11 1.01
�0.14 1.84 n
�0.00 2.01 nn
�0.29 3.34 nnn
0.12 0.70
�0.00 0.02n 0.36 1.91 n
Yes/Yes
Yes/Yes
0.33
0.59
1,334
�0.04 0.99
0.03 0.36
nnn�0.13 1.58
0.19 0.40nn
�0.06 0.33nn
�0.00 0.61
0.08 0.62
0.03 0.33
0.00 0.50n 0.30 2.62 nnn
�0.26 1.53nnn
�0.35 1.95 n
0.16 0.85
Yes/Yes
Yes/Yes
0.90
0.33
1,334

E. Benmelech et al. / Journal of Financial Economics 106 (2012) 91–113110
the information in DealScan for the at-origination sample).This ensures that the loan’s lead arranger sold the loanto the CLO. We separate primary market purchases ofloans by CLOs into two groups: cases in which the loanarranger is the CLO under writer (same bank) and cases inwhich the loan arranger is different from the CLO under-writer (different bank). Then we compare post-originationborrower performance across the two types of loans,within a given CLO portfolio, using three different perfor-mance measures. We omit CDS tests because the sampleof within-CLO same bank observations with CDS spreadsis small. To compare the performance of different loanswithin the same CLO portfolio, we are using a (loan�CLO)data set. In all regressions, we include CLO fixed effectsand cluster standard errors by loan. Given that ourcomparison is between two groups of securitized loans,it is unlikely that the results are driven by unobservablefactors that might explain why some loans are securitized.Thus, by studying the intensive margin of securitizationwe alleviate some of the concerns about the endogeneityof the securitization decision itself. In addition, we only
Table 10Does securitization by the originator predict worse future performance? (H2):
This table compares post-origination changes in implied probability of defau
loans were not securitized. Implied default probabilities are calculated using th
Shumway (2008). The unit of observation for the analysis is a loan. The depen
probability over the window. The t�1 implied default probability (Pt-1) is mea
contains only securitized loans. The unit of observation for the analysis is CLO x
loan appears in a CLO underwritten by its lead arranger and zero otherwise.
marginal effect for loans originated between 2005 and 2007. The p-value corres
bank 2005–2007 is equal to zero. Specifications include fixed effects for the ye
rating at origination, and the identity of the loan lead arranger. We use the most
BB, and BB� . Rating fixed effects are relative to the omitted category unrated. W
(150 observations) and the estimation requires enough loans for a within-portf
excluding other types of fixed effects. Standard errors are clustered by loan. Vari
10% level is indicated by nnn, nn, and n, respectively.
0–12 months post-event
Coeff. t-stat
Same bank (dummy) �0.009 1.59
Same bank 2005–2007 �0.058 1.00
Borrower characteristics
Log(Assetst�1) �0.15 3.46
ROAt�1 (ind. adj.) �1.55 2.62
Leveraget�1 (ind. adj.) �0.18 1.03
Coveraget�1 (ind. adj.) 0.00 0.60
P t�1 (ind. adj.) �1.11 6.62
Loan characteristics
Log(Loan maturity) �0.34 4.82
Log(Loan size) 0.19 2.40
All-in-drawn spread 0.00 3.31
Perf. pricing (dummy) �0.09 1.14
LBO loan (dummy) 0.03 0.24
M&A loan (dummy) �0.37 3.24
Debt repayment (dummy) �0.05 0.50
Fixed effects
Borrower: Industry/Rating Yes/Yes
Loan: Year/Lead No/Yes
F-test (p-value) 0.26
Adjusted R-squared 0.98
Observations 748
include CLOs for which we have a clearly identifiedunderwriter.
Table 8 examines secondary market loan performanceacross both types of loans. As before, the dependent variableis the percentage change in the mid-quote (the average ofthe bid and ask quotes) in a window around origination. Onaverage, loans purchased from the CLO underwriter experi-ence more price appreciation on the secondary market afterloan origination than other loans in the same CLO portfolio.In the first year after origination, same bank loans origi-nated before 2005 experience a 0.1 percentage point largerprice appreciation; in the second year, it is a 0.9 percentagepoint differential. Same bank loans originated between2005 and 2007 seem to under-perform same bank loansoriginated between 1997 and 2004 in the second yearafter origination (as seen by the coefficient Same bank in
2005–2007). However, the total effect for loans originatedin the late period is given by the by the sum of theSame bank and Same bank in 2005–2007 coefficients. Asshown by the p-value for the F-test, we cannot reject thehypothesis that same bank loans originated during this
implied probability of default.
lt (P) for borrowers whose loans were securitized and borrowers whose
e reduced form Merton (1974)-style approach described in Bharath and
dent variable is the change in the borrower’s implied one-year default
sured as of month-end in the month before loan origination. The sample
loan. The focus is on the Same bank dummy which is equal to one when a
Same bank 2005–2007 is essentially an interaction term reflecting the
ponds to the statistical test of the null hypothesis that Same bankþSame
ar of loan origination, the borrower’s industry (two-digit SIC code) and
granular rating information; e.g., we include separate dummies for BBþ ,
e omit year fixed effects because the number of same bank loans is small
olio comparison with fixed effects. The results are robust to alternatively
able definitions are the same as in Table 1. Significance at the 1%, 5%, and
At-origination sample
13–24 months post-event
Coeff. t-stat
0.002 0.15
0.002 0.05
nnn�0.04 0.76
nnn 0.50 0.31
0.92 3.70 nnn
�0.01 2.97 nnn
nnn 0.60 1.02
nnn 0.51 4.17 nnn
nn�0.10 0.66
nnn�0.00 0.56
0.11 1.34
�0.30 1.11nnn 0.16 0.81
�0.25 1.66 n
Yes/Yes
No/Yes
0.90
0.96
732

E. Benmelech et al. / Journal of Financial Economics 106 (2012) 91–113 111
period perform the same as other securitized loans. Also,the mean one-year price change in our sample is around1–2% with a standard deviation of around 10%. While some
Table 11Robustness check: frequency of covenant violations.
This table compares the frequency of covenant violations across groups of loan
observation for the analysis is a loan. Number of financial covenants is the number
from loan amendments remarks as reported in DealScan. The at-origination sample
contains loans originated between January 2005 and July 2007. Significance at the
Panel A: Does securitization predict worse future performance? (H1)
At-origi
Originated 1997–2004
Securitized
Yes No t-stat
Number of loans 245 151
Number of financial covenants Obs. 245 151
Mean 3.28 3.56 2.04
Median 3.00 4.00
Std. Dev. 1.52 1.08
Covenant violation, 0–12 mo. Obs. 245 151
Mean 0.02 0.03 0.12
Median 0.00 0.00
Std. Dev. 0.15 0.16
Covenant violation, 13–24 mo. Obs. 245 151
Mean 0.04 0.05 0.56
Median 0.00 0.00
Std. Dev. 0.20 0.22
Covenant violation, after 24 mo. Obs. 245 151
Mean 0.03 0.02 0.75
Median 0.00 0.00
Std. Dev. 0.18 0.14
Covenant violation ever Obs. 245 151
Mean 0.07 0.07 0.27
Median 0.00 0.00
Std. Dev. 0.26 0.25
Panel B: Does securitization by the originator predict worse future performance?
Originat
Sam
Yes
Number of loans 80
Number of financial covenants Obs. 80
Mean 3.24
Median 3.00
Std. Dev. 1.22
Covenant violation, 0–12 mo. Obs. 80
Mean 0.03
Median 0.00
Std. Dev. 0.16
Covenant violation, 13–24 mo. Obs. 80
Mean 0.03
Median 0.00
Std. Dev. 0.16
Covenant violation, after 24 mo. Obs. 80
Mean 0.03
Median 0.00
Std. Dev. 0.16
Covenant violation ever Obs. 80
Mean 0.05
Median 0.00
Std. Dev. 0.22
performance differences are statistically significant, they donot appear strongly economically significant, especially inthe first year after origination.
s that correspond to the two hypotheses tested in the paper. The unit of
of covenants on the loan at origination. Covenant violations were compiled
contains loans originated between 1997 and May 2007. The portfolio sample
1%, 5%, and 10% level is indicated by nnn, nn, and n, respectively.
nation sample Portfolio sample
Originated 2005–2007 Originated 2005–2007
Securitized Securitized
Yes No t-stat Yes No t-stat
57 34 1,084 2,508
57 34 1,084 2,508nn 2.56 2.24 1.01 0.77 0.57 4.50 nnn
3.00 2.00 0.00 0.00
1.54 1.42 1.29 1.18
57 34 1,084 2,508
0.05 0.00 1.36 0.00 0.00 1.32
0.00 0.00 0.00 0.00
0.23 0.00 0.00 0.04
57 34 1,084 2,508
0.02 0.00 0.77 0.00 0.00 0.23
0.00 0.00 0.00 0.00
0.13 0.00 0.03 0.03
57 34 1,084 2,508
0.00 0.00 – 0.00 0.00 1.38
0.00 0.00 0.00 0.00
0.00 0.00 0.04 0.02
57 34 1,084 2,508
0.05 0.00 1.36 0.00 0.00 0.21
0.00 0.00 0.00 0.00
0.23 0.00 0.05 0.06
(H2)
At-origination sample
ed 1997–2004 Originated 2005–2007
e bank Same bank
No t-stat Yes No t-stat
165 24 33
165 24 33
3.30 0.32 2.54 2.58 0.08
4.00 2.50 3.00
1.64 1.72 1.41
165 24 33
0.02 0.04 0.04 0.06 0.31
0.00 0.00 0.00
0.15 0.20 0.24
165 24 33
0.05 0.87 0.00 0.03 0.85
0.00 0.00 0.00
0.22 0.00 0.17
165 24 33
0.04 0.47 0.00 0.00 –
0.00 0.00 0.00
0.19 0.00 0.00
165 24 33
0.08 0.98 0.04 0.06 0.31
0.00 0.00 0.00
0.28 0.20 0.24

E. Benmelech et al. / Journal of Financial Economics 106 (2012) 91–113112
Table 9 examines whether the sale of a loan by its leadarranger into one of its own CLOs predicts downgrades orupgrades in loan ratings. Panel A presents the downgraderesults and Panel B presents the upgrade results. The signson the same bank coefficients indicate that in the twoyears after origination, borrowers whose loans are sold toCLOs underwritten by their lead arranger are more likelyto be downgraded and less likely to be upgraded thanother loans in the same CLO. Although the economicmagnitudes appear to be non-trivial, the results are notstatistically significant regardless of the loan vintage.
In Table 10, we examine implied default probabilitiesfrom the reduced-form Merton model. While the numberof observations in the sample is large, the number of samebank loans in the sample is relatively small (only around150) and the performance comparison is made amongloans within a given CLO portfolio. For this reason wehave to drop a set of fixed effects to estimate theregression. We drop year fixed effects because the major-ity of loans acquired by a given CLO tend to be acquiredover a limited period of years around CLO issuance. So thewithin-portfolio comparison would naturally help to limitthe vintage of loans being compared. The results showthat companies whose loans are bought by CLOs under-written by their lead arranger outperform other bor-rowers whose loans are held in the same portfolio overa one-year horizon and under-perform over a two-yearhorizon. While the differences seem economically large(the average change in default probability in our sample is2.4%), they are again statistically not different from zeroregardless of the loan vintage.
Overall, the evidence rejects the hypothesis that banksthat participate on both sides of the market (originatingloans and underwriting CLOs) exploit their private infor-mation to the detriment of CLO managers. By somemeasures, loans purchased from the CLO underwriterand originated before 2005 outperform other loans inthe same portfolio.
4.5. Robustness check: loan covenant violations
As a robustness check, we examine one additionalmeasure of loan performance: the frequency of financialcovenant violations. Table 11 summarizes covenant viola-tions for the samples that correspond to the two hypoth-eses tested in the paper. Covenant violations are rare forthe loans in our sample: Only 6% of loans in the at-origination sample and less than 1% of loans in theportfolio sample experienced a covenant violation. Wepresent univariate results because of the large number offixed effects required in our benchmark specifications.As shown in the first four columns of the table, securitizedloans are no more likely to experience covenant violationsthan unsecuritized loans in both samples regardless of theloan vintage. Naturally, the probability that a poorlyperforming borrower violates a loan covenant dependson the nature of the covenant package included in theloan. The disappearance of covenants from loan contractsduring the recent boom was well documented in mediareports and industry newsletters. We find no evidencethat securitized loans have fewer covenants except in one
case: Securitized loans originated pre-2005 (before cov-lite loans became popular) have 0.28 fewer financialcovenants on average. This raises the possibility that thereason that securitized loans originated before 2005do not violate covenants at a higher rate than theirunsecuritized counterparts could be that they have fewercovenants to begin with. However, in a multivariate settingwith our standard controls, no significant difference existsin the incidence of covenants. In summary, securitizedloans do not appear to violate loan covenants at a higherfrequency than unsecuritized loans, which supports theresults from the other performance regressions.
5. Conclusion
Using a unique data set on loans used as CLO collateralwe provide the first insight on whether securitization ledto risky lending in the corporate loan market. Contrary tothe adverse selection hypothesis, we find that securitizedloans were of similar quality as unsecuritized loans soldto other institutional investors. Our paper highlights theuniqueness of securitization in the corporate loan market.In particular, corporate loans purchased by CLOs aresyndicated. A securitized loan that is held by CLOs cansimultaneously be held by mutual funds, hedge funds, andother nonbank financial institutions. In general, to be ableto attribute under-performance results to incentiveswithin CLOs, we must understand incentives not only oforiginating lenders but also of other investors in thelending syndicate.
Our findings indicate that adverse selection in thesecuritization of corporate loans is at best weak.These results stand in sharp contrast to the findings onmortgage securitization and provide a broad insight aboutstructured finance products: Adverse selection is not aninevitable consequence of securitization. Skin in the gameon the part of the originating lender and distributionamong investors could be sufficient to alleviate concernsabout adverse selection in collateral pools. This is con-sistent with the risk retention requirements such as thoseoutlined in the Dodd-Frank Act. However, another impor-tant point that emerges from our paper is that vastdifferences exist in the securitization process, and theattendant incentive problems, across structured assetclasses. To that extent, the one-size-fits-all approach torisk retention taken in the financial reform bill could missits mark and have the unintended effect of limiting thesupply of credit to firms.
References
Ai, C., Norton, E.C., 2003. Interaction terms in logit and probit models.Economics Letters 80, 123–129.
Altman, E., 1968. Financial ratios, discriminant analysis and the predic-tion of corporate bankruptcy. Journal of Finance 23, 589–609.
Altman, E., Gande, A., Saunders, A., 2010. Bank debt versus bond debt:evidence from secondary market prices. Journal of Money, Creditand Banking 42, 755–767.
Benmelech, E., Dlugosz, J., 2009. The alchemy of CDO credit ratings.Journal of Monetary Economics 56, 617–634.
Bharath, S., Shumway, T., 2008. Forecasting default with the Mertondistance to default model. Review of Financial Studies 21,1339–1369.

E. Benmelech et al. / Journal of Financial Economics 106 (2012) 91–113 113
Bord, V., Santos, J., 2011. Did the Rise of CLOs Lead to Riskier Lending?Unpublished Working Paper. Federal Reserve Bank of New York,New York.
Coval, J., Jurek, J., Stafford, E., 2009. The economics of structured finance.Journal of Economic Perspectives 23, 3–25.
Dennis, S., Mullineaux, D., 2000. Syndicated Loans. Journal of FinancialIntermediation 9, 404–426.
Drucker, S., Mayer, C., 2008. Inside Information and Market Making inSecondary Mortgage Markets. Unpublished working paper. Colum-bia Business School, The Paul Milstein Center for Real Estate,New York.
Drucker, S., Puri, M., 2009. On loan sales, loan contracting, and lendingrelationships. Review of Financial Studies 22, 2635–2672.
Fabozzi, F.J., Goodman, L., Lucas, D., 2006. Collateralized Debt Obliga-tions. John Wiley and Sons, Inc., Hoboken, NJ.
Financial Times, 2011. Risky Loans Stage Comeback. N. Bullock. March 13.Gorton, G., Pennacchi, G., 1995. Banks and loan sales: marketing non-
marketable assets. Journal of Monetary Economics 35, 389–411.Gupta, A., Singh, A., Zebedee, A., 2008. Liquidity in the pricing of
syndicated loans. Journal of Financial Markets 11, 339–376.Ivashina, V., 2009. Asymmetric information effects on loan spreads.
Journal of Financial Economics 92, 300–319.Ivashina, V., Scharfstein, D., 2010. Loan syndication and credit cycles.
American Economic Review (Papers and proceedings) 100, 57–61.Ivashina, V., Sun, Z., 2011a. Institutional demand pressure and the cost of
corporate loans. Journal of Financial Economics 99, 500–522.Ivashina, V., Sun, Z., 2011b. Institutional stock trading on loan market
information. Journal of Financial Economics 100, 284–303.Keys, B., Mukherjee, T., Seru, A., Vig, V., 2010. Did securitization lead to
lax screening? Evidence from subprime loans. Quarterly Journal ofEconomics 125, 307–362.
Loan Syndication and Trading Association, 2007. The Handbook of LoanSyndication and Trading. Loan Syndication and Trading Association
and McGraw-Hill, New York.Merton, R., 1974. On the pricing of corporate debt: the risk structure of
interest rates. Journal of Finance 29, 449–470.Nadauld, T., Sherlund, S., 2009. The Role of the Securitization Process in
the Expansion of Subprime Credit. Unpublished working paper. OhioState University, Charles A. Dice Center for Research in FinancialEconomics, Columbus, OH.
Nadauld, T., Weisbach, M., Did securitization affect the cost of corporatedebt? Journal of Financial Economics, in press. http://dx.doi.org/10.
1016/j.jfineco.2012.03.002.Reuters, 2007. Seeds of credit crunch grow in LBO loan market. W. Siew
and M. Flaherty. June 19.Shivdasani, A., Wang, Y., 2009. Did structured credit ruel the LBO boom?
Unpublished working paper. University of North Carolina, ChapelHill, NC.
Standard & Poor’s, 2006. A Guide to the Loan Market. Standard & Poor’s,New York.
Sufi, Amir, 2007. Information asymmetry and financing arrangements:evidence from syndicated loans. Journal of Finance 62, 629–668.
Tavakoli, J., 2003. Collateralized Debt Obligations and StructuredFinance: New Developments in Cash and Synthetic Securitization.John Wiley and Sons, Inc., Hoboken, NJ.
Wall Street Journal, 2007. Easy money: behind the buyout surge, a debtmarket booms—CLOs spark worries of volatility and risk; loan
standards loosen. S. Ng and H. Sender. June 26.Wall Street Journal, 2010. Cov-lite loans make a return. K. Greene. March 26.