Embed Size (px)
Citation preview

1
INTERMOUNTAIN RESEARCH & EXTENSION CENTER
2012 ANNUAL FIELD DAY
65 Years of Research and Still Moving Forward....

2
WELCOME TO THE 2012 INTERMOUNTAIN RESEARCH AND EXTENSION CENTER
FIELD DAY
Welcome to our Annual Field Day. This event is a collaborative effort
involving all of the Center Staff, visiting researchers and many growers and
grower groups in the region. The general purpose of the tour is to allow
participants a chance to see research being conducted on our Center and
interact with Center researchers. We sincerely appreciate the opportunity
to share our research programs with members of the community, many of
whom have helped sponsor the research and this event.
During the tour, please ask questions freely. If you would like additional
information on any project, please seek out a side conversation with the
researcher during breaks or over lunch. Additional information on all our
research projects is available at the office.
Please enjoy the tour, the lunch and the conversation.
Thanks for coming!
Sincerely,
The IREC Staff

3
2012 FIELD DAY TABLE OF CONTENTS
History of IREC Employees .............................................................................................................. 3
Snippets of IREC History .................................................................................................................. 4
IREC Current Staff ........................................................................................................................... 5
IREC Website Information ............................................................................................................... 6
Research Summaries .................................................................................................................. 7-11
Management of Two Spotted Spider Mites and Mint Root Borer in Peppermint ................... 12-19
Fungicide Rate & Application Timings for Managing White Rot Disease in Onions ................ 20-25
Insecticide Strategies for Thrips Control in Onions .................................................................. 26-32
Nitrogen Management in Wheat to Maximize Yield & Protein ............................................... 33-38
2012 IREC Potato Experiments ...................................................................................................... 39
Maggot Control in Processing Onions ...................................................................................... 40-41
Herbicide Resistance Management Programs for RR Alfalfa .................................................. 42-43
Determining the Efficacy and Cost of Pocket Gopher Control Practices in Alfalfa .................. 44-46
Alfalfa Variety Trials ................................................................................................................. 47-51
Field Station Maps ........................................................................................................................ 52
Tour Route Map ............................................................................................................................ 53
2012 Sponsor List .......................................................................................................................... 54
Tour Agenda/Schedule .................................................................................................... Back Cover

4
HISTORY OF IREC EMPLOYEES Farm Advisor
Center Director
Center Superintendent
Research Assistants Mechanics Ag Techs Office Managers
County Farm Laborers
Burt Hoyle
L W George Ernie Kucera
Ken Baghott Ernie Kucera Ronald Peterson Jeanne Perry Harold Stewart
Roger Benton Wayne Osborne Norma Haug George Bauer Don Brissenden
E.P. Cowan Mildred Dingler Lew Blake Richard Carroll
Paul Puri Joe Watkins Joe Watkins Larry Miles
Harry Carlson A E Stewart
Jerry Smalley Trudy Eastman Douglas Fitch
Eddie Nedbalek Paul White
Joseph Leonard
Randy Darrow
Josephine Fogle Billey Stepp
Harry Carlson Robert Fensler Bill Schey
Don Kirby Eric Casey
Dennis Camden
Allan Taylor Wayne Mall
Jerry Lousignont
Don Kirby Greg McCulley Cynthia Campbell Kathy Martinez
Gail Quick Jeff Bowen
Ron Baley Linda Woodley Marla Cross
Don Kirby (Interim)
Marla Jerzykowski Josh McCollam
Tom Tappan Joyce Guthrie Scott Carroll
Harry Carlson Michael Bell Charlotte Barks Kim Baley Lonnie Lemus
Jessica Dubois Cristina San Juan
Don Kirby Greg McCulley Jennifer Engel Craig Byrum
Corey Thompson Tom Tappan Seferino Salazar Jennifer Engel Nancy McCollam Deanna Ross
Brooke Kleiwer Shanna Done Laurie Askew Leupoldo Reyes
Rob Wilson Rob Wilson Kevin Nicholson Maria Miranda
Darrin Culp Josefina Vallejo
Robbie Carver
Denotes Current Employees Matt Barber
Ryan Olivier

5
1947 Cooperative Agreement entered into by the Bureau of Reclamation (BOR), Tulelake Growers
Association and the University of California (UC) to “establish a demonstration farm consisting of approximately eleven acres of land in the vicinity of Tulelake, California.” Initial demonstration crops included sweet corn, melons, squash, tomatoes, lettuce, onions, potatoes, celery, and lettuce. Burt Hoyle was the first Center Director.
1948 Demonstration trials with cereal grains, alfalfa, pasture, sugar beets, and safflower were started.
1949 Experiments examined soil fertility, weed control, reclaiming alkali soil, straw decomposition, and frost control using airplane smoke. First temperature records were kept.
1950 Office building enlarged. Full time Farm Advisor, Ken Baghott, hired. First strawberry trials.
1951 Alfalfa yields on 3 year old stands with 3 cuttings yielded between 5.5 – 7.1 ton/a. Potato storage built.
1953 First horseradish projects to determine planting spacing and root position. “Hand vs. Mechanical Harvesting of Potatoes” trial reveals “the cost of the hand harvesting was 4 times more expensive than the mechanical.”
1955 Field Day includes “Peppermint Trials.” Chipping potatoes added to trials.
1956 Proceedings begin to acquire title from BOR. New office built.
1957 Recommended study of feeding alfalfa pellets to cattle, sheep and hogs.
1959 Cost of irrigating twelve acres $45.
1964 Land, buildings and some equipment transferred to UC by BOR. Sixty-four acres added.
1969 Mint trial results in 50# oil/acre. Mint was baled and hauled to Lakeview for distillation.
1975 Sunflower for oil trial thwarted by bird damage.
1979 Study of Genetically Altered (Ice-Minus) Bacteria for Frost Protection in Potatoes begins.
1981 Harry Carlson begins 28 year career at IREC.
1984 IREC Field Day project titles include: “Feed the Crop, Not the Weed,” “New Potato Varieties Eyed,” “If Nematodes Could Read.” Jerusalem artichokes, fodder beets, milo and chicory grown and evaluated for biomass conversion to alcohol.
1986 EPA joins in Ice-Minus study, monitoring aerosol bacterial applications.
1989 Automated CIMIS weather station unveiled on Station.
1996 Field Day activities include “Taste Test of Baked Potatoes from Experimental Plots.” Field Day sponsors include Holly Sugar Company and Spreckles Sugar.
2001 Of 140 acres at IREC, only seven were available for research due to water shut-off. Stress-management techniques for farmers were reviewed.
2004 Peppermint mini still built in cooperation with Tulelake Mint Growers.
2006 Almond and grape trials were planted at IREC.

6
2012 FIELD DAY MEET THE CURRENT STAFF
Rob Wilson Center Director / Farm Advisor
Don Kirby Superintendent
Shanna Done Business & Financial Manager
Laurie Askew Cooperative Extension Coordinator
Kevin Nicholson Staff Research Associate II
Darrin Culp Staff Research Associate II
Greg McCulley Senior Farm Machinery Mechanic
Tom Tappan Farm Machinery Mechanic
Seferino Salazar Senior Agricultural Technician
Josefina Vallejo Seasonal Farm Worker
Leopoldo Pedroza Seasonal Farm Worker
Maria Luna-Miranda Seasonal Farm Worker
Robert Carver Seasonal Farm Worker
Matthew Barber Seasonal Farm Worker/Student Intern
Ryan Olivier Seasonal Farm Worker

7
2012 FIELD DAY INTERMOUNTAIN RESEARCH & EXTENSION CENTER
WEBSITE INFORMATION
http://ucanr.org/sites/Intermountain_REC/
Welcome to the IREC website! A brief description of the site follows:
Home: Calendar - Sign up for Emailed Event Reminders
Irrigation and Weather: Use the Crop Water Use Table and
Statewide & Tulelake CIMIS Data
Current Research: Keep Abreast of IREC Current Projects by Crop
Cost Studies: View ANR and IREC Cost Studies
Newsletters: Subscribe to Emailed Editions of Ag Notes & Field Day Handouts
Research Advisory Committee: Meet IREC’s Distinguished Panel of Experts
Research Progress Reports: Download Progress Reports by Crop
Research Proposal Process: How to Submit Your Project
Tulelake Farm Advisor: View the Tulelake Farm Advisor Website
UC Weed Science Blog: Keep Up With Weed Control and Management
Endemic & Invasive Pests & Diseases: Information on the Threat of Invasive Species
Contact Us: Who’s Who at IREC
Directions: How to Get to IREC from the North and the South
We hope you enjoy our website. Feel free to send us your comments by clicking on the “Contact Webmaster” link on the bottom of each page.
Thanks for your support!

8
2012 RESEARCH PROJECTS INTERMOUNTAIN RESEARCH & EXTENSION CENTER
Project: 132 Potato Variety Selection Evaluation & Development
Project Investigators:
Rob Wilson, Center Director, UC Intermountain Research & Extension Center Don Kirby, Superintendent, Intermountain Research & Extension Center David Holm, Professor of Horticulture, Colorado State University Julian Creighton Miller, Professor of Horticulture, Texas A & M University Brian Charlton, Cropping Systems Specialist, Oregon State University, Klamath Basin Research and Experiment Center
Objectives: Evaluate new russet, specialty, and chip cultivars developed by public and private breeding programs for adaptation and suitability to Tulelake’s unique soil, climate and marketing conditions.
Project: 133 Management of Potato Early Die in the Tulelake Basin
Project Investigators:
Rob Wilson, Center Director, UC Intermountain Research & Extension Center Don Kirby, Superintendent, Intermountain Research & Extension Center R. Michael Davis, Cooperative Ext. Specialist, Department of Plant Pathology, UC Davis
Objectives: 1. Compare the efficacy and cost-effectiveness of different fumigant application rates in fields with a high incidence of early-dying on Tulelake soils.
2. Evaluate the efficacy of fungicides and biological control of black scurf and black dot.
3. Determine the effectiveness of stem residue management at harvest on the incidence of early-dying in subsequent potato crops.
4. Determine if irrigation scheduling can influence the incidence of early-dying disease.
Project: 146 Cultural Management of New Potato Varieties
Project Investigators:
Rob Wilson, Center Director, UC Intermountain Research & Extension Center Don Kirby, Superintendent, Intermountain Research & Extension Center David Holm, Professor of Horticulture, Colorado State University Julian Creighton Miller, Professor of Horticulture, Texas A & M University Brian Charlton, Cropping Systems Specialist, Oregon State University, Klamath Basin Research and Experiment Center
Objectives: Develop cultivar specific cultural management practices appropriate for the successful introduction of new cultivars into commercial production.
Project: 239 Improving Spring Barley for Northern Intermountain Areas
Project Investigators:
Lynn Gallagher, Researcher, Department of Plant Sciences, UC Davis Dr. Pat Hayes, Barley Breeder, Dept. of Crop & Soil Science, OSU Corvallis, Oregon
Objective: The project objective is to increase grain yield and disease resistance in spring barley adapted to the Klamath Basin.

9
Project: 255 Effect of Nitrogen Fertilization Practices on Spring Wheat Protein Content
Project Investigators:
Steve Orloff, County Director/Farm Advisor, Siskiyou County, Yreka Steve Wright, Farm Advisor –Tulare/Kings Counties Rob Wilson, Center Director, UC Intermountain Research & Extension Center Don Kirby, Superintendent, Intermountain Research & Extension Center
Objectives: 1. Compare the protein content of the most popular hard red spring wheat varieties.
2. Assess the effectiveness of late-season N applications to increase protein in different spring wheat varieties.
3. Evaluate controlled- and slow-release N fertilizers for improving both grain yield and protein.
4. Evaluate N application practices and soft white wheat varieties to obtain high yield with low protein content (approximately 10 percent).
Project: 260 Development of Wheat Varieties for California
Project Investigators:
Dr. Jorge Dubcovsky, Assistant Professor, Department of Plant Sciences, UC Davis Oswaldo Chicaiza, Research Assistant, Department of Plant Sciences, UC Davis John Heaton, Department of Plant Sciences, UC Davis Lee Jackson, Extension Agronomist, Department of Plant Sciences, UC Davis
Objectives: To produce new varieties & improved germplasm and distribute them to growers, breeders and other researchers. A multi-objective project will be conducted which: 1. Introduces new germplasm for evaluation and breeding. 2. Develops breeding populations through hybridization, selection and evaluation. 3. Develops information on the inheritance of characters important to quality and
yield in California production environments and finds molecular markers to assist the introgression of these characters into adapted breeding lines, and finally
4. Produces Breeders Seed for multiplication as new varieties and germplasm for distribution to breeders and researchers. Specific goals are to introduce and maintain disease resistance, maintain or increase grain yield potential and improve end-use characteristics.
Project: 340 Alfalfa Experimental Germplasm and Cultivar Adaptation and Evaluation
Project Investigators:
Dan Putnam, Extension Agronomist, Dept. of Plant Science, UC Davis Steve Orloff, County Director/Farm Advisor, Siskiyou County, Yreka Craig Giannini, UC SRA, UC Davis
Objective: 1. Evaluate certified cultivar differences in alfalfa forage yield, quality, and persistence, and to communicate these results to clientele.
2. Develop and provide forage yield and performance data on alfalfa experimental germplasm to public and private alfalfa scientists.
Project: 346 Establishing Critical Sulfur Plant Tissue Values for Alfalfa
Project Investigators:
Steve Orloff, County Director/Farm Advisor, Siskiyou County, Yreka Dan Putnam, Extension Agronomist, Department of Plant Sciences, UC Davis
Objective: A new method of alfalfa plant tissue testing shows potential for routine analysis using the same cored-bale sample that is used for forage quality analysis. In order to use a cored-bale sample which represents the entire above-ground plant rather than individual plant parts, new critical plant tissue values need to be developed. Field tests have been completed in current years to establish critical values for phosphorus and potassium. Here we propose to do a field trial to help develop critical values for sulfur. These results, along with data already collected, should enable us to develop a table of critical values to guide fertilization practices for alfalfa.

10
Project: 349 Fall Harvest Management Strategies for Alfalfa
Project Investigators:
Steve Orloff, County Director/Farm Advisor, Siskiyou County, Yreka Dan Putnam, Extension Agronomist, Department of Plant Sciences, UC Davis
Objective: Fall harvest management is a critical aspect of alfalfa production in the intermountain area. If the alfalfa plants enter the winter with insufficient root reserves, reduced alfalfa vigor or even winter kill may result. In recent years growers have started harvesting later and later into the fall. The effect of this strategy on alfalfa yield and stand life in the Intermountain environment is not well understood and deserves further research.
Project: 367 Avoiding Weed Shifts and Weed Resistance in Roundup-Ready Alfalfa Systems
Project Investigators:
Steve Orloff, County Director/Farm Advisor, Siskiyou County, Yreka
Objectives: The objectives of this project are to evaluate alternative herbicides other than glyphosate in a RR system to determine: 1. The efficacy of alternative herbicides. 2. The effect of different conventional herbicides on alfalfa yield. 3. Assess the economics of different weed management systems.
Project: 397 Alfalfa Germplasm Evaluation - Fall Dormancy
Project Investigators:
Larry Teuber, Professor, Department of Plant Sciences, UC Davis Carla E. Rivera, SRA, Department of Plant Sciences UC Davis Steve Orloff, County Director/Farm Advisor, Siskiyou County, Yreka
Objectives: 1. To determine fall dormancy reaction of cultivars and experimental cultivars that have potential for marketing in California
2. To determine stability of fall dormancy reactions of check cultivars across years and locations.
3. To assess the interregional stability of cultivars and a recently adopted set of standard check cultivars.
4. To evaluate winter injury and follow the relationship between winter injury and fall dormancy.
Project: 451 Application of Diallyl Disulfide (DADS) and Fungicides for the Control of White Rot
on Garlic and Onions
Project Investigators:
R. Michael Davis, Cooperative Extension Specialist, Dept. of Plant Pathology, UC Davis Allison Ferry, Graduate Student, Plant Pathology Dept, UC Davis Rob Wilson, Center Director, UC Intermountain Research & Extension Center
Objectives: 1. Demonstrate the effectiveness of DADS in lowering soil levels of white rot sclerotia.
2. Demonstrate fungicidal control of white rot in onions and garlic in plots with reduced soil sclerotia levels.
Project: 456 Onion Weed Control
Project Investigators:
Rob Wilson, Center Director, UC Intermountain Research & Extension Center
Objectives: 1. Evaluate crop and weed response to varied rates and timings of pre- and post- emergence water-run herbicides.
2. Use the data collected to form UC recommendations and possible herbicide label changes for weed control in onions.

11
Project: 458 Evaluation of Insecticide Seed Treatments for Seed Corn Maggot Control
Project Investigators:
Rob Wilson, Center Director, UC Intermountain Research & Extension Center Larry Godfrey, Cooperative Ext. Specialist, Entomology CAES, UC Davis
Objective: Evaluate the efficacy and crop safety of insecticides applied as a seed treatment and in-furrow at planting for maggot control in onions.
Project: 459 Management Practices for Improved Thrips Control in Klamath Basin Onions
Project Investigators:
Steve Orloff, County Director/Farm Advisor, Siskiyou County, Yreka Rob Wilson, Center Director, UC Intermountain Research & Extension Center Larry Godfrey, Cooperative Ext. Specialist, Entomology CAES, UC Davis
Objectives: 1. Compare the effectiveness of a range of insecticides for thrips control including standard conventional treatments, organic or low risk insecticides, and experimental insecticides.
2. Evaluate the two most popular insecticides for thrips control applied via chemigation and a foliar-applied spray application to determine the relative efficacy of the different application methods.
3. Develop methods to improve the efficacy of chemigation applications. 4. Evaluate different strategies for thrips management over the season to compare
single insecticides, tank mixes, alternating chemistries and application timing.
Project: 475 The Influence of Biological Inoculants and Specialty Fertilizers on Onion Growth
and Yield
Project Investigators:
Rob Wilson, Center Director, UC Intermountain Research & Extension Center
Objectives: 1. Investigate the influence of organic approved biological inoculants on onion growth, onion yield, and onion resistance to white rot.
2. Investigate the influence of fertilizer additives on onion growth, onion yield, fertilizer efficiency, and pest resistance.
Project: 561 Development of Cultural Management Recommendations for the Production of
Peppermint in the Klamath Basin
Project Investigators:
Don Kirby, Center Superintendent, UC Intermountain Research & Extension Center Tulelake Mint Growers Association Rob Wilson, Center Director, UC Intermountain Research and Extension Center
Objective: Determine irrigation, fertilization, and harvest management strategies that maximize peppermint oil yield and oil quality under Klamath Basin soil and climatic conditions.
Project: 566 Integrated Pest Management of Insect and Mite Pests of Mint
Project Investigators:
Larry Godfrey, Cooperative Ext. Specialist, Entomology CAES, UC Davis Kris Tollerup, Post-Doctoral Researcher, Entomology CAES, UC Davis Dan Marcum, UC ANR Shasta-Lassen Farm Advisor
Objectives: 1. To investigate the relationship between spider mite numbers and mint yield and quality.
2. To determine and compare the cost-effectiveness of registered miticides against spider mites in mint. To study the use of releases of predatory mites for spider mite management in mint in California.
3. Investigate the use of reduced risk insecticides for management of mint root borer larvae.

12
Project: 569 Weed Control in Peppermint
Project Investigators:
Rob Wilson, Center Director, UC Intermountain Research & Extension Center
Objective: 1. Investigate winter dormant herbicides for control of groundsel in peppermint. 2. Investigate winter dormant herbicides efficacy for providing pre-emergent
control of summer annual weeds. 3. Investigate spring post-emergent herbicides for control of emerged summer
annual weeds.
Project: 703 Medusahead Management Project
Project Investigators:
Joseph DiTomaso, UC Davis, Rangeland & Wild Land Weed Specialist Rob Wilson, Center Director, UC Intermountain Research & Extension Center
Objective: 1. Demonstrate the effectiveness of herbicides for large scale control of downy brome and Medusahead.
2. Determine the utility of using herbicides and reseeding in sage grouse habitat restoration of desirable native species.
3. Consider alternative methods of control with and without re-seeding efforts, and to determine the best seeding method when active restoration practices are necessary.
Project: 779 Determining Efficacy & Cost of Pocket Gopher Control Practices in Alfalfa
Project Investigators:
Steve Orloff, Cooperative Extension Director, Siskiyou County Roger Baldwin, Vertebrate Pest IPM Advisor, Kearny Agricultural Center
Objective: 1. Compare the effectiveness of four different gopher control measures including trapping, baiting with strychnine using an artificial burrow builder, fumigation with aluminum phosphide, and carbon monoxide injection using the PERC unit.
2. Quantify the time, labor requirement and material cost associated with each control practice.
3. Estimate the overall cost effectiveness for each control measure.

13
Using Miticides, Predator Mites, and Effective
Monitoring for Controlling Twospotted Spider
Mites in Peppermint
Project researchers: Kris Tollerup, Rob Wilson, Dan Marcum,
Steve Orloff, and Larry Godfrey
Presenter: Kris Tollerup
The twospotted spider mite, Tetranychus urticae Koch, commonly attacks mint. Feeding
damage can have a negative impact on oil yield and quality; however, this impact is not fully
understood. Effectively managing spider mites requires that pest control advisors and growers
have a monitoring method to efficiently and accurately determine when and if treatment is
necessary. Spider mite monitoring techniques and treatment thresholds were developed at
Oregon State University in the mid 1990s for mint grown in the Pacific Northwest. During 2010
and 2011 we investigated spider mite management methods for California conditions.
Miticides and Yield Loss due to Mite Infestation. At the Intermountain Research and
Extension Center (IREC) in Tulelake, we conducted an experiment in a research mint field using
18' x 40' plots. We evaluated 12 treatments: an untreated control, Omite 6E at 44fl oz/A,
Onager at 20 fl oz/A, Agri-Mek 0.15EC at 12 fl oz/A, Fujimite 5EC at 2 pts/A, Zeal at 3 oz/A,
Acramite 4SC at 24 fl oz/A, and Oberon 2SC at 16, 12, 8, and 2 oz/A, and Requiem at 1 qt/A. We
assessed mite populations by sampling 45 leaves per plot for the presence or absence of mites;
then washed the leaves to obtain the average number of mites per leaf.
With the exception of Acramite, Requiem, and Zeal, a decreasing trend in mite
populations occurred between 9 and 36 days after treatment (DAT) (Fig. 1). All miticide
treatments, except Requiem, reduced populations of TSM below five mites up to 36 DAT (Fig.
1).
In early Sep, we harvested and distilled mint from each plot to estimate oil yield and
quality from data collected in 2011. We found a negative relationship between spider mite
density and yield loss (Fig. 2). Winter-kill, or stand loss, also is negatively associated with spider
mite density (Fig. 3). Results from initial analyses of oil quality data suggest that there is no
relationship between mite density and oil quality.
Inoculative Releases of Predator Mites. In 2011 Neoseiulus fallacis were released at
~2000 mites per A on 30 Jun and 12 Aug. Releases were conducted when spider mite densities
http://uspest.org/mint/twospotmanagement.htm

14
Rate per acre
Control
Acramite 4SC 24 fl
oz
Agri-Mek 0.15EC 2 pts
Fujimite
5EC 12 fl oz
Oberon 16 oz
Requiem 1 qt
Omite 6E 44 fl
oz
Onager 20 fl
oz
Zeal 3 oz
Avg.
num
ber
of
spid
er m
ites
per
lea
f
0
5
10
15
20
258 Jul
15 Jul
21Jul
28 Jul
5 Aug
12 Aug
17 Aug
Treatments applied 12 July
reached 20% of leaves w/1 mite, 20 % of leaves w/≥ 5 mites, 40% of leaves w/1 mite, and 40 %
of leaves w/≥ 5 mites. We did not find a strong relationship between predator mite releases
and spider mite density.
Sampling of Mite Populations for Management Decisions. Analyses indicate that mite
populations tend to aggregate within fields. Within-plant distribution of mites i.e. the
percentage of mite-infested leaves in the top, middle and bottom strata of mint plants, during
the growing season was not aggregated. Our presence / absence and enumerative sampling
models indicate that at a mean of 5 mites / leaf, ~23 leaves per seven locations per 40 acres,
provides a sufficient sample number to estimate mite density. Our findings are an
improvement to the Pacific Northwest sampling model which recommends 45 leaves per 14
locations per 40 acres (Table 1).
Fig. 1. The average number of mites per leaf for miticide treatments applied in 2011.

15
Treatments applied 10 Aug
Yield data collected on 7 Sep 2010
Mite days (2011)
200 400 600 800
Mea
n l
bs
oil
per
A
0
20
40
60
80
100
120
R2 = 0.20
P < 0.001
Mite days (2011)
0 200 400 600 800
Per
centa
ge
stan
d
0%
20%
40%
60%
80%
R2 = 0.14
P < 0.05
Fig. 2. Relationship between oil yield and mite-days in 2011.
Fig. 3. Relationship between winter kill (stand loss), and mite-days in 2011.

16
Plan
Pacific Northwest California
Locations 14 per field 7 locations
Number of leaf samples
45 leaves per location 23 leaves per location
Stem strata 15 leaves each in top, middle, and bottom
Random
Tally threshold 5 ≥ mites per leaf 2 ≥ mites per leaf
Precision D = 0.50 D = 0.25
Table 1. Characteristics of binomial sampling plans developed in the Pacific Northwest and California

17
Using Pheromones to Disrupt Mating of Mint Root Borer in Peppermint.
Project researcher: Kris Tollerup Our goal is to develop a mating disruption (MD)-based program, as an alternative to conventional insecticides, for control of the key pest, mint root borer (MRB), Fumibotys fumalis, on peppermint grown in California. The immature stages of MRB feed on rhizomes resulting in severe stunting of plants, plant death, and increased susceptibility to winter kill and soil-borne pathogens.
Mating disruption technology controls pest populations by reducing the number of successful matings. Dispensers containing synthetic female sex pheromone are placed in a crop and pheromone is released over the duration of the season. Mating is disrupted due to the presence of the synthetic pheromone interfering with the male’s ability to effectively locate calling females (Fig. 1).
Lorsban and Mocap, both organophosphates, are used against MRB. These insecticides, however, must be applied postharvest and thus are limited in their effectiveness to control within-season rhizome damage. Recently, several reduced risk insecticides were registered in California for use against MRB and are becoming more commonly used in lieu of organophosphates. Sex pheromone mating disruption plays an important role in controlling lepidopteran pests in several different agricultural systems, such as almonds, apples, peaches, and walnuts. The technology may be effective against MRB in peppermint and provide a non-insecticide control alternative.
Due to their low toxicity, lepidopteran pheromones pose a low risk to human health and non-target species. The objective of this project is to determine if sex pheromone mating disruption is a plausible tactic against MRB.

18
A. Male moth locates calling female by
flying upwind in the pheromone plume
toward the source.
B. Male moth locates a pheromone dispenser
rather than the calling female. In this example, the
calling female and the pheromone dispensers
compete for the male moth.
19
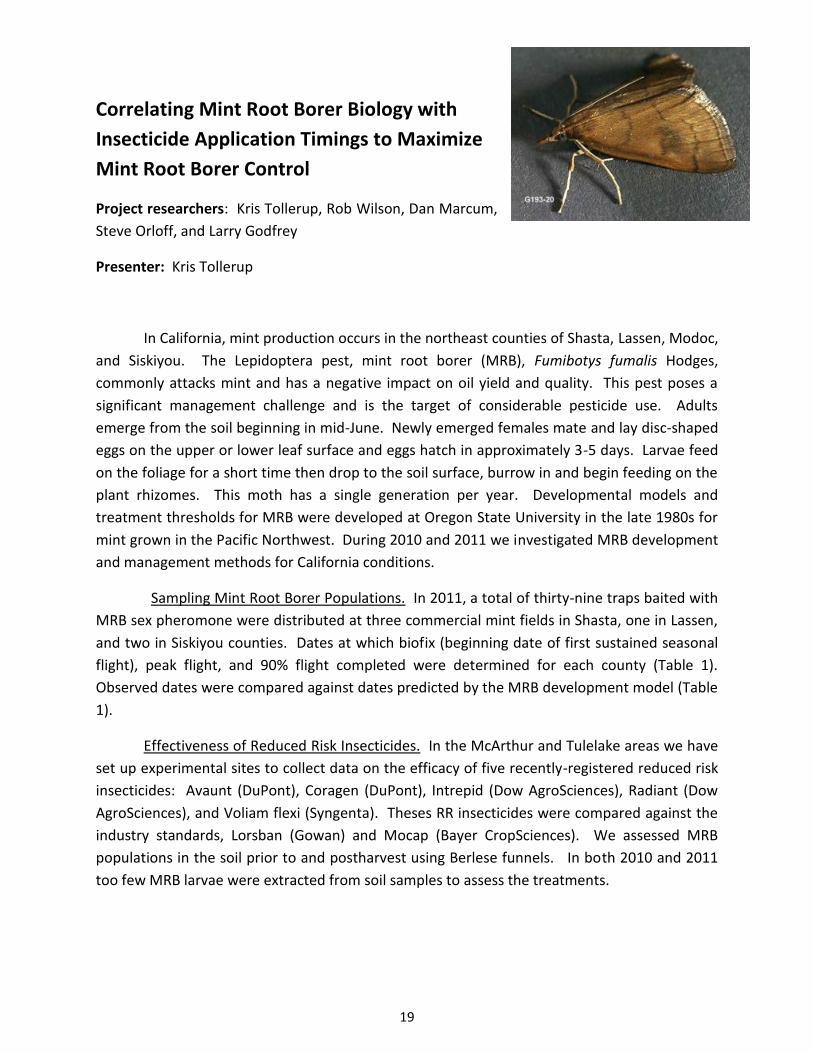
Correlating Mint Root Borer Biology with
Insecticide Application Timings to Maximize
Mint Root Borer Control
Project researchers: Kris Tollerup, Rob Wilson, Dan Marcum,
Steve Orloff, and Larry Godfrey
Presenter: Kris Tollerup
In California, mint production occurs in the northeast counties of Shasta, Lassen, Modoc,
and Siskiyou. The Lepidoptera pest, mint root borer (MRB), Fumibotys fumalis Hodges,
commonly attacks mint and has a negative impact on oil yield and quality. This pest poses a
significant management challenge and is the target of considerable pesticide use. Adults
emerge from the soil beginning in mid-June. Newly emerged females mate and lay disc-shaped
eggs on the upper or lower leaf surface and eggs hatch in approximately 3-5 days. Larvae feed
on the foliage for a short time then drop to the soil surface, burrow in and begin feeding on the
plant rhizomes. This moth has a single generation per year. Developmental models and
treatment thresholds for MRB were developed at Oregon State University in the late 1980s for
mint grown in the Pacific Northwest. During 2010 and 2011 we investigated MRB development
and management methods for California conditions.
Sampling Mint Root Borer Populations. In 2011, a total of thirty-nine traps baited with
MRB sex pheromone were distributed at three commercial mint fields in Shasta, one in Lassen,
and two in Siskiyou counties. Dates at which biofix (beginning date of first sustained seasonal
flight), peak flight, and 90% flight completed were determined for each county (Table 1).
Observed dates were compared against dates predicted by the MRB development model (Table
1).
Effectiveness of Reduced Risk Insecticides. In the McArthur and Tulelake areas we have
set up experimental sites to collect data on the efficacy of five recently-registered reduced risk
insecticides: Avaunt (DuPont), Coragen (DuPont), Intrepid (Dow AgroSciences), Radiant (Dow
AgroSciences), and Voliam flexi (Syngenta). Theses RR insecticides were compared against the
industry standards, Lorsban (Gowan) and Mocap (Bayer CropSciences). We assessed MRB
populations in the soil prior to and postharvest using Berlese funnels. In both 2010 and 2011
too few MRB larvae were extracted from soil samples to assess the treatments.
http://uspest.org/mint/twospotmanagement.htm
uspest.org/mint/mrbid.htm

20
Flight/year Shasta Co Lassen Co Siskiyou Co
observed predicted observed predicted observed predicted
Biofix
2010 17-Jun 24-Jun 17-Jun 4-Jul 24-Jun 4-Jul
2011 28-Jun 22-Jun 28-Jun 3-Jul 7-Jul 3-Jul
Peak
2010 20-Jul 19-Jul 14-Jul 31-Jul 20-Jul 31-Jul
2011 14-Jul 24-Jul 26-Jul 8-Aug 14-Jul 8-Aug
90%
2010 29-Jul 13-Aug 5-Aug 4-Sep 5-Aug 4-Sep
2011 2-Aug 19-Aug 8-Aug 8-Sep 10-Aug 8-Sep
Table 1. Observed and predicted dates of mint root borer flight at three critical periods

21
Control of White Rot of Onion Mike Davis and Allison Ferry, UC Davis Plant Pathology
INTRODUCTION White rot, caused by the soil inhabiting fungus Sclerotium cepivorum, is the most
devastating (and arguably most important) disease of onion and garlic worldwide. There are
several factors in what makes the disease so severe. The first is that a very small amount of the
fungus present in the soil can cause significant disease losses. The disease overwinters by
small, hardened, black spores called sclerotia. There only needs to be 2-3 sclerotia per kilogram
of soil to cause a significant number of plants to be diseased. It is very difficult to reduce the
number of the sclerotia in the soil because they can remain viable for more than 30 years in the
soil, even when no onion or garlic has been planted.
The best way to reduce numbers of sclerotia in the soil is by the application of a
germination stimulant. One commercially made stimulant, called DADS (diallyl disulfide)
mimics natural onion and garlic compounds. When it is sprayed onto a fallow (or non white rot
host plant) and incorporated, it induces sclerotia to germinate. Once they start to grow, they
cannot find a suitable host, so they die. Sclerotia germination stimulants can reduce numbers
of sclerotia in the soil up to 98%, which would be more than adequate to control most diseases;
however, a very small number of sclerotia can cause significant disease. In most situations,
DADS applications must be combined with a fungicide application for adequate disease control.
Currently Labeled Fungicides
Orius (Folicur) tebuconazole: Group 3, DMI
Cannonball (fludioxonil): Group 12, MAPHK osmotic signal transduction
Endura (boscalid): Group 7, SDHI, complex II
New Fungicides (not currently labeled)
Luna Privilege (fluopyram): Group 7, SDHI, complex II
Fontelis (penthiopyrad): Group 7, SDHI, complex II
Aproach (picoxystrobin): Group 11, Respiration
Omega (fluazinam): Group 29, uncoupler of oxidative phosphorylation

22
2011 FUNGICIDE TRIAL RESULTS
Fungicide
Rate of Application 1, at Planting
Rate of Application 2, at first leaf fall
Percentage of Diseased Bulbs
Avg. Diseased Yield/acre (tons)
Avg. Clean Yield/acre (tons)
Total Yield (tons)
Significance Grouping*
Folicur 20.5 fl oz/A 6 fl oz/A 39.90% 7.62 11.48 19.1 A
Folicur 20.5 fl oz/A 44.40% 6.87 8.6 15.46 AB
Fontelis 20 fl oz/A 47.60% 9.67 10.64 20.31 ABC
Fontelis 20 fl oz/A 20 fl oz/A 45.00% 7.95 9.73 17.68 ABC
Luna Privilege
6.84 fl oz/A 40.70% 6.36 9.28 15.64 ABC
Fontelis 16 fl oz/A 52.30% 9.83 8.95 18.78 ABC
Fontelis 24 fl oz/A 45.50% 7.35 8.81 16.16 ABCD
Cannonball 7 oz/A 7 oz/A 49.10% 8.17 8.47 16.63 ABCD
Omega 1.5 pt/A 1.5 pt/A 50.10% 8.45 8.4 16.85 ABCD
Cannonball 10 oz/A 10 oz/A 52.30% 9.17 8.38 17.55 ABCD
Aproach 12 fl oz/A 49.10% 7.95 8.24 16.19 ABCD
Omega 1.5 pt/A 52.10% 8.84 8.13 16.97 ABCD
Cannonball 10 oz/A 49.90% 7.73 7.77 15.5 BCD
Cannonball 7 oz/A 52.40% 7.95 7.24 15.19 DC
Aproach 12 fl oz/A 12 fl oz/A 51.40% 7.55 7.15 14.7 DC
Untreated 60.30% 7.93 5.21 13.14 D
*Treatments with the same letter are not significantly different from one another.

23
Effect of DADS on Numbers of Sclerotia in the Soil
120
72
24
112 118
0
20
40
60
80
100
120
140
At Application, 2010 Mid-Year At Planting, 2011Nu
mb
er
of
Scle
roti
a/5
00
g s
oil
Sampling Date
DADS
no DADS

24
DADS/No DADS Combined with Fungicides
DADS/no DADS Fungicide
Rate of Fungicide
Disease Percentage
Average healthy
yield/acre (tons)
Average diseased
yield/acre (tons)
DADS Fontelis 24 fl oz/A 19% 16.74 3.94
DADS Cannonball 7 oz/A 26% 14.64 5.2
DADS Folicur 20.5 fl oz/A 32% 14.1 6.51
DADS Luna Privilege
6.84 fl oz/A 36% 12.53 7.07
DADS Aproach 6 fl oz/A 37% 12 7.19
DADS Untreated 51% 8.47 8.86
No DADS Luna Privilege
6.84 fl oz/A 59% 6.42 9.13
No DADS Fontelis 24 fl oz/A 61% 6.07 9.64
No DADS Folicur 20.5 fl oz/A 69% 5.12 11.42
No DADS Aproach 6 fl oz/A 72% 3.84 9.64
No DADS Untreated 71% 3.83 9.34
No DADS Cannonball 7 oz/A 79% 2.51 9.41
SUMMARY Applying higher than standard rates and/or multiple applications of fungicides did not
significantly increase healthy yields or reduce disease percentages
The most effective treatment for white rot is Folicur (20.5 fl oz/acre at planting)
Two new fungicides (not yet registered,) Luna Privilege and Fontelis, significantly reduce white
rot incidence.
Fungicides Omega and Aproach offer a control level similar to Cannonball, which is registered.
Using DADS combined with a fungicide provides the best available white rot control.

25
2012/2013 TRIALS
*We currently have two trials going at Tulelake, one is a combination of DADS sclerotia stimulant and fungicides.
Fungicide plus Serenade Soil White Rot Experiment
Year 2012, replicated 2013
Treatment Trade Name Active Ingredient Rate (units) Application Timing
1 Control N/A N/A N/A
2 Serenade Soil Bacillus subtilis, strain QST 713
12 fl oz/1000 row feet
At planting, and at 1 month intervals until harvest
3 Folicur tebuconazole
Application 1: 20.5 fl oz/A Application 2: 6 fl oz/A
Application 1: at planting Application 2: at the 3 true leaf stage
4 Cannonball fludioxonil
Application 1: 10 oz/A Application 2: 10 oz/A
Application 1: at planting Application 2: at the 3 true leaf stage
5 A) Serenade Soil B) Folicur
A) Bacillus subtilis, strain QST 713; B) tebuconazole
A) 12 fl oz/1000 row feet B)20.5 fl oz/A
A) Serenade Soil: Once, at planting, and at 1 month intervals until harvest B) Folicur: Once, at planting
6 A) Serenade Soil B) Cannonball
A) Bacillus subtilis, strain QST 713; B) fludioxonil
A) 12 fl oz/1000 row feet B)10 oz/A
A) Serenade Soil: Once, at planting, and at 1 month intervals until harvest B) Cannonball: Once, at planting
7 Endura boscalid 6.8 oz/A Once, at planting
8 Aproach picoxystrobin 12 fl oz/A Once, at planting
9 Fontelis penthiopyrad 20 fl oz/A Once, at planting
10 Folicur, standard tebuconazole 20.5 fl oz/A Once, at planting
11 Folicur, half rate tebuconazole 10.5 fl oz/A Once, at planting

26
Sclerotia Germination Stimulants plus Fungicides and Serenade Year 2012 Treatment Trade Name Active Ingredient Rate (units) Application Timing
1 Control: No DADS application N/A N/A N/A
2 DADS diallyl disulfide 0.5 ml/m2 Once, in fallow field in Spring
3 Sensient Garlic Powder garlic powder 90 kg/acre Once, in fallow field in Spring
Year 2013 Treatment Trade Name Active Ingredient Rate (units) Application Timing
1 Control N/A N/A N/A
2 Serenade Soil Bacillus subtilis, strain QST 713
12 fl oz/1000 row feet
At planting, and at 1 month intervals until harvest
3 A) Serenade Soil B) Folicur
A) Bacillus subtilis, strain QST 713; B) tebuconazole
A) 12 fl oz/1000 row feet B)20.5 fl oz/A
A) Serenade Soil: Once, at planting, and at 1 month intervals until harvest B) Folicur: Once, at planting
4 A) Serenade Soil B) Cannonball
A) Bacillus subtilis, strain QST 713; B) fludioxonil
A) 12 fl oz/1000 row feet B)10 oz/A
A) Serenade Soil: Once, at planting, and at 1 month intervals until harvest B) Cannonball: Once, at planting

27
Management Practices for Improved Thrips Control in Klamath Basin Onions
2011 Progress Report
Steve Orloff1, Rob Wilson2, and Larry Godfrey3 1UC Cooperative Extension, Siskiyou County
2 Director Intermountain Research and Extension Center, Tulelake 3Department of Entomology, UC Davis
Introduction
Thrips, both onion thrips (Thrips tabaci) and western flower thrips (Frankliniella occidentalis), are serious insect pests in California onion fields. Thrips have a broad host range and many of the crops in the Klamath Basin, including alfalfa and small grain, are hosts for thrips. The broad host range makes control problematic, as thrips migrate from crop or non-crop areas to onion fields when the other crops/weeds are harvested or senesce. Thrips are also difficult to manage because they are somewhat protected by where they feed on the plant (under leaf folds and at the base of the onion plant) and they readily develop resistance to insecticides. Research has been conducted from 2010 through this year to evaluate thrips control practices in the Klamath Basin. The focus of the thrips control research in 2011 and 2012 is to evaluate several different insecticides where each insecticide was applied twice and evaluations continued after the second application. Previous research suggested that back-to-back applications were necessary with some insecticides to get acceptable control. Results from 2010 suggested that thrips populations over the season could actually be increased with the use of some insecticide sequences. Additional research was conducted to verify this trend and to determine which thrips management strategy (insecticide sequence and number of applications) was most effective over the season to control thrips.
Materials and Methods The onions were direct seeded on 36-inch beds with four seed lines per bed. Onions were irrigated with solid set sprinklers. All plots were replicated four times. Two trials were conducted per year at the University of California Intermountain Research and Extension Center (IREC) for both the 2011 and 2012 growing seasons. One trial was an insecticide comparison trial and the second trial was to evaluate different thrips management strategies over the season.
Figure 1. Immature thrips feeding on onion foliage.

28
Thrips Species Identification Thrips species composition, relative proportion of western flower thrips vs. onion thrips was determined by examining adult thrips from an untreated area. Fifty onion plants were harvested from a large untreated area at each evaluation date through the season. Samples were sent to UC Davis and thrips species was determined. The relative proportion of western flower thrips and onion thrips over the production season is presented in Figure 2 for 2010 and 2011. We found more western flower thrips early in the growing season compared with late season. This trend was more evident in 2010 than in 2011. Thrips species is important to know because insecticides differ in their ability to control these two thrips species and the disease vector ability of the species differs.
0%
20%
40%
60%
80%
100%
OT
WFT
2010
2011
Figure 2. Relative percentage of onion thrips versus western flower thrips over the growing season in Tulelake, CA in 2010 and 2011. (Numbers in parentheses indicate the total number of adult thrips in sample used to determine species.)

29
Table 1. Insecticides and their rates evaluated in insecticide comparison study.
Insecticide Comparison Study Eight different insecticide treatments were evaluated in 2011 (Table 1) and 10 in 2012. The 2012 treatments include a new insecticide Torac (tolfenpyrad). Insecticides were applied with a backpack sprayer at a spray volume of 20 gallons per acre. Two applications of each treatment were made approximately 9 days apart. Super Spread 7000, a nonionic spreader buffer/acidifier, was added to all treatments at 0.25%. The thrips population was evaluated in the field by randomly selecting 10 onions per plot and counting the number of thrips per plant weekly after
the initial treatment. A second application of the same insecticide was made 9 days after the first application.
At the first evaluation date (1 week after treatment), there was no statistical difference in thrips population (Table 2). The untreated control numerically had the highest thrips population but even the most effective treatments only reduced the number of thrips per plant to about half the number of thrips on the untreated plants. However, the overall thrips population was still low at this time, averaging only slightly over 7 thrips per plant in the untreated control. Thrips population was evaluated again 5, 11 and 19 days after the second application. Overall, the relative ranking of effectiveness of the insecticides remained fairly consistent for the remaining three evaluations with a few exceptions. Warrior initially knocked down the thrips population but the population resurged and by the evaluation 11 days after the second application the population level was already higher than the untreated control plots and was more than double the control plots by 19 days after the second application (Figure 3). This was consistent with what was observed in 2010. The cause for this dramatic resurgence in thrips population is unknown but possible explanations are that maybe the insecticide is killing some beneficial insects that may play a role in moderating thrips population or hormoligosis (reproductive stimulation by sublethal doses of insecticide). Cyazypyr was effective at the first two evaluation dates but control diminished at the 3rd and 4th evaluation dates. The addition of Aza-Direct to Radiant numerically increased control slightly over Radiant applied alone, consistent with the results in 2010. Movento was very effective, which is different from the results in 2010. A possible explanation for this difference is that two applications are needed, and there was only one application of Movento applied in the 2010 trial. This behavior has been observed in other trials as well where the initial control with Movento was mediocre but control was excellent after the second application. The tank mix combination of Movento and Lannate was particularly effective; the thrips population was only 5 thrips per plant nearly 3 weeks after the second application.
Insecticide Rate per Acre
Untreated --
Warrior II 1.92 oz
Lannate LV 3 pt
Radiant 8 oz
Radiant + Aza Direct 8 oz + 12 oz
Movento 5 oz
Movento + Lannate 5 oz + 3 pt
Agri-Mek 16 fl oz
HGW86 (Cyazypyr) 20.5 fl oz

30
Table 2. Effect of insecticide treatment on thrips population at four evaluation dates. Insecticides were
applied twice (7/19 and 7/28).
Treatment 26-Jul 2-Aug 8-Aug 16-Aug
Lannate/Movento 3.8 1.0 1.7 5.3
Movento 6.3 4.0 4.9 9.4
Radiant + Aza-Direct 3.5 3.6 9.7 12.0
Agri-Mek 5.8 7.1 11.7 12.6
Radiant 5.7 7.0 14.5 21.4
Lannate 3.7 8.5 17.5 20.9
HGW86 (Cyazypyr) 4.7 4.8 19.9 25.6
Untreated 7.2 13.0 33.3 23.4
Warrior 4.5 13.9 44.8 64.6
LSD 0.05 NS 1.5 3.0 3.5
Comparison of Season-Long Thrips Control Strategies Several thrips control strategies were imposed over the season in 2011 and 2012. All treatments were applied with a backpack sprayer. Plot size was 50 feet by 21 feet (7 beds). One treatment sequence was Warrior/Lannate/Warrior. This treatment sequence in 2010 showed an initial knock down but eventually thrips population rose to levels above the untreated check. This treatment was repeated to determine if the results last year were an anomaly or if this behavior was consistent from year to year. The next treatment, Agri-Mek/Lannate/Radiant, had the same number of total applications (three) and application dates as the first treatment to determine if this insecticide sequence was superior. The next two treatments involved an insecticide application sequence where the same insecticide was applied back-to-back. This approach has been proposed by Brian Nault, Department of Entomology Cornell University to minimize the number of thrips generations exposed to the same insecticide active ingredient. One insecticide treatment was Lannate/Lannate/Radiant/Radiant for a total of 4 applications. Another sequence was Agri-Mek/Agri-Mek/Lannate/Lannate/Radiant/Radiant for a total of 6 insecticide applications over the season. An additional treatment consisted of six applications of Radiant over the season. This is obviously not a recommended treatment, however, the intent was to achieve the best thrips control possible to determine the effect of thrips on onion yield and Radiant tended to be one of the most effective treatments in the 2010 study. Thrips population was monitored weekly over the entire season by visually counting the number of thrips in the field on ten randomly selected plants per plot. Thrips control was also evaluated by visually assessing the degree of thrips injury on the onion leaves 2 weeks after application.

31
Table 3. Effect of season-long thrips control program on weekly thrips population monitored weekly over the season. Klamath Basin, 2011.
Overall, the treatments used in 2011 maintained thrips population at a lower level than in 2010. The thrips population developed later in 2011 compared with 2010, most likely due to a cool wet spring. Similar to the previous year, an application sequence of Warrior/Lannate/Warrior was not effective, especially late in the season when the thrips population exceeded the untreated control plots (Table 3). This is also in agreement with the insecticide comparison trial results described above. An alternative treatment, also with three applications (Agri-Mek/Lannate/Radiant), was far more effective. The population remained below 20 thrips per plant, except for the last evaluation date when the thrips population had climbed to an average of 71 thrips per plant, still nearly 100 less thrips per plant than the Warrior/Lannate/Warrior treatment. The other three treatments were all highly effective, and the thrips population over the season averaged 13.3 thrips per plant for the Lannate/Lannate/Radiant/Radiant treatment, 10.5 thrips per plant for the Agri-Mek/Agri-Mek/Lannate/Lannate/Radiant/Radiant, and 7.9 thrips per plant for the six applications of Radiant (Table 3.). The onion injury ratings closely reflected the thrips population numbers; more onion leaf scarring occurred with treatments that resulted in high thrips populations over the season. Onion yield was also measured. There was no difference in yield between any of the insecticide treatments (Table 4). The stand was somewhat variable, making it difficult to document a treatment effect. Also, because of the cool wet spring and relatively cool summer, thrips pressure was relatively light this year. In addition, we did not see the level of thrips injury that is observed in other parts of the country, which may be due to the environmental conditions and sprinkler irrigation, which is known to suppress thrips population somewhat.
Season-Long Strategy 21-Jul
28-Jul
4-Aug
11-Aug
18-Aug
24-Aug
30-Aug
7-Sep
16-Sep Ave
Control 2.9 2.5 19.0 27.7 32.4 41.1 60.9 75.9 123.6 42.9
War/Lan/War 2.8 2.8 4.2 13.3 9.7 28.9 50.2 72.2 167.4 39.0
Agri-Mek/Lan/Rad 4.6 3.8 6.5 15.6 9.7 11.2 12.3 13.6 71.2 16.5
Lan/Lan/Rad/Rad 3.6 1.8 13.4 6.4 17.0 9.4 15.1 27.4 25.8 13.3
Agri-Mek/Agri-Mek/ Lan/Lan/Rad/Rad 3.4 1.2 7.4 5.9 19.4 15.6 12.3 12.1 17.3 10.5
Rad/Rad/Rad/Rad/Rad/Rad 4.4 1.1 3.9 2.1 15.3 4.6 8.9 13.3 18.1 7.9
LSD 0.05
0.6 1.7 2.6 3.2 4.7 6.9 10.8 16.9 4.1

32
Table 4. The effect of six insecticide strategies/sequences used over the season on onion yield.
1st Applic.
2nd Applic.
3rd Applic.
4th Applic.
5th Applic.
6th Applic.
Yield Tons/A
Untreated
17.9
Warrior Lannate Warrior
18.5
Agri-Mek Lannate Radiant
18.3
Lannate Lannate Radiant Radiant
16.8
Agri-Mek Agri-Mek Lannate Lannate Radiant Radiant 18.5
Radiant Radiant Radiant Radiant Radiant Radiant 19.0
NS
Conclusions
Both onion thrips and western flower thrips were found in samples collected over the season from untreated areas. There tended to be a higher proportion of western flower thrips early in the season with a higher percentage of onion thrips later in the season. This trend was more pronounced in 2010 than 2011. In the insecticide comparison study, acceptable thrips control was achieved with several insecticides applied twice in sequential applications spaced 9 days apart. Movento and Movento plus Lannate provided very effective control. Radiant alone or in combination with Aza-Direct, Lannate and Agri-Mek were also effective. Insecticide strategies that included Agri-Mek, Lannate, and Radiant in various combinations were also effective in the season-long comparisons. Thrips populations declined but eventually escalated after an application of Warrior. This was true in both the insecticide comparison trial and the season-long trial. It appears there may be merit to applying the same insecticide for back-to-back applications and then switching to another insecticide product but more research is needed. More research is also needed to determine the effect of thrips on onion yield in the Klamath Basin. There was no statistical difference in yield among treatments, which may be due to the variability that existed in the onion stand in the field.

33
The insecticide treatments that will be evaluated during the 2012 production season are presented in Table 5.
Table 5. Season-long thrips control treatments under evaluation in 2012.
1st Appl. 2nd Appl. 3rd Appl. 4th Appl. 5th Appl. 6th
Appl.
1 Control
2 Warrior Warrior Warrior
3 Lannate Radiant Radiant
4 Movento Movento/Lannate
5 Movento Movento Radiant Radiant
6 Lannate Lannate Radiant Radiant
7 Movento Movento Lannate Lannate Radiant Radiant

34
Effect of Nitrogen Fertilization Practices on Spring Wheat Protein Content
Steve Orloff
1 and Steve Wright
2
1UC Cooperative Extension, Siskiyou County 2 UC Cooperative Extension, Tulare County
Introduction and Objectives Protein content is a significant issue for wheat producers throughout California—nearly as important as yield. The price that a producer receives for hard spring wheat is determined by the grain protein content with a discount for wheat with less than 13% grain protein in California and usually 14% for grain marketed in the Pacific Northwest. This has significant economic consequences for wheat producers. The primary production factors that affect protein content are cultivar selection and nitrogen fertility management. Unfortunately, yield and protein content are often inversely related and is difficult to achieve both. With the high cost of fertilizers and their application, growers need to maximize N use-efficiency while at the same time minimize the number of fertilizer applications. The objectives of this research were to:
1. Compare the protein content of popular hard red spring wheats
2. Assess the effect of different nitrogen application rates and timings on the yield and
protein content of four spring wheat varieties
Materials and Methods: Trials were conducted at three locations in California, representing distinct climatic conditions. One trial was conducted in the Central Valley at the West Side Research and Extension Center (WSREC) in Fresno County. Two trials were conducted in the Intermountain region, one with a grower cooperator at a slightly warmer lower elevation area (Scott Valley) and a second in the Klamath Basin at the Intermountain Research and Extension Center (IREC) in Tulelake. This report will focus on Intermountain sites. Preplant soil nitrate nitrogen levels were 7 and 6 ppm for the Scott Valley and IREC sites, respectively.
A factorial experimental design was used to evaluate the effect of wheat variety and nitrogen treatment on grain yield, protein and bushel weight. In the Intermountain studies four varieties were evaluated—Yecora Rojo, Hank, Fusion and Malbec. Seven nitrogen treatments/strategies were evaluated (Table 1). Urea was the nitrogen fertilizer source used for all applications. The fertilizer was broadcast using a hand spreader and irrigated in within one or two days after application.

35
Table 1. Nitrogen treatments evaluated in Scott Valley and IREC study (Siskiyou County). 1. Control – (unfertilized) 2. 120 Pre-plant (Total N 120 lbs) 3. 120 Pre-plant + 30 lbs Flowering (Total N 150 lbs) 4. 120 Pre-plant + 50 lbs Tillering (Total N 170 lbs) 5. 120 Pre-plant + 50 lbs Tillering + 30 lbs Boot (Total N 200 lbs) 6. 120 Pre-plant + 50 lbs Tillering + 30 lbs Flowering (Total N 200 lbs) 7. 120 Pre-plant + 50 lbs Tillering + 30 lbs Boot + 30 lbs Flowering (Total N 230 lbs)
Results Grain yields were higher at the IREC site (Tulelake) than at the Scott Valley site. This is commonly observed due to more favorable environmental conditions (cooler summer temperatures and better soil) in Tulelake compared with Scott Valley. In addition, 2011 was a fairly wet spring and it was difficult to find a planting window. The soil was prepared in spring and the wheat planted into moisture. Some of the seeds emerged with soil moisture and others did not emerge until there was subsequent rain. This resulted in staggered emergence which lowered the yield potential of the Scott Valley site.
Nitrogen fertilization had a significant impact on grain yield at both sites. In Scott Valley, maximum yield increased from 0.6 to 1.1 tons per acre over the untreated check depending on the variety and fertilizer treatment (Table 2). The yield increase over the unfertilized plots was far greater at the IREC site where yields were nearly double (almost 2 tons higher) for many of the varieties (Table 3). Additional applications after the preplant application also increased yield in most cases. At the Scott Valley site the 230 pounds N per acre application did not increase yield over the other fertilization strategies that included a topdress application. However, at IREC maximum yield for all varieties occurred at the 230 pounds per acre application rate where N was applied preplant and top dressed at tillering, boot and flowering growth stages. This is probably due to the higher yield potential at this site and this site had a slightly lower preplant soil nitrate nitrogen level (6 ppm at IREC compared with 8 ppm in Scott Valley).
Averaged over all fertilizer treatments, Yecora Rojo was the lowest yielding variety in Scott Valley and Fuzion and Malbek were the highest (Table 4). In contrast, Hank was the highest yielding variety averaged across fertilizer treatments in Tulelake.
Wheat cultivar and nitrogen fertilizer regime had a significant effect on wheat protein content. Hank had the lowest protein content of the four cultivars at both sites (Table 4). Protein content was much higher at the Scott Valley site than at IREC most likely due to the much higher yield at IREC and the slightly lower initial soil nitrate level. Many of the fertilizer treatments resulted in a protein content above 14 percent (the benchmark value in Pacific Northwest markets) in Scott Valley. In contrast, protein contents below 12 percent were common at IREC for the plots that received the lower N rates and none of the treatments ever reached 14 percent average for the four replications. A large increase in grain protein over the

36
Table 2. Effect of nitrogen strategy on yield, protein and bushel weight of four hard red spring wheat varieties grown in the Scott Valley (Siskiyou County).
Treatments Total N lbs/A
Yield tons/A
Protein (%)
Test Wt. (bu/A)
Yecora Rojo
Untreated 0 1.80 12.5 63.2
Pre-plant 120 2.47 13.2 62.0
Pre-plant + Flowering 150 2.59 14.9 62.1
Pre-plant + Tillering 170 2.71 15.6 62.1
Pre-plant + Tillering + Boot 200 2.84 14.7 62.2
Pre-plant + Tillering + Flowering 200 2.93 15.3 62.2
Pre-plant + Tillering + Boot + Flowering 230 2.90 15.4 62.0
Hank
Untreated 0 2.27 12.0 62.7
Pre-plant 120 2.82 12.7 61.2
Pre-plant + Flowering 150 2.96 13.2 61.5
Pre-plant + Tillering 170 2.91 13.2 62.2
Pre-plant + Tillering + Boot 200 2.71 13.5 60.7
Pre-plant + Tillering + Flowering 200 3.16 13.8 61.0
Pre-plant + Tillering + Boot + Flowering 230 2.88 13.9 61.2
Fuzion
Untreated 0 2.58 12.3 63.7
Pre-plant 120 2.79 13.4 63.2
Pre-plant + Flowering 150 3.09 14.0 62.8
Pre-plant + Tillering 170 3.12 14.9 62.5
Pre-plant + Tillering + Boot 200 3.05 14.6 62.6
Pre-plant + Tillering + Flowering 200 3.09 15.0 62.5
Pre-plant + Tillering + Boot + Flowering 230 3.16 14.1 62.8
Malbek
Untreated 0 2.66 12.7 63.3
Pre-plant 120 3.26 13.1 63.1
Pre-plant + Flowering 150 3.19 13.2 62.9
Pre-plant + Tillering 170 2.72 14.1 62.4
Pre-plant + Tillering + Boot 200 3.54 13.7 62.6
Pre-plant + Tillering + Flowering 200 3.06 14.0 62.5
Pre-plant + Tillering + Boot + Flowering 230 3.22 14.3 62.4
LSD 0.05 0.38 1.1 1.0

37
Table 3. Effect of nitrogen strategy on yield, protein and bushel weight of four hard red spring wheat varieties grown at the Intermountain Research and Extension Center (Siskiyou County).
Treatments Total N (lbs/A)
Yield (tons/A)
Protein (%)
Test Wt. (lbs/bu)
Yecora Rojo
Untreated 0 2.78 9.2 63.6
Pre-plant 120 3.99 10.0 63.2
Pre-plant + Flowering 150 4.35 10.9 63.1
Pre-plant + Tillering 170 4.19 11.4 62.8
Pre-plant + Tillering + Boot 200 4.32 12.8 62.0
Pre-plant + Tillering + Flowering 200 4.25 12.1 62.8
Pre-plant + Tillering + Boot + Flowering 230 4.47 13.1 62.8
Hank
Untreated 0 2.50 8.5 62.5
Pre-plant 120 4.34 10.4 62.6
Pre-plant + Flowering 150 4.45 11.0 62.1
Pre-plant + Tillering 170 4.34 11.1 62.6
Pre-plant + Tillering + Boot 200 4.67 11.6 62.5
Pre-plant + Tillering + Flowering 200 4.62 12.0 62.3
Pre-plant + Tillering + Boot + Flowering 230 4.81 12.9 62.3
Fuzion
Untreated 0 2.31 9.2 63.5
Pre-plant 120 3.96 10.6 63.1
Pre-plant + Flowering 150 4.20 11.3 63.0
Pre-plant + Tillering 170 4.25 12.4 63.3
Pre-plant + Tillering + Boot 200 4.36 12.7 62.9
Pre-plant + Tillering + Flowering 200 4.41 12.3 63.4
Pre-plant + Tillering + Boot + Flowering 230 4.47 13.5 63.1
Malbek
Untreated 0 2.61 9.3 63.3
Pre-plant 120 4.03 10.7 63.3
Pre-plant + Flowering 150 4.31 11.7 63.3
Pre-plant + Tillering 170 4.23 12.4 63.3
Pre-plant + Tillering + Boot 200 4.33 12.6 62.8
Pre-plant + Tillering + Flowering 200 4.34 12.6 63.0
Pre-plant + Tillering + Boot + Flowering 230 4.43 13.3 63.1
LSD 0.05 0.27 0.5 0.5

38
untreated check was observed at both sites. In Scott Valley, protein content increased up to 1.6 to 3.1 percentage points over the unfertilized control plot depending on the variety. At IREC, protein content increased nearly 4 percentage points or more comparing the highest rate to the unfertilized control plot. A preplant application alone, common grower practice, was never sufficient to reach acceptable protein levels to avoid a discount at either site. At IREC the highest fertilizer rate (230 pounds N per acre over four applications) always resulted in the numerically highest protein content. In Scott Valley, the numerically highest protein content was also achieved with this highest rate. However, differences in protein content between this rate and lower rates were small and acceptable protein levels were achieved with some of the lower rates. In Scott Valley, any treatments that had 170 pounds of N or more over the season had a protein content over 14, except for the cultivar Hank (Table 5).
Table 4. Effect of wheat cultivar on yield and protein content averaged across all seven nitrogen regimes. Scott Valley and IREC (Siskiyou County).
Yield (tons/A) Protein (%)
Variety Scott V. IREC Scott V. IREC
Yecora Rojo 2.61 4.05 14.50 11.38
Hank 2.82 4.25 13.17 11.09
Fuzion 2.98 3.99 14.04 11.72
Malbek 3.09 4.04 13.59 11.79
LSD 0.05 0.15 0.06 0.70 0.19
Table 5. Effect of nitrogen regime on yield and protein content averaged across all four wheat cultivars. Scott Valley and IREC (Siskiyou County).
Total N Yield (tons/A) Protein (%)
Treatments lbs/A Scott V. IREC Scott V. IREC
Untreated 0 2.33 2.55 12.4 9.1
Pre-plant 120 2.84 4.08 13.1 10.4
Pre-plant + Flowering 150 2.96 4.33 13.8 11.2
Pre-plant + Tillering 170 2.87 4.25 14.4 11.8
Pre-plant + Tillering + Boot 200 3.03 4.42 14.1 12.5
Pre-plant + Tillering + Flowering 200 3.06 4.40 14.5 12.2
Pre-plant + Tillering + Boot + Flowering 230 3.04 4.54 14.4 13.2
LSD 0.05 0.39 0.29 1.0 0.5

39
Discussion, Conclusions and Recommendations: These results clearly demonstrate the need for nitrogen fertilizer to achieve acceptable yield and protein content. The nitrogen rate needed for maximum yield and to achieve market protein requirements depends on the yield potential of the field. The wheat cultivar had a significant impact on protein level. These results confirmed prior field experience regarding these cultivars and their protein levels. Nitrogen fertilization also had a significant effect on protein at all sites. A preplant nitrogen application alone at the rate tested (120 pounds of N per acre) was insufficient to attain acceptable protein levels. A preplant nitrogen application alone has been a common fertilizer program for many growers, particularly in the intermountain area. These data demonstrate that additional topdress N applications are needed to obtain the required protein level to avoid dockage. Ideally, it would be desirable to be able to recommend a given variety and nitrogen fertilizer practice that would assure maximum yield at acceptable protein levels for all areas. However, it is difficult to precisely quantify the level of nitrogen fertilizer required and variety performance varies between years, and other agronomic characteristics are important in addition to protein content. Nitrogen fertilizer needs depend on initial residual soil nitrogen levels as well as yield potential. This research does provide some initial guidelines for different areas and yield levels but additional research is needed to confirm these results under different conditions. This research clearly demonstrates the need for diagnostic tools to be used during the production season to ascertain if more mid-season N is needed to maximize yield and achieve protein goals. After we have completed the 2012 season trials, we should be able to complete an economic evaluation of the nitrogen strategies using the different yield levels and protein contents at different price levels and protein penalties (and premiums) to determine the profit potential with different nitrogen management strategies.

40
2012 IREC Potato Experiments
Variety Trials
Russet Trial – 24 entries
Red/ Specialty Trial – 35 entries
Chip Trial – 21 entries
Cultural Management Trials
Comparison of Classic Russet and Russet Norkotah Response to Nitrogen
Fertilization
Influence of Vine Kill Timing and Late-Season Irrigation on Classic Russet
Susceptibility to Bruising
Disease Management Trials
Influence of Fungicides and Biological Controls on Potato Diseases and
Yukon Gold Yield and Quality
Influence of Metam Sodium (Vapam) and 1,3-dichloropropene (Telone II)
on Russet Burbank, Russet Norkotah, and Classic Russet Yield and Early
Dying Suppression
Potato Yield and Disease Response to Irrigation Frequency
Chemigation of Fungicides for Management of Black Scurf on Tubers
The Effect of Removing Above-ground Potato Residue on the Incidence of
Verticillium Wilt and Black Dot in Future Potato Crops

41
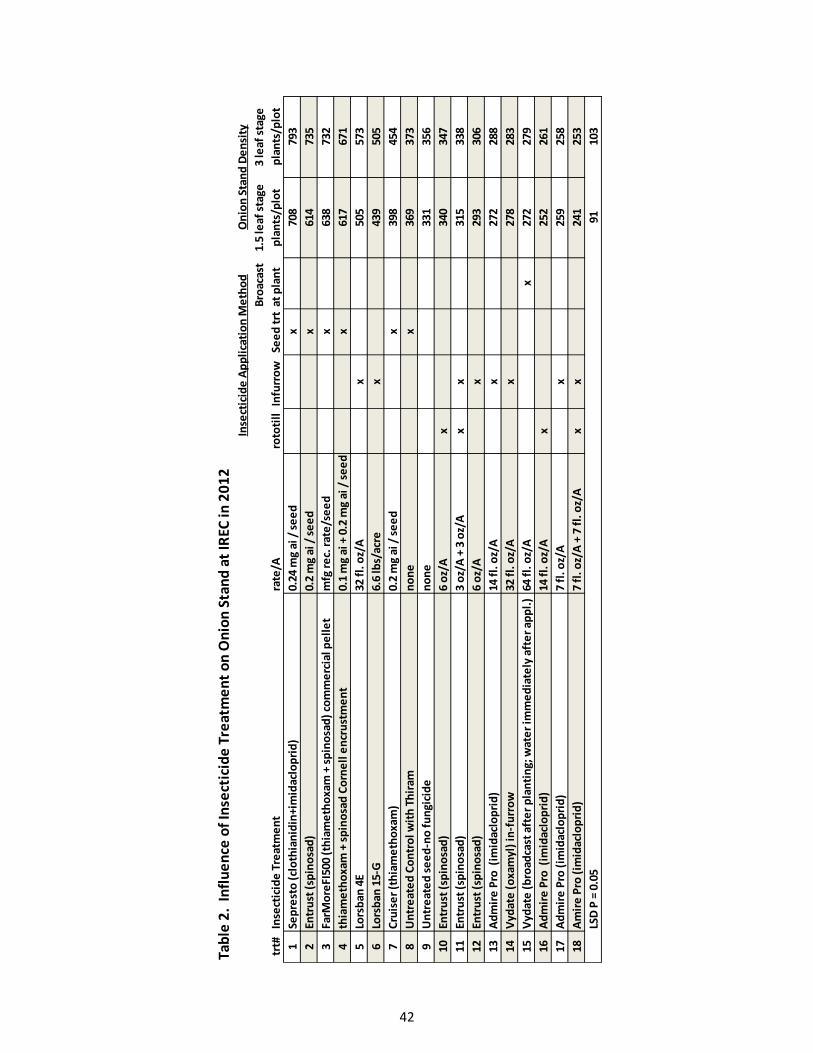
Maggot Control in Processing Onions
Rob Wilson, IREC Farm Advisor
Maggots (the larval stage of flies) including the onion maggot, Delia antiqua, and the seed corn maggot, Delia platura, are problem pests in Klamath Basin onion fields. Larvae attack seedlings and young onion plants feeding on the developing epicotyls and roots. A single maggot can kill up to 10 seedlings. Maggot feeding can result in greater than 50% onion stand loss in fields with a large amount of decaying crop residue. A maggot control study was conducted at the Intermountain Research and Extension Center with funding support from the California Garlic and Onion Research Board in 2011 and 2012. Study objectives were to compare insecticides and insecticide application methods (in-furrow at planting versus seed treatment) to the current in-furrow standard (Lorsban). The preceding crop at the study site was alfalfa which was rototilled shortly before planting the onions. The abundant decaying organic matter after alfalfa stand removal created optimal conditions to attract maggot flies. During May and June, sticky traps placed throughout the trial area captured high numbers of both seed corn maggot and onion maggot flies. Insecticide seed treatments with clothianidin or spinosad provided the best protection from maggot related onion stand loss in 2011 and 2012.
Table 1. Influence on Insecticide Treatments on Onion Stand, Vigor, and Yield at IREC in 2011.
Onion Yield
1-leaf 1.5-leaf 1.5 leaf 3-leaf 6-leaf 9/29/2011
trt# Insecticide Treatment1 tons/acre
1 Untreated Control-raw seed 2.6 2.5 348 177 177 7.09
2 Thiram-treated Control 2.7 2.7 309 193 190 8.19
3 Sepresto (clothianidin + imidacloprid) seed trt 4.9 4.8 719 622 625 13.72
4 Entrust (spinosad) seed trt 5.0 5.0 812 673 676 14.34
5 Cruiser (thiamethoxam) seed trt 4.0 3.8 430 390 384 11.68
6 FarMoreFI500 (thiamethoxam + spinosad) seed trt 4.6 4.6 572 586 550 13.22
7 Coragen (rynaxypyr) in-furrow 2.6 2.5 265 192 179 7.24
8 HGY86 (cyazypyr) in-furrow 3.0 2.4 306 204 211 8.24
9 Lorsban 15-G (chlorpyrifos) in-furrow 3.8 4.3 591 471 464 13.18
10 Lorsban 4E (chlorpyrifos) in-furrow 4.8 4.8 646 565 561 13.58
11 Entrust (spinosad) 2 oz/A in-furrow 2.8 2.5 257 151 160 6.79
12 Entrust (spinosad) 6 oz/A in-furrow 3.3 3.1 356 215 211 8.43
13 Admire Pro (imidacloprid) 7 fl oz/A in-furrow 2.5 2.1 231 136 133 6.11
14 Admire Pro (imidacloprid) 14 fl oz/A in-furrow 2.1 2.1 187 99 104 4.89
15 Admire Pro (imidacloprid) + Entrust (spinosad) in-furrow 2.4 2.1 230 131 136 6.09
0.4 0.5 91 74 58 2.101 Thiram 42S at 188 mg ai/100 g of seed applied as a seed treatment was included in all treatments except the untreated control 2 Visual evaluation of onion stand and vigor in each plot. 0 -5 scale; 0 = 100% stand loss and 5 = highest stand and vigor in the trial
Onion Stand
Onion Stand Density
plants per plot
95% Confidence Interval
0 to 5 rating scale
& Vigor Ratings2
42
Tab
le 2
. In
flu
en
ce o
f In
sect
icid
e T
reat
me
nt
on
On
ion
Sta
nd
at
IREC
in 2
01
2
Bro
acas
t1.
5 le
af s
tage
3 le
af s
tage
trt#
Inse
ctic
ide
Tre
atm
en
tra
te/A
roto
till
Infu
rro
wSe
ed
trt
at p
lan
tp
lan
ts/p
lot
pla
nts
/plo
t
1Se
pre
sto
(cl
oth
ian
idin
+im
idac
lop
rid
)0.
24 m
g ai
/ s
ee
dx
708
793
2En
tru
st (
spin
osa
d)
0.2
mg
ai /
se
ed
x61
473
5
3Fa
rMo
reFI
500
(th
iam
eth
oxa
m +
sp
ino
sad
) co
mm
erc
ial p
ell
et
mfg
re
c. r
ate
/se
ed
x63
873
2
4th
iam
eth
oxa
m +
sp
ino
sad
Co
rne
ll e
ncr
ust
me
nt
0.1
mg
ai +
0.2
mg
ai /
se
ed
x61
767
1
5Lo
rsb
an 4
E32
fl.
oz/
Ax
505
573
6Lo
rsb
an 1
5-G
6.6
lbs/
acre
x43
950
5
7C
ruis
er
(th
iam
eth
oxa
m)
0.2
mg
ai /
se
ed
x39
845
4
8U
ntr
eat
ed
Co
ntr
ol w
ith
Th
iram
no
ne
x36
937
3
9U
ntr
eat
ed
se
ed
-no
fu
ngi
cid
en
on
e33
135
6
10En
tru
st (
spin
osa
d)
6 o
z/A
x34
034
7
11En
tru
st (
spin
osa
d)
3 o
z/A
+ 3
oz/
Ax
x31
533
8
12En
tru
st (
spin
osa
d)
6 o
z/A
x29
330
6
13A
dm
ire
Pro
(im
idac
lop
rid
)14
fl.
oz/
Ax
272
288
14V
ydat
e (
oxa
myl
) in
-fu
rro
w32
fl.
oz/
Ax
278
283
15V
ydat
e (
bro
adca
st a
fte
r p
lan
tin
g; w
ate
r im
me
dia
tely
aft
er
app
l.)
64 f
l. o
z/A
x27
227
9
16A
dm
ire
Pro
(im
idac
lop
rid
)14
fl.
oz/
Ax
252
261
17A
dm
ire
Pro
(im
idac
lop
rid
)7
fl. o
z/A
x
259
258
18A
mir
e P
ro (
imid
aclo
pri
d)
7 fl
. oz/
A +
7 f
l. o
z/A
x
x24
125
3
LSD
P =
0.0
591
103
Inse
ctic
ide
Ap
pli
cati
on
Me
tho
dO
nio
n S
tan
d D
en
sity

43
Herbicide Resistance Management Programs for RR Alfalfa
Steve Orloff, UC Cooperative Extension, Siskiyou County
Weeds present a continual challenge for profitable alfalfa production. The Roundup-Ready production system, using transgenic alfalfa, has the potential to simplify weed management by improving broad-spectrum control of both annual and difficult-to-control perennial weeds. However, weed species shifts and the selection for glyphosate-resistant weeds may result from repeated use of glyphosate. This is one of the primary concerns related to this technology and is part of the reason why a Circuit Court Judge halted further plantings of RR alfalfa until an Environmental Impact Statement (EIS) was completed.
Adding diversity to the Roundup-Ready production system by utilizing herbicides with different modes of action has been shown to improve the sustainability of the system. This project is designed to demonstrate how herbicides with modes of action different from glyphosate can be utilized to add diversity into the Roundup-Ready Alfalfa production system. The effect of alternative herbicides on weed control and alfalfa yield is being assessed to allow an economic evaluation of different weed management systems to avoid resistance. The objectives of this project are to evaluate alternative herbicides other than glyphosate in a RR system to determine:
1. The efficacy of alternative herbicides in both seedling and established alfalfa 2. The effect of different conventional herbicides on alfalfa yield 3. Assess the economics of different weed management systems
There are two components to this study. The first part involved evaluating different herbicides in seedling alfalfa. The study was initiated in 2011 and was duplicated in 2012. There were 12 to 14 different treatments to compare alternative chemistries as tank mixes in seedling alfalfa to avoid weed shifts and weed resistance. This trial is being conducted in approximately six alfalfa production regions across the US. The other component of the study starts with the year of alfalfa establishment and follows the crop into the second year of production. Once alfalfa becomes established herbicide possibilities increase and herbicides with different modes of action and soil residual can be introduced. The study is a factorial design with four first year treatments (Untreated, Roundup, Raptor and Roundup plus Raptor) and five established year treatments (Untreated, Roundup, Velpar, Sencor plus Gramoxone, and Roundup plus Prowl). Alfalfa production and herbicide efficacy will be examined over the study duration. In addition to IREC, the second component of this study will also be conducted in Nebraska.

44
One of the most interesting developments in this study to date has been to document the injury that occurs with conventional herbicides. Most conventional herbicides injure alfalfa to some degree but quantifying the level of injury has been difficult because of the difficulty in discerning the impacts of weed competition and herbicide injury. It is difficult to assess what weed-free alfalfa would yield without using an herbicide. If no herbicide is applied, in some environments the weed pressure is so great that the weeds impact alfalfa growth. The advent of RR alfalfa has improved our ability to assess the degree of phytotoxicity that occurs with conventional herbicides. The untreated plots had the highest yield due to the contribution of the weeds to the total forage (in the intermountain plots the weeds accounted of 58% of the forage). The yield of Raptor-treated plots was 0.28 tons per acre less than Roundup-treated plots over one cutting at IREC and 0.5 tons per acre less over two cuttings at the Nebraska site. This degree of crop injury is in close agreement with another study conducted at IREC on alfalfa varieties and weed control systems. These studies were with spring-seeded alfalfa. Alfalfa injury associated with conventional herbicides may be less with fall-seeded alfalfa. To avoid weed shifts and weed resistance in RR alfalfa production systems it will be important to rotate herbicides. While this research is preliminary, it appears that the best time to rotate herbicides may be during the established years rather than the seedling year. Roundup is very effective during the seedling year and the alternative herbicides appear to cause significant injury in some cases. Tank mixes in the seedling year may be necessary however, when glyphosate tolerant or resistant weeds are present.
Figure 1. The effect of seedling alfalfa herbicide treatments on first year forage yield at the UC Intermountain Research and Extension Center (A) and the University of Nebraska Panhandle Research and Extension Center (B), 2011. Note: Untreated plots yields were alfalfa and weeds (alfalfa yield in the untreated plots at IREC was 1.40 tons/A, total yield was 58% weeds).

45
Determining the Efficacy and Cost of Pocket Gopher Control Practices
Steve Orloff1 and Roger Baldwin2 1UC Cooperative Extension, Siskiyou County
2 UC Cooperative Extension, Kearney Agricultural Research and Extension Center Pocket gophers are the most widespread and significant vertebrate pest problem in alfalfa. Damage caused by gophers is many-fold. They feed on the taproot stunting or killing plants. Gopher mounds can cover alfalfa plants smothering and killing them. The damage is not short lived and persists for the life of the stand—even after the pocket gopher population is controlled. Soil from gopher mounds often ends up in the swather and eventually in the bales reducing the forage quality of the crop. The mounds are also damaging to forage harvesting equipment. The burrow system can reduce irrigation uniformity and in surface-irrigated fields cause soil erosion. Flood irrigation is partially effective at suppressing gopher populations. However, the majority of alfalfa in the Intermountain Region is sprinkler irrigated, making intermountain fields ideal gopher habitat.
Gopher control has been a major frustration for alfalfa growers for decades. There are several control measures available for use in existing alfalfa fields including trapping, hand baiting, baiting using an artificial burrow builder, fumigation with aluminum phosphide and a relatively new control measure whereby carbon monoxide is pressurized and injected into gopher burrow systems. None of these control measures is inherently superior, leaving growers wondering which control measures is most cost effective. Perhaps the most common control measure used in the Intermountain Region is baiting with the artificial burrow builder. However, this practice may also be the least effective but is commonly done because growers have invested in the equipment and it is the least labor intensive practice. Growers often consider trapping to be too labor intensive but it may be more cost effective than other control measures and is less damaging to the alfalfa stand than the burrow builder. Although aluminum phosphide has been found to be very effective in limited research from other areas and anecdotal evidence, it is rarely or never used in the Intermountain Region. Using pressurized exhaust for rodent control was just approved this year. The cost for the application device (PERC unit) is expensive and more information is needed on its efficacy before many growers invest in this practice. Research has been conducted in the Intermountain Region to compare different traps and to evaluate the effectiveness of different attractants to improve the capture rate. Preliminary research has been conducted to evaluate the effectiveness of injecting carbon monoxide using the PERC unit. Aluminum phosphide was evaluated decades ago for the control of Belding’s ground squirrels in Modoc County and was not found to be effective. However, grower testimony from another intermountain area in Oregon indicates that while it is not effective for squirrel control, it is efficacious for gophers. Individual control measures have been evaluated but few studies have compared the effectiveness of various control measures in the same field. In addition, there is very little information available on the time, labor, and materials cost associated with the different control practices. This research will greatly assist growers in

46
making a more informed decision when selecting the most appropriate control measure for one of their most significant problems.
The primary objectives of this study are to: 1. Compare the effectiveness of different gopher control measures including trapping,
baiting with strychnine using an artificial burrow builder, fumigation with aluminum phosphide, and carbon monoxide injection using the PERC unit.
2. Quantify the time, labor requirement and material cost associated with each control practice.
3. Estimate the overall cost effectiveness for each control measure. The trial was conducted in commercial established alfalfa fields in the Tulelake area; a 160-acre field (two replications) and an 80-acre field (one replication). Fields were divided into four more or less equal sized sections. The following treatments were randomly assigned to each of the four sections.
1. Untreated control 2. Trapped using Gophinator trap 3. Carbon monoxide injection using the PERC device (applied by the equipment
manufacturer or his assistant) 4. Fumigation with aluminum phosphide (two tablet per burrow system)
The gopher population was surveyed before and after treatment. Twenty 30 by 30 foot plots were established in each treatment area (with at least 60 feet between plots) in order to assess the pre-treatment base occupancy and post-treatment control. There were a total of 80 survey plots per field with the 4 treatments. The burrow system was excavated at two locations in each survey plot and an entry hole left open. Forty-eight hours later the holes were be inspected. A plugged hole indicates the burrow system is occupied with a gopher.
Treatments were applied in April. The open-hole method described above to determine the base occupancy will be used again 48 hours after treatment to assess the level of control (post-treatment occupancy compared with pre-treatment occupancy).
The amount of time required to perform each of the treatments was documented as well as the material cost and equipment costs. This will make it possible to assess the cost effectiveness of each treatment. The initial results are presented below in Figure 1. None of the treatments provided over 80 percent control. Retreatment would be necessary in order to achieve an acceptable level of control. Numerically, aluminum phosphide was the most effective, followed by trapping and then the PERC device. Further analysis is needed to compare the costs associated with each treatment. We plan to repeat this research next fall or spring depending on the weather.

47
Figure 1. Percent efficacy of aluminum phosphide (Al Ph), trapping, Pressurized Exhaust
Rodent Controller (PERC), and control treatments for pocket gopher removal in alfalfa during
April 2012. Significant differences in efficacy for various treatments are denoted by differing
letters.
0%
10%
20%
30%
40%
50%
60%
70%
80%
90%
100%
Control Al Ph Trapping PERC
Per
cen
t ef
fica
cyPresence/absence
Plugged burrow counts
b
a
a
ab
z
x
xy
y

48
Tulelake Field Day, July, 2012
UC ALFALFA VARIETY RESEARCH Dan Putnam, Steve Orloff, Rob Wilson, Don Kirby, and Craig Giannini,
UC Davis and UCCE.
Growers often choose cultivars based upon promotion, price or habit. Also, those hats! However, the choice of a variety can make a large long-term difference in profitability. Spending just a few minutes to carefully consider choice of variety may be beneficial, since1) cultivars can have a large impact upon yield, 2) Varieties can help cope with diseases or insects, and 3) Growers are ‘stuck’ with their choice for many years. Almost Like getting Married! Although some marriages don’t last too long, most would at least like their marriages to last more than just a few months. Just like a spouse, why not take a little time to determine whether an alfalfa variety is a good one? After all, you’ll need to live with that decision for a while.
UC Variety Testing Program The University of California provides an independent source of variety information that can be used to judge performance of alfalfa varieties. We have plots ranging from Tulelake and Scott Valley (Intermountain), to Davis and Kearney (Central Valley), and El Centro (Desert). Yields are important, but are not the only criteria for variety selection. Take a look at fall dormancy, disease resistance, and the quality characteristics, too. Research is continually underway to improve the performance of alfalfa varieties.
Many thanks to California Crop Improvement Association and alfalfa seed companies for funding the UC alfalfa variety work
See:
http://alfalfa.ucdavis.edu
for current variety information

49
Variety Choice – Does it pay? Although sometimes varieties don’t appear to be very different, economically, they are. The choice of variety makes a sizeable difference. Growers don’t always see these differences in the field: one must plant the varieties side-by-side and carefully measure them. The maximum difference between the highest and lowest yielding variety at Tulelake has been about 2 tons/acre/year, but even among the better varieties, there are some important (but smaller) yield differences. Here, we’ve calculated the gross economic return (below) based only upon the differences between the varieties (e.g. a 2 ton difference is about $400/year or 1600/4 years), Even if an improved alfalfa seed were $2/lb more than a ‘run-of-the-mill’ variety, it would still be worth it if that variety yielded more, since only $50/acre is required for the cost of that seed. Growers often pay too much attention to seed price, and should instead pay more attention to how that variety performs.

50
Steps for Choosing Alfalfa Varieties:
1) Choose group of high yielding certified varieties from relevant trials.
2) Determine Fall Dormancy requirements and preference.
3) Determine pest resistance requirements for your area (emphasize those you expect).
4) Consider Biotech Traits (e.g. RR)
5) Look for evidence of better persistence
6) Consider Forage quality
7) Price/availability, and of course, hats
Suggested minimum alfalfa cultivar pest resistance and fall dormancy ratings
1
for alfalfa pests found in six California climate zones2.
Zone2 FD SAA PA BAA PRR BW FW San Stn RKN VW
Intermountain 2--4 S R MR R R HR R HR R R
Sacramento Valley 4--8 MR HR HR HR MR HR R R R R
San Joaquin Valley 7--9 R HR HR HR MR HR R HR HR R
Coastal 5--7 MR HR HR HR MR HR R HR HR R
High Desert 4--7 R R R R MR HR MR HR HR R
Low Desert 8--9 HR HR HR HR S HR HR R HR S 1 Pest Resistance abbreviations described below.
NOTE: These pest Resistance Ratings were originally developed by Dr. Vern Marble, Extension Agronomist,
UC Davis, based upon decades of experience with alfalfa variety response in various locations in California. 2 Zones correspond to the principle regions of alfalfa Production in California.
Resistance Abbreviations Percent resistance1
HR Highly Resistant >51%
R Resistant 31-50%
MR Moderately Resistant 15-30%
LR Low Resistant 6-14%
S Susceptible <5%
T Tolerance (see definition)
1 Percent of plants in a population resistant to a given pest

51
2008-2011 DATASET:
2008-2011 YIELDS, TULELAKE ALFALFA CULTIVAR TRIAL. TRIAL PLANTED 07/27/07
% of
VERNAL
FD %
Released Varieties
Archer III 5 8.6 1) ( 8.3 2) ( 7.5 3) ( 9.8 1) ( 8.5 1) ( A 131.0
PGI 459 4 8.5 2) ( 8.3 4) ( 7.8 1) ( 9.3 9) ( 8.5 2) ( A B 129.6
DKA50-18 5 8.3 11) ( 8.5 1) ( 7.6 2) ( 9.3 10) ( 8.4 3) ( A B C 129.0
WL 357HQ 5 8.3 12) ( 8.1 6) ( 7.2 8) ( 9.2 12) ( 8.2 4) ( B C D 125.8
GrandStand 4 8.2 20) ( 8.0 10) ( 7.3 6) ( 9.3 5) ( 8.2 5) ( B C D E 125.7
Integra 8400 4 8.0 34) ( 8.3 3) ( 7.5 4) ( 8.9 22) ( 8.2 6) ( B C D E F 125.3
Integra 8300 3 8.3 15) ( 8.1 7) ( 7.2 9) ( 9.1 14) ( 8.2 7) ( B C D E F 125.2
AmeriStand407TQ 4 8.1 30) ( 8.0 9) ( 7.2 12) ( 9.3 8) ( 8.2 8) ( B C D E F G 125.1
AmeriStand444NT 4 8.4 4) ( 7.7 31) ( 7.2 14) ( 9.2 11) ( 8.1 9) ( B C D E F G H 124.7
Genoa 4 8.4 6) ( 7.7 27) ( 7.3 5) ( 9.1 16) ( 8.1 11) ( B C D E F G H 124.6
Legendairy 3 8.0 33) ( 8.1 5) ( 7.2 11) ( 9.1 13) ( 8.1 13) ( C D E F G H I 124.4
MilkMaker ML 5 8.4 3) ( 7.6 37) ( 6.9 31) ( 9.4 4) ( 8.1 15) ( C D E F G H I J 123.8
PGI 424 4 8.3 10) ( 7.9 13) ( 7.0 24) ( 8.9 20) ( 8.0 17) ( D E F G H I J K 123.0
CW 500 5 8.2 18) ( 7.9 14) ( 6.8 38) ( 9.1 15) ( 8.0 20) ( D E F G H I J K L 122.8
FSG 528SF 5 8.4 7) ( 7.7 26) ( 6.9 35) ( 8.9 21) ( 8.0 21) ( D E F G H I J K L M 122.3
Rebound 5 4 7.9 38) ( 8.0 8) ( 7.2 13) ( 8.6 33) ( 7.9 24) ( D E F G H I J K L M N O 121.7
FSG 505 5 7.8 46) ( 7.7 25) ( 7.2 7) ( 8.7 29) ( 7.9 28) ( E F G H I J K L M N O P Q 120.5
Xtra-3 4 8.4 5) ( 7.5 45) ( 6.8 41) ( 8.6 31) ( 7.8 31) ( G H I J K L M N O P Q R 120.0
Magnum VI 4 7.8 47) ( 7.8 18) ( 6.8 44) ( 8.7 30) ( 7.8 36) ( J K L M N O P Q R S T U 118.9
WL 343HQ 4 7.6 52) ( 7.7 34) ( 6.9 29) ( 8.6 34) ( 7.7 38) ( K L M N O P Q R S T U 118.3
Dura 512 5 8.1 24) ( 7.8 21) ( 6.6 48) ( 8.2 49) ( 7.7 40) ( L M N O P Q R S T U 117.7
54V09 4 8.1 29) ( 7.6 39) ( 6.7 46) ( 8.2 45) ( 7.6 43) ( M N O P Q R S T U 117.3
WL 325 HQ 4 7.8 48) ( 7.7 32) ( 6.8 42) ( 8.1 52) ( 7.6 47) ( P Q R S T U 116.4
Mountaineer 2 5 7.9 39) ( 7.3 50) ( 6.6 51) ( 8.3 44) ( 7.5 49) ( Q R S T U 115.6
Everlast II 4 7.7 51) ( 7.5 43) ( 6.8 43) ( 8.2 50) ( 7.5 50) ( Q R S T U 115.5
MasterPiece 4 8.0 37) ( 7.4 49) ( 6.7 45) ( 7.9 55) ( 7.5 51) ( R S T U 115.0
Whitney 4 7.9 41) ( 6.9 54) ( 6.3 53) ( 8.8 26) ( 7.5 52) ( S T U 114.5
Prosementi ND 8.1 28) ( 7.2 53) ( 6.3 54) ( 8.2 48) ( 7.4 53) ( T U 114.0
FSG 408DP 4 7.6 53) ( 7.3 52) ( 6.8 40) ( 8.0 53) ( 7.4 54) ( U 113.7
Vernal 2 6.7 56) ( 6.5 56) ( 5.6 56) ( 7.3 56) ( 6.5 56) ( 100.0
MEAN
CV
LSD (0.1)
Trial seeded at 25 lb/acre viable seed at Intermountain Research and Extension Center, Tulelake, CA.
Entries follow ed by the same letter are not signif icantly different at the 10% probability level according to Fisher's (protected) LSD.
FD = Fall Dormancy reported by seed companies.
5.8 4.5 4.5 8.7 4.1
0.49 0.37 0.33 0.81 0.34
Dry t/a
8.05 7.69 6.93 8.71 7.84
2008 2009 2010 2011
Yield Yield Yield Yield Average
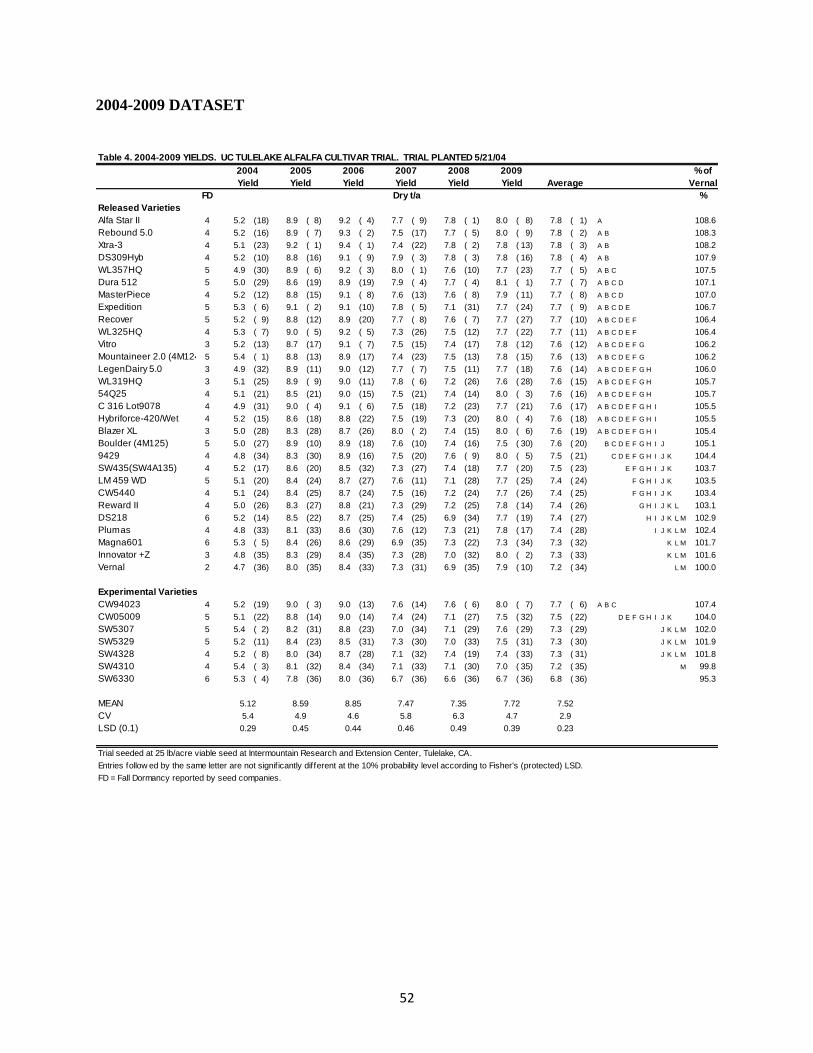
52
2004-2009 DATASET
Table 4. 2004-2009 YIELDS. UC TULELAKE ALFALFA CULTIVAR TRIAL. TRIAL PLANTED 5/21/04
% of
Vernal
FD %
Released Varieties
Alfa Star II 4 5.2 18) ( 8.9 8) ( 9.2 4) ( 7.7 9) ( 7.8 1) ( 8.0 8) ( 7.8 1) ( A 108.6
Rebound 5.0 4 5.2 16) ( 8.9 7) ( 9.3 2) ( 7.5 17) ( 7.7 5) ( 8.0 9) ( 7.8 2) ( A B 108.3
Xtra-3 4 5.1 23) ( 9.2 1) ( 9.4 1) ( 7.4 22) ( 7.8 2) ( 7.8 13) ( 7.8 3) ( A B 108.2
DS309Hyb 4 5.2 10) ( 8.8 16) ( 9.1 9) ( 7.9 3) ( 7.8 3) ( 7.8 16) ( 7.8 4) ( A B 107.9
WL357HQ 5 4.9 30) ( 8.9 6) ( 9.2 3) ( 8.0 1) ( 7.6 10) ( 7.7 23) ( 7.7 5) ( A B C 107.5
Dura 512 5 5.0 29) ( 8.6 19) ( 8.9 19) ( 7.9 4) ( 7.7 4) ( 8.1 1) ( 7.7 7) ( A B C D 107.1
MasterPiece 4 5.2 12) ( 8.8 15) ( 9.1 8) ( 7.6 13) ( 7.6 8) ( 7.9 11) ( 7.7 8) ( A B C D 107.0
Expedition 5 5.3 6) ( 9.1 2) ( 9.1 10) ( 7.8 5) ( 7.1 31) ( 7.7 24) ( 7.7 9) ( A B C D E 106.7
Recover 5 5.2 9) ( 8.8 12) ( 8.9 20) ( 7.7 8) ( 7.6 7) ( 7.7 27) ( 7.7 10) ( A B C D E F 106.4
WL325HQ 4 5.3 7) ( 9.0 5) ( 9.2 5) ( 7.3 26) ( 7.5 12) ( 7.7 22) ( 7.7 11) ( A B C D E F 106.4
Vitro 3 5.2 13) ( 8.7 17) ( 9.1 7) ( 7.5 15) ( 7.4 17) ( 7.8 12) ( 7.6 12) ( A B C D E F G 106.2
Mountaineer 2.0 (4M124) 5 5.4 1) ( 8.8 13) ( 8.9 17) ( 7.4 23) ( 7.5 13) ( 7.8 15) ( 7.6 13) ( A B C D E F G 106.2
LegenDairy 5.0 3 4.9 32) ( 8.9 11) ( 9.0 12) ( 7.7 7) ( 7.5 11) ( 7.7 18) ( 7.6 14) ( A B C D E F G H 106.0
WL319HQ 3 5.1 25) ( 8.9 9) ( 9.0 11) ( 7.8 6) ( 7.2 26) ( 7.6 28) ( 7.6 15) ( A B C D E F G H 105.7
54Q25 4 5.1 21) ( 8.5 21) ( 9.0 15) ( 7.5 21) ( 7.4 14) ( 8.0 3) ( 7.6 16) ( A B C D E F G H 105.7
C 316 Lot9078 4 4.9 31) ( 9.0 4) ( 9.1 6) ( 7.5 18) ( 7.2 23) ( 7.7 21) ( 7.6 17) ( A B C D E F G H I 105.5
Hybriforce-420/Wet 4 5.2 15) ( 8.6 18) ( 8.8 22) ( 7.5 19) ( 7.3 20) ( 8.0 4) ( 7.6 18) ( A B C D E F G H I 105.5
Blazer XL 3 5.0 28) ( 8.3 28) ( 8.7 26) ( 8.0 2) ( 7.4 15) ( 8.0 6) ( 7.6 19) ( A B C D E F G H I 105.4
Boulder (4M125) 5 5.0 27) ( 8.9 10) ( 8.9 18) ( 7.6 10) ( 7.4 16) ( 7.5 30) ( 7.6 20) ( B C D E F G H I J 105.1
9429 4 4.8 34) ( 8.3 30) ( 8.9 16) ( 7.5 20) ( 7.6 9) ( 8.0 5) ( 7.5 21) ( C D E F G H I J K 104.4
SW435(SW4A135) 4 5.2 17) ( 8.6 20) ( 8.5 32) ( 7.3 27) ( 7.4 18) ( 7.7 20) ( 7.5 23) ( E F G H I J K 103.7
LM 459 WD 5 5.1 20) ( 8.4 24) ( 8.7 27) ( 7.6 11) ( 7.1 28) ( 7.7 25) ( 7.4 24) ( F G H I J K 103.5
CW5440 4 5.1 24) ( 8.4 25) ( 8.7 24) ( 7.5 16) ( 7.2 24) ( 7.7 26) ( 7.4 25) ( F G H I J K 103.4
Reward II 4 5.0 26) ( 8.3 27) ( 8.8 21) ( 7.3 29) ( 7.2 25) ( 7.8 14) ( 7.4 26) ( G H I J K L 103.1
DS218 6 5.2 14) ( 8.5 22) ( 8.7 25) ( 7.4 25) ( 6.9 34) ( 7.7 19) ( 7.4 27) ( H I J K L M 102.9
Plumas 4 4.8 33) ( 8.1 33) ( 8.6 30) ( 7.6 12) ( 7.3 21) ( 7.8 17) ( 7.4 28) ( I J K L M 102.4
Magna601 6 5.3 5) ( 8.4 26) ( 8.6 29) ( 6.9 35) ( 7.3 22) ( 7.3 34) ( 7.3 32) ( K L M 101.7
Innovator +Z 3 4.8 35) ( 8.3 29) ( 8.4 35) ( 7.3 28) ( 7.0 32) ( 8.0 2) ( 7.3 33) ( K L M 101.6
Vernal 2 4.7 36) ( 8.0 35) ( 8.4 33) ( 7.3 31) ( 6.9 35) ( 7.9 10) ( 7.2 34) ( L M 100.0
Experimental Varieties
CW94023 4 5.2 19) ( 9.0 3) ( 9.0 13) ( 7.6 14) ( 7.6 6) ( 8.0 7) ( 7.7 6) ( A B C 107.4
CW05009 5 5.1 22) ( 8.8 14) ( 9.0 14) ( 7.4 24) ( 7.1 27) ( 7.5 32) ( 7.5 22) ( D E F G H I J K 104.0
SW5307 5 5.4 2) ( 8.2 31) ( 8.8 23) ( 7.0 34) ( 7.1 29) ( 7.6 29) ( 7.3 29) ( J K L M 102.0
SW5329 5 5.2 11) ( 8.4 23) ( 8.5 31) ( 7.3 30) ( 7.0 33) ( 7.5 31) ( 7.3 30) ( J K L M 101.9
SW4328 4 5.2 8) ( 8.0 34) ( 8.7 28) ( 7.1 32) ( 7.4 19) ( 7.4 33) ( 7.3 31) ( J K L M 101.8
SW4310 4 5.4 3) ( 8.1 32) ( 8.4 34) ( 7.1 33) ( 7.1 30) ( 7.0 35) ( 7.2 35) ( M 99.8
SW6330 6 5.3 4) ( 7.8 36) ( 8.0 36) ( 6.7 36) ( 6.6 36) ( 6.7 36) ( 6.8 36) ( 95.3
MEAN
CV
LSD (0.1)
Trial seeded at 25 lb/acre viable seed at Intermountain Research and Extension Center, Tulelake, CA.
Entries follow ed by the same letter are not signif icantly different at the 10% probability level according to Fisher's (protected) LSD.
FD = Fall Dormancy reported by seed companies.
2.9
0.29 0.45 0.44 0.46 0.49 0.39 0.23
5.4 4.9 4.6 5.8 6.3 4.7
Average
Dry t/a
5.12 8.59 8.85 7.47 7.35 7.72 7.52
2007
Yield
2008
Yield
2009
Yield
2004
Yield
2005
Yield
2006
Yield

53
2012 IREC Field Map North 40 North
7/19/2012
Spring Wheat Rojo20
146 A Potatoes Spring Wheat Rojo458 Maggot
20 Onion
20146 A
20 2020
20 56132 B
132 B
475 Fert
20
260 W W
260 Line Cereal
132 C
132 A
20
456 Herb
Fallow 20 456 Herbicide potato trials367 A & B
367 A & B Alfalfa 50 133 F Winter Wheat Tubbs 456 Herbicide 57
20 20 onion trials
239 Yield HP
239 Yield HP
Cereal
51
133 E
133 B Winter Wheat Tubbs
20 Rojo 20 R o jo
260 BarleyYld
260 BarleyYld
20
133 C 20 cereal trials260 Wheat Yld
260 WheatYld
260 BarleyYld
133 C
133 C 58
20 Spring Wheat Rojo cereal
255 A&B
255 A&B
I 260 HP
I 260 HP
133 A
20 20255 A&B
255 A&B
I 260 HP
I 260 HP 53133 D
54 55 59 mint
Winter Wheat Tubbs alfalfa trials
20 340 B Alfalfa
60367C
397 B 66 70 alfalfa
397 B
397 B
sudan
61 71
20
20
459 ThripOnion
68 72 Blue = Mainline
Mint Still
569
569 Mint459 Thrip
20
20 Rojo
397A Roads = 30 feet
Pipe Stgfallow
451 A Fung
451 A Fung
397A
397A Alfalfa
MotherBlk 63 64 451 A Fung 65340 B
340 B 69 73
Alfalfa
20
Winter Wheat Tubbs 49
20 255 67 20
20 Rojo 52
Sudan Sudan 20 Spring Wheat Rojo Sudan
20 20 20
Sudan Sudan
Mint
20
.
20 Spring Wheat Rojo
62
Spring Wheat Rojo Mint
566
Pump Station
University of California
Intermountain Research & Extension Center
2012 Station Map
W S
4 4 4 4 20 20 20 20 20 20 20 20 E T 20 20 20 20 20 1 20 20 20 1 20 1 20 20
5 5 5 5 WW WW WW WW WW WW WW WW A A Pot Pot Pot Pot Pot 3 Pot Pot Pot 4 Pot 4 Pot Pot
1 1 1 1 Tubbs Tubbs Tubbs Tubbs Tubbs Tubbs Tubbs Tubbs T T 3 6 6
B B B B H I G B B
rojo rojo rojo rojo E O stem timing timing 47 48
R N STRAW 45 46
15 16 17 18 19 20 21 22 23 24 25 26 27 28 29 30 31 32 33 34 35 36 37 38 39 40 41 42 43 44
P
20 20 20 20 20 20 20 20 20 3 3 3 3 A
WW WW WW SW WW SW Alf Alf Alf 4 4 4 4 R
Tubbs Tubbs Tubbs rojo Tubbs rojo 9 9 9 9 K
C C B B I
N
G
1 2 3 4 5 6 7 8 9 10 11 12 13 14
GARDEN

54
* 6 *
56
* 5 *
* 4 *
52 53 54
Rest Room * 7 *
60 66
* 8 *
* 9 *
67
* 1 *
* 3 *
72
* 2 * 73
64 65
68
69
61
62
63
55
50
51
Drop Off
Pick Up
57
58
59
70
49
71
Pump StationNorth
Asterisks indicate stop numbers End End
Start

55
2012 Annual field day Sponsors
Thank You for Your Generous and Continued Support!
We would like to take this opportunity to sincerely thank the following sponsors who help make Field Day such a wonderful success. The support they provide allows us to offer the morning refreshments, the informational publication, the excellent catered lunch and drinks and the home-made ice cream.
Alsco, Inc.
BASF
Basin Fertilizer
Bayer Cropscience
California Garlic & Onion Research Advisory Board
Floyd A. Boyd
JW Kerns Irrigation
Macy’s Flying Service
Northwest Farm Credit Service
Siskiyou County Ag Commissioner

56
Agenda
2012 Annual Field Day University of California
Intermountain Research & Extension Center July 26, 2012 Tulelake, CA
7:30 am Registration
8:20 am Management of Two Spotted Spider Mites and Mint Root Borer in Peppermint
Kris Tollerup, Post-Doctoral Researcher, Dept. of Entomology, UC Davis
8:40 am Fungicide Rate & Application Timings for Managing White Rot Disease in
Processing Onions
Allison Ferry, Grad Student, Dept. of Plant Pathology, UC Davis
9:00 am Insecticide Strategies for Thrips Control in Onions
Steve Orloff, UC Farm Advisor, Yreka, CA
9:20 am Nitrogen Management in Wheat to Maximize Yield & Protein
Steve Orloff, UC Farm Advisor, Yreka, CA
9:40 am 2012 Potato Research Update
Rob Wilson, Center Director/Farm Advisor, IREC, Tulelake, CA
10:00 am Maggot Control in Processing Onions
Rob Wilson, Center Director/Farm Advisor, IREC, Tulelake, CA
10:20 am Break
10:40 am Herbicide Resistance Management Programs for RR Alfalfa
Steve Orloff, UC Farm Advisor, Yreka, CA
11:00 am Determining the Efficacy and Cost of Pocket Gopher Control Practices in Alfalfa
Steve Orloff, UC Farm Advisor, Yreka, CA
11:20 am Alfalfa Variety Trials
Dan Putnam, Extension Agronomist, Dept. of Plant Sciences, UC Davis
12:00 pm Lunch