Embed Size (px)
Citation preview
International Journal of Business and Management Review
Vol.2.No.1, pp.27-51, March 2014
Published by European Centre for Research Training and Development UK (www.ea-journals.org)
27
IMPACT OF MICRO-CREDIT ON POVERTY ALLEVIATION IN NIGERIA – THE
CASE OF ENUGU EAST LOCAL COUNCIL
1Dr. Agbaeze E. K and I. O. Onwuka
2
1Department of Management, University of Nigeria, Enugu Campus, Nigeria
2Department of Banking & Finance, University of Nigeria, Enugu Campus, Nigeria
:
Postal Address: Department of Management, University of Nigeria Nsukka, Enugu State, Nigeria
ABSTRACT: Poverty has remained a global phenomenon and has defied various attempts at
curbing it especially in developing countries. The high and unacceptable number of people
within its grip around the world gave it a pride of place as one of the major goals of Millennium
Development Goals (MDGs) adopted in 2000. Poverty alleviation was a prime target of the
MDGs and micro-credit was recognized as a veritable tool for tackling it. In this paper, we
examined empirically the effect of micro-credit on poverty alleviation in Nigeria using some
selected rural farm households in Enugu East Local Government of Nigeria. To achieve this,
primary data were collected on the sources and access to micro credit; the incidence, depth and
severity of poverty among the selected rural households. Appropriate descriptive and analytical
tools were employed to process the data obtained. The results of the study show that poverty
level is still high among the rural populace; but those that have access to micro-credit seems to
have fared better than those who have no access to micro-credit. In other words, access to
micro-credit has positive but not significant impact on poverty alleviation among the rural
populace. The study recommends that government should intensify effort in its recent financial
inclusion strategy to ensure that the rural populace has greater access to micro credits.
Government should also ensure that interest rate on micro credits are affordable, the terms of
the credits flexible and the conditions attached to the credit well liberalized.
KEYWORDS: Micro-Credit, Poverty Alleviation, Rural Development, Rural Households
INTRODUCTION
The Government of President Goodluck Ebele Jonathan in his 2013 budget speech explicitly
identified poverty alleviation as one of the main priorities of the government. This is the third
year in succession that government is making poverty alleviation a priority in its budget
presentation. To many observers this is not surprising given the fact that 2015 is around the
corner when it is expected that the Millennium Development Goal of eliminating extreme would
have been achieved (see Littlefield, 2010; Adams, 2007 and Nwakapu, 2011). Besides this, the
poverty profile of the country has continued to deteriorate despite several and successive
government programmes to tackle it. Poverty has simply refused to abate in Nigeria and the
number of people living below the poverty line1 has continued to increase as the years go by (see
1The poverty line represents the value of basic needs (food and non food) considered essential for meeting the minimum
socially acceptable standard of living within a given society (UNDP, 2006). The National Poverty Rate is the percentage of a population of a country living below the poverty line (Uche, 2000). In Nigeria, the number of people living below the poverty line is 45 million as at 2009. That represents 67% of the country’s population based on 2006 population census and 2.8% growth rate (World Bank, 2010).

International Journal of Business and Management Review
Vol.2.No.1, pp.27-51, March 2014
Published by European Centre for Research Training and Development UK (www.ea-journals.org)
28
World Bank, 1997; 2000; 2003 and 2009). Perhaps, part of the inability of government to tackle
poverty may stem from the failure of a clear understanding of poverty itself. It has been argued
that despite the immense attention the subject has received, there is still no universal agreement
as to its definition (Uche, 2000). This may have led to the widespread view that poverty is
indeed a relative concept. While this is not the appropriate place to go into the theoretical issues
and difficulties in the definition of poverty, it must be stated right away that poverty is a
complex, multidimensional and hydra-head phenomenon that has existed from time immemorial
and has continued to occupy the centre stage in global affairs. There is not only disagreement as
to its definition but also in the simple matter of how to measure it. This makes it difficult to
ascertain when one moves from the non-poor into the poverty trap.
According to Bubarer (2003) poverty was already a serious problem in the days of Jesus Christ
(Mathew 26:11 – the poor you will always have) while in 1958, Galbraith already listed the
indicators of poverty as including insufficient food, poor clothing, crowded, cold and dirty
shelter, painful and brief life and income that falls markedly behind that of the community
(quoted from Uzor, 2011). But in all this confusion, one thing is indisputable: poverty is one of
the greatest challenges facing Nigeria today (CBN, 2010; World Bank, 2009). And this is
unfortunate given the country’s rich resources in agriculture, oil wealth, human capacity and
friendly geo-climatic conditions. Indeed, it is estimated that over 70 percent of Nigerians are
classified as poor, and half of this number lives in absolute poverty (World Bank, 2009; Landes,
2010). Poverty is particularly severe in rural areas, where up to 80 percent of the population
lives below the poverty line and with limited access to social services and infrastructures (Adam,
2007; Littlefied, 2005). The rural populace depends mainly on agriculture especially peasant
agriculture for food and income. Women are particularly vulnerable to the incidence of poverty.
They comprise the bulk of the poor groups within rural communities (Eadgerwood, 2009). Men
have higher social status and as a result have more access to facilities like school, training and
credit. The men have higher capacity for higher productivity and can usually combine a number
of enterprises which allows them to have multiple sources of income. Moreover, the number of
men migrating from the rural areas to urban areas in search of better employment has increased
and as a consequence, the number of rural households headed solely by women has grown
substantially in recent times. This development has serious implication for rural development in
Nigeria (see Nwobi, 2010).
Indeed, part of the experience in rural development in Nigeria has clearly shown that efforts at
expanding the economic base of the rural areas almost always flounder because of scarcity of
and restrictive access to loanable funds (Ijere, 1992; Okafor, 1999 and Tanko, 2007). The role of
financial capital as a factor of production to induce economic growth and development and the
need to channel credit to rural economies for economic empowerment of the rural poor cannot be
over-emphasized. This appears to have heightened the need for developing countries to increase
their capacity to mobilize domestic resources (savings) effectively and allocate them efficiently.
According to Soludu (2005) “robust economic growth cannot be achieved without putting in
place well focused programmes to reduce poverty through empowering the people by increasing
their access to factors of production, especially credit. The latent capacity of the poor for
entrepreneurship would be significantly enhanced through the provision of microfinance services

International Journal of Business and Management Review
Vol.2.No.1, pp.27-51, March 2014
Published by European Centre for Research Training and Development UK (www.ea-journals.org)
29
to enable them engage in economic activities and be more self-reliant; increase employment
opportunities, enhance household income and create wealth”
Microfinance is all about providing financial services to the poor who are traditionally not served
by the conventional financial institutions. Three features distinguish microfinance from other
formal financial products (Chanker, 1998, Nwobi, 2010 and Anyanwu, 2004). These are:
(i) the smallness of loans, advances and or savings collected;
(ii) the absence of asset-based collateral; and
(iii) the simplicity of operations.
In Nigeria, the formal financial system provides services to about 35% of the economically
active population while the remaining 65% are excluded from access to financial services (CBN,
2011). This 65% are often served by the informal financial sector, through Non-Governmental
Organization (NGO)-microfinance institutions, money-lenders, friends, relatives, and credit
unions. The practice of microfinance in Nigeria is culturally rooted and dates back several
centuries.2 The traditional microfinance institutions provide access to credit for the rural and
urban low income earners. They are mainly of the informal Self-Help Groups (SHGs) or
Rotating Savings and Credit Associations (ROSCAs) types (CBN, 2006). Other providers of
microfinance services include savings collectors and co-operative societies. The informal
financial institutions generally have limited outreach due primarily to paucity of loanable funds.
In order to enhance the flow of financial services to Nigerian rural areas, the Federal
Government has, in the past, initiated a series of publicly-financed micro/rural credit
programmes and policies targeted at the poor. Notable among such programmes were the Rural
Banking Programme, Sectoral Allocation of Credits, a concessionary interest rate, and the
Agricultural Credit Guarantee Scheme (ACGS). Other institutional arrangements were the
establishment of the Nigerian Agricultural and Co-operative Bank Limited (NACB), the National
Directorate of Employment (NDE), the Nigerian Agricultural Insurance Corporation (NAIC), the
Peoples Bank of Nigeria (PBN), the Community Banks (CBs), and the Family Economic
Advancement Programme (FEAP). In 2000, Government merged the NACB with the PBN and
FEAP to form the Nigerian Agricultural Co-operative and Rural Development Bank Limited
(NACRDB) to enhance the provision of finance to the agricultural sector. It also created the
National Poverty Eradication Programme (NAPEP) with the mandate of providing financial
services to alleviate poverty (Ayeyomi, 2003).
Since the 1980s, Non-Governmental Organizations (NGOs) have emerged in Nigeria to
champion the cause of the micro and rural entrepreneurs, with a shift from the supply-led
approach to a demand-driven strategy. The number of NGOs involved in microfinance activities
2Micro-finance services, particularly, those sponsored by government have adopted the traditional supply-led, subsidized credit
approach mainly directed to the agricultural sector and non-farm activities, such as trading, tailoring, weaving, blacksmithing, agro-processing and transportation. Although the services have resulted in an increased level of credit disbursement and gains in agricultural production and other activities, the effects were short-lived, due to the unsustainable nature of the programmes (Adams, 2007 and Anyanwu, 2004).

International Journal of Business and Management Review
Vol.2.No.1, pp.27-51, March 2014
Published by European Centre for Research Training and Development UK (www.ea-journals.org)
30
has increased significantly in recent times due largely to the inability of the formal sector to
provide the services needed by the low income groups and the poor, and the declining support
from development partners amongst others. The NGOs are charity, capital lending and credit-
only membership based institutions. They are generally registered under the Trusteeship Act as
the sole package or part of their charity and social programmes of poverty alleviation. The
NGOs obtain their funds from grants, fees, interest on loans and contributions from their
members. However, they have limited outreach due, largely, to unsustainable sources of funds
(Bamisele, 2011).
REVIEW OF RELATED LITERATURE
General Framework on Micro-Finance
According to Central Bank of Nigeria (2006) “microfinance is the provision of a broad range of
financial services such as deposits, loans, payment services, money transfers, and insurance to
poor and low income household and their micro-enterprises. Microfinance services are provided
by three types of sources:
Formal institutions, such as rural banks and co-operatives
Semiformal institutions, such as non-government organizations; and
Informal sources such as money lenders and shopkeepers.
Institutional microfinance is defined to include microfinance services provided by both formal
and semiformal institutions. Microfinance institutions are defined according to Central Bank of
Nigeria (2006) as institutions whose major business is the provision of microfinance services.
The interest in microfinance has burgeoned during the last two decades: multilateral lending
agencies, bilateral donor agencies, developing and developed country governments, and non-
government organizations (NGOs) all support the development of microfinance services. In
consequence, microfinance have grown rapidly during the last decade from an initial low level,
and have come to the forefront of development discussions concerning poverty reduction and
alleviation.3
Furthermore, development practitioners, policy makers, and multilateral and bilateral lenders,
however, recognize that providing efficient microfinance services for rural dwellers is important
for a variety of reasons (CBN, 2006):
i. Microfinance can be a critical element of an effective poverty reduction strategy.
Improved access and efficient provision of savings, credit, and insurance facilities in
particular can enable the poor to smoothen their consumption, manage their risks better,
build their assets gradually, develop their micro enterprises, enhance their income earning
capacity and enjoy an improved quality of life. Microfinance services can also contribute
3 Despite this growth, Soludo (2006) observed that “rural financial markets in Africa and Nigeria in particular are ill-prepared for
the twenty-first century” According to him, about 75% of some 140 million Nigerians still have little access to institutional financial services.

International Journal of Business and Management Review
Vol.2.No.1, pp.27-51, March 2014
Published by European Centre for Research Training and Development UK (www.ea-journals.org)
31
to the improvement of resource allocation, promotion of markets, and adoption of better
technology; thus, microfinance helps to promote economic growth and development.
ii. Without permanent access to institutional microfinance, most poor households continue
to rely on meager self-finance or informal sources of microfinance, which limits their
ability to actively participate in and benefit from development opportunities.
iii. Microfinance can provide an effective way to assist and empower poor women, who
make up a significant proportion of the poor and suffer disproportionately from poverty.
iv. Microfinance can contribute to the development of the overall financial system through
integration of financial markets.
History of Micro-Finance In Nigeria
The history of micro-finance in Nigeria dates back to centuries ago4. As a form of social capital,
the esusu as a financial self-help group was transported during the slave trade to the Caribbean
islands (Bascom, 1952), where both the institution and the term still exist today and are now
carried by a new wave of migrants to major American cities. Its origin were probably rotating
work associations, in which labor as a scarce commodity was accumulated and allocated to one
member at a time; and then, with the spreading of commercial transactions, replaced by money,
such as cowries, pounds and Naira. Nigeria is one of the countries where informal financial
institutions continue to play an important role. There may be only few Nigerians who are not a
member in one or several of them. Numerous adaptations and innovations have sprung from the
RoSCAs: one is the transformation into non-rotating savings associations with a permanent loan
fund. Both the name, ‘susu’, and the institution have spread as far as Liberia where as early as
1960s was the only effective financial institutions existing in the countryside (Seibel, 1970;
Desai & Mellor, 1974) and Congo, or Zaire. The other one is daily deposit collection at
doorsteps or market stalls. It seems to have originated among the Yoruba (where it is known as
ajo) from where it has spread all over West Africa during the past 50 years. These informal
financial institutions are immensely popular in Nigeria. Virtually every ethnic group has its own
institutions and proper names (adashi, in Hausa, perhaps the best-known besides esusu); and
most adults are members in one or several. Yet their importance and potential have been
controversially discussed. In 1934, C. F. Strickland, a British cooperative expert, examined the
esusu as a possible basis for modern cooperatives societies in Western Nigeria. Having
previously worked on the rotating chit funds in India, he speculated that the esusu must have
been imported from India at some unknown time, found them “improvident” and “fraudulent”,
and concluded that he was “not hopeful of the reform of the Esusu” (Strickland, 1934). The
consequences of his judgement were far-reaching: the Co-operative Societies Ordinance,
introduced in 1935 and modeled after British-Indian cooperatives, became the blueprint for the
British colonies in Africa.
4 The earliest evidence of financial institution in Africa dates back to the 16
th century: to esusu, a rotating savings and credit
association (RoSCA) among the Yoruba (Seibel, 1970).

International Journal of Business and Management Review
Vol.2.No.1, pp.27-51, March 2014
Published by European Centre for Research Training and Development UK (www.ea-journals.org)
32
However, informal financial institutions of various types continued to be rediscovered in Nigeria
by scholars (e.g. Green 1964; Bascom 1952; Ardener 1953, Isong 1958; Seibel 1970; Seibel &
Marx 1984; Ottenberg 1968; Okorie & Miller 1976) and practitioners, who were intrigued by
their development potential. At various times, two approaches were tested (i) upgrading
informal rotating or non-rotating savings and credit associations to registered cooperatives; and
(ii) linking them to banks (CBN, 2003).
Transforming Indigenous Savings and Credit Associations into Cooperatives
In Eastern Nigeria, in the 1940s colonial officers with an anthropological background
recommended the transformation of osusu or isusu (the Igbo term) to financial cooperatives as
well as the continuation of isusu practices within modern cooperatives (ie those registered under
cooperative law). In 1954, the Eastern Region Cooperative Department stated in its annual
report:
“The Isusu (Esusu, Susu, Osusu) is a widespread indigenous system of thrift and credit…. On the
whole, the Esusu seems to be fairly well managed; although in some areas…. the Isusu has
degenerated into a notorious money-lender-controlled ‘racket’. There are vast numbers of Isusu
Clubs in the region and the total amount of money involved must be very large. Some local
Government Councils have in recent times instituted a system of registration of Isusu Clubs
(Quoted from Ijere, 1982).
During the 1950s, when self-government was introduced, definitions of what constitutes
‘development’ changed; and so did attitudes to local culture and institutions. This is indicated by
the ‘modernization’ of one esusu in Ondo Province initiated in 1952 by a Nigerian civil servant,
J.T. Caxton-Idowu. He prepared bye-laws, “regularized” its activity, imparted cooperative
education, and registered the esusu as a proper cooperative society. At that time, there existed
four Cooperative Thrift & Credit Societies of the type imported by the British, to which the
esusu was added as a fifth cooperative, but of indigenous origin. Within a ten-year period, the
number of such cooperatives grew from 5 in 1952 to 94 in 1962, including converted esusu.
Their proportion in terms of number of cooperatives had blossomed over the years (Seibel,
1970).
The need for the achievement of qualitative economic growth by attaining balanced socio-
economic development motivated the desire and past efforts to use modern banking institutions
to meet the credit needs of people at the grassroots, especially in the sub-urban and rural areas of
Nigeria (Olashore, 2009 and Sadeque, 2010). Apart from the establishment of commercial and
merchant banks, specialized development banks were created focusing on mortgages,
agriculture, savings, cooperatives and other specific areas. Beyond this, the establishments of
rural branches were made mandatory for the commercial banks so that the interest of the rural
people could be catered for. This led to the opening of about 756 such rural bank branches
across the nation (Sagbamah, 1997). Inspite of these efforts, the rural people could not fit into

International Journal of Business and Management Review
Vol.2.No.1, pp.27-51, March 2014
Published by European Centre for Research Training and Development UK (www.ea-journals.org)
33
conventional banking system. In order to secure even the modest of loans, they were required to
fill several forms, obey certain rules and provide some form of guarantee or collateral. Banking
operations continued to be complex, sophisticated and often times cumbersome, to the extent that
the low level of education and the outright illiteracy of the rural people made participation
difficult (Mabogunje, 1991 and Mokezie, 2003). All in all, rural people and small scale
producers generally were made to feel marginalized in the modern environment of banking in the
country. In consequence, the rural people have had to continue to depend for their credit needs
on the informal and less than adequate system of rotational credit. In various parts of Nigeria,
the system is known as ‘ajo’, ‘esusu’, ‘bam’ and ‘adashi’. The main characteristics of these local
systems are voluntary contributions from members according to agreed rules. Only nominal
rates are charged on the loans, and where any member defaults, appropriate and mutually
acceptable sanctions are imposed (Ijere, 1982, Umoh, 1984).
Nigerian Rural Poor and Rural Development
The improvement of the economic development of the rural areas or settlements requires an
inquest on the features of rural settlements. The United Nations defines a rural settlement as any
settlement of less than 24,000 in population (World Bank, 2003). It goes on to further expatiate
on the general characteristics of the rural communities to include:
a. lack of or near absence of major infrastructural development such as good network of roads,
electricity, health facilities, etc.
b. low educational facilities and the attendant low overall educational level
c. conservation in behaviour and so on.
The major difference between the urban and rural communities including those located within
major cities is the level of poverty (Okonny 1994). Ijere (1982) claimed that the rural people
lack purchasing power enough to maintain a minimum standard of living. The rural people are
known as the rural poor.5
An index of the poverty of this sector is the low per capita outputs for maize, cereal, plantains
melon seeds, fruits, vegetables, palm oil, groundnut oil and host of other Nigerian staple foods.
According to Adewunmi (2006), “a peasant farmer hardly produces enough food to feed two
families of about eight people”. The root cause of this inadequate performance can ultimately be
linked to the low level of savings and investments in the economy.
5The Nigerian rural poor have been variously described by different writers. Olatunbosun (1975) called them “Nigeria’s
Neglected Rural Majority”. To Anthonio (1982) they are “the stagnant sector in the Nigerian economy” In the view of Ijere (1982) “Nigeria rural people constitutes the other Nigeria with poverty-linked characteristics, lacking purchasing power enough to maintain a minimum standard of living and surrounded by their Government Reservation Area (GRA) better off neighbors”.

International Journal of Business and Management Review
Vol.2.No.1, pp.27-51, March 2014
Published by European Centre for Research Training and Development UK (www.ea-journals.org)
34
Rural development is an all embracing phenomenon, and its problems are so involved, that in
seeking remedies, selective approach is recommended. There is no consensus as to the definition
of rural development however. To Littlefied (2005), “rural development is a process of not only
increasing the level of per capita income in the rural areas, but also the standard of living of the
rural population on such factors as food nutrition level, health, education, housing, recreation and
security”
Okafor (1999) on the other hand, saw rural development as connoting the condition and
percentage of the labour force in the agricultural sector, although, he rightly argued that a
programme of rural development goes beyond agriculture and includes the sum total of the
country’s economic development efforts in the rural areas. Further clarification on the concept
of rural development is offered by Adegboye (1982), who defined rural development as the
development of the rural people in such a continuous manner as to enable them to most
effectively and efficiently, utilize their intellect, technology and other resources for further
development for both themselves and their resources.
According to Ijere (1982), “rural development is part of general economic development, which
in itself is an increase in the material and non-material well-being of the people over time. The
only difference between the two is the emphasis of the first on the rural sector” Although
agriculture is the predominant occupation in the rural areas, the rural problem is not limited to
agriculture. Rural areas are inhabited by people engaged in non-agricultural activities like the
services, commerce, mining and education. A United Nations survey in 2001 confirmed that
71.9% of Nigerians live in the rural areas (Quoted from World Bank, 2003). Okafor (1992)
contended that “in Nigeria, about 80% of the people live directly or indirectly on the resource of
the land; rural areas, therefore, form the most important sector of the economy, and national
development is dependent on them”. It suffices to say that our development efforts cannot
achieve any appreciable improvement or impact until they focus on these rural areas.
Objective of the Study
The main objective of the study is to empirically evaluate the impact of microfinance in
alleviating poverty among rural populace in Enugu East Local Government Area of Enugu State
Nigeria. To achieve this, the study strives to:
1. Evaluate the demography and other socio-economic characteristics of the rural populace
2. Estimate the level of access to credit and their sources among the selected rural populace.
3. Estimate the incidence, depth and severity of poverty among the rural populace.
4. Evaluate the impact of access of microcredit on poverty level/status among the rural
populace
Hypothesis of the Study
Micro-credit is expected to assist micro-entrepreneurs and other rural populace to engage in
productive activities to increase their revenue base, improve infrastructure, create jobs, and
provide food for the populace and opportunities to diversify the Nigerian economy. Based on the
foregoing, a working hypothesis was formulated for the study:

International Journal of Business and Management Review
Vol.2.No.1, pp.27-51, March 2014
Published by European Centre for Research Training and Development UK (www.ea-journals.org)
35
Ho: Micro-credit has no positive and significant impact on poverty alleviation (socio-economic
status) of the rural populace.
H1: Micro-credit has positive and significant impact on poverty alleviation (socio-economic
status) of the rural populace.
METHODOLOGY
Study Design
The study adopted the survey research design. Primary data were collected through personal
interview and questionnaires. Specifically, questionnaires were administered to selected
households within Enugu East Local Government Area of Enugu State Nigeria. Some officials of
Micro-Finance Banks in the local government and leaders of the selected communities were also
interviewed.
Study Area
The study area was Enugu East Local Government of Enugu State Nigeria with a total land mass
of 383km2 (148 sq mi) and total population of 279,089 based on the 2006 census (NPC, 2010).
The headquarters of the council is located at Nkwo Nike. It is one of the 17 local government
councils in Enugu State Nigeria. It shares boundaries with Nkanu West local government
council, Isi-Uzo Local Government council and Enugu North local government council, all in
Enugu State. The major towns within Enugu East Local Government Area include; Abakpa
Nike, Emene, Nkwo Nike, and Ugwuogo.
Climatically, the area enjoys tropical climate and rainfall is high from April to July and
September to October. Average temperature is about 33oC but humidity can be as high as 95%.
Inhabitants are predominantly farmers especially those in Ugwogo, Emene and Nkwo Nike, who
engage in small scale farming. The major food crops in the area include yam, garri, cocoyam,
cassava, maize, vegetable and palm oil which is their major cash crop.
Sampling Techniques and Sample Size
Multi-stage sampling technique was used in the selection of the respondents for the study. The
first stage involves the random selection of 21 rural communities in the council. The second
stage was the random selection of five households per community for administration of
questionnaires and interview. The questionnaire was well-structured with close ended questions.
Some identified rural credit associations including money lenders were interviewed. These were
complemented with review of records from annual reports and accounts of the Micro-Finance
Banks in the area.
METHODS OF DATA ANALYSIS
In line with the work of Eboh (2011) Foster Greer and Thorbecke (FGT) and Logit regression
methods were employed in the analysis of the data. Descriptive statistics (frequency tables and
percentages) were used in describing socio-economic characteristics of sampled households,

International Journal of Business and Management Review
Vol.2.No.1, pp.27-51, March 2014
Published by European Centre for Research Training and Development UK (www.ea-journals.org)
36
including their credit participation, credit request, amount granted, interest rate and loan duration
of credit used (if any).
The standard Foster Greer and Thorbecke (FGT) poverty index was used in assessing the
incidence, depth and severity of poverty among the selected households. The FGT class of
poverty measures is defined by:
q
i
i
Z
YZ
NP
1
1
Where:
= non-negative parameter (0, 1 or 2) reflecting social valuation of different degree
of poverty. It takes on a value of 0 for poverty incidence, 1 for poverty depth, and
2 for severity of poverty.
Yi = per capita expenditure (N/person/day)
q = number of households with per capita consumption below the United Nations
recommended income; defined US$2 per person per day which was equivalent to
N320 per person per day (US$1 = N160) at the time of the survey.
Z = The poverty line (N320 per person per day); and
N = number of households in the sample
Logit Regression Method: this is used to determine the influence of independent variable on the
probability of being poor. The dependent variable is the poverty status which is represented with
a binary dummy (0 and 1).
Y= F(X1, X2, X3.....Xn)
Y=poverty status, (1 if poor and 0 if non-poor)
X1.......Xn are: age(years), age², gender(female=1, male=0), education(years), household
system(number), dependency ratio, credit use(yes=1, no=0), credit volume(₦), other jobs(₦).
Furthermore, the Spearman Ranking Order Correlation was used to estimate the formulated
hypothesis. The choice of this statistical technique is predicated by the fact that Spearman
Ranking Order Correlation is a non-parametric statistics that is used when condition for the use
of parametric statistics cannot be guaranteed (Vincent et al., 2008). Since the study used the
structured likert scaling questionnaire for data collection, the Spearman Ranking Order
Correlation is considered most appropriate, because it is used more precisely when any one of
the two variables to be correlated is expressed in ordinal scaling form. To test for the robustness
of the Spearman Ranking Order Correlation, Pearson Correlation, One sample T-Test and One
way ANOVA (Analysis of Variance) were employed.

International Journal of Business and Management Review
Vol.2.No.1, pp.27-51, March 2014
Published by European Centre for Research Training and Development UK (www.ea-journals.org)
37
RESULTS AND DISCUSSION
Insert Table 4.1 here
Table 4.1 – Profile of the Individual Respondents
Table 4.1 shows the personal characteristics of the respondents. These individual characteristics
were considered relevant for the purpose of the study. For instance, age is a crucial factor in
farming. The younger the person, the more productive he is expected to be, all other things
being equal. A young vibrant farmer will also be expected to generate greater income, all other
things also being equal. As can be gleaned from the table, 38 of the respondents or 36.2 percent
of the total respondents are above 60 years of age. Put together, those that are of working age,
which is between 18 – 60 years, are 63 or 60 percent of the total respondents. In other words, 60
percent of the rural household in the sample are still active in farming activities.
Again, it could be seen that 75, or 71.4 percent of the respondents were males and 30, or 28.6
percent are females. The sex distribution of the rural household could have an implication on
the level of income that comes into the household. Households headed by a male could have an
advantage over those households headed by a female with respect to the crop farm income
portion of the total income. The findings of the study further reveals that majority (74.3 percent)
of the rural household heads are married with 18.1 percent of them being widowed. The marital
status of the rural household head could have a direct relationship on the size of the household.
Moreover, the level of education of the heads of rural households is of importance to the study.
It could be seen from the table that the highest level of education attained by rural household
heads is secondary school education with majority (53.3 percent) of them having various levels
of formal education attainment. Of these (53.5 percent), 14.4 percent have adult education, 9.5
percent were unable to complete primary education and 17.1 percent completed primary
education. 12.4 percent on the other hand had incomplete secondary education and 13.3 percent
had completed secondary education.
The result shows that majority of the respondents have one form of formal education or the other
and this has implication on their understanding of credit availability, access and impact on their
livelihood.
Insert Table 4.1.2 here
Table 4.1.2 – Profile of Household Respondents
Table 4.1.2 shows the household characteristics of the respondents. These household
characteristics were also considered relevant for the purpose of the study. From the table, it
could be seen that majority of the respondents are Christians while 23, or 21.9 percent of them
were traditionalists. There is no Muslim living in the sample area. Again, majority (45 or 42.9
%) of the sample rural household have a household size 1 – 3, while the least percentage was 19
percent which accounts for a household size of above six.
Moreover, the study revealed the total income of the rural household from both farm and non-
farming activities. As can be seen from the table, the result showed that approximately 60 per
cent of the rural household earned an income of between N25,000 to N60,000 from their farming

International Journal of Business and Management Review
Vol.2.No.1, pp.27-51, March 2014
Published by European Centre for Research Training and Development UK (www.ea-journals.org)
38
activities while approximately 7 percent of the household respondents earned income of above
N100,000 from their farming activities. The study showed that about 67.6 percent of the rural
households are not engaged in non-farm activities, about 16.2% earned at most ₦25,000 from
their non-farm activities, while 6.7 percent earned between N26,000 to N60,000 from their non-
farming activities and 3.8 percent earned above N100,000 from their non-farming activities. The
implication is that majority of the respondents depend solely on their farming activities for their
means of livelihood.
Furthermore, the study shows that 68.6 percent of the respondents are not engaged in secondary
occupation, while 7.6 percent have hunting, fishing and wine tapping respectively as their
secondary occupation. 14.3 percent of the respondents are engaged in trading business while 9.5
percent of the respondents are engaged in other forms of business.
Insert Table 4.1.3 here
Table 4.1.3 - Sources of Micro-Finance
This is one of the major objectives of the study; which is to determine the sources of microcredit
and the level of access of rural households to the microcredit. This was aimed at evaluating the
impact of the micro-credit on the poverty status of rural farm households in the study area. As
can been from the table, rural farm households have access to micro-credit from both formal and
informal sources. As can be seen from the table 45.7% of the household in the sample areas did
not use any form of microcredit, 23.8 percent accessed microcredit from informal sources like
money lenders, friends or relatives while 14.3 percent accessed microcredit from cooperative
societies. Finally, 16.2 percent accessed microcredit from the formal microfinance institutions
and banks.
Insert Table 4.1.4 here
Table 4.1.4 - Level of Access of Household Heads to Microcredit
The essence of this inquiry was to determine the major sources of microcredit to the rural
households. As could be seen from table 4.1.4, on the aggregate, formal sources in the form of
cooperative societies and microfinance institutions/banks provided the bulk of microcredit to
rural farm households, while 23.8% of the sampled rural farm household accessed microcredit
from informal sources. The implication is that formal sources of microcredit are gaining
prominence in microcredit delivery in the rural areas.
However, the study shows that the respondents that accessed credit from the formal sources
encountered some impediments in terms of not been able to access fully the loan amount
requested. By way of comparison, for the informal sources, the average amount granted was
₦10,120.55compared to the average loan request of ₦14,105.72. The odd on this source is at
0.17. For the formal source (cooperative societies), the average amount granted was ₦22,098.10
compared with the average loan request of N23,052.10; and for microfinance institutions/banks,
the average amount granted was N23,987.56 for average loan request of N25,142.00. The
constraint level for this source is 0.04.
Moreover, the average loan duration within which rural farm household accessing the informal
sources had to refund the money borrowed was approximately 3 months while for those

International Journal of Business and Management Review
Vol.2.No.1, pp.27-51, March 2014
Published by European Centre for Research Training and Development UK (www.ea-journals.org)
39
accessing credit in the formal sources, the average loan duration is approximately 6 months for
co-operative societies and 9 months for microfinance institutions/banks respectively.
Insert Table 4.1.5 here
Table 4.1.5 - Incidence, Depth and Severity of Poverty To ascertain the level and severity of poverty on the rural household sampled, the study adopted
the expenditure approach. That is by aggregating the total expenditure on food and non-food
items by rural households. To achieve this, the households were divided into two broad
categories – those that used credit and those that did not. From the result in table 4.1.5, it could
be seen that rural farm households that had access to credit had higher total expenditure (food
and non-food). Again, the per capita expenditure was estimated for both farm households that
had access to credit and those that did not. This was derived by dividing the total expenditure of
farm households by the total size of the farm household. The per capita income is affected by
both the total expenditure and the size of the household such that the higher the household size,
the lower the per capita expenditure and vice versa, all other things being equal. From the table
also, it could be seen that per capita expenditure incurred by rural farm households using credit
was higher than that by farm households not using credit.
The per capita expenditure reported for rural farm households not using credit was ₦1,476.19 per
week while the rural farm household using credit ₦1,898.23 per week. This translates into an
average of ₦210.88 per day per head for rural farm household not using credit and ₦271.17 per
day per head for rural household using credit. Moreover, the table 4.1.5 shows that the incidence
of poverty is higher in farm households not using credit (0.75) when compared with farm
households using credit (0.52). This observation was further strengthened by the values reported
for depth and severity of poverty in the two categories of the rural farm households in the study
area.
From the analysis of the data in table 4.1.5, the average per capita expenditure for an average
person in the rural household was N210.88 and N271.17 for those who do not use credit and
those who use credit respectively. If these figures are compared with the US$2/ ($1 = N160 =
N320) per day recommended by the World Bank (2012), it means that majority of the
respondents are living below the poverty line and the implication is that the quantum of micro-
credit accessed by rural farm households is not sufficient yet in meeting up with the expenditure
level that is enough to enable them live above the poverty line.
Insert Table 4.1.6 here
Table 4.1.6 - Influence of Access to Microcredit on Poverty Status
Table 4.1.6 is a summary of logit regression statistics based on a model that incorporates
variables that could influence the likelihood of a household being classified as poor or non poor.
These variables include; age, age square, gender, education, household size, dependency ratio,
credit use, credit volume and secondary job.
Based on the new recommendation of the World Bank, a rural household is either poor or non-
poor based on a poverty line index of $2/day. Thus, the value of the per capita expenditure of $2

International Journal of Business and Management Review
Vol.2.No.1, pp.27-51, March 2014
Published by European Centre for Research Training and Development UK (www.ea-journals.org)
40
per day per person is the value below which any household is classified as being extremely poor
while rural farm households above the value are classified as not extremely poor (World Bank,
2012).
The likelihood of a household being classified as poor or non-poor is dependent on certain
explanatory variables one of which is access to credit amongst others. The logit model was used
to determine the influence of a number of socio-economic variables on the likelihood of a
household being poor or non-poor. A likelihood ratio test of overall significance of the logit
model gave a calculated chi-square value of -114.345, which was significant at p<0.01. This
shows that explanatory variables in the estimated logit model significantly explain the likelihood
of a respondent being poor based on expenditure framework. The estimated percentage correct
prediction was 81.3%, which shows that the model predictions are correct in 81.3% of the cases,
and hence is reliable.
Among the explanatory variables in the model, age of rural farm household heads, square of the
age, and household size were significant at 1% (p<0.01) level, educational level of the head of
rural household and volume of credit granted were significant at 5% (p<0.05), while the dummy
variable on credit use was significant at 10% (p<0.10). Gender of head of rural household,
dependency ratio and secondary occupation were not significant.
Moreover, as shown in Table 4.1.6, the likelihood of being poor rises significantly initially with
age but decline in later years. Increase in household size and quantum of credit use increase the
likelihood of not being poor, while credit users are more likely to be live above the poverty line
than their counterpart that did not use credit.
The result shows that increasing the level of education of the head of rural farm household raises
the odds against the household being poor by 0.878 i.e educated rural farm household heads
tends to be non-poor. The result further showed that increase in the dependency ratio and
quantum of credit accessed by rural farm household lowers the odds of the household of being
poor. This result is in tandem with a priori and policy expectation which suggests that access to
credit and increase in the quantum of credit accessed should lower the odds of the household of
being poor.
Test of Hypothesis
To test the hypothesis, we restate the hypothesis below:
Ho: Micro-credit has no positive and significant impact on poverty alleviation on the rural
households
Hi: Micro-credit has positive and significant impact on poverty alleviation on the rural
households
Insert Table 4.2.1 here
Table 4.2.1 - Summary of Spearman Ranking Order Correlation Result
The Spearman result in table 4.2.1 showed that the co-efficient of micro-credit is positive but not
significant in explaining poverty alleviation of rural households. Based on this, the null

International Journal of Business and Management Review
Vol.2.No.1, pp.27-51, March 2014
Published by European Centre for Research Training and Development UK (www.ea-journals.org)
41
hypothesis is rejected and the conclusion is that micro-credit has positive but non-significant
impact on poverty alleviation of rural households in Nigeria (for details of the Spearman
Ranking Order Correlation Result, see appendix 4.2.2).
Robustness Test
To eliminate any bias the Spearman Ranking Order Correlation technique may have introduced
in the result, additional estimation techniques were employed as test of robustness. The results
are presented below.
Insert Table 4.3.1 here
Table 4.3.1 presents the robustness test. The results are consistent with the Spearman Ranking
Order Correlation and support the hypothesis that micro-credit has positive impact on poverty
alleviation of rural households in Nigeria. For instance, the Pearson correlation showed that the
coefficient of micro-credit is positive in explaining poverty alleviation in rural households in
Nigeria (see appendix 4.3.2 for details of result).
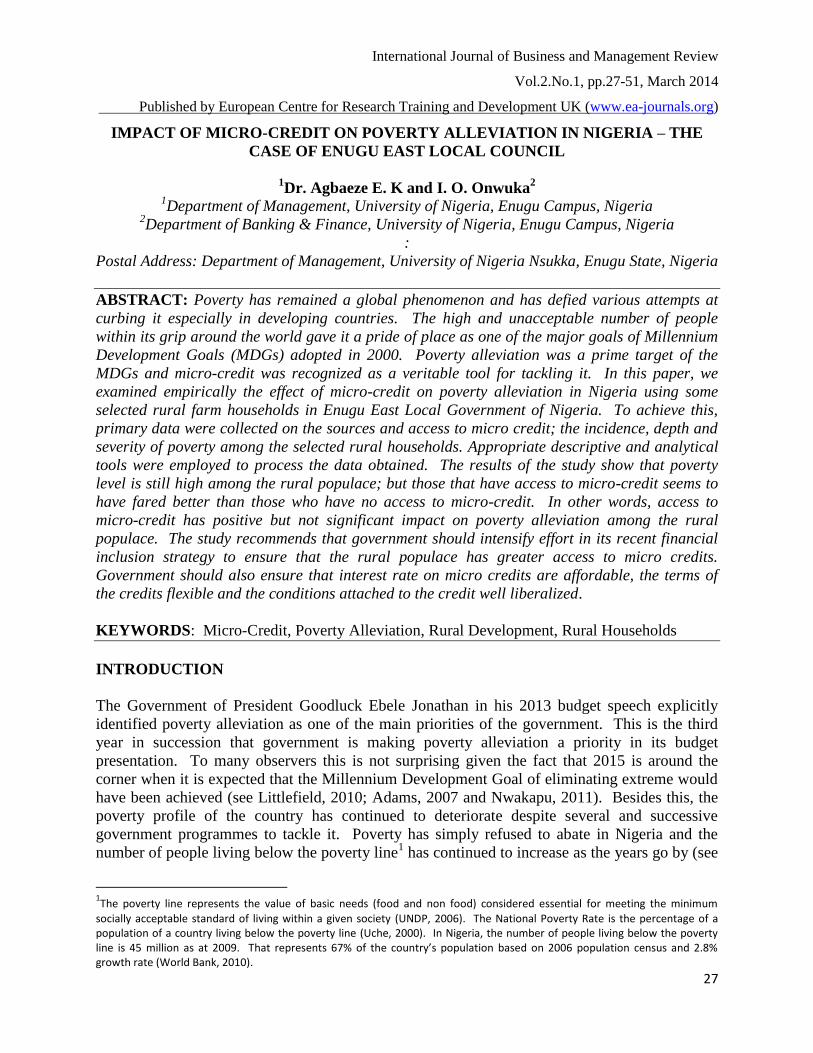
Also, with a calculated t-test value of 2.664 and sig. (2-tailed) value of 0.000 (for the One-
Sample T-Test) which is greater than the critical t-value of 1.96, the null hypothesis was rejected
(see appendix 4.3.3 for result details). This earlier results was also supported by the F- value of
4.345 with significant value of 0.000 for the One-Way ANOVA (see appendix 4.3.4 for details)
which rejects the null hypothesis that micro-credit has no significant and positive impact on
poverty alleviation of rural households in Nigeria.
CONTRIBUTION OF THE STUDY AND RECOMMENDATION
The study has added to the existing literature on micro credit by demonstrating empirically that
micro-credit is crucial for poverty alleviation in the rural areas. The study also shows that the
quantum of micro-credit available to rural dwellers is still not enough to lift them out of poverty
line and that the full impact potentials of micro-credit institutions/banks are yet to be fully
realized in Nigeria. To enhance the impact potentials of micro-finance institutions/banks
towards poverty alleviation in the rural areas, the following recommendations are made:
a. The government should intensify its effort to promote stable macroeconomic
environment. A stable macroeconomic is crucial for any meaningful development. It is
the sub-structure upon which the super-structure of all other developments is built. The
renewed interest in micro-financing which have culminated in the re-engineering of
micro-finance institutions in Nigeria and other strategies enunciated in the Micro-Finance
Institutions Policy Framework will ultimately come to naught if macroeconomic stability
is not vigorously pursued and enthroned in the country.
b. Micro-finance Banks are self-financing and sustaining institution. It is important that
government should not renege in any of the promises packaged in the Micro-Finance
Policy Framework. In particular, it is not enough to set up Micro-finance fund from the
defunct Small and Medium Enterprises Equity Investment Fund (SMEIES); it is more
important to ensure that all the bottlenecks that made it difficult for the intended
beneficiaries to access the fund are removed to ensure easy access to the new fund by the
Micro-Finance Banks for on-lending to rural beneficiaries.

International Journal of Business and Management Review
Vol.2.No.1, pp.27-51, March 2014
Published by European Centre for Research Training and Development UK (www.ea-journals.org)
42
c. A cursory look at the loans and advances profile of Micro-Finance Banks disaggregated
shows a lopsided trend whereby the commercial sector was the preferred sector contrary
to policy expectation. This is an indication of direct trading by these institutions contrary
to their expected roles, which essentially, is to serve as veritable channel for rural credit
intermediation and delivery. Therefore, government should ensure through effective
regulation and supervision that Micro-Finance Banks are prohibited from turning
themselves into agents of buying and selling. Policy expectation is that Micro-Finance
Banks should mobilize deposits and lend generally to agricultural and industrial sectors to
develop the rural economy and not to engage in buying and selling and other rent-seeking
behaviours.
d. Another ugly trend that government needs to check is disintermediation and conduit
piping. This is where Micro-Finance Banks mobilize savings from the rural areas and
place such funds as deposits in commercial banks. In other words, using their
institutions as conduit pipes for generating deposits from rural areas for urban
commercial banks. The study shows that credit per rural person was generally low
which is attributable to this trend. As suggested by Owoh (2007), government could
make it a statutory requirement for Micro-Finance Banks to disclose their placements in
commercial banks with such other information as the accounts, the tenures of such
placements, etc. This could help check the ugly tendency of MFBs serving as agents of
deposit mobilization for commercial banks. If the trend is effectively checked, the
quantum of credit available for rural development will be enhanced.
e. The level of deposit mobilization by the Micro-Finance Banks vis-à-vis the currency in
circulation outside the banking system is still low. One of the cardinal objectives for the
establishment of Micro-Finance Banks is to mobilize funds erstwhile outside the
banking system but the reality on ground is that this has not been substantially achieved.
Therefore, serious efforts should be made by Micro-Finance Banks to improve their rate
of deposit mobilization. They should work out innovative ways of attracting more
deposits, perhaps, through product development that offer special appeal to rural
dwellers and others that are largely un-served by the conventional banks. They should
carve a niche for themselves by selecting the huge un-served segment of the financial
market instead of competing with conventional banks on areas they (ie. MFBs) lack
competence.
f. There should be enlightenment in the rural areas to sensitize them on the need to have
fewer families. The fewer the family, the higher the family standard of living, all other
things being equal. The study shows that families with fewer mouths to feed seem to
have fared better than larger families.
g. Government should ensure that social amenities are provided in the rural areas to make
life more meaningful and to halt the upsurge in rural urban migration especially by the
younger generation. If social amenities like pipe borne water, electricity, etc are
provided in the rural areas, more people will be willing to stay back at the countryside
and engage in farming activities instead of migrating to urban areas in search of non-
existent white-collar jobs.

International Journal of Business and Management Review
Vol.2.No.1, pp.27-51, March 2014
Published by European Centre for Research Training and Development UK (www.ea-journals.org)
43
REFERENCES
Adam, G. (2007) “Role of Microfinance in Actualization MDGs” in Paper Delivered at the
Induction Ceremony of Institute of Chartered Economists of Nigeria, Port Harcourt,
Rivers State Nigeria.
Adewunmi V. (2006) “Challenges and Strategies for Effective Rural Finance Intermediation
through Micro-Finance Banks” Report of CBN/AFRICAN Rural Agricultural Credit
Association Workshop, 12th
– 16th
May; Abuja.
Adegboye, S. (1982). Institutional Reforms for Efficient Microcredit Delivery in
Nigeria. Central Bank of Nigeria Bullion, 32 (1): 26-34.
Amin, S. (2003) “Does Microcredit Reach the Poor and Vulnerable? Evidence from Northern
Bangladesh”, Journal of Development Economics, 70(1), 59-82.
Anyanwu, C. M. (2004) “Microfinance Institutions in Nigeria: Policy, Practice and Potential”,
Central Bank of Nigeria Research Paper
Ardener, S. G. (1953) “The Social and Economic Significance of the Contribution Club Among
a Section of the Southern Ibo” West African Institute of Social and Economic Research,
Annual Conference – Sociology Section, Ibadan, University College
Ayeyomi, O. E. (2003) An Assessment of Poverty Reduction Strategies in Nigeria (1983 –
2002), An unpublished Dissertation submitted for award of Doctor of Philosophy of the
St. Clement University.
Bamisele, S. (2011) “Microfinance – A Tool for Rural Development” Paper Delivered At a
Seminar for Small and Medium Scale Enterprises (SMEs) organized by SMELDA, pp. 2
– 4.
Bashiru, M.A and Zubair, H. (2008) “Microfinance in Nigeria and the Prospect of Introducing its
Islamic Version in the light of Selected Muslim Countries’ Experience”, Munich
Personal REPEC Archive Paper No. 8287.
Bascom, W. R. (1952) “The Esusu: A Credit Institution of the Yoruba” Journal of the Royal
Anthropological Institute, London, 82. Pp 63 – 69.
Brubarer, K. P. (2003) “Wealth Creation, Poverty Reduction and Social Justice – A World
Council of Churches Perspectives”, Paper on Conference on Religion and Globalization,
Chiang Mau, Thailand, July – August.
Chandker, S. (1998) Fighting Poverty through Microcredit. Dhaka, Bangladesh: University
Press Limited
Chandker, S. (2005) “Microcredit and Poverty: Evidence Using Panel Data from Bangladesh”,
World Bank Economic Review, Vol. 32, No. 6.
Central Bank of Nigeria (1998) “Nigerian Financial System in Perspective” Economic Review,
CBN, March/April, 1998, pp. 10 – 15.
Central Bank of Nigeria (1999) “Nigeria Development Prospects, Poverty Assessment and
Alleviation” Research Paper on Study Conducted in Collaboration with the World Bank,
Lagos, Government Press.
Central Bank of Nigeria (2001), Annual Reports and Statements of Accounts for the Year ended
31st December 2001, (Nigeria: CBN, 2001).
Central Bank of Nigeria, (2002) “Impact of Structural Adjustment Program on Nigerian
Agriculture and Rural Life,” CBN/NISER Publication, (Nigeria/NISER, 1992)
Central Bank of Nigeria (2003) “National Statistics of Socio-economic profile of Nigeria (1997 -
1999)”, CBN Statistical Bulletin, CBN Hqr Abuja.

International Journal of Business and Management Review
Vol.2.No.1, pp.27-51, March 2014
Published by European Centre for Research Training and Development UK (www.ea-journals.org)
44
Central Bank of Nigeria (2004) “Assessment of Community Banks” Report No 04/031 IC-NIR,
Food and Agricultural Organization, pp. 10 – 16.
Central Bank of Nigeria (2005) Microfinance Policy Framework, Abuja: Government Printing
Press.
Central Bank of Nigeria (2006) An Assessment of Microfinance Banks and Institutions in
Nigeria, Abuja; Government Printing Press
Central Bank of Nigeria (2011) Review of Microfinance Policy Framework, Abuja: Government
Printing Press
Desai and Mellor (1972) “Institutional Finance for Agricultural Development: An Analytical
Survey of Critical Issues” Food Policy Review I, International Food Policy Research
Institute, pp. 28 – 30.
Eboh, E. (2011) Statistics of Social Sciences, Enugu, Fourth Dimensions Publishers.
Eadgerwood, J. (1999) “Sustainable Banking for the Poor Project in South Asia”, World Bank
Economic Review.
Egwuatu, B.S.C. (2008). Reducing Poverty Through Better Credit Delivery. The Microfinance
Schism, 34(2): 28-41
Green, Margaret M. (1964) Ibo Village Affairs. New York: Praeger Publishers.
Foster, J., Greer J. and Thorbecke E. (1984) A Class of Decomposable Poverty Measures.
Econometrica, 52, (3): 761-766.
Ijere, M.O. (1982) New Perspectives in Financing Nigerian Agriculture, Enugu: Fourth
Dimension Publishers.
Ijere, M. O. (1992) Leading Issues in Rural Development, Enugu: Acena Publishers.
Isong, C. N. (1964) “Modernisation of the Esusu Credit Society” Excerpts from NISER
Conference Proceedings. Ibadan, University of Ibadan.
Landes, D.S. (2010) The Wealth And Poverty Of Nations – Why Some Are So Rich And Some
Are So Poor, New York: Norton
Littlefield, J., Moth, S. and Vernimi, T. (2005) “Is Microfinance an Effective Strategy to Reach
the Millennium Development Goals”, Research Paper of Consultative Group to Assist
the Poor, Washington D.C.
Mabogunje, A. L. (1991) Understanding Community Bank Operations, Abuja: NBCB Press.
Mabogunje, A. L. (1994) Appraisal Manual for Operations Staff of National Board for
Community Banks, Abuja: NBCB Press.
Mokezie, C.I. (2003), “The National Banking System: Historical Perspective” in Nigeria
Journal of Banking & Finance, Vol. 3, No.6
Mohammend, Y. (1998) “Poverty Alleviation: Is Economics Any Help? Lessons from the
Grameen Bank Experience”, Journal of International Affairs, Vol. 52, pp 47-65
National Population Commission (2010) “Nigerian Population Growth Estimates” in Census
Bulletin, published by National Population Commission, Abuja
Nwakapu, A. A. (2002), “Reflection on the Possibilities of Reduction in Poverty in the Context
of Economic Growth and Underdevelopment, Democracy and Good Governance”,
Development Policy Management and Network Bulletin, Vol. IX, No. 1, pp 36-40
Nwobi, N. C. (2006) Microfinance and Poverty Alleviation in Nigeria – Case Study of Obazu
Progressive Women Association, Mbieri, Imo State, Uppsala: Department of Economics.
Odu, V. (2006) “Challenges and Strategies for Effective Rural Finance Intermediation through
Community Banks” Report of NBCB/AFRICAN Rural Agricultural Credit Association
Workshop, held in Zodiac Hotel, Enugu, 12th
– 16th
May; Abuja: NBCB Press,

International Journal of Business and Management Review
Vol.2.No.1, pp.27-51, March 2014
Published by European Centre for Research Training and Development UK (www.ea-journals.org)
45
Okafor, F. O. (1997) “Enhancing the Impact Possibility of Community Banks” Paper
Presented at Annual Conference for Community Banks Directors held at Modotels,
Enugu, December 18 – 19, pp. 5 – 8.
Okafor, F. O. (1999) “Investment Opportunities Available to Community Banks” Paper
Presented at a Seminar on Improving the Profitability of Community Banks in the Next
Millennium organized by Citizen Bank Limited, Enugu, November 6, pp. 12 – 14.
Okonny, I. G. P. (1994) “Rural Development: Options Open to Community Banks” A paper
presented at 3rd
Anniversary Conference of Community Banks held at Durbar
Hotel, Kaduna, pp. 34 – 36.
Okorie, F. A. & Miller, L. F. (1976) “Esusu Clubs and their Performance in Mobilizing Rural
Savings and Extending Credit” Technical Report AETR/76-1, Ibadan, University,
Department of Agricultural Economics, pp. 76 – 77.
Okorie , T. (2006) “Micro-credit and Rural Development in Nigeria”, Economic Development
and Culture Change, New York: Praeger Publishers.
Olashore, O. (2009) “Rural Banking: Strategies and Policies of Government and Central Bank”
CBN Bullion, 20th
Edition, July, pp. 24 – 25.
Olatunbosun, K. (1975) “Micro-credit and Rural Development in Nigeria”, Economic
Development and Culture Change, New York: Praeger Publishers.
Ottenberg, S. (1968) “The Development of Credit Associations in the Economy of the Afikpo-
Ibo” Africa 38 pp 237 – 252.
Owo, F. A. (2007), “Microfinance Banks and their Performance in Mobilizing Rural Savings and
Extending Credit” Technical Report AETR/76-1, Ibadan, University, Department of
Agricultural Economics, pp. 76 – 77.
Ragazzi, C. (2001) “Rural Development Indices in Nigeria: Facts Behind the Figures” Paper
Presented at the Economic Seminar organized by Economics Department University of
Lagos, Akoka, Lagos, August 20 – 22, pp. 16 – 20.
Sadeque, J. K (2010) “Rural Finance in Nigeria” The American Journal of Economics, Vol. 10,
No. 17, Washington D.C., pp. 32 – 34.
Sagbamah, J.E.L. (1997) “Community Banking: The Nigerian Experience” in CBN Bullion, Vol.
2, April – June, pp. 28 – 32.
Seibel, H. D. (1967) “Indigenous Economic Corporation And Its Developmental Function in
Liberia” Co-operative Information (ILO, Geneva) 46; pp 53 - 57
Soludo, C. (2001) “Performance Appraisal of Rural Banking Scheme” Seminar Paper Delivered
at University of Benin, Edo State, pp. 18 – 21.
Soludo, C. (2005) “Re-Thinking Micro-Financing Institutions in Nigeria” in CBN Bullion, Vol.
9, July – November, pp. 20-26.
Soludo, C. (2006) “Understanding Micro-finance Policy” in the Guardian Newspaper Tuesday,
May 1, pp. 25 – 27.
Uche, C. U. (2000) “Poverty Alleviation Programmes in Nigeria: Past, Present and Future”,
Nigeria Journal of Banking and Finance, UNEC Publication, Issue No. 3, pp 1-24.
Ukpong, G.E.D. (1998) “Rural Finance Policy: Framework and Practice in Nigeria” CBN
Bullion, Vol. 22, No. 2, April – June.
Umoh, O. (1984) “Rural Banking Practice in Nigeria” Business Times, February 6, Page 14.
United Nations Development Programme (2006) Human Development Indices, New York:
Oxford University Press.

International Journal of Business and Management Review
Vol.2.No.1, pp.27-51, March 2014
Published by European Centre for Research Training and Development UK (www.ea-journals.org)
46
Uzor, E. (2011) “Poverty Alleviation Programmes in Nigeria – Prospects and Challenges”,
Zenith Economic Quarterly, Vol. 6, No. 3
Tanko, S. K. (2007) “Profits and Profitability of Indian Commercial Banks in Seventies”
Bombay: National Institute of Bank Management, pp. 24 – 25.
Vincent, O.M., Olaegbe, B.A. and Sobona, A.L. (2008), Fundamentals of Business Research,
Lagos: Olas Ventures
Virmani, A. (1984) “Evaluation of Financial Policy: Credit Allocation in Bangladesh”, World
Bank Staff Working Paper No. 672, Washington, D.C., World Bank
World Bank (1999) “Doing Business 2000: Reforming through difficult times” The World Bank.
World Bank (2000) World Development Report 2000: Poverty. Oxford: Oxford University.
World Bank (2003) Poverty Reduction Handbook, The World Bank, Washington, D.C.
World Bank (2004) “Agriculture for Development”, World Development Report. Washington:
World Bank.
APPENDICES
Table 4.1 – Profile of Respondents
Variable Frequency Percentage
Age of Respondents
18-30 5 4.8
31-40 15 14.3
41-50 18 17.1
51-60 29 27.6
>60 38 36.2
Total 105 100
Sex of Respondents
Male 75 71.4
Female 30 28.6
Total 105 100
Marital Status of Respondent
Single 3 2.9
Married 78 74.3
Divorced 1 0.09
Seperated 4 3.8
Widowed 19 18.1
Total 105 100
Educational Level of Respondents
None 35 33.3
Adult Literacy 15 14.4
Incomplete Primary 10 9.5
Complete Primary 18 17.1
Incomplete secondary 13 12.4
Complete Secondary 14 13.3
Total 105 100
Source: Field Survey, 2013

International Journal of Business and Management Review
Vol.2.No.1, pp.27-51, March 2014
Published by European Centre for Research Training and Development UK (www.ea-journals.org)
47
Table 4.1.2 – Profile of Household Respondents
Variables Frequency Percentage
Religion of the Respondents
Christianity 82 78.1
Traditional 23 21.9
Total 105 100
Household Size of the Respondents
1-3 45 42.9
4-6 40 38.1
Above 6 20 19.0
Total 105 100
Total Income
< N25,000 35 33.3
N26,000 – N60,000 62 59.1
N61,000 – N100,000 2 1.9
>N100,000 6 5.7
Total 105 100
Non-Farm Income
None 71 67.6
<N25,000 17 16.2
N26,000- N60,000 7 6.7
N61,000 – N100,000 4 3.8
> N100,000 6 5.7
Total 105 100
Secondary Occupation
None 72 68.6
Hunting/Fishing/Wine Tapping 8 7.6
Trading 15 14.3
Others 10 9.5
Total 70 100
Source: Field Survey, 2013
Table 4.1.3 – Sources of Micro-Credit
Sources Frequency Percent
Non-user 48 45.7
Informal source (Money Lenders, etc) 25 23.8
Cooperative society 15 14.3
Microfinance Institutions/Banks 17 16.2
Total 105 100
Source: Field Survey, 2013

International Journal of Business and Management Review
Vol.2.No.1, pp.27-51, March 2014
Published by European Centre for Research Training and Development UK (www.ea-journals.org)
48
Table 4.1.4 – Level of Access of Households to Micro-Credit
Variable Informal
Sources
Co-operative
Societies
Microfinance
Banks
Total
Credit Users 25 (23.8%) 15 (14.3%) 17 (16.2%) 57 (100%)
Loan Request
(Mean)
14,105.72 23,052.10 25,142.00 62,299.82
Standard Error 4,654.22 4,754.87 3,123.43 4,546.98
Amount Approved 10,120.55 22,098.12 23,987.56 19,234.02
Standard Error 2,765.66 3,871.49 3,276.17 3,045.77
Loan Duration
(Mean)
2.10 8.69 6.42 9.21
Standard Error 1.32 0.21 0.74 0.54
Interest Rate (Mean) NA 5.64 9.23 10.2
Standard Error NA 0.43 0.65 0.66
Source: Field Survey, 2013
Table 4.1.5 – Incidence, Depth and Severity of Poverty among Selected Rural Household
Expenditure (₦/wk) Did not use
credit
Std
Error
Used credit Std
Error
Total Std
Error
Total food expenditure 5,244.34
384.12
7,123.66
1,322.95
5,882.11 502.12
Non-food expenditure 1,654.22
352.50
1,734.65
433.32
2,056.32
254.89
Total expenditure 6,898.56
702.54
8,858.31 1,238.91
7,938.43 1,065.02
Per cap expenditure 1,476.19
134.89
1,898.23
182.98
1,543.66
142.76
Per cap
expenditure/day
210.88
0.11
271.17
0.14
195.36
0.10
Po (incidence) 0.75
0.07 0.52
0.05
0.60
0.04
P1 (depth) 0.28
0.14
0.25
0.03
0.26
0.02
P2 (severity) 0.17
0.03
0.11
0.02
0.12 0.01
Source: Computed from Field data

International Journal of Business and Management Review
Vol.2.No.1, pp.27-51, March 2014
Published by European Centre for Research Training and Development UK (www.ea-journals.org)
49
Table 4.1.6 – Influence of Access to Micro-Credit on Poverty Alleviation Variables B (coefficients) S.E. Odd-ratio
Age .412*** .160 1.542
Age square -.005*** .002 .996
Gender -.596 .517 .551
Education -.130 .066 .878
Household size .694*** .163 2.001
Dependency ratio .702 1.110 2.017
Used credit 1.035* .533 2.814
Quantum of Credit .000** .000 1.000
Secondary occupation .417 .509 1.517
Constant -13.143*** 4.102 .000
Log likelihood -114.345
Cox & Snell R square .373
Overall% prediction 81.3
Table 4.2.1 – Summary of Spearman Ranking Order Correlation
Variables Spearman’s rho Sig (2-tailed)
Poverty Alleviation of rural households 1.288 0.008
Source: SPSS Analytical Software
Appendix 4.2.2 Details of Spearman Ranking Order Correlation Results
Correlations
How would you rate
the impact of micro-
credit in poverty
alleviation in Nigeria
How would you rate
the impact of micro-
credit in poverty
alleviation in Nigeria
Spearman's rho How would you rate
the impact of micro-
credit in poverty
alleviation in Nigeria
Correlation
Coefficient 1.000 124(**)
Sig. (2-tailed) . .008
N 105 105
How would you rate
the impact of micro-
credit in poverty
alleviation in Nigeria.
Correlation
Coefficient 124(**) 1.000
Sig. (2-tailed) .008 .
N 105 105
** Correlation is significant at the 0.05 level (2-tailed).
Source: SPSS 10.0 Statistical Package

International Journal of Business and Management Review
Vol.2.No.1, pp.27-51, March 2014
Published by European Centre for Research Training and Development UK (www.ea-journals.org)
50
Table 4.3.1 - Summary of Pearson Correlation, One-Sample Test and One-Way ANOVA
Results
Estimation Tools Notations Poverty Alleviation
Pearson Correlation R 0.812
Sig (2 tailed) 0.021
One Sample T-Test T 2.664
Sig (2 tailed) 0.00
One Way ANOVA F 4.345
Sig (2 tailed) 0.00
Source: SPSS Statistical Software
Appendix 4.3.2 Details of Pearson Correlation Result
Correlations
How would you
rate the impact of
micro-credit in
poverty
alleviation in
Nigeria
How would
you rate the
impact of
micro-credit in
poverty
alleviation in
Nigeria
How would you
rate the impact of
micro-credit in
poverty alleviation
in Nigeria
Pearson Correlation
Sig. (2-tailed) .019
N 105 105
How would you
rate the impact of
micro-credit in
poverty alleviation
in Nigeria
Pearson Correlation
142(**) 1
Sig. (2-tailed) .019
N 105 105
** Correlation is significant at the 0.05 level (2-tailed).
International Journal of Business and Management Review
Vol.2.No.1, pp.27-51, March 2014
Published by European Centre for Research Training and Development UK (www.ea-journals.org)
51
Appendix 4.3.3 One-Sample T-Test Result
Test Value = 0
T Df Sig. (2-tailed)
Mean
Difference
95% Confidence
Interval of the
Difference
Lower Upper
Poverty
Alleviation 2.664 105 .000 1.76997 1.7109 1.8290
Source: SPSS 10.0 Analytical Software
Appendix 4.3.4 One-Way ANOVA Result
Poverty Alleviation
Sum of Squares Df Mean Square F Sig.
Between Groups 24.761 3 9.254 4.345 .000
Within Groups 250.155 105 1.449
Total 264.916 105
Source: SPSS 10.0 Analytical Software