Embed Size (px)
Citation preview

CaterpillarInc.(CAT)CompanyDescription:Caterpillar is the world’s leading manufacturer of construction andmining equipment, diesel and natural gas engines, industrial gasturbines,anddiesel‐electriclocomotives.Thecompanyalsoisaleadingservices provider through Caterpillar Financial Services, CaterpillarRemanufacturingServices,andProgressRailServices.InvestmentThesis:I believeU.S. and global economieswill continue to see slow growth.Coming out of a severely deep recession in combinationwith centralbanks exerting aggressivemonetary policy, this cyclemay stretchoutlonger than historic norms. Mining saleswill be down through 2014duetoadecreaseinmininginvestmentworldwide. Thiswillbeoffsetbyincreasedconstructionactivity.TherecoveringU.S.housingmarketshould provide a boost in construction as well as to the overall U.S.economy.Emergingmarketeconomicgrowthwillcontinuetooutpacedevelopedeconomies,expandingtheglobalmiddleclass.ChinaandtheAsia Pacific region provide the greatest growth opportunity for allsegmentsofCATbusiness.Wewillcontinuetoseemacro‐environmentvolatility in the near‐term. CAT stock price will likely remaininexpensive, yet volatile through the first quarter of 2013until FiscalCliffuncertaintyisresolvedandtheconstructionseasonbeginsagain.Risks: SlowingU.S.andglobalGDPgrowth WorseningofEuropeanSovereignDebtCrisis SlowdowninemergingmarketeconomiessuchasChina,India,and
Brazil EconomicVolatility Decreaseinminingindustryinvestmentintheshort‐term HighinventorylevelsOpportunities: ContinuedU.S.andglobalGDPgrowth Emerging markets (especially Asia‐Pacific) and an expanding
middleclass New technology demands as emissions standards and
environmentalregulationsareraised U.S.,Chinese,andotheremergingmarketconstructionintheshort‐
term Mininginthelong‐term U.S.housingmarket Domesticenergyproduction
FisherCollegeofBusinessEquityResearchNovember20,2012
Overweight–BUYCATPrice:$81.93PriceTarget:$103.00
IndustrialsMatthewJ.Anderson(614)940‐[email protected]‐MonthStockPerformance
_____________________________________________CompanyDataPrice: $81.93DateofPrice: 16Nov1252‐WeekRange($): 78.25–116.95MarketCap($bn): 53.58FiscalYearEnd: Dec31SharesO/S(mn): 669PriceTarget($): $103.00UpsidePotential: 26%Dividend&Yield 2.08(2.50%)_____________________________________________

MatthewJ.Anderson FisherCollegeofBusinessEquityResearch(614)940‐2290 November20,[email protected] CaterpillarInc.(CAT)‐BUY
1
TableofContents1.CompanyOverview.........................................................................................................................................................................2
a.MachineryandPowerSystems..................................................................................................................................................2
i.ConstructionIndustries............................................................................................................................................................2
ii.ResourceIndustries..................................................................................................................................................................2
iii.PowerIndustries......................................................................................................................................................................3
b.FinancialProducts..........................................................................................................................................................................3
c.DealersandDistributors..............................................................................................................................................................3
2.EconomicAnalysis...........................................................................................................................................................................4
3.IndustrialSectorAnalysis...........................................................................................................................................................4
4.CompanyAnalysis...........................................................................................................................................................................7
a.Strategy................................................................................................................................................................................................8
b.CompetitiveAnalysis.....................................................................................................................................................................8
c.CompetitiveLandscape.................................................................................................................................................................9
d.ThirdQuarterEarningsResults.............................................................................................................................................12
e.TrendAnalysis...............................................................................................................................................................................13
f.EquityValuation:ComparativeMultiples...........................................................................................................................15
i.AbsoluteValuation...................................................................................................................................................................15
ii.RelativeValuation:CATvs.S&P500,IndustrialSector,andMachineryIndustry.......................................15
5.SummaryandRecommendations.........................................................................................................................................16
6.Appendix............................................................................................................................................................................................17
a.IncomeStatementForecast.....................................................................................................................................................17
b.BusinessSegmentForecast......................................................................................................................................................18
c.DiscountedCashFlowsValuation..........................................................................................................................................19

MatthewJ.Anderson FisherCollegeofBusinessEquityResearch(614)940‐2290 November20,[email protected] CaterpillarInc.(CAT)‐BUY
2
1. CompanyOverview
Originally organized as Caterpillar Tractor Co. in 1925 in the State of California, the company wasreorganized as Caterpillar Inc. in 1986 in the State of Delaware. Caterpillar is the world’s leadingmanufacturer of construction and mining equipment, diesel and natural gas engines, industrial gasturbines, and diesel‐electric locomotives. The company also is a leading services provider throughCaterpillarFinancialServices,CaterpillarRemanufacturingServices,andProgressRailServices1.
a. MachineryandPowerSystems
i. ConstructionIndustriesConstruction industries products are primarily used in infrastructure and building constructionapplications. Much of the growth in the construction industries segment has occurred in developingcountries. Inmany instances, constructionmachinerysaleshavebeenatoraboverecord levels setpre‐recession. Saleshavealso increased indevelopedcountriesdrivenby theneed forexistingconstructionmachineryusersupgrading/replacingexistingmachinery.CAT’sconstructionmachineryinvestmentshaveprimarilybeenoccurringintheU.S.,Brazil,andAsiasinceclimbingoutoftherecession.
ConstructionIndustriesproductportfolioincludesthefollowingmachinesandrelatedparts:Backhoeloaders Miniexcavators Mediumwheelloaders
Smallwheelloaders Compactwheelloaders Mediumtrack‐typetractorsSmalltrack‐typetractors Selectworktools Track‐typeloaders
Skidsteerloaders Wheelexcavators MotorgradersMulti‐terrainloaders Small,mediumandlargetrack
excavatorsPipelayers
2ii. ResourceIndustries
Cat’sResources Industriessegmentprimarilysupportscustomersusingmachinery inminingandquarryapplications. Thissegmentalsoservesforestry,tunneling,andpavingcustomers. Recently in2010,CATacquiredBucyrus International, one of the largest undergroundminingmachinerymanufacturers in theworld.CATnowhasthebroadestlineofminingmachineryandequipmentofanycompanyglobally.CATisinvestingheavilyinitsminingmachinerybusinessintheU.S.andAsia.CAT’slargestglobalcompetitorinminingmachineryisJoyGlobal,thoughCAThasanumberofothercompetitorswithothermachinerytypesintheirResourcesIndustrysegment.JoyglobalhasasmallerlineofproductofferingsthanCAT.
1www.caterpillar.com22011Caterpillar10‐K
MatthewJ.Anderson FisherCollegeofBusinessEquityResearch(614)940‐2290 November20,[email protected] CaterpillarInc.(CAT)‐BUY
3
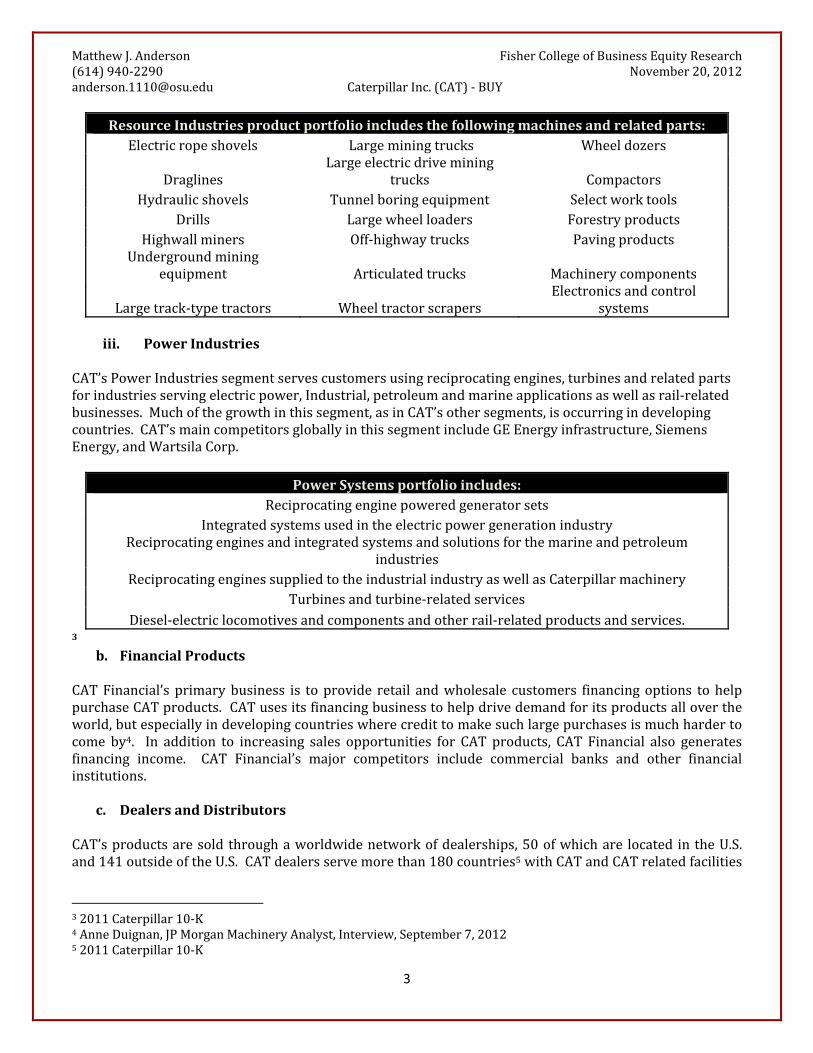
ResourceIndustriesproductportfolioincludesthefollowingmachinesandrelatedparts:Electricropeshovels Largeminingtrucks Wheeldozers
DraglinesLargeelectricdrivemining
trucks CompactorsHydraulicshovels Tunnelboringequipment Selectworktools
Drills Largewheelloaders ForestryproductsHighwallminers Off‐highwaytrucks Pavingproducts
Undergroundminingequipment Articulatedtrucks Machinerycomponents
Largetrack‐typetractors WheeltractorscrapersElectronicsandcontrol
systems
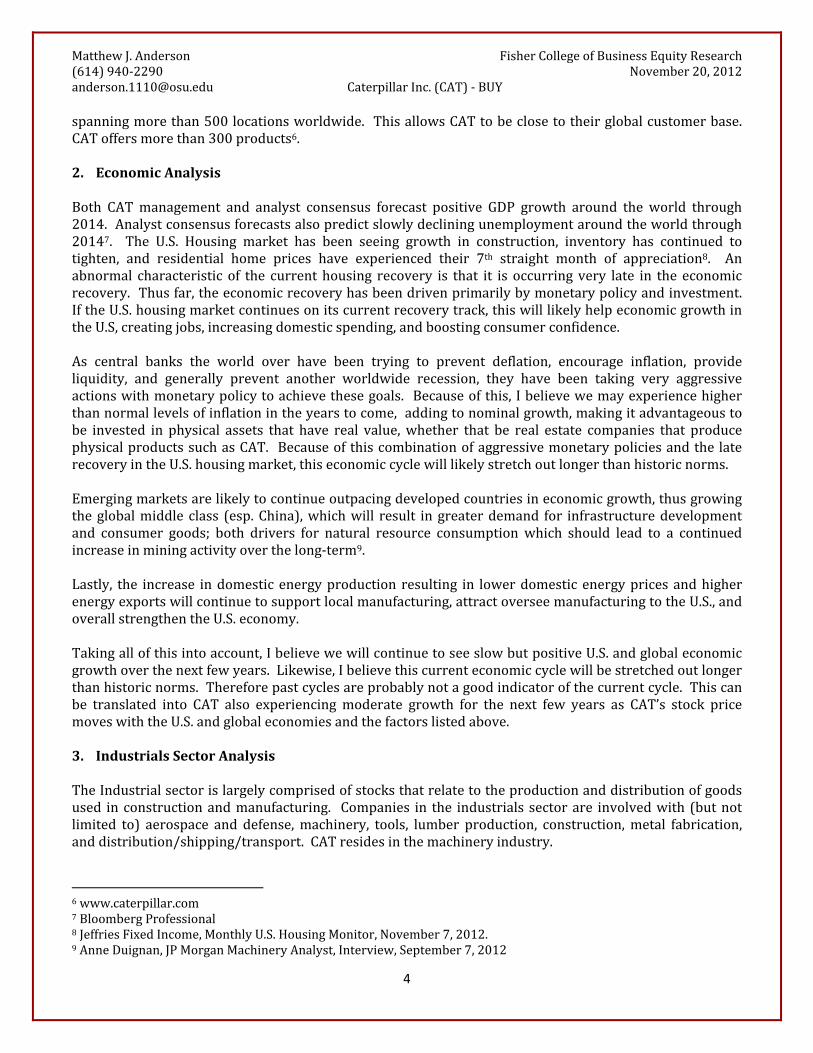
iii. PowerIndustries
CAT’sPowerIndustriessegmentservescustomersusingreciprocatingengines,turbinesandrelatedpartsforindustriesservingelectricpower,Industrial,petroleumandmarineapplicationsaswellasrail‐relatedbusinesses.Muchofthegrowthinthissegment,asinCAT’sothersegments,isoccurringindevelopingcountries.CAT’smaincompetitorsgloballyinthissegmentincludeGEEnergyinfrastructure,SiemensEnergy,andWartsilaCorp.
PowerSystemsportfolioincludes:Reciprocatingenginepoweredgeneratorsets
IntegratedsystemsusedintheelectricpowergenerationindustryReciprocatingenginesandintegratedsystemsandsolutionsforthemarineandpetroleum
industriesReciprocatingenginessuppliedtotheindustrialindustryaswellasCaterpillarmachinery
Turbinesandturbine‐relatedservicesDiesel‐electriclocomotivesandcomponentsandotherrail‐relatedproductsandservices.
3b. FinancialProducts
CATFinancial’s primarybusiness is toprovide retail andwholesale customers financingoptions tohelppurchaseCATproducts.CATusesitsfinancingbusinesstohelpdrivedemandforitsproductsallovertheworld,butespeciallyindevelopingcountrieswherecredittomakesuchlargepurchasesismuchhardertocome by4. In addition to increasing sales opportunities for CAT products, CAT Financial also generatesfinancing income. CAT Financial’s major competitors include commercial banks and other financialinstitutions.
c. DealersandDistributorsCAT’sproductsaresold throughaworldwidenetworkofdealerships,50ofwhichare located intheU.S.and141outsideoftheU.S.CATdealersservemorethan180countries5withCATandCATrelatedfacilities
32011Caterpillar10‐K4AnneDuignan,JPMorganMachineryAnalyst,Interview,September7,201252011Caterpillar10‐K
MatthewJ.Anderson FisherCollegeofBusinessEquityResearch(614)940‐2290 November20,[email protected] CaterpillarInc.(CAT)‐BUY
4
spanningmorethan500locationsworldwide. ThisallowsCATtobeclosetotheirglobalcustomerbase.CAToffersmorethan300products6.2. EconomicAnalysisBoth CATmanagement and analyst consensus forecast positive GDP growth around the world through2014.Analystconsensusforecastsalsopredictslowlydecliningunemploymentaroundtheworldthrough20147. The U.S. Housing market has been seeing growth in construction, inventory has continued totighten, and residential home prices have experienced their 7th straight month of appreciation8. Anabnormal characteristic of the currenthousing recovery is that it is occurring very late in the economicrecovery.Thusfar,theeconomicrecoveryhasbeendrivenprimarilybymonetarypolicyandinvestment.IftheU.S.housingmarketcontinuesonitscurrentrecoverytrack,thiswilllikelyhelpeconomicgrowthintheU.S,creatingjobs,increasingdomesticspending,andboostingconsumerconfidence.As central banks the world over have been trying to prevent deflation, encourage inflation, provideliquidity, and generally prevent another worldwide recession, they have been taking very aggressiveactionswithmonetarypolicytoachievethesegoals. Becauseofthis,Ibelievewemayexperiencehigherthannormallevelsofinflationintheyearstocome,addingtonominalgrowth,makingitadvantageoustobe invested in physical assets that have real value,whether that be real estate companies that producephysicalproductssuchasCAT. BecauseofthiscombinationofaggressivemonetarypoliciesandthelaterecoveryintheU.S.housingmarket,thiseconomiccyclewilllikelystretchoutlongerthanhistoricnorms.Emergingmarketsarelikelytocontinueoutpacingdevelopedcountriesineconomicgrowth,thusgrowingtheglobalmiddle class (esp.China),whichwill result ingreaterdemand for infrastructuredevelopmentand consumer goods; both drivers for natural resource consumptionwhich should lead to a continuedincreaseinminingactivityoverthelong‐term9.Lastly, the increase indomesticenergyproduction resulting in lowerdomesticenergypricesandhigherenergyexportswillcontinuetosupportlocalmanufacturing,attractoverseemanufacturingtotheU.S.,andoverallstrengthentheU.S.economy.Takingallofthisintoaccount,IbelievewewillcontinuetoseeslowbutpositiveU.S.andglobaleconomicgrowthoverthenextfewyears.Likewise,Ibelievethiscurrenteconomiccyclewillbestretchedoutlongerthanhistoricnorms.Thereforepastcyclesareprobablynotagoodindicatorofthecurrentcycle.Thiscanbe translated into CAT also experiencing moderate growth for the next few years as CAT’s stock pricemoveswiththeU.S.andglobaleconomiesandthefactorslistedabove.3. IndustrialsSectorAnalysis
TheIndustrialsectorislargelycomprisedofstocksthatrelatetotheproductionanddistributionofgoodsused inconstructionandmanufacturing. Companies in the industrials sectorare involvedwith (butnotlimited to) aerospace and defense,machinery, tools, lumber production, construction,metal fabrication,anddistribution/shipping/transport.CATresidesinthemachineryindustry.
6www.caterpillar.com7BloombergProfessional8JeffriesFixedIncome,MonthlyU.S.HousingMonitor,November7,2012.9AnneDuignan,JPMorganMachineryAnalyst,Interview,September7,2012

MatthewJ.Anderson FisherCollegeofBusinessEquityResearch(614)940‐2290 November20,[email protected] CaterpillarInc.(CAT)‐BUY
5
10Performanceintheindustrialssectorislargelydrivenbysupplyanddemandforbuildingconstructionandmanufacturedproducts11. As such, the industrial sector closely tracks theU.S. andglobal economies; itsperformance closely correlated to the S&P500. As explained in the EconomicAnalysis section above, Ibelievewewill continue to experience economic growth, albeit slow growth. Therefore, the industrialssectorshouldfairmoderatelywelloverthenext2‐3years. TheIndustrialssectorcurrentlyaccounts for10%ofS&P500,comprisedof62companies.TheIndustrialSector’stotalmarketcapis$1.311Trillion12.Withsuchadiversearrayof industrieswithin thesector, there’sagreatdealof flexibility increatinganinvestmentstrategydependingonwhereweareintheeconomiccycle.Subsequently,industrialcompanieshaveawiderangeofbetasandperformancepatternsrelativetoeconomiccycles.Based onhistorical data, the industrials sector should bemid‐cycle, approaching late cycle; however, asmentionedabove,aswecomeoutofaverydeepglobalrecessionwithcentralbanksbeingveryaggressivewithmonetarypolicy,thiscyclewilllikelystretchoutlongerthanthehistoricnorm.Instead,Ibelievewearestillapproachingmid‐cycle.
Two leading indicators of industrial sectorperformance,theArchitecturalBillingIndex(ABI),and the Purchasing Managers Index (PMI), arebothtrendingpositively.Thesearebothverygoodindicators for the direction of CAT’s performanceas CAT is a machinery manufacturer with a verylarge part of its business dependent on theconstruction industry. The ABI is a leadingindicator of construction activity. A score above50 indicates an increase in architectural billings.ConstructionactivitytypicallylagstheABIby9‐12months. For the last year andahalf, theABIhasbeen hovering just above or just below 50 asindicated in the ABI chart. With the two recentscoresjustabove50,thisindicatespositivethoughslowconstructiongrowthinthefuture13.ThePMIis an indicatorof thehealthof themanufacturingsector.Itisbasedonneworders,inventorylevels,production, supplier deliveries, and theemployment environment. Similar to the ABI, ascore above 50 indicates an expansion of the
102012Russel2000Index11www.investopedia.com12S&PDowJonesIndices.www.us.spindices.com/indices/equity/sp‐50013ArchitecturalBillingIndex,September2012
IndustrialsSectorAerospace&Defense IndustrialConglomerates AirFreight&CouriersBuildingProducts Machinery Airlines
ConstructionandEngineering TradingCompanies&Distributors MarineElectricalEquipment CommercialServices&Supplies Road&Rail
PurchasingManagersIndex(PMI)
ArchitecturalBillingIndex(ABI)
9/30/2012 51.5 9/30/2012 51.68/31/2012 49.6 8/31/2012 50.27/31/2012 49.8 7/31/2012 48.76/30/2012 49.7 6/30/2012 45.95/31/2012 53.5 5/31/2012 45.84/30/2012 54.8 4/30/2012 48.43/31/2012 53.4 3/31/2012 50.42/29/2012 52.4 2/29/2012 51.01/31/2012 54.1 1/31/2012 50.912/31/2011 53.1 12/31/2011 51.011/30/2011 52.2 11/30/2011 51.310/31/2011 51.8 10/31/2011 49.49/30/2011 52.5 9/30/2011 47.38/31/2011 52.5 8/31/2011 50.57/31/2011 51.4 7/31/2011 45.96/30/2011 55.8 6/30/2011 46.8

MatthewJ.Anderson FisherCollegeofBusinessEquityResearch(614)940‐2290 November20,[email protected] CaterpillarInc.(CAT)‐BUY
6
manufacturing sectorover thepriormonth. Excluding June, July, andAugustof2012, inwhich thePMIscorewasjustbelow50,thePMIindexhasbeenabove50forthelastyearandahalf14.IndustrialSector’sperformance:
IndustrialssectorreturnshavelaggedtheS&P500inaggregateovera5‐yearperiodaswellasforthelast12months;however,forthepast3‐yearperiod,theindustrialssectorhasoutperformedtheS&P500.TheindustrialssectorhasalsounderperformedtheS&P500year‐to‐date;however,recentlywiththepull‐backinglobaleconomies,theindustrialssectorhaslostlessthantheS&P500;arelativelypositiveindicationofinvestorsentimenttowardsthesector.
DailyReturns(11/16/2012)
IndexLevel 1Day MTD QTD YTD
TotalReturnsS&P500Industrials
436.68 0.31% ‐2.79% ‐3.32% 7.54%
PriceReturnsS&P500Industrials 307.80 0.28% ‐2.97% ‐3.60% 5.30%
TotalReturnsS&P500 2381.02 0.49% ‐3.51% ‐5.29% 10.29%
PriceReturnsS&P500
1359.88 0.48% ‐3.70% ‐5.61% 8.13%
14PurchasingManagersIndex,September2012
AnnualizedReturns(11/16/2012) 1Year 3Year 5Year
TotalReturnsS&P500Industrials
10.20% 10.52% ‐0.13%
PriceReturnsS&P500Industrials 7.49% 7.93% ‐2.67%
TotalReturnsS&P500 12.44% 9.30% 0.82%
PriceReturnsS&P500 9.94% 7.02% ‐1.39%

MatthewJ.Anderson FisherCollegeofBusinessEquityResearch(614)940‐2290 November20,[email protected] CaterpillarInc.(CAT)‐BUY
7
Asillustratedinthefirstpanelofthegraphsabove,theindustrialsectorhashistoricallycloselytrackedtheS&P500.Illustratedinthe2ndpanelofthegraphsabove,theindustrialsectorhasperformedrelativelyflatcomparedtotheS&P500,thoughwithahighdegreeofvolatility15.
In absolute terms, Industrials Sectormultiples are trading below their 10‐yearhistoricalmedian.AstheGreatRecessionispriced into the median multiples and Ibelieve we have not yet hit peak in thiscycle, the industrials sector appears to beundervalued.Relative to the S&P 500, the IndustrialsSector multiples are trading slightly belowtheir10‐yearmedians. Relative to theS&P500, the industrials sector appears morefairlyvalued.
4. CompanyAnalysisMorethan70%ofCAT’ssalesoccuroutsideof theUnitedStates. Backlogat theendof2011,2010,and2009 was approximately $29.8 billion, $18.7 billion and $9.6 billion respectively16. Backlog as of 3rd
15BloombergProfessional.162011Caterpillar10‐K
IndustrialsAbsoluteBasis
High Low Median Current
EV/EBITDA 12.1 7.9 10.8 9.6Price/CF 14 6 10.7 9.5TrailingP/E 24 7.1 17.7 13.9ForwardP/E 20.9 9.2 16.3 13.3
IndustrialsRelativetoS&P
500
High Low Median Current
EV/EBITDA 1.7 1.3 1.4 1.3Price/CF 1.2 0.8 1.1 1TrailingP/E 1.2 0.66 1.1 0.99ForwardP/E 1.2 0.84 1 0.97
MatthewJ.Anderson FisherCollegeofBusinessEquityResearch(614)940‐2290 November20,[email protected] CaterpillarInc.(CAT)‐BUY
8
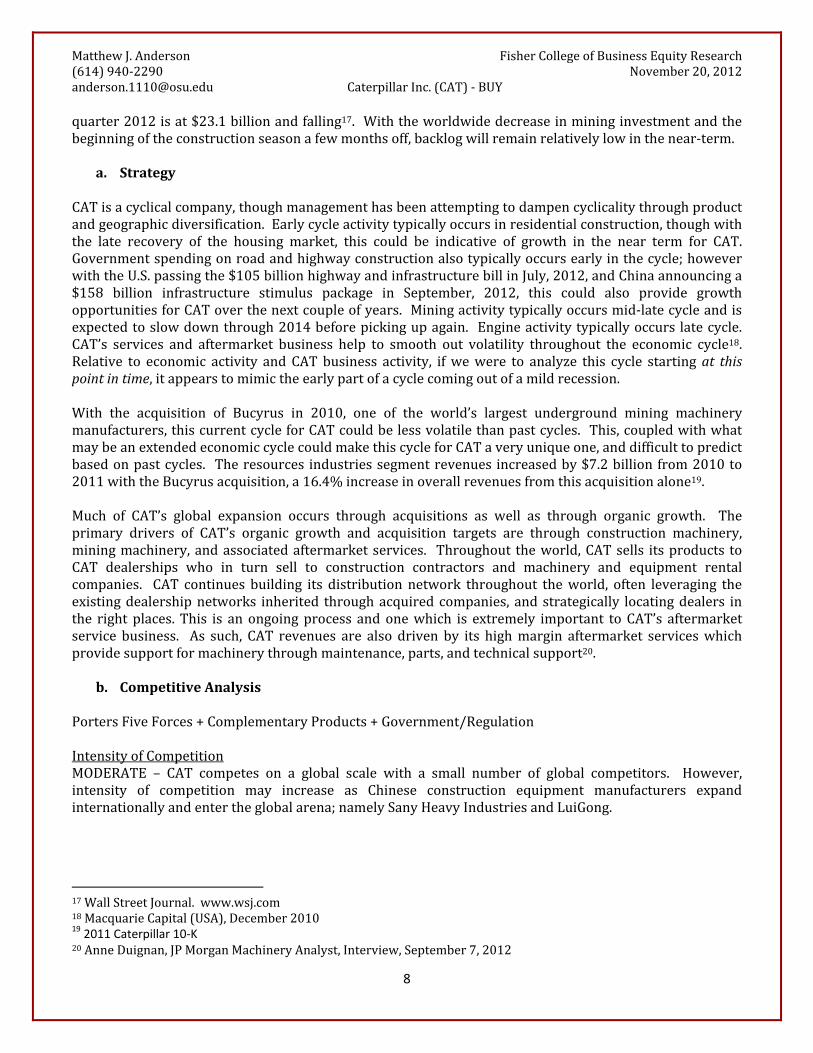
quarter2012isat$23.1billionandfalling17. Withtheworldwidedecreaseinmininginvestmentandthebeginningoftheconstructionseasonafewmonthsoff,backlogwillremainrelativelylowinthenear‐term.
a. Strategy
CATisacyclicalcompany,thoughmanagementhasbeenattemptingtodampencyclicalitythroughproductandgeographicdiversification.Earlycycleactivitytypicallyoccursinresidentialconstruction,thoughwiththe late recovery of the housing market, this could be indicative of growth in the near term for CAT.Governmentspendingonroadandhighwayconstructionalsotypicallyoccursearlyinthecycle;howeverwiththeU.S.passingthe$105billionhighwayandinfrastructurebillinJuly,2012,andChinaannouncinga$158 billion infrastructure stimulus package in September, 2012, this could also provide growthopportunitiesforCAToverthenextcoupleofyears.Miningactivitytypicallyoccursmid‐latecycleandisexpectedtoslowdownthrough2014beforepickingupagain. Engineactivitytypicallyoccurs latecycle.CAT’s services and aftermarket business help to smooth out volatility throughout the economic cycle18.Relative to economic activity and CATbusiness activity, ifwewere to analyze this cycle startingat thispointintime,itappearstomimictheearlypartofacyclecomingoutofamildrecession.With the acquisition of Bucyrus in 2010, one of the world’s largest underground mining machinerymanufacturers,thiscurrentcycleforCATcouldbelessvolatilethanpastcycles. This,coupledwithwhatmaybeanextendedeconomiccyclecouldmakethiscycleforCATaveryuniqueone,anddifficulttopredictbasedonpastcycles. Theresources industriessegmentrevenues increasedby$7.2billionfrom2010to2011withtheBucyrusacquisition,a16.4%increaseinoverallrevenuesfromthisacquisitionalone19.Much of CAT’s global expansion occurs through acquisitions as well as through organic growth. Theprimary drivers of CAT’s organic growth and acquisition targets are through construction machinery,miningmachinery,andassociatedaftermarketservices. Throughout theworld,CATsells itsproducts toCAT dealerships who in turn sell to construction contractors and machinery and equipment rentalcompanies. CAT continues building its distribution network throughout theworld, often leveraging theexistingdealershipnetworks inherited throughacquiredcompanies, andstrategically locatingdealers inthe rightplaces.This is anongoingprocess andonewhich is extremely important toCAT’s aftermarketservice business. As such, CAT revenues are also driven by its highmargin aftermarket serviceswhichprovidesupportformachinerythroughmaintenance,parts,andtechnicalsupport20.
b. CompetitiveAnalysis
PortersFiveForces+ComplementaryProducts+Government/RegulationIntensityofCompetitionMODERATE – CAT competes on a global scale with a small number of global competitors. However,intensity of competition may increase as Chinese construction equipment manufacturers expandinternationallyandentertheglobalarena;namelySanyHeavyIndustriesandLuiGong.
17WallStreetJournal.www.wsj.com18MacquarieCapital(USA),December201019 2011 Caterpillar 10‐K 20AnneDuignan,JPMorganMachineryAnalyst,Interview,September7,2012

MatthewJ.Anderson FisherCollegeofBusinessEquityResearch(614)940‐2290 November20,[email protected] CaterpillarInc.(CAT)‐BUY
9
ThreatofNewEntrantsLOW–Achievingscaleandwinningordersfromglobalcompaniesisunlikelyfromanewentrant,thoughpossibleasbeingprovenbysomeChineseconstructionequipmentmanufacturers.BargainingPowerofBuyersMODERATE –Globally, CAT’s customers are generally large and have buying power, but the technologyrequired to meet customers’ needs can only be met by a limited number of heavy machinerymanufacturers.BargainingPowerofSuppliersLOW–CAThasbeenactivelycuttingitssupplierbasefromapeakof10,000tobelow5,000asof2012.ThreatofSubstituteProductsLOW–Manuallaborinsomeeconomiesmaybeanoption.ImportanceofComplementaryProductsHIGH–Serviceandsupporttoensuremachineuptimeisimportant.CATdealersstockover80%ofpartsneededandareabletofulfillaround98%ofneedswithin24hours.ThisisimportanttoCAT’saftermarketbusiness.Government&PressureGroupsHIGH–Caterpillar’smost importantendmarket is roadwayconstructionwhich is fueledbygovernmentlegislation21.IntheU.S.,congressrecentlypassedthe$105billionHighwayandInfrastructureBillandinChina,theChinesegovernmentrecentlyannounceda$158billioninfrastructurestimuluspackage.
c. CompetitiveLandscape
CAT’s largest competitors globally for construction and mining machinery are Komatsu, Hitachi, VolvoHeavyMachinery,andSanyforconstructionmachinery;andJoyGlobalforminingmachinery.Thefigurebelow shows the global market share for construction machinery sales among construction machinerymanufacturers.CAThasthelargestglobalmarketshareat15.1%
212010STRSResearch
MatthewJ.Anderson FisherCollegeofBusinessEquityResearch(614)940‐2290 November20,[email protected] CaterpillarInc.(CAT)‐BUY
10
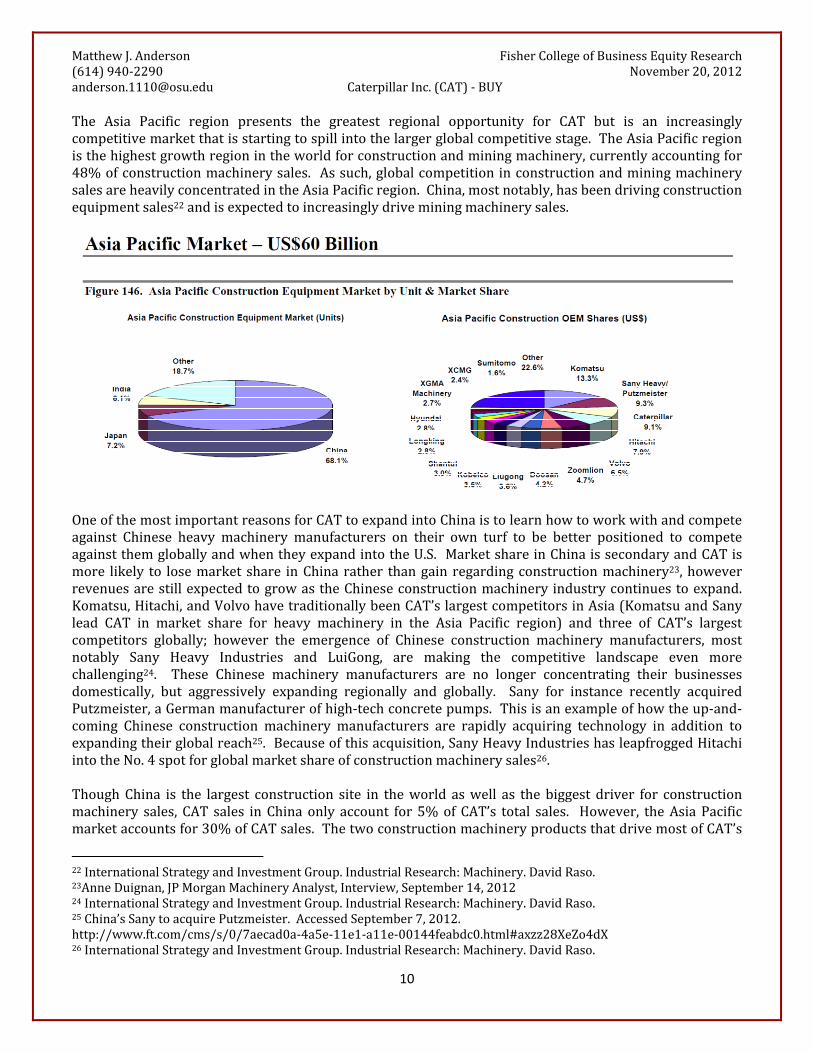
The Asia Pacific region presents the greatest regional opportunity for CAT but is an increasinglycompetitivemarketthatisstartingtospillintothelargerglobalcompetitivestage.TheAsiaPacificregionisthehighestgrowthregionintheworldforconstructionandminingmachinery,currentlyaccountingfor48%ofconstructionmachinerysales. Assuch,globalcompetitioninconstructionandminingmachinerysalesareheavilyconcentratedintheAsiaPacificregion.China,mostnotably,hasbeendrivingconstructionequipmentsales22andisexpectedtoincreasinglydriveminingmachinerysales.
OneofthemostimportantreasonsforCATtoexpandintoChinaistolearnhowtoworkwithandcompeteagainst Chinese heavy machinery manufacturers on their own turf to be better positioned to competeagainstthemgloballyandwhentheyexpandintotheU.S. MarketshareinChinaissecondaryandCATismore likely to losemarket share inChinarather thangainregardingconstructionmachinery23,howeverrevenuesarestillexpectedtogrowastheChineseconstructionmachineryindustrycontinuestoexpand.Komatsu,Hitachi,andVolvohavetraditionallybeenCAT’slargestcompetitorsinAsia(KomatsuandSanylead CAT in market share for heavy machinery in the Asia Pacific region) and three of CAT’s largestcompetitors globally; however the emergence of Chinese construction machinery manufacturers, mostnotably Sany Heavy Industries and LuiGong, are making the competitive landscape even morechallenging24. These Chinese machinery manufacturers are no longer concentrating their businessesdomestically, but aggressively expanding regionally and globally. Sany for instance recently acquiredPutzmeister,aGermanmanufacturerofhigh‐techconcretepumps.Thisisanexampleofhowtheup‐and‐coming Chinese construction machinery manufacturers are rapidly acquiring technology in addition toexpandingtheirglobalreach25.Becauseofthisacquisition,SanyHeavyIndustrieshasleapfroggedHitachiintotheNo.4spotforglobalmarketshareofconstructionmachinerysales26.ThoughChina is the largest construction site in theworld aswell as the biggest driver for constructionmachinery sales, CAT sales inChina only account for5%ofCAT’s total sales. However, theAsiaPacificmarketaccountsfor30%ofCATsales.ThetwoconstructionmachineryproductsthatdrivemostofCAT’s
22InternationalStrategyandInvestmentGroup.IndustrialResearch:Machinery.DavidRaso.23AnneDuignan,JPMorganMachineryAnalyst,Interview,September14,201224InternationalStrategyandInvestmentGroup.IndustrialResearch:Machinery.DavidRaso.25China’sSanytoacquirePutzmeister.AccessedSeptember7,2012.http://www.ft.com/cms/s/0/7aecad0a‐4a5e‐11e1‐a11e‐00144feabdc0.html#axzz28XeZo4dX26InternationalStrategyandInvestmentGroup.IndustrialResearch:Machinery.DavidRaso.

MatthewJ.Anderson FisherCollegeofBusinessEquityResearch(614)940‐2290 November20,[email protected] CaterpillarInc.(CAT)‐BUY
11
business in theAsiaPacific arewheeled loaders andhydraulic excavators; the constructionmachines inhighestdemand.CATcurrentlymanufacturesmostlyconstructionmachineryinChina27.ThiswillchangesoonasCATacquiresERAMiningMachinery,aChineseundergroundminingmachinerymanufacturer tobe discussed in more detail below. There are currently 16 CAT manufacturing plants in China.Additionally, there are 3 research and development centers, 6 office branches, and 3 logistics and partscenters28.CAT currently enjoys the largest global market share among construction machinery manufacturers at15.1%.TheAsiaPacificregionmakesup48%oftheconstructionmachinerymarketfornewsales.Chinacomprises68.1%oftheAsiapacificconstructionmachinerymarket.Therefore,Chinamakesup32.7%ofthe global construction machinery market. Both the Asia Pacific construction machinery market andChina’sshareofthatmarketaregrowingfasterthananyotherregionoftheworld29.CAT’smarketshareofconstructionmachinery sales (9.2%) in theAsiaPacific region is thirdbehindKomatsu (13.3%)and theChineseconstructionmachinerymanufacturingcompany,Sany(9.3%).TheAsiaPacificregionisalreadyveryimportanttoCATregardingminingmachinerysales;howeveritwillbecomemore important soon as CAT gains a greater foothold in the mining machinery manufacturingmarketinChina.MiningmachinerypresentsthelargestbusinessopportunityforCATtoexpandsalesglobally,especiallyintheAsiaPacificRegion;mostnotablyinChina.Theglobalminingmachineryindustryisexpectedtogrowtoa$92billionindustryby2015.Itisapproximatelya$61billionindustrycurrently.TheChinesemarketisexpectedtomakeup57%oftheminingmachineryindustry30.Withtherecent2010acquisitionofBucyrusInternational,CAT’sonlymajorglobalcompetitionregardingminingmachineryisJoyGlobalwhosehighestsellingproductiselectricshovels.Globaldemandforelectricshovels is declining as mining companies are increasingly adopting hydraulic shovels, which CATmanufactures. This is one of the strategic advantages CAT has relative to its largestminingmachinerycompetitor.The largest issueregardingmininghasbeentherecentdecrease inmining investmentaroundtheworldwhich is expected to continue to slow through 2014, especially in Australia. This will have negativeimplicationsforCATminingmachinerysalesintheAsiaPacificregionintheshort‐term.Alargepartoftherecentmining boomhas been a result of China’s consumption of natural resource. With China’s futuregrowth uncertain, and the possibility that its future growth will not be as resource intensive, the flowthroughtominingmachinerysalescouldnegatively impactCATsalesthrough201431;however,withtheacquisitionofERAMiningMachinery,CATwillgainminingmachinerymarketshareinChina.CATandJoyGlobalareinaracetoacquireChineseminingmachinerymanufacturerstogainafootholdandexpand operations into China. CAT is in the process of completing the acquisition of ERA MiningMachinery,while last year, JoyGlobal acquired InternationalMiningMachinery, anotherChinesemining
27AnneDuignan,JPMorganMachineryAnalyst,Interview,September7,2012 28www.china.cat.com29InternationalStrategyandInvestmentGroup.IndustrialResearch:Machinery.DavidRaso.30AnneDuignan,JPMorganMachineryAnalyst,Interview,September14,201231“Miningboomtopeak,slowdownahead–DeloitteAccess”.AccessedOctober7th,2012.http://www.mineweb.com/mineweb/view/mineweb/en/page67?oid=155550&sn=Detail

MatthewJ.Anderson FisherCollegeofBusinessEquityResearch(614)940‐2290 November20,[email protected] CaterpillarInc.(CAT)‐BUY
12
machinerymanufacturer.TheMinistryofCommerceinChinarecentlygaveitsapprovalforCATtomoveforwardwiththecompleteacquisitionofERA32.As competition in construction machinery increases globally, in the Asia Pacific region and in Chinaespecially,miningmachinerypresentsanenormousopportunityforCAT’scontinuedgrowthasithasmuchless competition and a competitive advantage in scale, product offering, and technology over its nextlargestminingmachinerycompetitor,JoyGlobal.
d. ThirdQuarterEarningsResults
CAT beat earnings at $2.54 versus consensus of $2.22. Revenues reportedwere in line at $16.5 billionversus consensusof 16.7billion. CATexperienced thehighest sales andprofit in3rdquarterhistory. Aportionof theirgainscamefromthesaleof their logisticsdivisionand less fromtheBucyrusacquisitionfrom2010.Despitethis,CATloweredrevenueguidanceto$66billionfrom$68‐$70billionaswellasEPSguidanceto$9.25from$9.60for2012.Thetwomaindriversbehindloweringguidancearehighinventorylevelsandaslow‐downinthesaleofminingmachineryduetodeclininginvestmentintheminingindustry.Inventorylevelshavebeenelevatedduetoarecent lackofdemandfrompurchasersofconstructionandminingmachinery.CATdealershipshavenotbeenabletoadequatelyreducetheirinventorylevelsthroughsalesandhavethereforeslowedtheirpurchasingofequipmentandmachineryfromCAT.Asaresult,CAThas reduced production of its machinery to the tune of $3.0 billion through the end of 2012 and willcontinuethisreductioninproductionintothefirstquarterof2013untilinventoriescomedowntonormallevels. Once demand begins to outstrip supply and dealerships begin ordering machinery in largerquantitiesfromCAT,CATwillthenincreaseproductiononceagain.Thisisnotexpectedtooccuruntil2ndquarter of 2013 when construction machinery sales pick up due to the beginning of the constructionseason.Miningactivityisexpectedtoslowdownthrough2014andapproaching2015.Caterpillarexpectsminingmachinerysalestodecreaseby5‐10%overthatsametimeperiod.Theyalsoexpectthislossinsalestobeoffset by construction machinery sales, largely driven by a strengthening construction industry in theUnited States and continued construction activity in emerging markets such as China and Brazil. CATmanagementdoesnotexpecteconomicgrowthuntilhalfwaythrough2013.Despitesomeheadwinds,CATmanagementhasapositiveoutlookfor2013andexpectsCATtobe“steadyasshegoes”in2013withslowgrowth,butgrowthnonetheless33.Inthemeantime,CATstockisdepressedandwilllikelystarttoexperienceafairlysignificantupsideintothe2ndand3rdquartersof2013.
32“CaterpillartobuyChinaminingmachinerygroup”.AccessedSeptember8th,2012.http://www.ft.com/cms/s/0/00c93a62‐0bfb‐11e1‐9310‐00144feabdc0.html#axzz28dV20KEl 33CaterpillarInc.3Q2012EarningsRelease&Caterpillar3QEarningsCall

MatthewJ.Anderson FisherCollegeofBusinessEquityResearch(614)940‐2290 November20,[email protected] CaterpillarInc.(CAT)‐BUY
13
e. TrendAnalysis:
CAT10YearPerformance
34CAThasseenpositivegrowthoverthelastdecade,thoughtheyhaveexperiencedagreatdealofvolatility.AstheycloselytracktheU.S.andglobaleconomies,whentheGreatRecessionhit,CATplungedtolevelsnotseensince2001;however,sincethebeginningof therecovery,CAThasoutperformedatadramaticratethroughthe1stquarterof2012.Duetotheeconomicuncertaintywithfirst,theU.S.presidentialelection,nowthefiscalcliff,andslowingglobaleconomies,amongsomelessermacrofactors,CAThaslargelybeentradingflatsincethe2ndquarterof2012.AsIbelievethiswillbeaprolongedcycle,andthiscurrentpull‐backinglobaleconomiesislikelyahiccupbeforewemoveupagain,CATappearstobeunderpriced.
34BloombergProfessional

MatthewJ.Anderson FisherCollegeofBusinessEquityResearch(614)940‐2290 November20,[email protected] CaterpillarInc.(CAT)‐BUY
14
CATvs.S&P500
As illustrated in thegraphsabove,CAThasoutperformedtheS&P500 themajorityof the timeover thepastfiveyears. StartingaroundthebeginningofMarch,2012,CAThasunderperformedtheS&P500onnewsofadeclineininvestmentintheminingindustryaswellasageneralslowdowninworldeconomies.CATiscurrentlynearingits52‐weeklowof$78.25.AsofFriday,November16th,2012,CATisat$81.93.
CATvs.S&P500IndustrialsSector
MatthewJ.Anderson FisherCollegeofBusinessEquityResearch(614)940‐2290 November20,[email protected] CaterpillarInc.(CAT)‐BUY
15
As the Industrials Sector closely tracks the S&P500, CAT’s performance versus the S&P500 industrialsindextellsmuchthesamestoryasCAT’sperformanceversustheS&P500above,thoughwithinathinnerspread.Again,IbelievethisisindicativeofCATbeingundervaluedratherthanonthedownsideofitscycle.
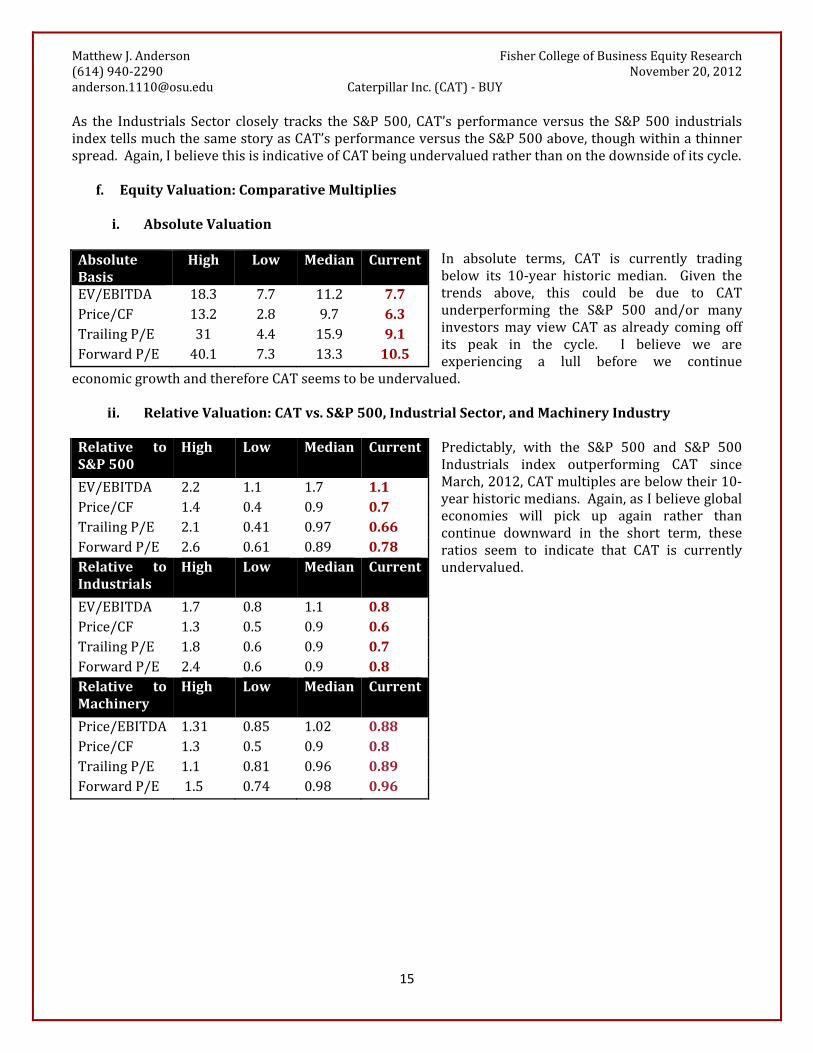
f. EquityValuation:ComparativeMultipliesi. AbsoluteValuation
In absolute terms, CAT is currently tradingbelow its 10‐year historic median. Given thetrends above, this could be due to CATunderperforming the S&P 500 and/or manyinvestorsmay view CAT as already coming offits peak in the cycle. I believe we areexperiencing a lull before we continue
economicgrowthandthereforeCATseemstobeundervalued.
ii. RelativeValuation:CATvs.S&P500,IndustrialSector,andMachineryIndustry
Predictably, with the S&P 500 and S&P 500Industrials index outperforming CAT sinceMarch,2012,CATmultiplesarebelowtheir10‐yearhistoricmedians.Again,asIbelieveglobaleconomies will pick up again rather thancontinue downward in the short term, theseratios seem to indicate that CAT is currentlyundervalued.
AbsoluteBasis
High Low Median Current
EV/EBITDA 18.3 7.7 11.2 7.7Price/CF 13.2 2.8 9.7 6.3TrailingP/E 31 4.4 15.9 9.1ForwardP/E 40.1 7.3 13.3 10.5
Relative toS&P500
High Low Median Current
EV/EBITDA 2.2 1.1 1.7 1.1Price/CF 1.4 0.4 0.9 0.7TrailingP/E 2.1 0.41 0.97 0.66ForwardP/E 2.6 0.61 0.89 0.78Relative toIndustrials
High Low Median Current
EV/EBITDA 1.7 0.8 1.1 0.8Price/CF 1.3 0.5 0.9 0.6TrailingP/E 1.8 0.6 0.9 0.7ForwardP/E 2.4 0.6 0.9 0.8Relative toMachinery
High Low Median Current
Price/EBITDA 1.31 0.85 1.02 0.88Price/CF 1.3 0.5 0.9 0.8TrailingP/E 1.1 0.81 0.96 0.89ForwardP/E 1.5 0.74 0.98 0.96

MatthewJ.Anderson FisherCollegeofBusinessEquityResearch(614)940‐2290 November20,[email protected] CaterpillarInc.(CAT)‐BUY
16
5. SummaryandRecommendationsMyrecommendationistoBUYCAT.
Opportunities Risks ContinuedU.S.andglobalGDPgrowth SlowingU.S.andglobalGDPgrowth Emergingmarkets(especiallyAsia‐Pacific)
andanexpandingmiddleclass WorseningofEuropeanSovereignDebt
Crisis
Newtechnologydemandsasemissionsstandardsandenvironmentalregulationsareraised
SlowdowninemergingmarketeconomiessuchasChina,India,andBrazil
U.S.,Chinese,andotheremergingmarketconstructionintheshortterm
EconomicVolatility
Mininginthelong‐term Decreaseinminingindustryinvestmentintheshortterm
U.S.housingmarket Highinventorylevels Domesticenergyproduction
JustificationtoBUYCAT:
DCFAnalysis–CATisundervaluedwithanUpsideof26%andtargetpriceof$103. MultiplesAnalysis–CATappearsundervalued PurchasingManagersIndex(PMI)scoreshaveapositivetrend,monthlyscores>50 ArchitecturalBillingIndex(ABI)scoreshavebeguntrendingpositivelyagain,monthlyscores>50 CATwillnot likely seemuchof a sustainable improvement inprice fora fewmonths;however I
believeCATwillexperiencesignificantgainsintothe2ndand3rdquartersof2013.Factorsinclude:o Recent slow‐down in global economies. CAT stock price moves with U.S. and Global
economies.o Equipment purchases for construction seasonwill notpickup againuntil February time‐
frame.o FiscalCliffuncertaintywillcontributetokeepingCATstockpriceatdepressedlevels.o Slow‐downinmininginvestmentintheshortterm.o Inventory levelsarecurrentlyabnormallyhigh thoughareexpected toberight‐sized into
the2ndquarterof2013.o Volatilityduetothemacroenvironment.
U.S.,Chinese,andotheremergingmarketconstructionoutlooksaregoodintheshort‐term. Miningoutlookisgreatlong‐term,thoughlaggingintheshortshort‐term.

MatthewJ.Anderson FisherCollegeofBusinessEquityResearch(614)940‐2290 November20,[email protected] CaterpillarInc.(CAT)‐BUY
17
6. Appendixa. IncomeStatementForecast
CATFY FY FY FY FY FY FY FY FY
(mill$) 2014E 2013E 2012E 3Q12 2Q12 1Q12 2011 2010 2009 2008 2007 2006Revenue 76,378.3 71,673.0 66,400.8 16,445.0 17,374.0 15,981.0 60,138.0 42,588.0 32,396.0 51,324.0 44,958.0 41,517.0
Concensus 69,959.6 65,393.3 65,566.7Guidance 66,000.0
Operating Costs:COGS 11,639.0 12,280.0 11,237.0 43,578.0 30,367.0 23,886.0 38,415.0 32,626.0 29,549.0SG&A 1,471.0 1,517.0 1,340.0 5,203.0 4,248.0 3,645.0 4,399.0 3,821.0 3,706.0R&D 634.0 632.0 587.0 2,297.0 1,905.0 1,421.0 1,728.0 1,404.0 1,347.0Interest expense of financial products 197.0 198.0 204.0 826.0 914.0 1,045.0 1,153.0 1,132.0 1,023.0Other operating (income) expenses (92.0) 131.0 290.0 1,081.0 1,191.0 1,822.0 1,181.0 1,054.0 971.0
Total 0.0 0.0 0.0 13,849.0 14,758.0 13,658.0 52,985.0 38,625.0 31,819.0 46,876.0 40,037.0 36,596.0
Operating Profit 10,114.6 9,172.0 9,879.5 2,596.0 2,616.0 2,323.0 7,153.0 3,963.0 577.0 4,448.0 4,921.0 4,921.0Concensus 9,941.5 8,787.7 8,970.2Guidance
Interest expense excluding financial products 504.1 473.0 438.2 129.0 110.0 113.0 396.0 343.0 389.0 274.0 288.0 274.0Other income (expense) 381.9 358.4 332.0 (17.0) 70.0 88.0 (32.0) 130.0 381.0 299.0 320.0 214.0
Consolidated profit before taxes 9,992.4 9,057.4 9,773.3 2,450.0 2,576.0 2,298.0 6,725.0 3,750.0 569.0 4,473.0 4,953.0 4,861.0
Provision (benefit) for income taxes 3,197.6 2,898.4 3,127.5 753.0 872.0 689.0 1,720.0 968.0 (270.0) 953.0 1,485.0 1,405.0Profit of consolidated companies 6,794.8 6,159.0 6,645.8 1,697.0 1,704.0 1,609.0 5,005.0 2,782.0 839.0 3,520.0 3,468.0 3,456.0
Equity in profit (loss) of unconsolidated affiliate 15.3 14.3 13.3 5.0 5.0 2.0 (24.0) (24.0) (12.0) 37.0 73.0 81.0
Profit of consolidated and affiliated comp 6,810.1 6,173.3 6,659.1 1,702.0 1,709.0 1,611.0 4,981.0 2,758.0 827.0 3,557.0 3,541.0 3,537.0
Less: Profit (loss) attributable to noncontrollin 76.4 71.7 66.4 3.0 10.0 25.0 53.0 58.0 (68.0) 0.0 0.0 0.0
Profit 6,733.7 6,101.7 6,592.7 1,699.0 1,699.0 1,586.0 4,928.0 2,700.0 895.0 3,557.0 3,541.0 3,537.0
Basic Shares 653.6 653.6 653.6 653.6 652.9 650.0 645.0 631.5 615.2 610.5 638.2 658.7Diluted Shares 668.7 668.7 668.7 668.7 669.6 670.2 666.1 650.4 626.0 627.9 659.5 683.8
Basic EPS 10.3 9.3 10.1 2.6 2.6 2.4 7.6 4.3 1.5 5.8 5.5 5.4Diluted EPS 10.1 9.1 9.9 2.5 2.5 2.4 7.4 4.2 1.4 5.7 5.4 5.2
Concensus 10.0 8.8 9.1Guidance 9.0-9.25
9.13Incremental Sales Growth 4,705.2 5,272.3 6,262.8 729.0 3,144.0 3,032.0 17,550.0 10,192.0 (18,928.0) 6,366.0 3,441.0 5,178.0
D&A 3,207.9 3,010.3 2,788.8 720.0 689.0 661.0 2,527.0 2,296.0 2,336.0 1,980.0 1,797.0 1,602.0 % of Sales 4.2% 4.2% 4.2% 4.4% 4.0% 4.1% 4.2% 5.4% 7.2% 3.9% 4.0% 3.9%
CapEx 4,582.7 4,658.7 4,648.1 1,231.0 1,166.0 1,129.0 3,924.0 2,586.0 2,472.0 4,011.0 3,040.0 2,675.0 % of Sales 6.0% 6.5% 7.0% 7.5% 6.7% 7.1% 6.5% 6.1% 7.6% 7.8% 6.8% 6.4%
Receivables 26,732.4 25,085.6 19,920.2 18,679.0 18,826.0 18,301.0 17,953.0 16,792.0 13,912.0 18,128.0 15,752.0 15,411.0 % of Sales 35.0% 35.0% 30.0% 113.6% 108.4% 114.5% 29.9% 39.4% 42.9% 35.3% 35.0% 37.1%Inventory 19,094.6 18,635.0 17,928.2 17,550.0 17,344.0 16,511.0 14,544.0 9,587.0 6,360.0 8,781.0 7,204.0 6,351.0 % of Sales 25.0% 26.0% 27.0% 106.7% 99.8% 103.3% 24.2% 22.5% 19.6% 17.1% 16.0% 15.3%Payables 9165.4 8600.8 8632.1 7978.0 8470.0 8360.0 8161.0 5856.0 2993.0 4827.0 4723.0 4085.0% of Sales 12.0% 12.0% 13.0% 48.5% 48.8% 52.3% 13.6% 13.8% 9.2% 9.4% 10.5% 9.8%Change in WC -1541.8 -5903.4 -4880.3
-32.8% -112.0% -77.9%
Effective Tax Rate 32.0% 32.0% 32.0% 30.7% 33.9% 30.0% 25.6% 25.8% -47.5% 21.3% 30.0% 28.9%
Interest expense excluding financial products 0.66% 0.66% 0.66% 0.78% 0.63% 0.71% 0.66% 0.81% 1.20% 0.53% 0.64% 0.66%Other income (expense) 0.50% 0.50% 0.50% -0.10% 0.40% 0.55% -0.05% 0.31% 1.18% 0.58% 0.71% 0.52%
Equity in profit (loss) of unconsolidated affiliate 0.02% 0.02% 0.02% 0.03% 0.03% 0.01% -0.04% -0.06% -0.04% 0.07% 0.16% 0.20%
Less: Profit (loss) attributable to noncontrollin 0.10% 0.10% 0.10% 0.02% 0.06% 0.16% 0.09% 0.14% -0.21% 0.00% 0.00% 0.00%
Incremental Working Capital Change per % of Sales Growth

MatthewJ.Anderson FisherCollegeofBusinessEquityResearch(614)940‐2290 November20,[email protected] CaterpillarInc.(CAT)‐BUY
18
b. BusinessSegmentForecast
CATFY FY FY FY FY FY
(mill$) 2014E 2013E 2012E 3Q12 2Q12 1Q12 2011 2010 2009Revenue:
Machinery and Power SystemsPower Systems 25,337.8 23,461.0 21,723.1 5,317.0 5,511.0 4,987.0 20,114.0 15,537.0 13,389.0Resource Industries 28,547.0 26,432.4 23,600.4 5,214.0 5,390.0 4,778.0 19,667.0 13,572.0 8,507.0Construction Industries 17,749.5 17,066.9 16,410.5 4,904.0 5,340.0 5,062.0 15,629.0 8,667.0 5,857.0All Other Segments 1,899.7 1,899.7 1,899.7 318.0 454.0 474.0 2,021.0 2,156.0 1,791.0Corporate Items and Elimina (39.0) (39.0) (39.0) (14.0) (11.0) (13.0) (39.0) (65.0) (4.0)
Financial ProductsFinancial Products 3,140.1 3,109.0 3,063.1 776.0 764.0 761.0 3,003.0 2,946.0 3,139.0Corporate Items and Elimina (257.0) (257.0) (257.0) (70.0) (74.0) (68.0) (257.0) (225.0) (283.0)
Total 76,378.3 71,673.0 66,400.8 16,445.0 17,374.0 15,981.0 60,138.0 42,588.0 32,396.0Concensus 70,991.0 65,588.0 65,795.0 Guidance 66,000.0
Operating IncomeMachinery and Power Systems
Power Systems 4,003.4 3,683.4 3,367.1 943.0 982.0 812.0 3,053.0 2,288.0 1,660.0Resource Industries 2,569.2 2,114.6 3,304.1 1,113.0 1,426.0 1,168.0 3,334.0 1,789.0 288.0Construction Industries 1,952.4 1,792.0 1,641.0 459.0 688.0 616.0 2,056.0 783.0 (768.0)All Other Segments 835.9 835.9 816.9 482.0 188.0 218.0 837.0 720.0 625.0Corporate Items and Eliminations (512.0) (778.0) (617.0) (2,457.0) (1,793.0) (1,348.0)
Financial ProductsFinancial Products 753.6 746.2 750.4 190.0 188.0 205.0 587.0 429.0 399.0Corporate Items and Eliminations (9.0) (4.0) (11.0) (4.0) (42.0) (18.0)
Adjustments (70.0) (74.0) (68.0) (253.0) (211.0) (261.0)Total 10,114.6 9,172.0 9,879.5 2,596.0 2,616.0 2,323.0 7,153.0 3,963.0 577.0
Concensus 9,941.5 8,787.7 8,970.2 Guidance
Revenue Growth YoYMachinery and Power Systems
Power Systems 8.0% 8.0% 8.0% 4.8% 12.1% 12.1% 29.5% 16.0%Resource Industries 8.0% 12.0% 20.0% 13.4% 68.1% 72.6% 44.9% 59.5%Construction Industries 4.0% 4.0% 5.0% 0.1% 8.1% 13.2% 80.3% 48.0%All Other Segments 0.0% 0.0% -6.0% -31.0% -4.4% -19.5% -6.3% 20.4%Corporate Items and Eliminations 16.7% 120.0% 0.0% -40.0% 1525.0%
Financial ProductsFinancial Products 1.0% 1.5% 2.0% 2.5% 0.0% 4.2% 1.9% -6.1%Corporate Items and Eliminations 9.4% 7.2% 17.2% 14.2% -20.5%
Total 6.6% 7.9% 10.4% 4.6% 22.1% 23.4% 41.2% 31.5%
Operating IncomeMachinery and Power Systems
Power Systems 15.8% 15.7% 15.5% 17.7% 17.8% 16.3% 15.2% 14.7% 12.4%Chg YoY 0.1% 0.2% 0.3% 2.1% 2.9% 0.5% 0.5% 2.3%
Resource Industries 9.0% 8.0% 14.0% 21.3% 26.5% 24.4% 17.0% 13.2% 3.4%Chg YoY 1.0% -6.0% -3.0% 5.1% 1.6% -4.3% 3.8% 9.8%
Construction Industries 11.0% 10.5% 10.0% 9.4% 12.9% 12.2% 13.2% 9.0% -13.1%Chg YoY 0.5% 0.5% -3.2% -0.8% 3.1% 0.0% 4.1% 22.1%
All Other Segments 44.0% 44.0% 43.0% 151.6% 41.4% 46.0% 41.4% 33.4% 34.9%Chg YoY 0.0% 1.0% 1.6% 100.8% 15.7% 4.4% 8.0% -1.5%
Financial ProductsFinancial Products 24.0% 24.0% 24.5% 24.5% 24.6% 26.9% 19.5% 14.6% 12.7%
Chg YoY 0.0% -0.5% 5.0% 5.3% 2.1% 8.3% 5.0% 1.9%Total 13.2% 12.8% 14.9% 15.8% 15.1% 14.5% 11.9% 9.3% 1.8%
MatthewJ.Anderson FisherCollegeofBusinessEquityResearch(614)940‐2290 November20,[email protected] CaterpillarInc.(CAT)‐BUY
19
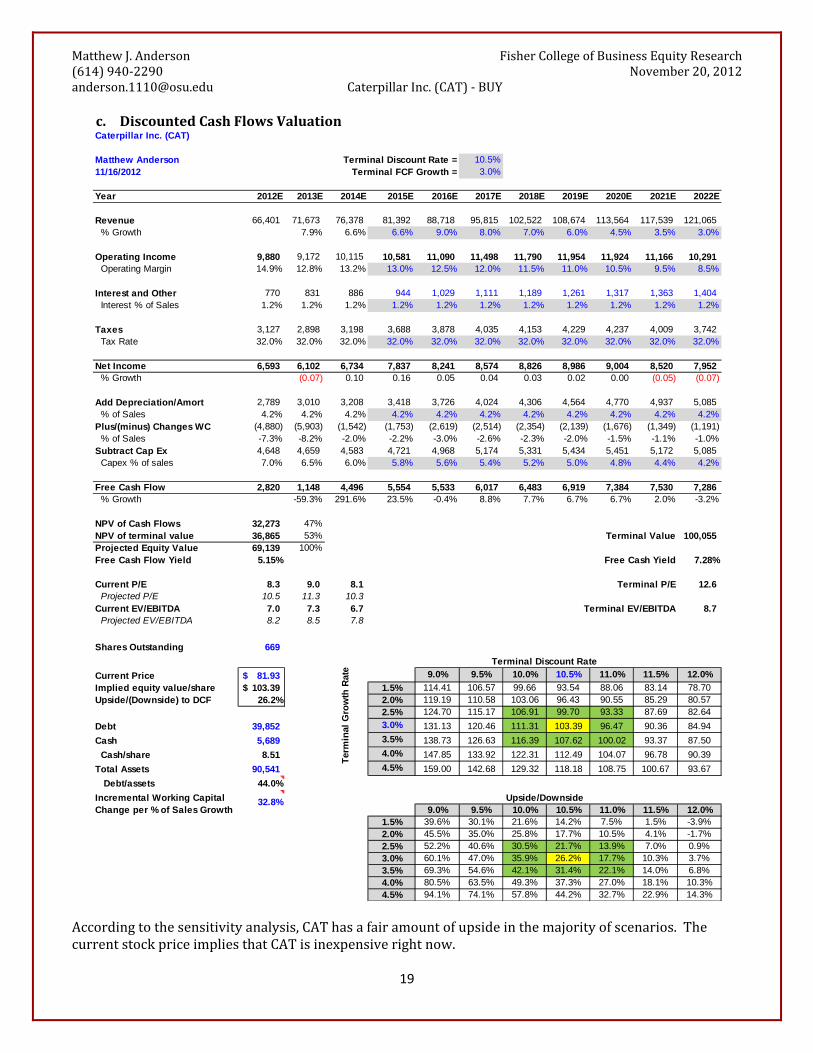
c. DiscountedCashFlowsValuation
Accordingtothesensitivityanalysis,CAThasafairamountofupsideinthemajorityofscenarios.ThecurrentstockpriceimpliesthatCATisinexpensiverightnow.
Caterpillar Inc. (CAT)
Matthew Anderson Terminal Discount Rate = 10.5%11/16/2012 Terminal FCF Growth = 3.0%
Year 2012E 2013E 2014E 2015E 2016E 2017E 2018E 2019E 2020E 2021E 2022E
Revenue 66,401 71,673 76,378 81,392 88,718 95,815 102,522 108,674 113,564 117,539 121,065 % Growth 7.9% 6.6% 6.6% 9.0% 8.0% 7.0% 6.0% 4.5% 3.5% 3.0%
Operating Income 9,880 9,172 10,115 10,581 11,090 11,498 11,790 11,954 11,924 11,166 10,291 Operating Margin 14.9% 12.8% 13.2% 13.0% 12.5% 12.0% 11.5% 11.0% 10.5% 9.5% 8.5%
Interest and Other 770 831 886 944 1,029 1,111 1,189 1,261 1,317 1,363 1,404 Interest % of Sales 1.2% 1.2% 1.2% 1.2% 1.2% 1.2% 1.2% 1.2% 1.2% 1.2% 1.2%
Taxes 3,127 2,898 3,198 3,688 3,878 4,035 4,153 4,229 4,237 4,009 3,742 Tax Rate 32.0% 32.0% 32.0% 32.0% 32.0% 32.0% 32.0% 32.0% 32.0% 32.0% 32.0%
Net Income 6,593 6,102 6,734 7,837 8,241 8,574 8,826 8,986 9,004 8,520 7,952 % Growth (0.07) 0.10 0.16 0.05 0.04 0.03 0.02 0.00 (0.05) (0.07)
Add Depreciation/Amort 2,789 3,010 3,208 3,418 3,726 4,024 4,306 4,564 4,770 4,937 5,085 % of Sales 4.2% 4.2% 4.2% 4.2% 4.2% 4.2% 4.2% 4.2% 4.2% 4.2% 4.2%Plus/(minus) Changes WC (4,880) (5,903) (1,542) (1,753) (2,619) (2,514) (2,354) (2,139) (1,676) (1,349) (1,191) % of Sales -7.3% -8.2% -2.0% -2.2% -3.0% -2.6% -2.3% -2.0% -1.5% -1.1% -1.0%Subtract Cap Ex 4,648 4,659 4,583 4,721 4,968 5,174 5,331 5,434 5,451 5,172 5,085 Capex % of sales 7.0% 6.5% 6.0% 5.8% 5.6% 5.4% 5.2% 5.0% 4.8% 4.4% 4.2%
Free Cash Flow 2,820 1,148 4,496 5,554 5,533 6,017 6,483 6,919 7,384 7,530 7,286 % Growth -59.3% 291.6% 23.5% -0.4% 8.8% 7.7% 6.7% 6.7% 2.0% -3.2%
NPV of Cash Flows 32,273 47%NPV of terminal value 36,865 53% Terminal Value 100,055 Projected Equity Value 69,139 100%Free Cash Flow Yield 5.15% Free Cash Yield 7.28%
Current P/E 8.3 9.0 8.1 Terminal P/E 12.6 Projected P/E 10.5 11.3 10.3 Current EV/EBITDA 7.0 7.3 6.7 Terminal EV/EBITDA 8.7 Projected EV/EBITDA 8.2 8.5 7.8
Shares Outstanding 669
Current Price 81.93$ 103.3925 9.0% 9.5% 10.0% 10.5% 11.0% 11.5% 12.0%
Implied equity value/share 103.39$ 1.5% 114.41 106.57 99.66 93.54 88.06 83.14 78.70Upside/(Downside) to DCF 26.2% 2.0% 119.19 110.58 103.06 96.43 90.55 85.29 80.57
2.5% 124.70 115.17 106.91 99.70 93.33 87.69 82.64
Debt 39,852 3.0% 131.13 120.46 111.31 103.39 96.47 90.36 84.94
Cash 5,689 3.5% 138.73 126.63 116.39 107.62 100.02 93.37 87.50
Cash/share 8.51 4.0% 147.85 133.92 122.31 112.49 104.07 96.78 90.39
Total Assets 90,541 4.5% 159.00 142.68 129.32 118.18 108.75 100.67 93.67
Debt/assets 44.0%
26.2% 9.0% 9.5% 10.0% 10.5% 11.0% 11.5% 12.0%1.5% 39.6% 30.1% 21.6% 14.2% 7.5% 1.5% -3.9%2.0% 45.5% 35.0% 25.8% 17.7% 10.5% 4.1% -1.7%2.5% 52.2% 40.6% 30.5% 21.7% 13.9% 7.0% 0.9%3.0% 60.1% 47.0% 35.9% 26.2% 17.7% 10.3% 3.7%3.5% 69.3% 54.6% 42.1% 31.4% 22.1% 14.0% 6.8%4.0% 80.5% 63.5% 49.3% 37.3% 27.0% 18.1% 10.3%4.5% 94.1% 74.1% 57.8% 44.2% 32.7% 22.9% 14.3%
Ter
min
al G
row
th R
ate
Terminal Discount Rate
Incremental Working Capital Change per % of Sales Growth
32.8% Upside/Downside