Embed Size (px)
Citation preview


D ISCLAIMER The findings, interpretations and conclusions expressed here are those of the authors and do not necessarily reflect those of the Organs of the Council of Europe Development Bank (CEB), who cannot guarantee the accuracy of the data included in this paper. The designations employed and the presentation of the material in this paper do not imply the expression of any opinion whatsoever on the part of the CEB concerning the legal status of any country, territory, city or area, or of its authorities, or concerning the delimitation of its frontiers or boundaries. This working paper focuses on healthcare services. Social care services, i.e. support provided to vulnerable people of all ages, in need or at risk, are not covered in this paper. Unless otherwise stated, the definitions follow the glossary of the European health for all database (HFA-DB) and of the Mortality Indicator Database (HFA-MDB), by the World Health Organization (WHO) Regional Office for Europe. The working paper is printed in this form to communicate the result of an analytical work with the objective of generating further discussions on the issue. ACKNOWLEDGEMENTS This study was drafted by Lucia Athenosy (Senior Economist), Corporate Responsibility & Studies Department, with contributions from Thomas Kergall (Technical Advisor for Health projects), under the supervision of Jérôme Halb (Director of Corporate Responsibility & Studies Department, Deputy Director for European Cooperation & Strategy).

Financing Sustainable Health Infrastructure in CEB Target Countries 1
Contents
Executive summary
Introduction
Part I : Healthcare systems in CEB target countries
Chapter 1: Health status ................................................................................................................... 7
Chapter 2: Characteristics of healthcare systems ............................................................................... 9
Part I I : Trends and challenges in healthcare provision and financing
Chapter 3: Adapting the health workforce and their skills to evolving needs ................................... 18
Chapter 4: Changing demographics ............................................................................................... 21
Chapter 5: Private sector involvement ............................................................................................. 25
Part I I I : CEB financing: experience to date and the role ahead
Chapter 6: Portfolio profile ............................................................................................................. 28
Chapter 7: Hospitals and healthcare facilities as complex projects ................................................... 38
Chapter 8: The way ahead .............................................................................................................. 40
Bibliography
Glossary

Financing Sustainable Health Infrastructure in CEB Target Countries 2
Abbreviations and acronyms AC Administrative Council
CEB Council of Europe Development Bank
EIB European Investment Bank
HCS Healthcare system
IFI(s) International Financial Institution(s)
NIB Nordic Investment Bank
NIF Neighbourhood Investment Facility
NTA Norway Trust Account
LTC Long-term care
OECD Organisation for Economic Co-operation and Development
OOPs Out-of-pocket payments
NTA Norway Trust Account for the Western Balkans
PPPs Public-private partnerships
SCA Spanish Social Cohesion Account
SDA Social Dividend Account
SHI Social health insurance
SMEs Small and medium-sized enterprises
UNICEF United Nations Children’s Fund
WBIF Western Balkans Investment Framework
WHO World Health Organization
USSR Union of Soviet Socialist Republics Boxes / tables Box 1 CEB sectoral lines of action
Box 2 Regionalisation of health services in the Republic of Moldova
Box 3 Hospital PPPs vs. Infrastructure PPPs
Table 1.1 Health status indices
Table 2.1 Clustering of CEB target countries according to their funding system
Table 2.2 Health expenditure, 2013
Table 2.3 Healthcare resources and utilisation, 2013 or latest available year
Table 4.1 Population projections by age, 2010-2060
Table 5.1 Typology of hospital PPPs Figures Figure 2.1 Healthcare financing mechanisms
Figure 2.2 Share of persons aged 16 and over reporting unmet needs for medical care, 2013
Figure 4.1 CEB countries above or below the average median age in 2010 and 2060
Figure 4.2 People aged 65 and older receiving care benefits (cash or in-kind) in different care settings, 2009 or most recent year, in selected CEB member and non-member countries
Figure 6.1 CEB lending to the health sector in target and non-target countries
Figure 6.2 CEB lending to the health sector since 1982 per sub-period
Figure 6.3 Geographic distribution of CEB lending to the health sector in target countries
Figure 6.4 Public and private borrowers in CEB health projects in target countries

Financing Sustainable Health Infrastructure in CEB Target Countries 3
Executive summary
Healthcare systems in CEB target countries
1. Healthcare systems evolve in line with political and socio-economic changes. Over the last two decades, healthcare systems in CEB target countries have transitioned to today’s quite heterogeneous systems in terms of their organisation, financing and performance. They can be categorised as social insurance-type, tax-based and/or privately-financed systems, with none of them excluding out-of-pocket payments.
2. Despite their differences, they share similar problems inherited from the centralised Semashko health model and, at the same time, are all having to cope with increasing costs due to demographic, epidemiologic, technological and organisational changes.
Trends and challenges in healthcare provision and financing
3. Over the coming years, demographic pressures will have significant consequences on the way in which healthcare systems respond to patient needs. The ageing phenomenon is expected to lead to a burgeoning demand for different types of eldercare infrastructure and services. This demand is likely to depend on adaptations to welfare state systems triggered by fiscal restructuring and shifting societal preferences towards “ageing in place” and home care. It could also be affected by the growing diversity among older Europeans in terms of income, health and disability status, access to informal support and (unmet) care needs.
4. Most of the CEB’s target countries have moved through the epidemiologic transition from mainly infectious to chronic disease patterns. The overall burden of chronic conditions and lifestyle-related diseases is also set to increase, not only for the population over 60, but much earlier in life, constituting another source of pressure on the physical and financial resources of healthcare systems.
5. To meet this growing demand for healthcare and long-term care, health systems will need a health workforce of sufficient capacity and with the right skills. Changes in how healthcare services are organised and delivered to meet the needs of Europe’s (ageing) population will require different skill mixes, task-shifting and new ways of working within wider cross-specialist teams, while keeping abreast of changes in technology, treatments and prevention.
6. These trends are also expected to increase healthcare spending. The health systems will thus face significant challenges in identifying additional sources of funding and in clarifying the role of the private sector. Public and private sectors will have to work together to address the challenges of affordability, availability, accessibility and quality of care over the coming years.
CEB financing: experience to date and the role ahead
7. Investing in people’s health as human capital and promoting equitable access to healthcare contribute to strengthening social cohesion, which is a priority for the CEB. Projects financed by the CEB in the health sector involve both “hard investments” in the construction, renovation and modernisation of public or private infrastructure and “soft investments” in health-related research and development programmes, education and in training for specialised staff in the health and social sectors. Over the period 1982-2015, the total volume of projects approved in this sector amounts to € 4.6 billion, representing 9% of all loans approved. This amount includes close to € 1.3 billion in health projects located in the CEB’s target countries.
8. In order to achieve the desired outcome of high-quality, cost-effective and responsive care over the coming years, it will be crucial to ensure that the right physical structures and people are in place. Given the continually changing nature of the health sector, this will require ongoing investment in new and updated facilities, equipment and skills. Investment needs in the health sectors of CEB target countries are more acute than those in the other CEB member states, because their healthcare systems are still maturing and facilities are more obsolete. Much needed reconfigurations of hospital systems across CEB target countries require the construction and/or renovation of infrastructure and the availability of an adequately skilled and trained medical and managerial workforce if they are to adapt to changing health needs and to offer new treatment methods.
9. As the only development bank with an exclusively social vocation in Europe, the CEB will thus continue to finance adequate, affordable and sustainable healthcare infrastructure and services, with a particular focus on its target countries.

Financing Sustainable Health Infrastructure in CEB Target Countries 4
Introduction
Health is “a state of complete physical, mental and social well-being and not merely the absence of disease or infirmity”1. Whilst health status is a key determinant of individual well-being, the health status of a given population is an indicator of educational attainment, level of earnings and labour market participation, all of which drive economic growth and social welfare. Investing in people’s health as human capital is therefore not only worthwhile per se, but also brings about significant social benefits and considerable improvements in economic outcomes. The overarching values of universality, equity and solidarity in access to safe, high-quality and efficient healthcare are widely shared across CEB member countries2. Indeed, to be in good health is considered to be not only a basic need but also a right, enshrined in many international human rights instruments. The European Social Charter has thus been adopted in its original or revised version by all Council of Europe member states. Similarly, the United Nations health rights obligations have been accepted by all European states. These instruments defend and promote access to adequate and affordable healthcare for all. Each individual healthcare system attempts to meet the population’s need for health and healthcare. The question here is whether the demand for healthcare appropriately reflects the real needs of the population and to what extent the healthcare services provided meet those needs and are effectively used by the population. Furthermore, each healthcare system attempts to address numerous, sometimes competing, challenges: how much to spend on health and how best to spend it; how to invest in health systems in a sustainable way; how to ensure a balanced mix of staff skills and anticipate staff needs due to ageing and/or emigration; how to ensure adequate and timely access to care and financial protection against unexpected or serious illness; how to achieve an appropriate balance between expenditure on treatment and expenditure on prevention; how to address chronic diseases, threats from new diseases and environmental hazards; etc. Healthcare systems stem from specific political, historical, cultural and socio-economic traditions and are closely related to social welfare systems. As a result, the organisational and financing arrangements for healthcare differ across CEB member states, as does the allocation of capital and human resources. However, similar objectives and historical developments have resulted in health systems that have much in common and, for the purposes of this paper, are presented in clusters. Today, CEB member countries face common challenges in delivering efficient, high quality and affordable health services at a time when the amount of care to be delivered increasingly exceeds the resource base. Representing an important part of public budgets, healthcare spending in CEB countries is expected to increase over the coming years due to a number of factors. As in all industrialised countries, the demand for healthcare is growing as a result of ageing populations, technological advances and medical innovation, a higher incidence of chronic diseases, rising public expectations and new opportunities for securing substantial improvements in health. Thus, a particular challenge for healthcare systems in CEB member countries is to meet the real need for healthcare by ensuring (public and private) financing for the adequate, affordable and sustainable provision of health services for all. In other terms, it is essential to ensure that health systems are sustainable in terms of cost-efficiency, universal coverage, quality and continuity of service, all within the limits of the available financial, social and environmental resources.
1 Preamble to the Constitution of the World Health Organization as adopted by the International Health Conference, New York, 19-22 June, 1946; signed on 22 July 1946 by the representatives of 61 States (Official Records of the World Health Organization, no. 2, p. 100) and in force as of 7 April 1948. The Definition has not been amended since 1948. 2 41 CEB member countries: Albania, Bosnia and Herzegovina, Belgium, Bulgaria, Croatia, Cyprus, Czech Republic, Denmark, Estonia, Finland, France, Georgia, Germany, Greece, Holy See, Hungary, Iceland, Ireland, Italy, Kosovo, Latvia, Lithuania, Liechtenstein, Luxembourg, “the former Yugoslav Republic of Macedonia”, Malta, Republic of Moldova, Montenegro, Netherlands, Norway, Poland, Portugal, Romania, San Marino, Serbia, Slovak Republic, Slovenia, Spain, Sweden, Switzerland, Turkey. Note: Countries in bold are the CEB’s target countries in Central, Eastern and South-Eastern Europe.

Financing Sustainable Health Infrastructure in CEB Target Countries 5
Investing in people’s health as human capital and promoting equitable access to healthcare contribute to strengthening social cohesion, which is a priority for the Council of Europe Development Bank (CEB). Projects financed by the CEB in the health sector involve both “hard investments” in the construction, renovation and modernisation of public or private infrastructure and “soft investments” in health-related research and development programmes and in training for specialised staff in the social and health sectors. Since 1982, when the first CEB health project was approved in Turkey, CEB lending has mainly contributed to developing physical infrastructure and equipment in the health sector but soft-side investments such as training programmes have also supported the development and functioning of health systems in CEB member states. Over the period 1982-2015, the total volume of projects approved in this sector amounts to € 4.6 billion, representing 9% of all loans approved. This amount includes close to € 1.3 billion in health projects located in the CEB’s target countries. This working paper provides an overview of the CEB’s activities in the health sector across the target countries. While taking into account the CEB’s experience in financing health projects to date, the paper also assesses recent trends and challenges in healthcare provision and financing and their implications for future lending to this sector. The paper is divided into three main parts. Part I: Healthcare systems in CEB target countries Chapter 1 briefly describes the demographic and epidemiologic profiles of CEB target countries. Chapter 2 looks at the main characteristics (spending, resources and their utilisation, accessibility) of their healthcare systems, which are grouped into three clusters based on their respective funding mechanisms. Part II: Trends and challenges in healthcare provision and financing Chapters 3-5 analyse how the healthcare landscape is changing. They present some of the demographic and economic trends that are likely to reshape healthcare provision and financing across CEB target countries in the near future. On the one hand, healthcare systems will have to address numerous challenges resulting from an ageing population, growth in (expensive) chronic diseases, technological progress and consumer expectations of affordable and high-quality care. On the other hand, these trends will create substantial new costs for both providers and receivers of healthcare and will challenge the fiscal sustainability of public health systems. Part III: CEB financing: experience to date and the role ahead Chapter 6 describes the CEB’s approach to health and its long-standing experience in financing projects in the health sector, with a special focus on the Bank’s target countries. The portfolio of projects financed by the CEB is illustrated by case studies, highlighting the Bank’s social value in this sector of action. Chapter 7 demonstrates the unique characteristics and complexities of health projects when compared to other social infrastructure projects. To conclude, Chapter 8 discusses the CEB’s relevance in the context of the challenges described in Part II and reflects on potential avenues for the Bank’s continued investment in the health sector in CEB target countries.

Financing Sustainable Health Infrastructure in CEB Target Countries 6
PART I: Healthcare systems in CEB target countries
Part I describes the health status of CEB target countries and the main characteristics of their healthcare systems. First, key population and health indicators are put into a cross-country perspective to provide a broad overview of health outcomes in this region. Second, although their organisational arrangements for healthcare differ, the countries are grouped into three main clusters with similar characteristics in their funding mechanisms. Third, this part compares the amounts CEB target countries spend on health, both on a per capita basis and in relation to GDP, and looks at how health services are financed from public and private resources. To conclude, Part I examines the allocation and utilisation of healthcare resources and looks at their accessibility across CEB target countries.
Box 1: CEB sectoral lines of action
Set up by the Committee of Ministers of the Council of Europe in 1956 as the Council of Europe Resettlement Fund for National Refugees and Overpopulation in Europe, the CEB is the oldest IFI and the only development bank with an exclusively social vocation in Europe. With a mandate to operate in its 41 member states and a particular focus on the countries in Central, Eastern and South Eastern Europe, known as “target countries”, the CEB has become an important financial tool within the framework of European solidarity. The Bank’s original mandate was to respond to emergency situations, with aid to refugees, migrants, displaced persons and victims of natural or ecological disasters being a statutory priority (Article II of the Articles of Agreement). The Bank’s scope of action has progressively widened to include other sectors that directly contribute to strengthening social cohesion in Europe. Today, CEB lending is structured around four sectoral lines of action. The sector of “health” is today part of the line of action devoted to supporting public infrastructure with a social vocation, which also contains “education and vocational training” and the “infrastructure of administrative and judicial public services”.
Sectoral lines of action Sectors of action Strengthening social integration Aid to refugees, migrants and displaced persons
Housing for low-income persons Improvement of living conditions in urban and rural areas
Managing the environment Natural or ecological disasters Protection of the environment Protection and rehabilitation of historic and cultural heritage
Supporting public infrastructure with a social vocation
Health Education and vocational training Infrastructure of administrative and judicial public services
Supporting micro-, small and medium sized enterprises (MSMEs)
Creation and preservation of viable jobs
The CEB’s approach to “health” and its scope of action in this field are defined in the “Overall Policy Framework for Loan and Project Financing” (Resolution 1562 (2013)) and its implementation document “Handbook for the preparation and monitoring of projects” (updated in March 2015). These documents are available on the CEB’s website (www.coebank.org). The CEB provides the means for financing various types of projects that concern health and related infrastructure, most notably involving the construction, renovation and modernisation of infrastructure such as hospitals, neighbourhood healthcare centres (including those specialised in providing assistance to vulnerable populations), university hospitals or centres specialising in healthcare for the elderly and the disabled. The CEB can also finance training programmes for specialised staff in the social and health sectors. Some examples of CEB investments in the health sector are presented in the Case Studies in Chapter 6.

Financing Sustainable Health Infrastructure in CEB Target Countries 7
Chapter 1: Health status Health cannot be measured directly and many determinants of health, for example, socio-economic conditions, education, nutrition and other life-style factors, fall beyond the healthcare sector. Health status can nevertheless be compared using population characteristics such as life expectancy, morbidity and mortality indices. The synopsis of health status indices can thus give a global impression of the quantity and quality of life of a given population3. Over the past two decades, CEB target countries have achieved significant gains in population health, but there remain large inequalities in health status both across and within countries. Life expectancy at birth in CEB target countries has increased by more than 5 years on average since 1990, although the gap between those countries with the highest (Cyprus, Malta, Slovenia) and lowest expectancies (Republic of Moldova, Georgia, Lithuania) remains around 8 years (see Table 1.1). From a gender perspective, life expectancy for women is generally higher than for men, but this gender gap has decreased since 1990. In the group of target countries, the gap between the highest and lowest life expectancies is 11.5 years for men (68.5 years in Lithuania vs. 80 years in Malta) and 8.7 years for women (75.7 years in Moldova vs. 84.4 years in Malta). Large differences can be observed in the health status of the different socio-economic groups, with individuals with higher levels of education and income enjoying better health and living several years longer that those more disadvantaged. These disparities are linked to many factors, including some that are external to healthcare systems such as the environment in which people live, individual lifestyles and behaviours, and differences in access to and quality of care. In Central and Eastern European countries, differences in life expectancy by education level are particularly large. For example, 65-year-old men with a high level of education can expect to live four to seven years longer than those with a low education level4. Life expectancy continues to increase in CEB target countries, reflecting reductions in mortality rates at all ages. Statistics on death remain one of the most widely available and comparable sources of information on health. There are significant variations in mortality rates for all causes of death across CEB target countries. Death rates are lowest in Southern European countries (Cyprus, Malta, Slovenia, Turkey) and highest in Baltic and South-Eastern European countries (Republic of Moldova, Bulgaria, Romania, Western Balkans), with mortality rates almost twice those of the lowest countries. As in most industrialised countries, cardiovascular diseases and cancer are generally the leading causes of death across the target countries. Cerebrovascular diseases are the main cause of all deaths in Albania, Bulgaria, “the former Yugoslav Republic of Macedonia” and Romania. Last but not least, alcohol-related diseases were responsible for around 15% of all deaths in the Baltic countries and the Republic of Moldova. Most of the countries have moved through the epidemiologic transition5 and face an increasing disease burden because of circulatory diseases and cancer. However, some CEB target countries - notably the Baltics, Bulgaria, Georgia, Republic of Moldova, Romania and Turkey - still face high levels of infant mortality and/or a relatively high burden of infectious diseases. Infant mortality (the rate at which babies and children of less than one year die) reflects the effect of economic and social conditions on the health of mothers and new-borns, as well as the effectiveness of health systems. In most European countries, infant mortality is low, at around 4 deaths per 1,000 live births on average in the EU-28, with the lowest rates in the Czech Republic, Estonia and Slovenia. However, infant mortality remains very high in a number of CEB target countries (Georgia, Turkey, Republic of Moldova, Romania, “the former Yugoslav Republic of Macedonia” and Bulgaria), above 8 deaths per 1,000 live births. Looking ahead, gains in longevity coupled with population ageing (see Chapter 4) in CEB target countries are expected to increase demand for healthcare and long-term care, and put pressure on physical and financial resources. The overall burden of chronic conditions and life-style related diseases is also set to increase, constituting another source of cost pressures on healthcare systems.
3 However, cross-country comparisons of health status indices are only valid within the limits of data availability and comparability. 4 OECD (2014), Health at a Glance: Europe 2014 5 In demography, epidemiological transition is a phase of development witnessed by a sudden and stark increase in population growth rates brought about by medical innovation in disease or sickness therapy and treatment, followed by a re-leveling of population growth from subsequent declines in fertility rates. “Epidemiologic transition” accounts for the replacement of infectious diseases by chronic diseases over time due to expanded public health and sanitation. This theory was originally posited by Abdel Omran in 1971.

Financing Sustainable Health Infrastructure in CEB Target Countries 8
Table 1.1: Health status indices
Sources: (1) SDR: World Health Organization Regional Office for Europe, European mortality database (MDB), http://data.euro.who.int/hfamdb/ accessed on 10 November 2015 and 29 January 2016. (2) World Health Organization Regional Office for Europe, European Health for All Database (HFA-DB), http://data.euro.who.int/hfadb/ accessed on 10 November 2015 and 29 January 2016. Note: Kosovo is not included in the database.
Rat
e o
f in
fan
t m
ort
alit
y(p
er 1
,000
life
b
irth
s)
Rat
e o
f p
erin
atal
m
ort
alit
y(p
er 1
,000
to
tal
bir
ths)
All
cau
ses
Can
cer
(all
neo
pla
sms)
Isch
aem
ic
hea
rt d
isea
seC
ereb
rova
scu
lar
dis
ease
s
Mo
tor
veh
icle
tr
affi
c ac
cid
ents
Sele
cted
alc
oh
ol-
rela
ted
cau
ses
1990
1990
1990
2013
2000
Alb
ania
78.9
3 -
2004
75.8
673
.72
- 20
0469
.64
16.3
5 -
2004
15.3
464
.861
.85.
49 -
200
910
.25
- 19
9081
0.24
- 2
004
123.
02 -
200
412
1.39
- 2
004
151.
45 -
200
40
- 20
0946
.17
- 20
04
Bosn
ia a
nd H
erze
govi
na79
.01
- 20
1175
.86
74.2
3 -
2011
69.9
216
.62
- 20
1114
.82
67.6
65.5
5.78
- 2
011
6.92
- 2
013
802.
17 -
201
115
7.89
- 2
011
72.3
4 -
2011
102.
77 -
201
10.
10 -
201
142
.27
- 20
11
Bulg
aria
78.0
0 -
2012
74.9
570
.99
- 20
1268
.25
15.8
2 -
2012
14.1
765
.363
.17.
75 -
201
210
.29
- 20
1393
2.87
- 2
011
156.
90 -
201
110
5.72
- 2
011
160.
30 -
201
15.
17 -
201
154
.57
- 20
11
Cro
atia
81.0
6 -
2013
76.3
874
.54
- 20
1368
.69
17.5
2 -
2013
14.8
367
.865
.04.
06 -
201
33.
51 -
201
372
1.47
- 2
013
212.
48 -
201
314
5.89
- 2
013
94.5
3 -
2013
8.35
- 2
013
74.9
1 -
2013
Cyp
rus
83.8
0 -
2012
n.a.
79.6
6 -
2012
n.a.
19.6
3 -
2013
n.a.
74.4
69.7
3.54
- 2
012
5.01
- 2
013
514.
84 -
201
212
3.03
- 2
012
61.4
8 -
2012
35.5
7 -
2012
6.63
- 2
012
32.5
7 -
2012
Cze
ch R
epub
lic81
.43
- 20
1375
.54
75.3
1 -
2013
67.6
317
.78
- 20
1313
.77
68.7
66.1
2.48
- 2
013
2.96
- 2
013
691.
86 -
201
318
1.04
- 2
013
166.
67 -
201
360
.83
- 20
135.
35 -
201
365
.91
- 20
13
Esto
nia
81.4
3 -
2011
74.9
771
.27
- 20
1164
.68
17.9
9 -
2011
14.4
767
.062
.02.
38 -
201
12.
37 -
201
375
9.72
- 2
011
189.
07 -
201
117
4.25
- 2
011
55.9
0 -
2011
7.17
- 2
011
105.
89 -
201
1
Geo
rgia
77.3
2 -
2014
76.5
368
.80
- 20
1469
.10
15.3
8 -
2014
16.0
765
.262
.811
.06
- 20
1310
.89
- 20
1385
0.37
- 2
012
100.
72 -
201
298
.05
- 20
1283
.43
- 20
120.
49 -
201
247
.33
- 20
12
Hun
gary
79.2
0 -
2013
73.8
872
.20
- 20
1365
.20
16.8
4 -
2013
14.0
064
.962
.15.
12 -
201
33.
85 -
201
384
0.71
- 2
013
236.
02 -
201
319
7.27
- 2
013
78.2
6 -
2013
6.0
0 -
2013
85.8
1 -
2013
Kos
ovo
n.a.
n.a.
n.a.
n.a.
n.a.
n.a.
n.a.
n.a.
n.a.
n.a.
n.a.
n.a.
n.a.
n.a.
n.a.
n.a.
Latv
ia78
.96
- 20
1274
.63
68.9
2 -
2012
64.1
816
.64
- 20
1214
.51
64.8
61.6
6.28
- 2
012
4.88
- 2
013
910.
88 -
201
219
7.14
- 2
012
243.
01 -
201
213
1.83
- 2
012
7.93
- 2
012
110.
70 -
201
2
Lith
uani
a79
.71
- 20
1276
.36
68.4
7 -
2012
66.5
217
.21
- 20
1215
.65
65.1
63.0
3.87
- 2
012
4.32
- 2
013
893.
10 -
201
218
4.82
- 2
012
286.
79 -
201
210
6.28
- 2
012
11.0
5 -
2012
144.
68 -
201
2
FYR
Mac
edon
ia77
.28
- 20
1074
.53
72.9
9 -
2010
69.8
815
.08
- 20
1014
.87
66.0
64.0
7.61
- 2
010
12.7
6 -
2012
939.
50 -
201
017
2.42
- 2
010
82.9
7 -
2010
183.
72 -
201
06.
25 -
201
043
.14
- 20
10
Mal
ta84
.37
- 20
1478
.44
79.9
7 -
2014
73.8
420
.48
- 20
1415
.73
70.6
68.7
5.01
- 2
014
4.61
- 2
013
544.
29 -
201
215
2.42
- 2
012
142.
97 -
201
241
.05
- 20
122.
58 -
201
231
.06
- 20
11
Mon
tene
gro
77.9
5 -
2009
80.6
673
.27
- 20
0974
.25
16.2
7 -
2010
19.7
765
.864
.25.
79 -
200
98.
18 -
200
984
6.14
- 2
009
128.
68 -
200
959
.36
- 20
0971
.77
- 20
097.
23 -
200
944
.64
- 20
09
Pola
nd81
.32
- 20
1375
.63
73.1
4 -
2013
66.5
718
.08
- 20
1314
.64
67.0
64.6
4.56
- 2
013
3.74
- 2
013
734.
31 -
201
319
5.93
- 2
013
74.9
5 -
2013
58.3
3 -
2013
7.02
- 2
013
78.9
7 -
2012
Repu
blic
of
Mol
dova
75.7
3 -
2013
72.0
268
.17
- 20
1365
.05
14.9
5 -
2013
13.9
062
.559
.59.
48 -
201
38.
19 -
201
31,
072.
44 -
201
316
4.21
- 2
013
407.
85 -
201
316
8.36
- 2
013
9.03
- 2
013
157.
64 -
201
3
Rom
ania
78.2
3 -
2012
73.0
871
.19
- 20
1266
.62
16.1
3 -
2012
14.4
165
.762
.99.
01 -
201
26.
49 -
201
390
1.31
- 2
012
183.
14 -
201
217
3.46
- 2
012
154.
66 -
201
28.
79 -
201
291
.32
- 20
12
Serb
ia77
.96
- 20
13n.
a.72
.67
- 20
13n.
a.15
.77
- 20
13n.
a.65
.362
.76.
30 -
201
35.
92 -
201
389
4.51
- 2
013
202.
90 -
201
385
.97
- 20
1310
8.73
- 2
013
5.80
- 2
013
52.3
8 -
2013
Slov
ak R
epub
lic79
.40
- 20
1075
.77
71.8
1 -
2010
66.7
816
.38
- 20
1014
.41
66.7
64.0
5.69
- 2
010
4.16
- 2
013
849.
66 -
201
019
8.52
- 2
010
260.
73 -
201
089
.77
- 20
107.
10 -
201
082
.42
- 20
10
Slov
enia
83.2
1 -
2010
77.9
076
.56
- 20
1069
.88
19.2
7 -
2010
15.6
669
.466
.02.
52 -
201
02.
40 -
201
259
9.67
- 2
010
197.
21 -
201
063
.47
- 20
1058
.09
- 20
106.
47 -
201
090
.95
- 20
10
Turk
ey81
.71
- 20
13n.
a.76
.09
- 20
13n.
a.18
.52
- 20
13n.
a.65
.460
.510
.08
- 20
138.
29 -
201
363
5.58
- 2
013
134.
86 -
201
310
1.26
- 2
013
65.7
8 -
2013
9.33
- 2
013
36.7
3 -
2013
EU83
.36
- 20
1378.66
77.7
2 -
2013
71.58
19.7
6 -
2013
16.45
70.6
68.0
3.76
- 2
013
6.09
- 2
013
577.
81 -
201
216
9.63
- 2
012
74.4
7 -
2012
47.2
0 -
2012
5.10
- 2
012
55.2
2 -
2012
EU m
emb
ers
bef
ore
May
200
484
.23
- 20
1379.78
79.0
6 -
2013
73.04
20.4
3 -
2013
17.05
71.6
69.2
3.33
- 2
013
6.46
- 2
013
516.
14 -
201
316
2.45
- 2
013
55.3
5 -
2013
34.0
8 -
2013
4.30
- 2
013
47.8
4 -
2012
Fran
ce85
.00
- 20
1581.83
78.9
0 -
2015
73.43
21.3
0 -
2015
18.69
71.8
69.5
3.70
- 2
015
11.7
3 -
2013
484.
55 -
201
116
4.33
- 2
011
28.7
0 -
2011
24.2
8 -
2011
5.59
- 2
011
61.4
5 -
2011
Ger
man
y83
.11
- 20
1378.63
78.2
4 -
2013
72.08
19.5
4 -
2013
16.36
71.1
68.9
3.30
- 2
013
5.45
- 2
013
563.
89 -
201
316
1.19
- 2
013
74.7
6 -
2013
32.6
4 -
2013
3.38
- 2
013
50.8
1 -
2013
Net
her
lan
ds
83.3
4 -
2013
80.35
79.6
9 -
2013
73.93
19.9
2 -
2013
17.05
71.4
69.0
3.76
- 2
013
3.76
- 2
013
522.
53 -
201
317
6.70
- 2
013
33.4
9 -
2013
32.0
1 -
2013
2.50
- 2
013
40.9
9 -
2012
Port
ug
al84
.13
- 20
1377.57
77.6
4 -
2013
70.61
19.9
8 -
2013
15.78
70.9
67.6
2.96
- 2
013
4.19
- 2
013
546.
91 -
201
315
3.64
- 2
013
33.9
7 -
2013
55.3
6 -
2013
5.94
- 2
013
45.0
5 -
2012
Spai
n86
.16
- 20
1380.57
80.0
2 -
2013
73.42
21.5
4 -
2013
17.54
73.2
70.5
2.74
- 2
013
4.58
- 2
013
452.
91 -
201
315
1.48
- 2
013
38.1
3 -
2013
28.1
7 -
2013
3.55
- 2
013
35.7
0 -
2012
Rat
e o
f st
and
ard
ised
mo
rtal
ity
for
all a
nd
sel
ecte
d c
ause
s(p
er 1
00,0
00 p
erso
ns)
Fem
ale
Mal
e
Life
exp
ecta
ncy
at
bir
th(y
ears
)
Life
exp
ecta
ncy
at
ag
e 65
(yea
rs)
Dis
abili
ty-a
dju
sted
lif
e ex
pec
tan
cy
(hea
lth
y lif
e ye
ars)

Financing Sustainable Health Infrastructure in CEB Target Countries 9
Chapter 2: Characteristics of healthcare systems Healthcare systems stem from specific political, historical, cultural and socio-economic traditions. As a result, the organisational arrangements for healthcare differ considerably across CEB member states, as does the allocation of capital and human resources. CEB target countries form a diversified region in terms of their healthcare systems. Although they have now each developed their own funding mechanism, similar objectives and historical developments have resulted in systems that have much in common and, for the purposes of this paper, are presented in clusters as below. The architecture of healthcare systems
Healthcare represents a collection of services, products, institutions, regulations and people. It is primarily delivered via three channels: primary, secondary and tertiary care. Primary care is the basic first level contact between individuals of all ages and health professionals
(e.g. general practitioners, nurses, etc.), usually provided at community level and covering the widest scope of healthcare, including basic curative care, child health services and preventive care.
Secondary care covers services provided by medical specialists and other health professionals who
generally do not have first contact with patients (e.g. cardiologists, dermatologists, etc.). The health care services include acute care, medical imaging services and short period stay in a hospital emergency department for brief but serious illness. The term “secondary care” is sometimes used synonymously with “hospital care”. However, many secondary care providers do not necessarily work in hospitals, such as psychiatrists, clinical psychologists or occupational therapists, and some primary care services are delivered within hospitals. Depending on the organisation and policies of the national health system, patients may be required to see a primary care provider for a referral before they can access secondary care.
Tertiary care is specialised healthcare, usually for inpatients and on referral from a primary or
secondary health professional, in facilities for advanced medical investigation and treatment, such as a tertiary referral hospital (e.g. a university hospital with teaching and research). Examples of tertiary care services are cancer management, neurosurgery, cardiac surgery, plastic surgery, treatment for severe burns, advanced neonatology services, palliative care and other complex medical and surgical interventions.
To finance a healthcare system, money has to be transferred from the population or patient – the first party – to the service provider – the second party. A third party is normally employed to pay or to provide insurance for health expenses for beneficiaries. The aim is to share the costs for medical care between the sick and those who are well and to adjust for different levels of ability to pay. This “triangle” mechanism shows that healthcare is not left to the free market alone. In this and other senses, healthcare is both a “consumption” and “investment” good, very different from other areas of the economy. Not only are third-party payment and government intervention pervasive, but the sector is also unpredictable and imperfectly understood by producers, and still less by consumers (leading to situations of asymmetric information and supplier-induced demand). None of these characteristics is unique to healthcare, but their extent and their interaction tend to make healthcare unique. Government intervention in the healthcare sector, for example, typically concerns quality, access (such as universal coverage) and externalities (such as subsidising or requiring certain vaccinations, taxing tobacco products). Licensure, accreditation and other regulations either directly or indirectly affect the entry of physicians, dentists and other medical professionals, as well as hospitals and other institutional providers. Any insurance system, whether public or private, must raise revenues, pay providers, control moral hazard6 and bear some non-diversifiable risk7.
6 In economics, “moral hazard” occurs when one person takes more risks because someone else bears the cost of those risks. Here, “moral hazard” refers to the additional healthcare that is purchased when persons become insured. For example, moral hazard occurs, when an insured person spends an extra day in the hospital or purchases some procedure that he or she would not otherwise have purchased. 7 Patricia M. Danzon (1993), Health Care Industry. The Concise Encyclopedia of Economics, 1993, Library of Economics and Liberty

Financing Sustainable Health Infrastructure in CEB Target Countries 10
Delivery and financing
Based on their various financing arrangements (see Figure 2.1), health delivery systems can be described in terms of a national health system, social insurance or private insurance model. Within each model there are various forms of financing, including general taxation, specific taxation and private financing. None of these systems excludes out-of-pocket payments (OOPs), i.e. expenditures borne directly by the patient (where neither public nor private insurance covers the full cost of the health good or service) and contingent upon people’s ability to pay. National health model, also known as the Beveridge model named after William Beveridge who was
Churchill’s Health Minister, is characterised by universal healthcare coverage of all citizens by a central government. It is financed through general tax revenues. Care providers are either owned or controlled by central and regional governments. Service distribution and provider payments are controlled by governments8. Prior to 1989, most CEB target countries operated a similar model, known as the “Semashko system” (named after Nikolai Aleksandrovich Semashko, USSR’s Public Health Commissar in the early 20th century) and described below.
Social health insurance (SHI) model, also known as the Bismarck model named after Prussian
Chancellor Otto von Bismarck, is characterised by compulsory coverage that is funded by employer, individual and private insurance funds. Factors of production are controlled and owned by government or private entities. Funding is derived from employment taxes and held in separate funds specifically for the national health program8.
Private insurance model is characterised by employment-based or individual purchase of private
health insurance financed by individual and employer contributions. Service delivery and financing are owned and managed by the private entities operating in an open market economy. Private insurance exists in most countries; however, its application is primarily for supplemental coverage for persons not covered by the national plan or for specific services excluded from the national plan8.
Figure 2.1: Healthcare financing mechanisms
Source: ILO (2014), World Social Protection Report 2014/15: Building Economic Recovery, Inclusive Development and Social Justice
8 Kulesher, R. and Forrestal, E., (2014), Journal of Hospital Administration, International models of health systems financing, 2014, Vol.3, No. 4
FINANCING MECHANISMS
COVERAGE AND ACCESS
Government-funded programmes
(BEVERIDGE MODEL)
Social, national, community-based health insurance schemes
(BISMARCK MODEL)
Private direct financing of provider services
(PRIVATE INSURANCE MODEL)
Premiums
Contributions/ payroll taxes
Out-of-pocket payments
General government
revenues
Direct taxes
Subsidies
Indirect taxes

Financing Sustainable Health Infrastructure in CEB Target Countries 11
Health systems across CEB target countries are financed and managed in different ways (see Table 2.1). The systems in post-communist countries have evolved from the extensive and centralised Semashko health model, to the SHI model, except in a few countries where the national health model or private insurance model have been implemented. Before 1990, healthcare was provided and strictly controlled by central governments. The Semashko model provided citizens with little or no choice when seeking health services and was characterised by invariant regulations operated through ministries of health. The central government functioned as the purchaser as well as the provider of health care services. There was a severe scarcity of certain forms of capital (e.g. modern technology). In contrast, the system was heavily labour-intensive and the emphasis was put on hospital care (consuming 60-75% of total expenditure on health), at the expense of marginalised primary and preventive care. Consistent with the policy of central planning, the allocation of state funds was driven by norms derived from historical levels of infrastructure and staffing, rather than by needs or outcomes9. This model is still present in Kosovo, with a few minor changes (municipalities through their health departments are responsible for public health care). Since the fall of communism, the scope and depth of reforms in the health sector have varied substantially, resulting in diverse organisational healthcare structures (see Table 2.1). Today, these systems continue to face many old problems (constrained resources, high capital costs, obsolete facilities, poor-quality primary care services, inadequate referral and overemphasis on hospital-based curative services with a lack of good equipment and drugs, inequalities in quality and equity in health care provision between regions and between different social groups, lack of responsiveness to local needs, informal payments)10 but they are also having to deal with new pressures related to fiscal consolidation, population ageing (described in Part II) and the growing prevalence of chronic lifestyle-related diseases. Table 2.1: Clustering of CEB target countries according to their funding system
Bismarck model Social health insurance (SHI) paid by employer and employee, complemented with state contributions
Sole payer system11 High out-of-pocket payments Private health insurance as a supplement
Albania, Bosnia and Herzegovina, Hungary, Montenegro, Poland, Republic of Moldova, Romania, Serbia, “the former Yugoslav Republic of Macedonia”
Sole payer system Voluntary health insurance is important
Bulgaria, Croatia, Estonia, Slovenia
Sole payer system Services provided by public and private sector facilities Private health insurance growing in importance
Turkey
Multi-payer system Czech Republic, Slovak Republic
Beveridge model Health insurance financed from general taxes
General tax and mandatory insurance premiums High out-of-pocket payments
Kosovo
Income tax and general revenues A purchaser-provider split12 and a mix of public and private providers
Latvia
General tax. High out-of-pocket payments Private sector is an important complement
Malta
Mixed systems
Public system financed from general taxes and private system financed mostly by out-of-pocket payments
Cyprus
Health insurance scheme financed by income taxes and social insurance contributions High out-of-pocket payments
Lithuania
Universal Health Coverage introduced in 2013 High out-of-pocket payments
Georgia
Source: CEB table, based on Health Systems in Transition (HiT) series of the European Observatory on Health Systems and Policies
9 WHO Regional Office for Europe, Council of Europe Development Bank (2006), Health and economic development in south-eastern Europe 10 Sowa P. M. (2016), Governance of Hospitals in Central and Eastern Europe 11 A sole payer system is characterised by universal and comprehensive coverage. 12 A purchaser-provider split is a service delivery model in which third-party payers are kept organisationally separate from service providers.

Financing Sustainable Health Infrastructure in CEB Target Countries 12
Health expenditure
Expenditure on health measures the final consumption of health goods and services. This includes spending by both public and private sources on medical services and goods, public health and prevention programmes and administration, but excludes spending on capital formation (investments). The amount that each country spends on health, for both individual and collective services, and how this changes over time can be the result of a wide array of social and economic factors, as well as the financing and organisational structures of a country’s health system. To compare spending levels between countries, per capita health expenditures are converted to a common currency (US dollar) and adjusted to take account of the different purchasing power of the national currencies (PPP$). In 2013, health spending (see Table 2.2) accounted on average for 9.5% of GDP (excluding investment) across all EU member countries (or PPP$ 3,379 per capita) and 6.8% across member states that became part of the EU after 2004 (or PPP$ 1,538 per capita). Total health expenditure as a proportion of GDP varied widely across CEB target countries, ranging from 5.3% (Romania) to 11.8% (Republic of Moldova) in 2013. Three countries, namely Bosnia and Herzegovina, the Republic of Moldova and Serbia, spent well above this EU-28 average on health. Almost half of CEB target countries spent on health services in a band between 7% and 10% of their respective GDPs. Albania, Estonia, Latvia, Lithuania and Turkey devoted around 6% of GDP to health, while Romania reported the lowest share at just over 5% of GDP. Health expenditure per capita varied in the ratio of one to four. The highest per capita spending on health for 2013 was reported in Malta (PPP$ 2,652), Slovenia (PPP$ 2,595), Cyprus (PPP$ 2,197), the Slovak Republic (PPP$ 2,147) and the Czech Republic (PPP$ 1,982). The lowest per capita spenders on health in 2013 in the CEB’s target group were Albania (PPP$ 539), the Republic of Moldova (PPP$ 553), Georgia (PPP$ 697) and “the former Yugoslav Republic of Macedonia” (PPP$ 759). Table 2.2 also shows the breakdown of health spending between public and private sources. On average, three quarters of health spending in the EU-28 comes from public resources. In CEB target countries, public spending on health is generally greater than private spending, with the exception of four countries, namely Albania (52% of health expenditure covered by the private sector), Cyprus (54%), Georgia (78%) and the Republic of Moldova (54%), where the private sector is the dominant source of healthcare financing. By contrast, public spending exceeds the EU-28 average of 76% in Croatia, the Czech Republic and Romania. There is no international standard for the ‘right’ level of public spending on health, nor any single measure that indicates whether or not public spending levels are adequate to meet population health needs. Nevertheless, evidence shows that a low level of public spending on health is likely to lead to problems of access13. Growing reliance on out-of-pocket payments (OOPs) is one of the major trends that have characterised post-communist healthcare transition. It has materialised in the form of formal fees and informal payments and shifted the provision of certain services outside the public system to individually financed spot market purchase. This process has been reinforced by a growing willingness to pay for services of higher quality14. Unlike in France (33%) or in the Netherlands (42%), direct OOPs represent a significant if not total share of the private sector health expenditure in many CEB target countries, potentially creating financial barriers to healthcare, particularly for low-income households and other disadvantaged social groups such as the unemployed, the elderly and the chronically ill.
13 Expert Panel on Effective Ways of Investing in Health (2015), Access to health services in the European Union, September 2015 14 Sowa P. M. (2016), Governance of Hospitals in Central and Eastern Europe

Financing Sustainable Health Infrastructure in CEB Target Countries 13
Table 2.2: Health expenditure, 2013
Source: World Health Organization Regional Office for Europe, European Health for All Database (HFA-DB), updated in December 2015. http://data.euro.who.int/hfadb/ accessed on 28 January 2016. Note: Kosovo is not included in the database.
Tota
l exp
end
itu
re o
n
hea
lth
as
% o
f G
DP
(WH
O e
stim
ates
)
Pub
lic-s
ecto
r ex
pen
dit
ure
o
n h
ealt
h a
s %
of
GD
P (W
HO
est
imat
es)
Pri
vate
-sec
tor
exp
end
itu
re
on
hea
lth
as
% o
f G
DP
(WH
O e
stim
ates
)
Priv
ate
ho
use
ho
lds'
o
ut-
of-
po
cket
pay
men
tso
n h
ealt
h a
s %
of
pri
vate
-se
cto
r h
ealt
h e
xpen
dit
ure
Tota
l hea
lth
exp
end
itu
re,
PPP$
per
cap
ita
(WH
O e
stim
ates
)
Alb
ania
5.9
2.9
3.0
99.7
539.
3
Bosn
ia a
nd H
erze
govi
na9.
66.
72.
996
.992
8.5
Bulg
aria
7.6
4.5
3.1
97.3
1 21
2.5
Cro
atia
7.3
5.8
1.5
62.4
1 51
6.9
Cyp
rus
7.4
3.5
4.0
86.5
2 19
7.0
Cze
ch R
epub
lic7.
26.
01.
294
.11
981.
8
Esto
nia
5.7
4.5
1.3
85.4
1 45
2.6
Geo
rgia
9.4
2.0
7.4
78.9
697.
0
Hun
gary
8.1
5.1
2.9
75.5
1 83
9.0
Kos
ovo
n.a.
n.a.
n.a.
n.a.
n.a.
Latv
ia5.
73.
52.
295
.71
310.
4
Lith
uani
a6.
24.
22.
197
.61
578.
7
FYR
Mac
edon
ia6.
44.
42.
010
0.0
758.
7
Mal
ta8.
75.
83.
093
.02
651.
9
Mon
tene
gro
6.5
3.7
2.8
100.
092
6.4
Pola
nd6.
74.
62.
075
.01
550.
7
Repu
blic
of
Mol
dova
11.8
5.4
6.4
82.6
553.
4
Rom
ania
5.3
4.3
1.1
97.0
988.
2
Serb
ia10
.66.
44.
296
.098
6.9
Slov
ak R
epub
lic8.
25.
82.
573
.92
146.
6
Slov
enia
9.2
6.6
2.6
42.7
2 59
5.2
Turk
ey5.
64.
31.
366
.31
053.
5
EU-2
89.
57.
32.
266
.33
378.
5
EU m
emb
ers
bef
ore
May
200
10.3
7.9
2.3
61.8
3 87
0.8
EU m
emb
ers
sin
ce M
ay 2
004
6.8
4.8
1.9
83.0
1 53
8.4
Fran
ce
11.7
9.0
2.6
32.9
4 33
3.6
Ger
man
y11
.38.
72.
655
.64
811.
8
Net
her
lan
ds
12.9
10.3
1.7
41.7
5 60
1.1
Port
ug
al9.
76.
33.
475
.42
507.
8
Spai
n8.
96.
32.
677
.12
845.
7

Financing Sustainable Health Infrastructure in CEB Target Countries 14
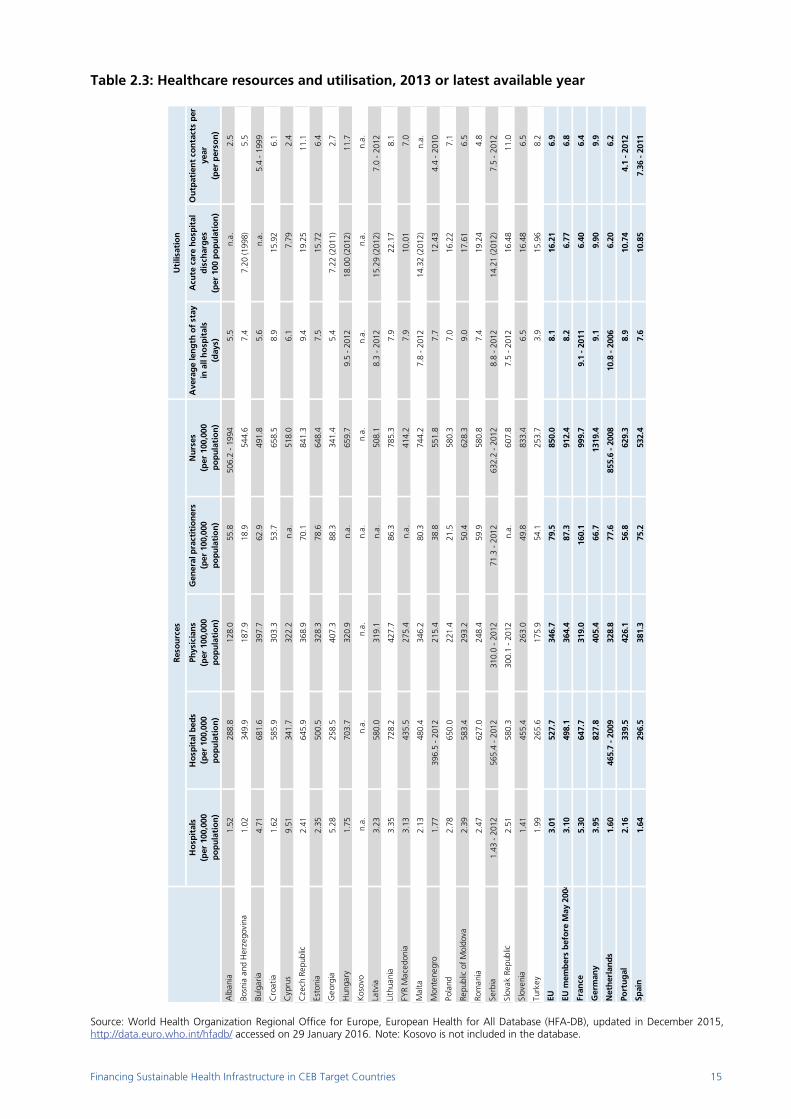
Resources and their utilisation
The allocation of healthcare resources differs considerably between healthcare systems as does their utilisation by the population they serve. Each health service is complex in this regard. Resources and facilities range from large hospitals to single room clinics, from specialist surgeons to chiropodists. On the one hand, the number of doctors and nurses per capita varies widely across CEB target countries (see Table 2.3 - resources). The numbers of physicians vary by a factor of more than three between the highest (Georgia, Bulgaria) and lowest (Albania, Turkey) levels, the number of general practitioners by more than four (Georgia, Lithuania vs. Bosnia and Herzegovina, Poland) and the number of nurses (Czech Republic, Slovenia vs. Turkey) by approximately four. On the other hand, Table 2.3 indicates that several CEB target countries continue to have a relatively high number of hospital beds, reflecting an excessive focus on healthcare provided in hospitals (inherited from the Semashko systems). Prior to 1989, these countries had the highest numbers of hospitals and hospital beds per unit of population and the longest lengths of stay in hospitals in the world. In 2013, the number of inpatient hospital beds per thousand population was highest in Hungary (7.04), Bulgaria (6.82), Poland (6.50), the Czech Republic (6.46) and Romania (6.27) and lowest in Georgia (2.58), Turkey (2.66) and Albania (2.89), compared with the EU-28 average of 5.3. In terms of utilisation, the average length of stay in hospitals (ALOS) is often regarded as an indicator of efficiency. In 2013, ALOS for all causes across EU member countries was about 8 days. It was above this EU average in Hungary, Croatia, the Czech Republic, Latvia, the Republic of Moldova and Serbia but has decreased in nearly all countries over the past two decades. It was particularly low in Turkey (3.9), Georgia (5.4) and Albania (5.5). Outpatient contacts per person per year represent the number of consultations in primary care facilities or patients’ own homes. In 2013, the number was highest in Hungary (12), the Czech Republic (11.1) and the Slovak Republic (11), well above the EU-28 average of 7 consultations per person per year, while it was lowest in Cyprus (2.4), Albania (2.5) and Georgia (2.7). Cultural factors appear to play a role in explaining some of these cross-country variations, although certain health system characteristics may be even more important factors.
Box 2: Regionalisation of health services in the Republic of Moldova
The National Health Policy 2007–2021 and the Health System Development Strategy 2008–2017 are the main policy documents, approved in 2007 and amended in 2015, driving health reforms in the Republic of Moldova. The reforms cover several key areas: public health, service provision, health system financing and resource generation. Together with other IFIs and donors, the CEB has supported the implementation of these reforms (see Case Study 2). The “regionalisation” of the healthcare network has been among the top priorities of this comprehensive health reform. The objective has been to: i) “decentralise” primary healthcare throughout the country, with the highest degree of accessibility and continuity of health services, by creating modern physical infrastructure, with appropriate equipment, consumables, essential drugs and skilled medical staff, and ii) “regionalise” specialised healthcare and restructure the network of public hospitals, with a focus on the efficiency of the network and on the quality of the health services provided in line with population needs. The most important actions implemented within the hospital care reform are related to the creation of the Republican Clinical Hospital in Chisinau, presented in Case Study 2. Sources: Ministry of Health of the Republic of Moldova, European Observatory on Health Systems and Policies
Financing Sustainable Health Infrastructure in CEB Target Countries 15
Table 2.3: Healthcare resources and utilisation, 2013 or latest available year
Source: World Health Organization Regional Office for Europe, European Health for All Database (HFA-DB), updated in December 2015, http://data.euro.who.int/hfadb/ accessed on 29 January 2016. Note: Kosovo is not included in the database.
Ho
spit
als
(per
100
,000
p
op
ula
tio
n)
Ho
spit
al b
eds
(per
100
,000
p
op
ula
tio
n)
Phys
icia
ns
(per
100
,000
p
op
ula
tio
n)
Gen
eral
pra
ctit
ion
ers
(per
100
,000
p
op
ula
tio
n)
Nu
rses
(p
er 1
00,0
00
po
pu
lati
on
)
Ave
rag
e le
ng
th o
f st
ay
in a
ll h
osp
ital
s(d
ays)
Acu
te c
are
ho
spit
al
dis
char
ges
(p
er 1
00 p
op
ula
tio
n)
Ou
tpat
ien
t co
nta
cts
per
ye
ar(p
er p
erso
n)
Alb
ania
1.52
288.
812
8.0
55.8
506.
2 -
1994
5.5
n.a.
2.5
Bosn
ia a
nd H
erze
govi
na1.
0234
9.9
187.
918
.954
4.6
7.4
7.20
(199
8)5.
5
Bulg
aria
4.71
681.
639
7.7
62.9
491.
85.
6n.
a.5.
4 -
1999
Cro
atia
1.62
585.
930
3.3
53.7
658.
58.
915
.92
6.1
Cyp
rus
9.51
341.
732
2.2
n.a.
518.
06.
17.
792.
4
Cze
ch R
epub
lic2.
4164
5.9
368.
970
.184
1.3
9.4
19.2
511
.1
Esto
nia
2.35
500.
532
8.3
78.6
648.
47.
515
.72
6.4
Geo
rgia
5.28
258.
540
7.3
88.3
341.
45.
47.
22 (2
011)
2.7
Hun
gary
1.75
703.
732
0.9
n.a.
659.
79.
5 -
2012
18.0
0 (2
012)
11.7
Kos
ovo
n.a.
n.a.
n.a.
n.a.
n.a.
n.a.
n.a.
n.a.
Latv
ia3.
2358
0.0
319.
1n.
a.50
8.1
8.3
- 20
1215
.29
(201
2) 7
.0 -
201
2
Lith
uani
a3.
3572
8.2
427.
786
.378
5.3
7.9
22.1
78.
1
FYR
Mac
edon
ia3.
1343
5.5
275.
4n.
a.41
4.2
7.9
10.0
17.
0
Mal
ta2.
1348
0.4
346.
280
.374
4.2
7.8
- 20
1214
.32
(201
2)n.
a.
Mon
tene
gro
1.77
396.
5 -
2012
215.
438
.855
1.8
7.7
12.4
34.
4 -
2010
Pola
nd2.
7865
0.0
221.
421
.558
0.3
7.0
16.2
27.
1
Repu
blic
of
Mol
dova
2.39
583.
429
3.2
50.4
628.
39.
017
.61
6.5
Rom
ania
2.47
627.
024
8.4
59.9
580.
87.
419
.24
4.8
Serb
ia1.
43 -
201
256
5.4
- 20
1231
0.0
- 20
1271
.3 -
201
263
2.2
- 20
128.
8 -
2012
14.2
1 (2
012)
7.5
- 20
12
Slov
ak R
epub
lic2.
5158
0.3
300.
1 -
2012
n.a.
607.
87.
5 -
2012
16.4
811
.0
Slov
enia
1.41
455.
426
3.0
49.8
833.
46.
516
.48
6.5
Turk
ey1.
9926
5.6
175.
954
.125
3.7
3.9
15.9
68.
2
EU3.
0152
7.7
346.
779
.585
0.0
8.1
16.2
16.
9
EU m
emb
ers
bef
ore
May
200
43.
1049
8.1
364.
487
.391
2.4
8.2
6.77
6.8
Fran
ce
5.30
647.
731
9.0
160.
199
9.7
9.1
- 20
116.
406.
4
Ger
man
y3.
9582
7.8
405.
466
.713
19.4
9.1
9.90
9.9
Net
her
lan
ds
1.60
465.
7 -
2009
328.
877
.685
5.6
- 20
0810
.8 -
200
66.
206.
2
Port
ug
al2.
1633
9.5
426.
156
.862
9.3
8.9
10.7
44.
1 -
2012
Spai
n1.
6429
6.5
381.
375
.253
2.4
7.6
10.8
57.
36 -
201
1
Res
ou
rces
Uti
lisat
ion

Financing Sustainable Health Infrastructure in CEB Target Countries 16
Access to healthcare
The World Health Organization (WHO) defines accessibility as “a measure of the proportion of the population that reaches appropriate health services”. Closely linked to their affordability, physical accessibility and acceptability, access to health services (including health prevention and promotion) means that people get appropriate health resources in order to protect or improve their health. However, legal, social, financial, geographic and cultural barriers can limit the availability and affordability of health services for certain groups. While most CEB target countries have universal or near-universal coverage15 of healthcare costs for a core set of services, access to health services can be prevented for a number of reasons, related either to the functioning of the system itself (e.g. the cost of a visit or treatment, the distance to the closest healthcare facility, waiting lists) or to personal reasons (e.g. fear, not having the time to seek care, cultural belief, discrimination). For non-native speakers, language can be an obstacle for those seeking to access services, while barriers to healthcare may also result from poor understanding or a lack of knowledge with respect to patient’s rights and to the administrative practices and requirements of a given system. According to Eurostat (see Figure 2.2), close to 7% of the EU-28 population had an unmet need for a medical examination or treatment in 2013 and about half of them were related to the organisation of health services. Across CEB target countries, this share ranged from 0.2% in Slovenia to 20% in Latvia. It was above the EU average in all CEB target countries, excepting Cyprus, the Czech Republic, Lithuania, Malta and the Slovak Republic. Figure 2.2: Share of persons aged 16 and over reporting unmet needs for medical care, 2013
Source: Eurostat, (hlth_silc_03) and (hlth_silc_08), accessed on 27 January 2016 Note: Albania, Georgia, Kosovo, Republic of Moldova and Turkey are not included in the database. As regards reasons related to the organisation and functioning of healthcare services - financial reasons (too expensive), timeliness (long waiting lists) or transportation (too far to travel) - 3.6% of the EU-28 population reported they had unmet needs. Across CEB target countries, this share ranged from 1% in Malta and the Czech Republic to 14% in Latvia. Bulgaria, Estonia, Poland, Montenegro, Romania, Serbia and “the former Yugoslav Republic of Macedonia” reported around 10% of their population with unmet care needs for reasons related to the functioning of the system itself. First, the most common reason for not having a medical examination or treatment was that it was too expensive. Unmet care needs were particularly high for low-income households and other socially disadvantaged groups, mostly including the elderly and the unemployed. The increasing roles of private health insurance and (formal and informal) out-of-pocket payments have contributed to inequalities in access to health services, particularly for these social groups.
15 According to the ILO (2014), 92% of the population was affiliated to national health services, social, private or micro-insurance schemes in 2012,
compared with 99.7% in Western Europe.
0
5
10
15
20
25
EU-2
8
Slov
enia
Aus
tria
Net
herla
nds
Mal
ta
Belg
ium
Uni
ted
Kin
gdom
Irela
nd
Luxe
mbo
urg
Cze
ch R
epub
lic
Lith
uani
a
Port
ugal
Slov
ak R
epub
lic
Cyp
rus
Den
mar
k
Finl
and
Ger
man
y
Fran
ce
Spai
n
Hun
gary
Italy
Cro
atia
Esto
nia
Gre
ece
Bulg
aria
Rom
ania
Swed
en
Pola
nd
Latv
ia
Nor
way
Switz
erla
nd
Icel
and
FYR
Mac
edon
ia
Mon
tene
gro
Serb
iaOther reasons
Too expensive, too far to travel and waiting lists

Financing Sustainable Health Infrastructure in CEB Target Countries 17
Second, a waiting list hindering a medical examination or treatment was the most frequent reason given for unmet medical needs in Estonia, Poland and Lithuania. Third, access to healthcare requires adequate numbers and proper distribution of doctors and facilities in all parts of the country. Any shortage in certain regions can increase travel times or waiting times for patients and result in unmet care needs. Across CEB target countries, uneven geographical coverage and provision of healthcare is another obstacle to accessing to healthcare services, especially in sparsely populated, remote and rural areas lacking not only basic and/or specialised healthcare services, but also accessible and affordable transport. According to Eurostat, this reason was frequently given for unmet care needs in Bulgaria, Romania and the Western Balkan countries. This geographic misbalance is strongly related to the post-socialist inheritance of the predominance of large hospitals in capital and densely populated cities and in capital regions.
*** Analysis has so far shown that over the last two decades, healthcare systems in all CEB target countries have “transitioned” to today’s quite heterogeneous systems in terms of their organisation, financing and performance. While some countries tend to perform rather well, close to Western European standards, others continue to face many old problems inherited from the Semashko model. All these systems are nevertheless challenged (to varying degrees) by new pressures related to fiscal consolidation, population ageing and the growing incidence of chronic diseases. This broad presentation of healthcare systems in Part I allows for a better understanding of the sectoral context for CEB activities in its target countries presented in Part III. Part III shows how the CEB has been assisting its target countries in improving their healthcare infrastructure and in addressing short and longer term challenges related to healthcare provision and financing (to be analysed in Part II). The Bank’s diverse experience and social value in financing projects in the health sector are presented in Chapter 6. The unique characteristics and complexities of health projects, when compared to other social infrastructure projects, are described in Chapter 7.

Financing Sustainable Health Infrastructure in CEB Target Countries 18
PART II: Trends and challenges in healthcare provision and financing
Significant demographic and economic pressures on healthcare systems are expected over the coming years. On the one hand, healthcare systems will have to address a multitude of challenges resulting from an ageing population, growth in (expensive) chronic diseases, technological advances and medical innovation, and consumer expectations of affordable and high-quality care. In particular, health systems will need to find solutions through new technologies, products and organisational changes which depend on a high quality health workforce of sufficient capacity and with the right skills to meet the growing demand for healthcare. On the other hand, these trends will create substantial new costs for both providers and receivers of healthcare and will challenge the fiscal sustainability of public health systems. Thus, additional private sources of funding will be required to continue to be able to fund healthcare in the future. This part presents some of the trends that are likely to reshape healthcare provision and financing across CEB target countries in the near future. Chapter 3: Adapting the health workforce and their skills to evolving needs Healthcare is highly labour-intensive and one of the largest economic sectors (e.g. in the EU, accounting for nearly 10% of all jobs in 201316). Health human resources are crucial for healthcare, and better workforce management is increasingly recognised as an important policy issue. The future health workforce needs to be congruent with new healthcare needs resulting from demographic, epidemiologic and socio-cultural changes. Due to the above-mentioned factors, health sector employment is expected to grow over the next ten years across most CEB member countries16, with population ageing (described in Chapter 4) likely to be the biggest demand-side contributor to this growth. In effect, demographic changes will have significant consequences on the way in which healthcare systems respond to patient needs. The increasing numbers of elderly people with multiple chronic conditions will require new treatments and new care delivery models, and will necessitate changes in skill mixes and new ways of working for health professionals. On the supply side, the healthcare sector in CEB target countries faces the following challenges: an ageing health workforce with insufficient new recruits to replace retirees
significant employee turnover in some fields due to demanding working conditions, relatively low remuneration and high outward migration
the growing need for new skills to deal with new technologies on the one hand, and with the rise in chronic conditions, on the other.
First, like the rest of the population, the health workforce in CEB target countries is also ageing (see Chapter 4). For example, more than 40% of the healthcare workforce in Bulgaria and the Baltic states is between 50 and 64, which is significantly higher than the EU average. In the EU, an estimated 1.8 million health professionals will be required by 2025, mostly to replace existing workers who will be leaving or retiring from the workforce. This retirement bulge risks not being offset by a sufficient number of new healthcare professionals. Several countries are already facing critical workforce shortages in certain health professions, medical specialisations and/or geographic areas17. For example, the Slovak Republic has insufficient nurses, midwives, physiotherapists, radiological assistants and paramedics. Bulgaria faces an acute shortage of nurses and medical specialists (in particular of anaesthetists, gynaecologists and paediatricians). Hungary faces a shortage of public health physicians and serious bottlenecks in supply caused by a reduction in nurse training. Unfilled specialist training places are reported in Romania18. There are also shortages due
16 EU Skills Panorama (2014) Health professionals Analytical Highlight, prepared by ICF and Cedefop for the European Commission 17 European Commission (2012), Commission Staff Working Document on an Action Plan for the EU Health Workforce, 18 April 2012, SWD (2012) 93 final 18 M. Wismar, C. B. Maier, I. A. Glinos, G. Dussault and J. Figueras (eds., 2011), Health professional mobility and health systems. Evidence from 17 European countries, Observatory Study Series No. 23, European Observatory on Health Systems and Policies, WHO Regional Office for Europe, Copenhagen.
Financing Sustainable Health Infrastructure in CEB Target Countries 19
to high drop-out rates of people undertaking medical studies on account of their long duration (for example, in Lithuania, 20% of all students starting medical studies and 15% of midwifery students). Other countries also face the challenge of shortages caused by an unequal regional distribution of health professionals within their country (aggravated by the trend of “rural to urban migration”), raising serious concerns over the availability of healthcare in rural, economically deprived and remote areas, for example in Albania, Romania and Turkey. Labour mobility and the emigration of health workers from CEB target countries19 to higher-income Western European and non-European countries (such as the US, Canada, Australia and New Zealand) have significantly affected the supply of health services in some of the sending countries (e.g. Hungary, Lithuania, Poland, Republic of Moldova, Romania, Slovak Republic) over the past decade20. Although it is very difficult to predict the outflow of health professionals from CEB target countries over the coming years, this trend is expected to continue, mainly due to economic motivations for the migration of doctors and nurses in these countries and due to the shortage of doctors and nurses in the destination higher-income countries. Faced with growing shortages of health professionals, some countries in Europe and elsewhere (e.g. Canada, U.S., United Kingdom, Netherlands, Finland, Australia, India and Malaysia) are increasingly reassigning certain procedures normally performed by physicians to nurses with advanced training. This “task-shifting” looks promising to policy makers to address workforce shortage and to meet the increasing demand for affordable healthcare. However, it remains to be seen in the coming years to what extent it could be implemented in CEB target countries, given their regulatory frameworks, education and training systems, financing structures, cultural context and public perception. Second, evidence from some countries shows increasing turnover in health professions. Relatively lower remuneration levels than in other economic sectors, but also non-financial factors such as long working hours, stress or difficult work-life balance constitute reasons for healthcare workers to leave their jobs. The issue of work-life balance is all the more relevant in the healthcare sector in so far as the participation of women in the workforce has historically been significant and is still rising. This issue is likely to increase the difficulties of retaining the healthcare workforce in the future. New health workers will have to be recruited from a smaller pool of young people (given the changing population structure described in Chapter 4), whose expectations and behaviours differ from those of the generation that is retiring: they have higher expectations for the balance between work and life. They also aspire to a professional life that allows for continuous learning and skill development and tend to be more mobile and better prepared to shift work environments and move from one country to another. Third, changes in how healthcare services are organised and delivered to meet the needs of Europe’s (ageing) population and to reflect greater specialisation are expected to lead to the up-skilling of existing health occupations and to new skills requirements. These include: The development of new integrated care delivery models with a shift from care in hospitals to the
delivery of primary care closer to home, to cope with patients with (multiple) chronic conditions, such as heart disease and diabetes, requires different skill mixes, task-shifting and new ways of working within wider cross-specialist teams.
Bioscience, technology and pharmaceuticals are improving the understanding of the human body and
mind, and the ways in which injuries, conditions and diseases can be prevented and treated. Health professionals will be required to keep abreast of these developments as they manifest themselves in new equipment, treatments and prevention.
New technologies, new medical appliances and diagnostic techniques require technical expertise in
addition to clinical knowledge. The expansion of e-health and telemedicine, which enables distance diagnostics and other services (particularly useful in remote areas), also requires doctors to work beyond the boundaries of face-to-face counselling, creating new ways of communicating with patients and associated skill needs.
19 According to the National Health Information Centre, among the 46,000 registered nurses in the Slovak Republic, around 20,000 work abroad. 20 European Foundation for the Improvement of Living and Working Conditions (2013), Mobility and migration of healthcare workers in Central and Eastern Europe. It is difficult to assess the impacts of such outflows on health systems of the sending countries since an analysis would be needed to show what would have happened if they had not left the country.

Financing Sustainable Health Infrastructure in CEB Target Countries 20
Other competencies that are generally – and increasingly – associated with the sector include the need for communication skills in non‑native languages, capacity to deal with physical and mental stress, ability to empathise with patients and ability to work as part of a multi-disciplinary team.
Last but not least, health services will be developing more customer-focused approaches, in particular, creating more choice in healthcare delivery. As most health services are publicly funded in CEB target countries, political and legislative changes will undoubtedly affect the ways in which health professionals deliver their services, and the skills and competencies they require in the coming years.
As a consequence, CEB target countries will need to adjust their education and training curricula to fast moving changes in healthcare and to equip people with the right skills for the job market and improve their employability. These changes will require increased coordination between education/training providers and employment to assess and anticipate the different mix of skills and competencies needed in the healthcare sector in the future. Developing cohesive policies in education and training will be crucial to ensure that the healthcare workforce is knowledgeable, skilled, competent and engaged in lifelong learning. In the face of such trends and challenges, the CEB can provide financing for education and training programmes and job creation projects targeted to these new job roles and skills requirements in the health sector. Furthermore, the CEB can support education programmes focused on the prevention and control of lifestyle-related diseases (e.g. overweight and obesity among children and young people) and behaviours (e.g. tobacco and alcohol consumption), given their increasing incidence.

Financing Sustainable Health Infrastructure in CEB Target Countries 21
Chapter 4: Changing demographics Population ageing21 is one of the most significant demographic and social trends of the 21st century, affecting nearly all the countries in the world. In the context of ageing baby-boomers, declining fertility rates and increasing life expectancies, older people are coming to represent a proportionately larger share of the total population. This global trend is expected to be particularly pronounced in the EU-28 and in CEB member countries. The CEB’s study on ageing populations in Europe (2014)22 showed that the age composition of the population in CEB member countries is likely to transition to a significantly older structure, with the population pyramid becoming more rhomboid than triangular. Those aged 15-64 are projected to become a substantially smaller share of the population (see Table 4.1), declining by 9 percentage points to 56% by 2060, while those aged 65+ are likely to become a much larger share, almost doubling to 29% and representing about 160 million individuals. The old-age dependency ratio (calculated as the relative size of the older population aged 65+ compared with the working age population aged 15-64) is projected to more than double to 52. This implies that CEB member countries are expected to move from having four working-age people for every person aged 65+ to only two. One of the findings of the study is that the ageing phenomenon is expected to gradually shift eastwards. CEB member states that are relatively “young” today, mainly in Central, Eastern and South-Eastern Europe or “CEB target countries”, are likely to report a significant and rapid increase in their median age in the near- and medium-term (see Figure 4.1). Figure 4.1: CEB countries above or below the average median age in 2010 and 2060
Source: CEB (2014), Ageing Populations in Europe: Challenges and Opportunities for the CEB, Chapter 1, p. 20 The shares of their population aged 65+ and those aged 80+ (the so-called “oldest old” or “frail elderly”) are expected to triple (see Table 4.1): from 12% in 2010 to 28% by 2060 for those aged 65+ and from 3% in 2010 to 9% by 2060 for the oldest old. At the same time, the share of the economically active population across CEB target countries is expected to decline (from 69% in 2010 to 58% by 2060), thus affecting the supply of labour in the economy and the financing of social protection systems. The old-age-dependency ratio is projected to increase dramatically, from 17% in 2010 to 48% by 2060. CEB target countries would have only two, instead of six, persons of working age for every dependent aged over 65. Although the pressure that this growing proportion of people aged 65+ and 80+ will put on long-term care systems will depend on the health status of people as they reach these ages, the CEB’s study demonstrates that the ageing phenomenon is expected to lead to a burgeoning, yet heterogeneous, demand for different types of eldercare infrastructure and services. This demand is likely to depend on adaptations to welfare state systems triggered by fiscal restructuring and shifting societal preferences towards “ageing in place” and home care. It could also be affected by the growing diversity among older Europeans, particularly the oldest-old (80+) and women, in terms of income, health and disability status, access to informal support and (unmet) care needs.
21 Population ageing is the process whereby older individuals become a proportionately larger share of the total population. Individual ageing is the process of individuals growing older. Source: UNFPA, Ageing in the Twenty-First Century: a Celebration and a Challenge, 2012. 22 CEB (2014), Ageing Populations in Europe: Challenges and Opportunities for the CEB.

Financing Sustainable Health Infrastructure in CEB Target Countries 22
Table 4.1: Population projections by age, 2010-2060
Source: CEB (2014), Ageing Populations in Europe: Challenges and Opportunities for the CEB, Statistical Annex, Table 1
2010
2020
2030
2040
2050
2060
2010
-206
0 20
1020
6020
1020
6020
1020
6020
1020
60
Alb
ania
3.15
3.24
3.31
3.25
3.09
2.93
-0.2
223
%14
%67
%56
%10
%30
%2%
9%
Bel
giu
m10
.94
11.3
611
.66
11.8
912
.06
12.1
61.
2117
%17
%66
%57
%17
%26
%5%
10%
Bo
snia
an
d H
erze
go
vin
a3.
853.
793.
703.
543.
333.
13-0
.72
17%
13%
68%
56%
15%
31%
2%10
%
Bu
lgar
ia7.
396.
836.
215.
615.
084.
57-2
.82
13%
15%
68%
55%
18%
30%
4%10
%
Cro
atia
4.34
4.18
4.02
3.82
3.61
3.39
-0.9
415
%14
%67
%56
%18
%30
%4%
11%
Cyp
rus
1.10
1.22
1.31
1.35
1.36
1.34
0.23
18%
14%
71%
56%
12%
30%
3%10
%
Cze
ch R
epu
bli
c10
.55
10.9
211
.05
11.1
011
.22
11.2
20.
6714
%16
%70
%57
%15
%28
%4%
10%
Den
mar
k5.
555.
786.
016.
206.
366.
530.
9818
%17
%65
%63
%17
%20
%4%
5%
Esto
nia
1.30
1.26
1.21
1.16
1.12
1.08
-0.2
215
%16
%67
%57
%17
%27
%4%
9%
Fin
lan
d5.
375.
545.
655.
675.
695.
730.
3717
%16
%66
%57
%17
%27
%5%
10%
Fran
ce63
.23
66.5
769
.29
71.5
273
.21
74.6
411
.40
18%
17%
65%
57%
17%
26%
5%11
%
Geo
rgia
4.39
4.20
3.95
3.74
3.56
3.42
-0.9
717
%16
%68
%57
%14
%27
%3%
8%
Ger
man
y83
.02
81.8
879
.55
76.3
572
.57
68.4
2-1
4.60
13%
13%
66%
54%
21%
33%
5%14
%
Gre
ece
11.1
111
.08
10.9
810
.86
10.6
710
.33
-0.7
815
%14
%66
%55
%19
%31
%5%
14%
Hu
ng
ary
10.0
19.
809.
539.
218.
958.
68-1
.34
15%
15%
69%
58%
17%
27%
4%9%
Icel
and
0.32
0.35
0.38
0.40
0.42
0.42
0.10
21%
16%
67%
58%
12%
26%
3%10
%
Irel
and
4.47
4.96
5.35
5.69
5.99
6.19
1.73
21%
17%
67%
58%
11%
25%
3%10
%
Ital
y60
.51
61.3
961
.21
60.8
160
.01
58.5
0-2
.01
14%
14%
66%
54%
20%
32%
6%16
%
Latv
ia2.
091.
971.
861.
751.
671.
61-0
.48
14%
17%
67%
58%
18%
25%
4%7%
Lith
uan
ia3.
072.
942.
822.
682.
562.
44-0
.63
15%
17%
69%
57%
16%
26%
3%7%
Luxe
mb
ou
rg0.
510.
580.
640.
680.
710.
720.
2118
%16
%68
%59
%14
%25
%4%
10%
Mal
ta0.
420.
440.
440.
430.
420.
40-0
.02
16%
13%
70%
55%
14%
33%
2%12
%
Mo
ldo
va3.
573.
323.
072.
772.
482.
26-1
.31
17%
14%
72%
59%
11%
27%
2%5%
Mo
nte
neg
ro0.
620.
620.
610.
590.
560.
53-0
.09
19%
15%
68%
60%
12%
25%
2%7%
Net
her
lan
ds
16.6
217
.03
17.2
717
.22
16.9
216
.60
-0.0
118
%16
%67
%57
%15
%27
%4%
11%
No
rway
4.89
5.41
5.84
6.21
6.56
6.87
1.97
19%
18%
66%
59%
15%
24%
5%9%
Pola
nd
38.2
038
.16
37.4
535
.84
34.0
832
.31
-5.8
915
%15
%71
%54
%14
%32
%3%
11%
Port
ug
al10
.59
10.5
810
.43
10.2
19.
849.
33-1
.26
15%
12%
67%
53%
18%
35%
5%16
%
Ro
man
ia21
.86
21.2
320
.23
19.0
617
.81
16.4
3-5
.43
15%
14%
70%
55%
15%
31%
3%10
%
Serb
ia9.
659.
178.
587.
867.
076.
30-3
.35
17%
13%
69%
55%
14%
32%
3%10
%
Slo
vak
Rep
ub
lic
5.43
5.47
5.40
5.20
4.99
4.74
-0.6
915
%14
%73
%55
%12
%30
%3%
10%
Slo
ven
ia2.
052.
092.
092.
062.
021.
97-0
.09
14%
14%
69%
55%
17%
30%
4%12
%
Spai
n46
.18
47.7
948
.24
48.5
048
.22
46.7
60.
5815
%13
%68
%53
%17
%34
%5%
16%
Swed
en9.
3810
.03
10.6
911
.27
11.9
312
.59
3.21
17%
18%
65%
58%
18%
24%
5%9%
Swit
zerl
and
7.83
8.65
9.48
10.2
310
.98
11.6
53.
8215
%16
%68
%58
%17
%26
%5%
10%
"th
e fo
rmer
Yu
go
slav
R
epu
bli
c o
f M
aced
on
ia"
2.10
2.11
2.07
1.99
1.88
1.76
-0.3
417
%13
%71
%56
%12
%31
%2%
9%
Turk
ey72
.14
80.3
186
.83
91.7
894
.61
95.3
323
.19
27%
15%
66%
60%
7%25
%1%
8%
TOTA
L C
EB54
7.81
562.
2556
8.37
568.
5156
3.61
553.
275.
4617
%15
%67
%56
%16
%29
%4%
11%
EU-2
850
5.77
515.
4051
8.19
516.
3551
1.56
502.
81-2
.96
16%
15%
67%
56%
18%
29%
5%12
%
CEB
Tar
get
co
un
trie
s20
7.29
213.
2721
5.71
214.
7921
1.47
205.
83-1
.46
19%
15%
69%
58%
12%
28%
3%9%
CEB
Tar
get
coun
trie
s w
ithou
t Tu
rkey
135.
1613
2.96
128.
8812
3.01
116.
8611
0.50
-24.
6515
%15
%70
%55
%15
%30
%3%
10%
CEB
No
n-t
arg
et c
ou
ntr
ies
340.
5134
8.98
352.
6635
3.72
352.
1434
7.43
6.92
15%
15%
66%
55%
18%
30%
5%13
%C
EB N
on-t
arge
t w
ithou
t G
erm
any
257.
4926
7.10
273.
1127
7.37
279.
5727
9.02
21.5
216
%15
%66
%56
%18
%29
%5%
13%
WO
RLD
6 91
6.18
7 71
6.75
8 42
4.94
9 03
8.69
9 55
0.94
9 95
7.40
3 04
1.22
27%
20%
66%
62%
8%18
%2%
5%
Pro
ject
ion
of
the
tota
l p
op
ula
tio
n (
in m
illio
n)
Refe
renc
e da
te (
as o
f 1
July
)
Dec
om
po
siti
on
of
po
pu
lati
on
by
age
gro
up
s (%
of
tota
l pop
ulat
ion)
Refe
renc
e da
te (
as o
f 1
July
)
0-14
15-6
465
+80
+

Financing Sustainable Health Infrastructure in CEB Target Countries 23
Over the coming decades, it is expected that older people will have different needs as they age more healthily (see Table 1.1) and more actively than previous generations. There will be a clear need to help healthy older people remain productive and independent and to ensure that those who are frail or disabled receive care and support so that they can live in their communities for as long as possible. This has wide-ranging implications for the development of elderly-friendly products and services, environments and activities. The availability, accessibility and affordability of adequate infrastructure and services for the elderly will therefore be crucial to ensuring decent living conditions for the older populations and countries will have to secure adequate care for the elderly by providing a balance of home-based, community-based and hospital-based services. The provision of such infrastructure and services should therefore be carefully considered in a longer-term and demand-driven perspective. The CEB can contribute to addressing some of these needs. Based on its mandate and experience, various types of investment could be envisaged: providing old-age specific health infrastructure (including formal long-term care infrastructure; described below), adapting housing as well as urban and rural living spaces to suit the needs of the elderly, enhancing energy efficiency and the use of renewable energy in eldercare infrastructure, and investing in education and lifelong learning. A critical issue will be the provision of long-term care (LTC) for the very old. Over the next five decades, the number of Europeans aged 80+, who are the main users of LTC services, is set to almost triple. It is estimated that one in two women and one in three men will come to need intensive long-term care as they age. In particular, Alzheimer’s and other dementias are among the major causes of disability and dependency affecting older people and, in their later stages, require very costly institutional care. Long-term care is a highly gendered issue. Older women have a higher life expectancy (see Table 1.1), are more likely to have poorer health and live alone, and follow a different pattern of morbidity in old age, so most care recipients are women, both in home and institutional care services. Moreover, the vast majority of both informal and formal care workers are women. Across CEB member states, LTC is organised (by public, for-profit or NGO providers), financed (via general taxation, obligatory social security, voluntary private insurance or out-of-pocket payments) and delivered (as home care or institutional care23 – see Figure 4.2) differently from acute health problems treated as clinical health care. Whereas clinical healthcare is almost exclusively dispensed by healthcare professionals, a substantial part of LTC services is provided by informal family carers. LTC provision can therefore be viewed as a combination of informal and formal care. Figure 4.2: People aged 65 and older receiving care benefits (cash or in-kind) in different care settings, 2009 or most recent year, in selected CEB member and non-member countries
Source: European Centre for Social Welfare Policy and Research (2012), Facts and Figures on Healthy Ageing and Long-term Care, Rodrigues R. et al.
23 “Institutional care” refers to care services and accommodation provided to users residing in nursing homes, retirement homes and service housing. “Home care – services” is defined as benefits provided to dependent older people by care providers or bought by users with cash benefits. “Home care – cash” is defined as cash benefits provided to dependent older people that may be used to pay for informal care workers or to hire personal assistants.

Financing Sustainable Health Infrastructure in CEB Target Countries 24
LTC is a complex subject that incorporates a broad mix of medical, social and residential (housing) dimensions. Across CEB member countries, long-term care for the elderly refers to a range of services and assistance for persons, who, over an extended period of time, are dependent on help with basic activities of daily living and/or instrumental activities of daily living24. Investing in LTC infrastructure is to be addressed cautiously, based on a demand-driven approach. In addition to informal care provided by relatives in all CEB member countries, there is enormous variation in the degree to which affordable formal services have been developed and are made available, greatly depending on the type of the welfare system in a particular country. As shown in Figure 4.2, while 5 out of 20 older people in Iceland and the Netherlands have access to formal care services or cash benefits, this percentage proportion is less than 1 in 20 in a number of Eastern and South-Eastern European countries. Additionally, population projections (see Table 4.1) show the strongest increase by 2060 in the share of the frail elderly (80+) at particular risk of developing a need for LTC across CEB target countries, namely in Turkey (+842%), Cyprus (+364%), Malta (+357%), the Western Balkan countries (ca. +300%) and the Czech and Slovak Republic (ca. +200%).
The CEB can finance investments in old-age-specific health infrastructure so as to increase its availability and to improve the delivery of standard and long-term care for the elderly. In particular, the CEB can provide financing for retirement homes, residences providing services and care, and nursing homes for the most dependent elderly. LTC in CEB target countries primarily relies on informal care and home care rather than on the institutionalised provision of services. In the upcoming decades, CEB target countries are expected to gradually develop and shift to formal LTC provision involving substantial investments in LTC infrastructure and an adequately skilled and trained care workforce (see Chapter 3). A particular focus may be the development of LTC systems in rural areas, where these services have generally been scarce. Concepts such as “ageing in place”, “continuity in care” or “smart homes” are also approaches that could successfully be adopted to tackle future challenges in LTC. “Ageing in place” and “independent living” can be achieved through elderly-friendly environments, assistive technology and the appropriate provision of home help and home care.
24 See Glossary.

Financing Sustainable Health Infrastructure in CEB Target Countries 25
Chapter 5: Private sector involvement The demographic, economic, epidemiologic and organisational trends, described in Chapters 3 and 4, are expected to increase demand for healthcare services and create a need for increased health spending across CEB member states. The health systems will thus face significant challenges in meeting increased financing needs, identifying additional sources of funding and clarifying the role of the private sector. Public and private sectors will have to work together to address the challenges of affordability, availability, accessibility and quality of care over the coming years. In CEB target countries, the private sector has an important role to play in the financing of healthcare infrastructure, equipment and services. There is great variation across the region in the importance of the private sector in health insurance coverage (see Chapter 2), taking pressure off of the public insurance system, and creating incentives for quality and efficiency in the provision of care. Looking ahead, there is a strong potential for increased financing via private health insurance25. The form that private insurance takes will depend on the services provided by the government and the regulatory environment (created by each state and by the EU), but also on the broader political and economic context in which health reforms take place. In terms of healthcare service delivery, privatisation has been an extensive and important process in transforming primary and ambulatory care in post-communist countries, especially in the Czech Republic, Georgia, Estonia, Hungary, Poland and the Slovak Republic. In effect, healthcare transition reforms have been aimed at reducing the reliance on hospitals by promoting outpatient and preventive care, seen as convergence with Western standards. Primary care has been developed through reductions in hospital referrals and the reintroduction of general practitioners and family medicine. The private provision of healthcare across CEB target countries has developed in various market segments, ranging from primary and dental care to some specialised services such as ophthalmology or dialysis care. By contrast, the scope of privatisation has generally been much smaller for hospitals26 (except for Georgia), but with restricted budgets and limited fiscal space, governments are increasingly looking to public-private partnerships (PPPs) to cope with the costs of delivering healthcare. There is a particular need to make the existing assets more productive through more efficient operations and maintenance, and to provide new investments in infrastructure, technology and skills (see Chapter 3)27. PPPs are also increasingly being considered as a means to finance, build and/or manage hospitals (see Box 3). They refer to forms of cooperation between public authorities and the private sector, which aim to ensure the funding, construction, renovation, management or maintenance of an infrastructure or the provision of a service. A main characteristic of PPPs is the relatively long duration of the relationship. PPPs in the health sector can take a variety of forms with differing degrees of public and private sector responsibility and risk. Depending on what the public partner is buying or selling from/to the private partner, healthcare PPPs range from health service focused to infrastructure focused structures (see Table 5.1). Building upon the typology presented here, differing models of PPPs will be suited to a variety of situations depending upon the specific facility and system need; the public and private capacity to fund the PPP; the governmental capacity to contract and oversee; the private capacity to implement and operate; and the legal framework and healthcare system in which the PPP is applied.
25 Sowa P. M. (2016), Governance of Hospitals in Central and Eastern Europe 26 As part of the healthcare transition in post-communist countries, the public hospital sector has rather undergone decentralisation reforms. 27 UNECE, WHO and ADB (2012), Discussion paper: “A preliminary reflection on the best practice in PPP in healthcare sector: a review of different PPP case studies and experiences”, prepared by Geoffrey Hamilton et al.

Financing Sustainable Health Infrastructure in CEB Target Countries 26
Table 5.1: Typology of hospital PPPs
PPP category Common term Definition/Explanation
Services Operating contract A private organisation is brought in to operate and deliver publicly-funded health services within a public facility.
Facility/finance Private Finance Initiative (PFI) A public agency contracts a private entity to finance, design and build a hospital facility and to operate non-medical services. Heath services within the facility are provided by the government.
Combined Build-Operate-Transfer (BOT) Public-Private Investment Partnership (PPIP)
A private organisation establishes capacity (through new construction “BOT” or expansion of existing facility “PPIP”) to provide health services under sustained public or social insurance reimbursement.
Co-location Co-location A public agency allocates a portion of a public hospital’s land and/or premises for sustained use by a private organisation in exchange for payment and specified benefits to the public agency.
Source: Montagu D. and Harding A. (2012), A zebra or a painted horse? Are hospital PPPs infrastructure partnerships with stripes or a separate species? World Hospitals and Health Services 2012 Vol.48 N°2 In CEB target countries, PPPs in the health sector take many forms: private management contracts, lease agreements, concession contracts, or even equity stakes in the hospitals themselves. There have been numerous examples of private management companies taking over regional and municipal hospitals in Hungary, Poland, Romania (concession contracts) and in the Czech and Slovak Republic, Georgia, Turkey (private management contracts and equity stakes). Within the region, Turkey has been the leader in healthcare PPPs. Indeed, the Turkish healthcare market has recently undergone major liberalisation reforms that require substantial new investments in healthcare28. Furthermore, PPP projects have been implemented in favour of specialised clinical services, for example, in Romania (e.g. privatisation of outpatient dialysis services), Bosnia and Herzegovina (e.g. construction of dialysis centres and construction of a cardio-chirurgic centre in Sarajevo), and the Republic of Moldova (e.g. the modernisation of diagnostic imaging and radiology services at the Republican Hospital in Chisinau). Most recently, the Government of the Slovak Republic is considering designing, building, financing and operating the New University Hospital in Bratislava through a PPP including the provision of medical services. However, due to the specificity of the health sector (see Chapter 7), PPPs can easily fail if they deviate from their public health objective, i.e. to provide quality health services at the best price. A solid regulatory framework needs to be in place, with a strong capacity at state level to deal with all possible pitfalls.
28 The ultimate goal of the Ministry of Health is a total of 90,000 new beds throughout Turkey by the end of 2018.

Financing Sustainable Health Infrastructure in CEB Target Countries 27
Box 3: Hospital PPPs vs. Infrastructure PPPs
The mechanics and sources of gains in infrastructure PPPs (e.g. transport, energy, telecommunications, water) translate imperfectly to hospitals and healthcare. Acknowleding minor variations between hospital PPP models, there are six key issues that are common to hospital PPPs and make them different from their infrastructure homonyms:
Issues Infrastructure PPPs Hospital PPPs Implications
Government vs. Private purchaser of output
Private buyers/payers Government does not enter into long-term service purchasing relationship as part of transaction
Government (or social health insurers) buy all or most services Government enters into long-term service purchasing relationship as part of transaction
Substantial risks to government payer as a result of long-term funding “lock in” obligation Substantial political risks to private partners in hospital PPPs
Business risk vs. Political risk
Borrowing costs reflect estimated risk of demand for infrastructure services by total market of potential payers
Borrowing costs reflect risks associated with single (or multiple) government payer agencies
Cost of finance (and therefore capital) higher for hospital facility investment
Measurability of output
Comparators for benchmarking cost of facility availability services are somewhat limited
Comparators for benchmarking cost of services are often extremely limited
Probability of that payment contract will set excessive rates is higher for hospitals
Variability of outputs over time
Products stable over time Products highly variable due to volatility in demographics and disease
Risk to private partners necessitating either higher return contingencies, or flexibility in contract modification Risk to government due to “locked in” commitment to hospitals/ configuration that may not be needed in the future
Variability of technology and organisational configuration over time
Service delivery technology and organisational models change slowly
Service delivery technology and organisational models change rapidly
Risks to government and private partners as a result of lost flexibility to adapt service organisation; or cost of unpredictable adjustments to technology, systems and staffing
Ratio of investment to operating costs
High ratio of capital to operating costs
Low ratio of capital to operating costs
Efficiency gains from private finance/design/construction and operation of hospital PPPs lower than for infrastructure PPPs
The defining aspect of hospital PPPs is the relationship between public and private partners which cannot be fully planned out in advance, and which therefore necessitates active discussion and renegotiation during the lifetime of the partnership. For this reason, the challenges of contract management are much greater and the benefits to government accrued from the private participation in finance and facility provision are often less predictable in hospital PPPs than in infrastructure PPPs. Source: Montagu D. and Harding A. (2012), A zebra or a painted horse? Are hospital PPPs infrastructure partnerships with stripes or a separate species? World Hospitals and Health Services 2012 Vol.48 N°2

Financing Sustainable Health Infrastructure in CEB Target Countries 28
PART III: CEB financing: experience to date and the role ahead
Part III presents the CEB’s approach to the health sector and describes the project portfolio in CEB target countries, which is then illustrated by a series of case studies. This part also demonstrates the unique characteristics and complexities of health projects when compared to other social infrastructure projects. To conclude, this part discusses the CEB’s relevance in the context of the challenges described in Part II and reflects on potential avenues for the Bank’s continued investment in the health sector in CEB target countries. Chapter 6: Portfolio profile Scope of action
Projects financed by the CEB in the health sector involve both “hard investments” in the construction, renovation and modernisation of infrastructure and “soft investments” in health-related research and development programmes and training for specialised staff in the social and health sectors. More specifically, the CEB can finance the construction and/or rehabilitation of public or private29 hospitals; public or private29 medical service infrastructure, including those specialised in assisting vulnerable populations; research and development facilities. Within such projects, CEB financing can also be granted for basic infrastructure such as water supply and wastewater systems and facilities, solid waste collection and treatment facilities including hazardous waste, electricity and gas supply systems, IT infrastructure and communications facilities. The CEB can also provide medical and non-medical equipment and furniture. Furthermore, the CEB can finance investments in healthcare centres for the disabled and old-age-specific health infrastructure, i.e. retirement homes and residences providing services and care, and in particular nursing homes for the most dependent elderly. Furthermore, the CEB can finance public or private investments involving scientific research and development. It can also finance home-based care and support programmes; training and support programmes in favour of disabled groups and training for specialised staff in the social and health sectors. Since 1982, when the first CEB health project was approved in Turkey30, CEB lending has mainly contributed to developing physical infrastructure and equipment in the health sector but soft-side investments such as training programmes have also supported the development and functioning of health systems in CEB member states. Amounts approved and disbursed in CEB target and non-target countries
The Bank’s financing in favour of the health sector dates back to the early 1980s. Over the period 1982-2015, the total volume of projects approved in this sector amounts to € 4.6 billion, representing 9% of all loans approved. This amount includes close to € 1.3 billion in health projects located in the CEB’s target countries (see Figure 6.1). Between 1982 and 2000, the CEB approved loans for health projects totalling € 2 billion and disbursed
€ 802 million. Health projects financed in target countries amounted to € 480 million, representing 24% of all health projects approved over this period (see Figure 6.2).
Between 2001 and 2015, the CEB approved loans totalling € 2.6 billion and disbursed € 2.2 billion.
Health projects financed in target countries amounted to € 790 million, representing 30% of all health projects approved over the last fifteen years (see Figure 6.2).
29 Private establishments and infrastructure must be state-approved, in compliance with the criteria fixed by the state for this type of establishment. 30 The CEB’s loan (€ 13.6 million) partially financed the construction of a research and teaching hospital at Çukurova University.

Financing Sustainable Health Infrastructure in CEB Target Countries 29
Figure 6.1: CEB lending to the health sector in target and non-target countries
Figure 6.2: CEB lending to the health sector since 1982 per sub-period
Geographic distribution in CEB target countries
From a geographic perspective, CEB lending to the health sector in target countries was widespread and relatively balanced (see Figure 6.3). The geographic distribution was the following: A large number of health projects were financed for € 320 million or 25% of the total in Turkey. These
projects were implemented between 1982 and 2001. € 319 million or 25% of the total were financed in Central Europe (Hungary, Poland, Slovak Republic
and Slovenia). The health sector in South Eastern Europe (Western Balkans, Bulgaria, Republic of Moldova and
Romania) benefited from CEB financing worth € 303 million, representing 23% of the total. Health projects in Western Balkan countries (Albania, Bosnia and Herzegovina, Croatia and “the former Yugoslav Republic of Macedonia”) accounted for € 248 million or 20% of the total. Several smaller projects totalling € 55 million were financed in Bulgaria, Republic of Moldova and Romania.
Health projects in Cyprus and Malta accounted for € 265 million or 21% of the total approved
since 1982. Health projects in Lithuania were financed for € 62 million or 5% of the total approved since 1982.
105375
570
22055
1,452 1,135
710
0
500
1,000
1,500
2,000
1982-1990 1991-2000 2001-2010 2011-2015
in E
UR
mill
ion
Total approved (1982-2015): € 4.6 billion
Target countries Non-target countries
27%
73%
Total approved (1982-2015): € 4.6 billion
Target countries Non-target countries

Financing Sustainable Health Infrastructure in CEB Target Countries 30
Figure 6.3: Geographic distribution of CEB lending to the health sector in target countries
At country level, the Bank’s largest borrowers in the health sector over the period 1982-2015 were Turkey (25% of total loans approved), Malta (17%), Poland (13%) and “the former Yugoslav Republic of Macedonia” (9%). These four countries represented 65% of the CEB’s loan portfolio financed in target countries in this sector over the period 1982-2015. Over the last fifteen years, the largest borrowers were Poland (21% of total loans approved for health projects in CEB target countries between 2001 and 2015), Malta (19%), “the former Yugoslav Republic of Macedonia” (15%) and Croatia (6%). Distribution channels in CEB target countries
To reach the intended final project beneficiaries, the CEB operates via intermediaries, i.e. sovereigns, local governments, public or private financial institutions. The CEB has implemented health projects mostly with central governments within national health policies (see Case Study 1). The Bank has also diversified its portfolio and financed a number of multi-sector projects with a health component with regional/local authorities and local banking sectors (see Case Study 3). Figure 6.4 shows the various public and private distribution channels used for CEB financing for health projects in target countries over the period 1982-2015. Figure 6.4: Public and private borrowers in CEB health projects in target countries
Between 1982 and 2015, 92% of CEB borrowers in target countries in the health sector were public, i.e. central, regional or local public administrations, while 8% of CEB borrowers were commercial banks. During the last ten-year period, the public/private distribution of borrowers has tipped slightly more in favour of the private sector (86%/14%).
20%
25%
5%4%
21%
25%
Total approved (1982-2015): € 1.3 billion
Western Balkans (Albania, Bosnia andHerzegovina, Croatia, FYR Macedonia)Central Europe (Hungary, Poland, SlovakRepublic, Slovenia)Baltic countries (Lithuania)
South-Eastern Europe (Bulgaria, Romania,Rep. of Moldova)Cyprus, Malta
Turkey
82%
10% 8%
Total approved (1982-2015): € 1.3 billion
Central authorities Regional and local authorities Commercial banks

Financing Sustainable Health Infrastructure in CEB Target Countries 31
Furthermore, one third of all CEB health projects in target countries (totalling € 421 million in CEB loans) have been implemented in co-operation with other international financial institutions (IFIs) and/or the European Union (EU), presented in Case Study 2: CEB loans totalling € 138 million financed in conjunction with loans from the European Investment
Bank (EIB) in Cyprus and Slovenia, the World Bank in Albania, Bosnia and Herzegovina, Bulgaria, the Republic of Moldova and Romania, and loans from the Nordic Investment Bank (NIB) in Lithuania.
CEB loans totalling € 283 million blended with EU Funds: in Hungary and Poland with EU Structural
Funds; in Albania and “the former Yugoslav Republic of Macedonia” with grants from the Western Balkans Investment Framework (WBIF) and in the Republic of Moldova with grants from the Neighbourhood Investment Facility (NIF).
Grant assistance
In addition to loans, grant resources can be made available through the CEB’s fiduciary accounts in order to subsidise interest rates, to provide loan guarantees and/or to finance technical assistance and/or part of the investment costs. This blending of loans and grants can facilitate the preparation and implementation of projects (via technical assistance), improve the economic viability of a given project (via interest rate subsidies, loan guarantees and/or investment grants) and ensure greater social impact. In the health sector, grants can be allocated via the CEB’s Social Dividend Account (SDA), the Spanish Social Cohesion Account (SCA), the Norway Trust Account for the Western Balkans (NTA) and the CEB’s consultancy budget. Additional support of this type has been allocated to health projects implemented in the following target countries: Health projects have received interest rate subsidies from the SDA totalling € 14 million in Albania,
Bosnia and Herzegovina, Croatia, the Republic of Moldova and Romania. These projects involved the (re)construction and equipment of healthcare facilities in the above-mentioned countries and the rehabilitation of war-damaged healthcare facilities in Croatia.
Health projects have also benefitted from grants totalling € 3.3 million, allocated from the SDA,
the NTA, the SCA and the CEB’s consultancy budget, to finance technical assistance and/or part of the investment costs in Albania, Croatia and “the former Yugoslav Republic of Macedonia”.
In addition, the CEB provided almost € 2 million in the form of grant contributions from the SDA
in favour of Estonia (€ 150,000), the Republic of Moldova (€ 777,000) and Romania (€ 1 million). Two of these projects were implemented in the Republic of Moldova by UNICEF.
Some of these projects are presented in the following Case Studies.

Financing Sustainable Health Infrastructure in CEB Target Countries 32
Case Studies The three case studies reflect the various types of borrower in CEB health projects.
Case Study 1: Co-operation with public authorities
Case Study 2: Co-operation with other IFIs and/or blending with EU funds
Case Study 3: Co-operation with commercial banks
Taking into consideration the priority given to social impact within CEB projects, the case studies mainly focus on the social effects of the projects, i.e. direct effects on the end-beneficiaries targeted in the projects. The result assessment focuses on the immediate effects generated by the projects, such as the type and number of facilities and medical equipment financed, the number of beds provided and the number of end-beneficiaries. Data are based on actual disbursements. These effects, taken from in-house operational documents, are provided by the borrower within the framework of regular monitoring of each project financed by the CEB. Upon completion, the borrower details the use of CEB funds and compliance with the pre-approved objectives, and provides information on the material and social results. In each project presented below, the year of its approval is indicated in brackets.

Financing Sustainable Health Infrastructure in CEB Target Countries 33
Case study 1. Co-operation with public authorities
RENOVATION AND MODERNISATION OF HEALTH FACILITIES IN CROATIA (2006)
Objective: the renovation and equipment of seven health facilities throughout Croatia, including two war-damaged hospitals in Slavonia (in Lipik and Vukovar) Borrower: the Ministry of Finance Beneficiaries: Croatian citizens CEB loan: HRK 327 million (equiv. to € 44 million), covering 44% of the total (revised) cost of HRK 747 million The project was implemented between 2007 and 2014. Social effects: This project contributed to enhancing healthcare provision in Croatia by rehabilitating existing infrastructure and by increasing the availability of high-quality equipment. The new and refurbished healthcare facilities are of significant local and regional importance, serving the corresponding population. In some cases, the catchment area goes beyond regional influence, serving a wider range of population in the country. The population now benefits from a larger number of preventive examinations; more reliable diagnosis with modern equipment; shorter waiting lists for particular diagnostic and therapeutic treatments; increased number and quality of transplants and other surgical interventions, including more efficient monitoring in the post-surgery period; and better adapted premises for patient accommodation.
CONSTRUCTION OF MATER DEI HOSPITAL IN MALTA (1991, 1998, 2003)
Objective: the construction and equipment of Mater Dei General Hospital, an intensive general care hospital, with a capacity of 825 beds Borrower: the Ministry of Finance Beneficiaries: Maltese citizens CEB loan: MTL 89 million (equiv. to € 215 million), covering 40% of the total (revised) cost of MTL 222 million A total of MTL 55 million (representing 62% of the approved loan) was disbursed between 1994 and 2003. The remaining amount of MTL 34 million (corresponding to 38% of the approved CEB loan) was cancelled in 2006 by the Maltese Government. Social effects: Although this project faced some delays in its implementation, the hospital became operational in 2007 and the final result is an excellent health facility providing secondary and tertiary medical services. This unique Acute General Hospital serves the entire Island (around 400,000 people) and the tourist population. It has an 825-bed capacity and counts with a series of medical specialties and state-of-the art medical equipment. Its well-designed architectural and engineering features together with advanced medical equipment make this hospital one of its kind in the region.

Financing Sustainable Health Infrastructure in CEB Target Countries 34
Case study 2. Co-operation with other IFIs and/or blending with EU funds
DEVELOPMENT OF PRIMARY HEALTH CARE FACILITIES IN BOSNIA AND HERZEGOVINA (2005, 2011)
Objective: the rehabilitation and medical and IT equipment of family medicine facilities, locally called “ambulantas”, and training for doctors and nurses in Family Medicine specialisation The project was part of the “Health System Enhancement Program” (HSEP), elaborated by the Government (of the Federation BiH and Republika Srpska (RS)) in cooperation with the World Bank/International Development Agency (IDA), the CEB and cantonal Governments. The project included 3 components: 1. Primary Health Care Restructuring (based on family medicine model) 2. Improvement of Health Care Management Capacity 3. Health Policy Formulation and Project Support Borrower: the Ministry of Finance and Treasury Beneficiaries: 70% of the population in the Federation of Bosnia and Herzegovina and RS CEB loan: Approved in 2005, US$ 14 million, covering 35% of the total (revised) cost of US$ 39.9 million Approved in 2011, € 9.2 million, covering 44% of the total cost of € 20.9 million The project was co-financed by the World Bank via IDA credit amounting to US$ 17 million (Phase 1) and € 7.4 million (Phase 2). CEB grant support: € 4.6 million allocated in the form of interest-rate subsidies from the SDA Social effects: The objective of the project is to enhance health care system efficiency by: (i) expanding and enhancing the family medicine model of primary health care; (ii) building management capacity in the sector; and (iii) strengthening the policy making process through the development and implementation of a system for monitoring and evaluating sector performance and addressing inefficiencies in the sector. The first phase of the project, implemented between 2006 and 2011, achieved significant results. The initial objectives defined for both entities were either achieved or exceeded. In the Federation (with 60% of the CEB’s loan), 335 ambulantas were refurbished and 376 sets of standard medical sets were provided. In the RS (with the remaining 40% of the CEB’s loan), 146 ambulantas were reconstructed or refurbished. About 2.2 million inhabitants (or 58% of the population) had access to family medicine at end-2011. The second phase of the project, implemented between 2012 and 2016, will cover 550,000 additional beneficiaries (up to 70% of the population), via the refurbishment of an additional 50 ambulantas in the Federation and 131 in the RS. At end-2015, € 7.1 million, representing 77% of the CEB’s loan approved, was disbursed. The project has upgraded the existing physical infrastructure but also prepared professionals to deal with the increasing needs of the Primary Health Care System and specifically with Family Medicine. Furthermore, the project has helped to reduce unnecessary referrals to secondary and tertiary healthcare facilities and specialists, encouraging the people to use the network of family medicine units within the primary healthcare system. Closer access to better quality public services has thus helped reduce patients’ out-of-pocket expenditure and preventive behaviours reduce subsequent illness and associated costs.

Financing Sustainable Health Infrastructure in CEB Target Countries 35
MODERNISATION OF THE REPUBLICAN CLINICAL HOSPITAL
IN THE REPUBLIC OF MOLDOVA (2008)
Objective: the rehabilitation of the Republican Clinical Hospital (RCH) in Chisinau (phase I) This project was a subcomponent of a larger project supporting a long-term programme, “Health Services and Social Assistance Project” (HSSAP), elaborated by the Government in cooperation with the World Bank, in order to improve the quality and effectiveness of health services and social assistance systems in the Republic of Moldova. The programme included the following three main components: 1. “Health System Modernisation” within the National Health Strategy 2007-2017. 2. “Social Assistance and Welfare” to help the Government develop a targeted social assistance
programme. 3. “Institutional Support” to build administrative capacity in order to prepare these sectors for
budget support operations in the future. Borrower: the Ministry of Finance Beneficiaries: Moldovan citizens from the entire country CEB loan: € 9 million, covering 32% of the total (revised) cost of € 28.3 million The project was implemented between 2009 and end-2014. The project was also financed by the World Bank (IDA credit of US$ 17 million), the European Union (NIF grant of € 3.1 million, administered by the CEB) and other donors, including the Swedish International Development Agency (SIDA), the United Kingdom Department for International Development (DfID) and UNICEF. CEB grant support: € 2 million allocated in the form of interest-rate subsidies from the SDA Social effects: The RCH is the most important tertiary health unit in Moldova and also serves as a teaching base for the State University of Medicine and Pharmacy. The RCH was built in 1977 and very little capital investment or full maintenance was carried out, due to severe fiscal constraints. Most of the equipment was outdated, not functioning or in very poor conditions. The Rehabilitation of the RCH, implemented through the CEB’s loan, was part of the first component mentioned above which helped the Government to: (i) optimise hospital capacity and improve operational efficiency in Chisinau and (ii) assess national hospital capacity needs to guide future investments. The CEB’s loan partially covered investments in infrastructure and medical equipment, including the construction of a new surgery block (around 10,000 sq. m), the reconstruction of the first floor in the entrance block and removal of the 14th and 15th floors (9,500 sq. m of works). The CEB project aimed to improve the quality and safety of surgical interventions at the national level, thus improving the quality of the national medical assistance system. The new surgical block opened in January 2015 and, at the time of writing, it was too early to assess its impact from a social-economic point of view. The Hospital’s efficiency should increase and the medical services it provides should improve for some 30,000 in-patients and 100,000 out-patients per year. The introduction of new surgical interventions, including kidney and liver transplantation, cardiac surgery for new-borns, adult cardiac surgery, neurosurgery, orthopaedic surgery, oncology surgery, should increase the total number of surgical interventions from 16,000 to 19,000. Furthermore, the average length of stay is expected to decrease from 8 to 5 days and nosocomial infections should decrease by 20%. The construction of the new surgical block has thus been an opportunity to initiate the rehabilitation of the RCH with state-of-the art standards and equipment and to turn it into a centre of excellence in terms of surgical interventions. The hospital will also strengthen training of surgeons across the country.

Financing Sustainable Health Infrastructure in CEB Target Countries 36
REHABILITATION AND EXPANSION OF HEALTH PROVIDER INSTITUTIONS
IN “THE FORMER YUGOSLAV REPUBLIC OF MACEDONIA” (2009, 2014)
Objective: the reconstruction and modernisation of 24 Health Provider Institutions (HPIs) throughout the country (phase I); consolidation and modernisation of the Clinical Centre “Mother Teresa” in Skopje and the Regional Clinical Hospital in Shtip (phase II) within the National Health Strategy 2007-2020 to improve accessibility, quality, efficiency and effectiveness in the healthcare system Borrower: the Ministry of Finance Beneficiaries: Macedonian citizens from the entire country CEB loan: Approved in 2009, € 23 million, covering 45% of the total (revised) cost of € 50.6 million Approved in 2014, € 97 million, covering 62% of the total cost of € 156.6 million
CEB grant support: € 100,000 allocated for technical assistance from the NTA (phase I) € 700,000 allocated for technical assistance from the SDA (phase II) € 270,000 allocated for technical assistance from the SCA (phase II) € 18,000 allocated for technical assistance from the CEB’s consultancy budget (phase II)
Additional technical assistance was sourced from the EU’s Western Balkans Investment Framework (WBIF) facility for the implementation of the first phase (€ 3 million) and the second phase (€ 3.4 million). Social effects: The project represents the backbone to the health reform in “the former Yugoslav Republic of Macedonia”. The project is expected to give more people the possibility of better treatment. Its main objective is to improve the delivery of secondary and tertiary healthcare services by upgrading infrastructure and operational conditions and by introducing new and modern medical equipment and technologies. Implemented between 2009 and 2015, the first phase focused on refurbishing, repairing and extending 24 healthcare facilities throughout the country through two components: (i) infrastructure works, largely financed by the CEB’s loan, and (ii) medical equipment, entirely financed through the State budget. The refurbished facilities should benefit almost 90% of the population. Furthermore, the refurbished secondary facilities throughout the country should encourage the population in the surrounding “catchment” areas to seek treatment in those facilities so as to alleviate the burden of the facilities located in Skopje. The second phase of the projects is planned to be implemented between 2014 and end-2018. The construction of the new Clinical Complex “Mother Theresa” in the capital Skopje is expected to greatly improve access to quality tertiary healthcare for the entire population of the country. The upgrading of the Regional Clinical Hospital in Shtip should improve the quality of the secondary healthcare and provide the possibility for regionalised tertiary healthcare services for 250,000 citizens of the Eastern region. This will improve the referral system, which will mean that people will receive the right treatment, at the right level of care and at the closest location. In parallel, more than 2,000 healthcare professionals are expected to benefit from the improved working conditions and the upgrade of the healthcare infrastructure. In terms of environmental impact, the second phase should also allow for better hospital waste management.

Financing Sustainable Health Infrastructure in CEB Target Countries 37
Case study 3. Co-operation with commercial banks
EQUIPMENT LEASING FOR PUBLIC AND PRIVATE HEALTHCARE PROVIDERS IN POLAND (2011, 2013)
Objective: the purchase of medical equipment by public and private healthcare sector entities, such as medical practices, clinics and hospitals (health component). The programme also included a large SME component for leasing operations involving fixed investments in productive equipment. Borrower: SG Leasing Equipment Polska Beneficiaries: healthcare providers and SMEs CEB loan: Approved in 2011, € 50 million, covering 50% of the total cost of € 100 million Approved in 2013, € 90 million, covering 50% of the total cost of € 180 million
Social effects: The objective of the health component is to contribute to higher standards in the provision of healthcare services in Poland, by improving the range and quality of medical services accessible to the general population. The CEB’s loan benefits public hospitals and private establishments having a contract signed with the National Health Fund, providing medical services to publicly insured citizens. Within the first project, around 10% of the CEB’s loan was allocated in 2012 to the health component via 18 leases throughout Poland. Within the second project, to be implemented between 2014 and 2016, an indicative amount of € 18 million was allocated to the health component. The final allocation will be updated by the borrower, based on actual disbursements.
MUNICIPAL INVESTMENTS IN FAVOUR OF THE ELDERLY IN SLOVENIA (2008)
Objective: the construction of retirement and nursing facilities in the municipalities of Maribor and Idrija through a multi-project programme in the “health” and “improved living conditions in urban and rural areas” sectors Borrower: Nova Kreditna Banka Maribor Beneficiaries: residents of small and medium-sized municipalities throughout the country CEB loan: € 30 million, covering 50% of the total cost of € 60 million Social effects: The CEB’s investments in the health sector (totalling € 11.4 million) allowed for the construction of two residences (with 300 beds, providing services and nursing care) and 30 flats for 48 senior residents in Maribor (€ 6.4 million) and Idrija (€ 5 million). The sub-projects for the elderly were undertaken by local authorities with private companies performing public services. The beneficiaries included the most dependent seniors, especially those suffering from dementia and needing permanent assistance. One of the most important results has been the improvement in living conditions for the targeted population and the possibility of developing therapeutic and social activities in addition to daily services and care.

Financing Sustainable Health Infrastructure in CEB Target Countries 38
Chapter 7: Hospitals and healthcare facilities as complex projects The CEB is increasingly having to deal with more complex projects, in particular in sectors such as penitentiary infrastructure31 and hospital facilities. Such projects require enhanced teamwork, based on a common understanding and background knowledge of a given sector and/or type of infrastructure. The health sector is one of the areas of action in which projects are amongst the most complex due to their engineering aspects, technological challenges, management and human resources implications and the problem of ensuring long-term sustainability of such large investments. Hospitals and healthcare facilities are complex types of buildings because they include a large range of services and functional units such as diagnostic and treatment functions, clinical laboratories, imaging, emergency rooms, surgery, as well as hospitality functions such as food service, housekeeping and basic inpatient care or bed-related functions. Such facilities are also very complex to manage well. This is a real challenge of needs to be integrated into a project at the outset. The CEB’s experience has shown that health projects have certain unique characteristics and complexities when compared with other social infrastructure projects. Healthcare infrastructure poses challenges that are different from those in other building structures in the following aspects: The wide-ranging and constantly evolving functions of a hospital together with the development of
sophisticated diagnostic and treatment technologies require the installation of complicated mechanical, electrical and telecommunication systems calling for specialised expertise, often lacking in CEB target countries.
The characteristics of a hospital building are determined by the medical equipment that is to be
installed within it. Because technology, medical science and consequently equipment are constantly changing, buildings rapidly become ill-adapted. They therefore need to be designed so as to be flexible. Hospitals should be designed with common spaces that can be replicated across departments, thereby providing future flexibility as well as cost savings. Indeed, rooms serving comparable functions can be similarly sized and finished, instead of being tailored to the individual occupants, and the actual equipment and furnishings can then be changed or upgraded over time.
Medical gas piping systems, nurse call, telemetry, pneumatic tubing systems, sterilisation and
disinfection facilities, building management systems and emergency power distribution are all additional systems that are installed in a hospital. HVAC (heating, ventilation, air conditioning) systems must be designed to meet more rigorous requirements such as minimum airflows in specialised rooms and strict conditions for humidity control.
The functional units of a hospital are characterised by competing if not conflicting needs and
priorities. Ideal scenarios and individual or corporate preferences must be balanced against compulsory requirements, actual functional needs (such as internal traffic and relationships with other departments) and the financial capacity of the hospital.
In addition to the extensive range of services that must be provided, hospitals must serve and support
many different users (medical staff, patients, visitors, external servicing and facility management staff, etc.) all with different objectives or interests. Any design process should integrate functional requirements with the needs of the various users. In CEB target countries, this means reorienting hospitals from a medical staff approach to a patient-centric approach.
All elements of healthcare facilities are targeted to supporting a healing environment for the patient.
These goals are very different from facilities that support a work environment or manufacturing process. For patient-centric facilities, the engineering challenges are focused on indoor air quality, infection risk control, contamination control, room pressurisation and sound control.
31 CEB (2014), The CEB’s Experience in Prison Financing, September 2014

Financing Sustainable Health Infrastructure in CEB Target Countries 39
Hospitals are high-energy-usage buildings with strict ventilation, filtration, pressurisation, humidification and temperature requirements that are in place 24 hours a day. They are therefore under great pressure to reduce costs, which in turn translates into tension between the construction costs and the long-term energy and maintenance costs. Investing more into energy efficient construction means having to spend less on operating costs, thereby providing for better sustainability of the investment.
Hospitals are large buildings that have a significant impact on the environment and economy of
the surrounding community. They are heavy users of energy and water and produce large amounts of waste. Their design should therefore aim to optimise energy efficiency, sustainability and maintainability, while providing practical cost-effective solutions.
A hospital is a complex system of interrelated functions requiring the constant movement of
people and goods. Much of this circulation has to be controlled; for example, outpatients visiting diagnostic and treatment areas should not transit through inpatient functional areas or encounter severely ill inpatients; visitors should have a simple and direct route to each patient nursing unit without penetrating other functional areas; the outflows of trash, recyclables and soiled materials should be kept separate from the movement of food and clean supplies, and both should be separate from patient and visitor routes. The most important thing is to balance increasing attention to building security with openness to patients and visitors.
Hospitals should remain operational both during and after disasters, for example earthquakes. This is
another aspect that should also be taken into consideration in their design. Nowadays renovation/rehabilitation projects or additions to existing hospitals are more common than
new buildings. This poses new challenges for engineering projects, due to the need for existing areas and systems to remain operational throughout the construction period and for safety measures to be taken to protect patients and medical staff. This requires coordination between the project implementation units, programme managers, design consultants, general contractors and the hospital’s operational teams.
Overall, hospital projects need to pay attention not only to cost issues but also to the detailed project management of all these hospital particularities. This approach should: reflect changing medical practices and advances in technology (see Chapter 3); reflect the on-going migration from invasive to less-invasive or non-invasive procedures as minimally-
invasive, image-guided, robotic and distant surgery progressively replaces traditional surgical procedures (see Chapter 3);
help healthcare managers, planners and architects to understand the trends affecting space allocation
and configuration and assist them in planning flexible facilities to meet the needs of patients and caregivers for the years to come.
In its approach to such projects, it is important for the CEB to streamline its activities through enhanced team work and sharing of competencies, technical assistance and collaboration with consultants, in particular in target countries which sometimes lack capacity and, given their history, also often lack experience (see Chapter 2). The trend is therefore to go beyond an annual visit system and to implement a more “hands on” approach with additional visits. This also means going beyond a purely sectoral perspective and bringing into play the complementary skills that are required to address the complex issues in which the CEB is involved through its project team approach.

Financing Sustainable Health Infrastructure in CEB Target Countries 40
Chapter 8: The way ahead This final chapter discusses the CEB’s relevance in the context of the healthcare systems and challenges described in Parts I and II respectively. It also reflects on potential avenues for the Bank’s continued investment in the health sector in CEB target countries. Addressing the challenges of delivering efficient, high-quality and affordable healthcare
for all The first Part of this working paper showed that the health sector is politically sensitive and technically complex, strongly embedded in the broader institutional and cultural context of each country. This complexity applies for all players – governments, healthcare workforces, patients, tax- or insurance-payers, hospital/health authorities, providers, contractors and funders. This complexity is also reflected in the CEB’s target countries’ different healthcare systems, whether they are social insurance-type, tax-based and/or privately-financed systems. Despite their differences, they share similar problems inherited from the centralised Semashko health model and, at the same time, are all having to cope with increasing costs due to demographic, epidemiologic, technological and organisational changes, as described in the second Part of this paper. The increase in demand for healthcare services related to population ageing is to be attributed to the burden of age-related diseases combined with increasingly changing family structures that are likely to undermine family care. The availability, accessibility and affordability of adequate infrastructure and services for the elderly will therefore be crucial to ensuring decent living conditions for the older populations and countries will have to secure adequate care for the elderly by providing a balance of home-based, community-based and hospital-based services. The provision of such infrastructure and services should therefore be carefully considered in a longer-term and demand-driven perspective. The epidemiologic transition from mainly infectious to chronic disease patterns increases morbidity and mortality not only for the population over 60, but much earlier in life. Obesity, diabetes and metabolic syndromes often begin during adolescence or even earlier. This trend has so far not reduced average life spans, but it has probably slowed the increase in life expectancy. For healthcare systems, this means that not only do the elderly need frequent care, but even younger people need treatment for long-term and complex disabilities and ailments they are increasingly suffering from. To meet this growing demand for healthcare, health systems will need a health workforce of sufficient capacity and with the right skills. As the size and composition of the health workforce are changing as a result of its ageing, mobility within and out of Europe and professional, organisational and technological developments, the quantitative and qualitative match between healthcare services demand and supply will be increasingly difficult to achieve and to sustain. Changes in how healthcare services are organised and delivered to meet the needs of Europe’s (ageing) population and to reflect greater specialisation are expected to lead to the up-skilling of existing health occupations and to new skills requirements. These changes will require different skill mixes, task-shifting and new ways of working within wider cross-specialist teams, while keeping abreast of changes in technology, treatments and prevention. New technologies are expected to form the backbone of medical care in the future. On the one hand, they are complex and require technical expertise in addition to clinical knowledge. They are also an important cost-driver in healthcare, with investments usually higher than predicted because of the large sums spent on staff training and equipment maintenance. On the other hand and more importantly, they lead to better medical results, higher efficiency and improved quality of care. Consuming the greatest amount of health system resources, the hospital sector in the CEB’s target countries needs particular attention. Burdened with the legacy of Semashko systems (where primary care was under-resourced and under-used in comparison to the investment and use of the hospital sector) and challenged by the new trends described above, hospitals need substantial investments to meet the diverse needs of patients and caregivers in the coming years. To respond to these challenges, CEB target countries have undertaken major health reforms over the last two decades, but in many countries the new systems are not yet fully in place and investment needs are significant.
Financing Sustainable Health Infrastructure in CEB Target Countries 41
First, the full extent of the reform measures required will depend on long-term demographic, epidemiologic and migration trends. Second, the much needed investment in healthcare infrastructure, either to build or to refurbish, often conflicts with other public infrastructure investment needs. Since healthcare is not their only priority area, CEB target countries have to make difficult choices regarding the type of infrastructure investments they can afford to finance. Third, changes in hospital governance, seen as complementary to financing reforms, are rooted in the broader institutional context and highly dependent on the managerial capacity of empowered actors. Fourth, the role of hospitals and health institutions is constantly evolving, but at different speeds and intensities depending on the peculiarities of each country. CEB target countries will thus be continuing their own transition trajectories towards the objective of delivering efficient, high-quality, accessible and affordable healthcare for all. Responding to investment needs across all CEB member countries, with a focus on the
target group In the face of such trends and challenges, the CEB will be adapting its action in the health sector. As a policy taker, the CEB is closely following these changes and will be analysing their operational implications. In order to achieve the desired outcome of high-quality, cost-effective and responsive care, it will be crucial to ensure that the right physical structures and people are in place. Given the continually changing nature of the health sector, this will require ongoing investment in new and updated facilities, equipment and skills. Investment needs in the health sector of the CEB’s target countries are more acute than those in the other CEB member states, because their healthcare systems are still maturing and facilities are more obsolete. Much needed reconfigurations of hospital systems across CEB target countries require the construction and/or renovation of infrastructure and the availability of an adequately skilled and trained medical and managerial workforce if they are to adapt to the changing health needs and new treatment methods described in this paper. Standing ready to respond to the requests of its member countries, the CEB will continue to provide financing for hard and soft investments in the health sector: The CEB will be looking to finance investments in the construction, renovation and modernisation of
public and private29 healthcare infrastructure and in the provision of medical and non-medical equipment. It can also provide financing for eldercare infrastructure meeting the specific requirements of the elderly. The Bank is also well placed to contribute to enhancing energy efficiency and the use of renewable energy in such infrastructure. CEB financing could therefore cover energy-saving and efficiency investments in both the rehabilitation of existing buildings and the construction of new buildings.
The scope of future activities could also include specific investments in education and training
programmes and job creation projects targeted to new job roles and skills requirements in the health sector. The CEB’s action could also contribute to financing public or private investments involving scientific research and development, thereby investing in knowledge and innovation.
The above-mentioned demand and supply trends will create substantial new costs for both providers and receivers of healthcare and will challenge the fiscal sustainability of public health systems. Health systems will therefore need financially solid public and private partners to be able to fund healthcare in the future. Fiscal retrenchment by governments in CEB target countries has resulted in a more acute recognition of the potential role of the private sector in supporting social infrastructure projects, easing fiscal constraints and improving the delivery of basic services to local populations in sectors such as health. For this reason, the CEB intends to explore ways of increasing its role in supporting such investment activity in cooperation with public and private actors taking into account the welfare regime, institutional capacity and regulatory framework in each country of operation. As the only development bank with an exclusively social vocation in Europe, the CEB will thus continue to finance adequate, affordable and sustainable healthcare infrastructure and services, with a particular focus on its target countries. In so doing, the CEB will also be making its contribution to the 2030 Sustainable Development Agenda and particularly to Goal 3: “Ensure healthy lives and promote well-being for all at all ages”.

Financing Sustainable Health Infrastructure in CEB Target Countries 42
Bibliography
CEB (2014), Ageing Populations in Europe: Challenges and Opportunities for the CEB, January 2014 Danzon Patricia M. (1993), Health Care Industry. The Concise Encyclopedia of Economics, 1993, Library of Economics and Liberty European Centre for Social Welfare Policy and Research (2009), Facts and Figures on Long-term Care: Europe and North America, by Hubert M. et al. European health for all database (HFA-DB), World Health Organization Regional Office for Europe, Updated: December 2015: http://data.euro.who.int/hfadb/ European Commission (2013), Investing in health, Commission Staff Working Document, Brussels, 20 February 2013, SWD (2013) 43 final European Commission (2013), Long-term care in ageing societies – Challenges and policy options, Commission Staff Working Document, Brussels, 20 February 2013, SWD (2013) 41 final European Commission (2012), Commission Staff Working Document on an Action Plan for the EU Health Workforce, Strasbourg, 18 April 2012, SWD (2012) 93 final European Foundation for the Improvement of Living and Working Conditions (2013), Mobility and migration of healthcare workers in central and eastern Europe European Investment Bank (2007), Evaluation of EIB Financing of Health Projects, Synthesis Report, October 2007 European mortality database (MDB), World Health Organization Regional Office for Europe, Updated: December 2015: http://data.euro.who.int/hfamdb/ European Observatory on Health Care Systems Series (2002), Hospitals in a changing Europe, edited by Martin McKee and Judith Healy EUROSTAT EU Skills Panorama (2014) Health professionals Analytical Highlight, prepared by ICF and Cedefop for the European Commission Expert Panel on Effective Ways of Investing in Health (2015), Access to health services in the European Union, September 2015 ILO (2014), World Social Protection Report 2014/15, Building economic recovery, inclusive development and social justice Kulesher, R. and Forrestal, E., (2014), Journal of Hospital Administration, International models of health systems financing, 2014, Vol.3, No. 4 Montagu D. and Harding A. (2012), A zebra or a painted horse? Are hospital PPPs infrastructure partnerships with stripes or a separate species? World Hospitals and Health Services 2012 Vol.48 N°2 OECD (2015), Health a Glance 2015: OECD Indicators, OECD Publishing, Paris

Financing Sustainable Health Infrastructure in CEB Target Countries 43
OECD (2014), Health at a Glance: Europe 2014, OECD Publishing, Paris Paris, V., M. Devaux and L. Wei (2010), Health Systems Institutional Characteristics: A Survey of 29 OECD Countries, OECD Health Working Papers, No. 50, OECD Publishing Sowa P. M. (2016), Governance of Hospitals in Central and Eastern Europe Turcanu G., Domente S., Buga M., Richardson E., Republic of Moldova: health system review. Health Systems in Transition, 2012, 14(7):1–151 UCL European Institute (2012), The Future of Healthcare in Europe, edited by U. Staiger and S. Chaytor UNECE, WHO and ADB (2012), A preliminary reflection on the best practice in PPP in healthcare sector: a review of different PPP case studies and experiences, Discussion paper prepared by G. Hamilton et al. H. R. Waters, J. Hobart, C. B. Forrest, K. Kinder Siemens, P. M. Pittman, A. Murthy, G. Bruce Vanderver, G. F. Anderson and L. L. Morlock, Health Insurance Coverage In Central And Eastern Europe: Trends and Challenges, 27, no.2 (2008):478-486 Health Affairs WHO Regional Office for Europe, Council of Europe Development Bank (2006), Health and economic development in south-eastern Europe WHO, European Observatory on Health Systems and Policies, Health Systems in Transition (HiT) series WHO (2015), The European health report 2015: Targets and beyond - reaching new frontiers in evidence Wismar M., Maier C. B., Glinos I. A., Dussault G.and Figueras J. (eds., 2011), Health professional mobility and health systems. Evidence from 17 European countries, Observatory Study Series No. 23, European Observatory on Health Systems and Policies, WHO Regional Office for Europe, Copenhagen
Financing Sustainable Health Infrastructure in CEB Target Countries 44
Glossary
Source: World Health Organization Regional Office for Europe (2015), European Health for All Database (HFA-DB) and Mortality Indicator Database (HFA-MDB) Age-standardised death rate (SDR) Mortality from any cause of death. SDR is the age-standardised death rate calculated using the direct method and standard European population structure. SDR is the crude death rate calculated as a simple ratio: number of registered deaths/ mid-year population (per 100,000). Mortality rates have been calculated by the WHO Regional Office for Europe using the data on deaths by cause/age/sex and mid-year population by age/sex, annually reported to WHO by European Member States. Mortality rates for some countries may be biased due to the under-registration of death cases, particularly in the Caucasus countries and in some countries in the Balkan region. Activities of daily living (ADLs) ADLs are self-care activities that a person must perform every day such as bathing, dressing, eating, getting in and out of bed or a chair, moving around, using the toilet, and controlling bladder and bowel functions. Average length of stay (ALOS) Total number of occupied hospital bed days divided by the total number of admissions or discharges. Length of stay (LOS) of one patient = date of discharge - date of admission. If these are the same dates, then LOS is set to one day. Healthy life years Healthy life years or “disability-adjusted life expectancy” indicates the number of years a person of a certain age can expect to live without disability. Hospital beds per 100,000 Total hospital beds are all hospital beds that are regularly maintained and staffed and immediately available for the care of admitted patients. Include: beds in all hospitals, including general hospitals, mental health and substance abuse hospitals, and other specialty hospitals; occupied and unoccupied beds. Exclude: surgical tables, recovery trolleys, emergency stretchers, beds for same-day care, cots for healthy infants; beds in wards which were closed for any reason; provisional and temporary beds; beds in nursing and residential care facilities. Infant deaths per 1,000 live births A measure of the yearly rate of deaths in children less than one year old. The denominator is the number of live births in the same year. Infant mortality rate = [(Number of deaths in a year of children less than 1 year of age) / (Number of live births in the same year)] *1,000 (ICD-10). Some countries are not able to ensure complete registration of all deaths and births. Therefore, infant mortality rates that are calculated using incomplete mortality data are lower than they actually are. In some cases under-registration of deaths may reach 20% or more and this has to be kept in mind when making comparisons between countries. Particularly high levels of mortality under-registration are observed in the countries of Central Asia and Caucasus, Albania and possibly some other countries, such as those of former Yugoslavia. Instrumental activities of daily living (IADLs) IADLs are activities related to independent living and include preparing meals, managing money, shopping for groceries or personal items, performing light or heavy housework, and using a telephone.

Financing Sustainable Health Infrastructure in CEB Target Countries 45
Outpatient contacts per year The total number of primary health care or ambulatory care contacts divided by the population. An outpatient contact is one episode of examination/consultation performed by a physician or by a nurse in the presence of a physician, in relation to one outpatient at one time and location, normally at the physician’s office or the patient’s home. The number of outpatient contacts includes: patient's visit to physician’s office; physician’s visit to patient’s home or other place; call for ambulance; day-patient cases. The number of outpatient contacts excludes: telephone calls for consultation purposes; visits for prescribed laboratory tests; contacts to perform prescribed and scheduled treatment procedures, e.g. injections, physiotherapy etc.; visits to dentist. Definition of outpatient: A person attending a PHC (Primary Health Care) unit or outpatient department in an outpatient establishment or hospital and who makes use of the diagnostic or therapeutic service but does not occupy a regular hospital bed. Definition of day patient: A patient who does not require inpatient care but who needs specialised observation or health care or treatment from hospital during a limited number of hours of the day and who returns to his home for the evening meal and the night. These patients can occupy specialised beds (e.g. recovery beds, beds for special purposes or belonging to special health devices). If a day patient occupies a regular hospital bed, then this case is not considered as a case of hospitalisation and thus ‘consumed’ bed days are not included in the number of regular days of stay. Day-patient care is one of the forms of ambulatory care. Perinatal deaths per 1,000 births Weight specific (1000 g+) foetal deaths and early neonatal deaths per 1000 births (live births + stillbirths). If weight specific data are not available, any available data provided according national criteria are used as a proxy. Public sector expenditure on health as % of GDP, WHO estimates Public sector (or general government) expenditure on health is the sum of outlays for health maintenance, restoration or enhancement paid for in cash or in kind by government entities, such as the Ministry of Health, other ministries, parastatal organisations, social security agencies, (without double-counting the government transfers to social security and to extra-budgetary funds). Includes transfer payments to households to offset medical care costs and extra-budgetary funds to finance health. The revenue base of these entities may comprise multiple sources, including external funds. The estimates are, to the greatest extent possible, based on the National Health Accounts classification. Private households’ out-of-pocket payments on health The direct outlays of households, including gratuities and payments in kind made to health practitioners and suppliers of pharmaceuticals, therapeutic appliances, and other goods and services, whose primary intent is to contribute to the restoration or to the enhancement of the health status of individuals or population groups. Include household payments to public services, non-profit institutions or non-governmental organisations. Include non-reimbursable cost sharing, deductibles, co-payments and fee-for service. Exclude payments made by enterprises that deliver medical and paramedical benefits, mandated by law or not, to their employees. Private sector expenditure on health as % of GDP, WHO estimates Private sector expenditure comprises the outlays of insurers and third-party payers other than social security; mandated and voluntary employer health services and other enterprises providing health services; non-profit institutions and non-governmental organisations (such as Red Cross) financed healthcare; private investments in medical care facilities and household out-of-pocket spending. Total health expenditure as % of GDP, WHO estimates Sum of general government and of private expenditure on health. The estimates are, to the greatest extent possible, based on the National Health Accounts classification. The sources include both nationally reported data and estimates from international organisations such as the International Monetary Fund, the World Bank, the Unites Nations and the OECD. Therefore they may differ somewhat from official national statistics reported by countries.


Notes
............................................................................................................................................
............................................................................................................................................
............................................................................................................................................
............................................................................................................................................
............................................................................................................................................
............................................................................................................................................
............................................................................................................................................
............................................................................................................................................
............................................................................................................................................
............................................................................................................................................
............................................................................................................................................
............................................................................................................................................
............................................................................................................................................
............................................................................................................................................
............................................................................................................................................
............................................................................................................................................
............................................................................................................................................
............................................................................................................................................

............................................................................................................................................
............................................................................................................................................
............................................................................................................................................
............................................................................................................................................
............................................................................................................................................
............................................................................................................................................
............................................................................................................................................
............................................................................................................................................
............................................................................................................................................
............................................................................................................................................
............................................................................................................................................
............................................................................................................................................
............................................................................................................................................
............................................................................................................................................
............................................................................................................................................
............................................................................................................................................
............................................................................................................................................
............................................................................................................................................