Embed Size (px)
Citation preview

.... ,
Economic-Engineering
Techniques • In Planning
ICE CREAM OPERATIONS
MIMEO EC-240
June 1962
The management of an ice cream plant must continually make decisions about alternative methods of processing. products to produce and volume of production. The chances of making an error in choosing among many courses of action are great. But to achieve maximum efficiency and to compete vigorously in the market, management cannot afford to make poor decisions. The purpose of this report is to provide those responsible for decisionmaking with some useful techniques for planning more
efficient operations. Included are:
• Organizing Production Processes
• Mechanized or Manual Operations
• Effect of Volume {In Costs
• Size of Plant • Product Mix
Cooperative Extension Service, PURDUE UNIVERSITY, Lafayette, Indiana

USE OF ECONOMIC-ENGINEERING TECHNIQUES IN PLANNING ICE CREAM OPERATIONS
Emerson M. Babb and James C. Taylor
Agricultural Economics
Before considering specific techniques for planning ice cream operations, the general industry environment should be considered. The ice cream and frozen dairy products industry has shown substantial growth over the years. Sales of frozen dairy products amount to about a billion gallons annually. This volume is produced in about 3,400 plants employing 35,000 employees with payrolls amounting to over $153 million. Value added to the product by manufacture was estimated at $393 million in 1958 and value of shipments at $946 million. y
From 1951 to 1960, the retail price of half-gallons of ice cream averaged 87.6 cents nationally, and showed a very slight downward trend. The farm value of milk in a half-gallon of ice cream fluctuated between 21. 3 and 22.7 cents, with a slight downward trend. Thus, the farm -retail price spread stayed constant. But due to changes in the proportion of pre-packaged half-gallons sold, it is probable that the actual weighted averaged retail price of ice cream dropped by at least 10 percent. S
Plans to improve efficiency and profits should be directed first to those areas of the business vvhich are most susceptible to
improvement. A general classification of ice cream costs by functions would reveal the following breakdown:
Plant costs -- 27 percent
Delivery and sales expenses -- 28 percent.
Administration - - 4 percent
The items which comprise the larger parts of total costs are not necessarily the ones on which to concentrate. For example, there may be no way to reduce further the raw product costs. This report will concentrate primarily on planning ways of reducing plant, labor and equipment costs. In plaIU1ing for profits, however, it is important to keep the entire system in mind and not yield to the temptation of considering one area in isolation.
The management-by-exception principle should be followed. Roughly, this principle states that management should concentrate its efforts on improving
This report draws heavily on material contained in James C. Taylor, Ice Cream Manufacturino- Plants in the Midwest--Methods, Equipment, and Layouts, Marketing h
Research Report 477, AMS, USDA. Ice cream plant operators will find Taylor's report quite useful in analyzing their individual operations.
Appreciation is expressed to C. E. French, D. R. Frazeur, H. L. t\lloore and E. C. Oesterle for helpful comments.
y U. S. Census of Manufactures, 1958. U. S. Department of Commerce. ?J The Marketing and Transportation Situation, January 1961, AMS, USDA, pp. 26-29.

-2-
those phases of operation which seem to be poorest -- those which will return the most for effort expended. Management should also examine with equal interest those phases of its operations that are exceptional on the positive side. Study of the betterthan-average operations will often indicate ways of improving below-average parts of the business.
Specific techniques which can be used in planning ice cream operations will be discussed and illustrated for five problem areas. The areas considered are:
1. Organizing production processes
2. Mechanical or manual operations
3. Effect of volume on co sts
4. Size of plant
5. Product mix
Techniques useful in planning operations in the se problem areas for one size of plant may be unsatisfactory for others. Therefore, techniques will be discussed which have application over a wide range of plant sizes, starting with the simpler planning devices and working through to the more complicated ones.
ORGANIZING PRODUCTION PROCESSES
Ice cream production can be described by a se:!'ies of functions performed in sequence such as, preparing mix, freezing, packaging and the like. Ordinarily, there is more than one way each of these functions can be performed. For example, half-gallon cartons of ice cream could be stored using the double-stack method, basket and conveyor method, manual method or conveyor method. Obviously, there is an extremely large number of combinations of work methods that can be used in ice cream production. And with new production techniques and equipment being developed, the difficult
job of organizing for efficient production become s more complex.
Once management selects the best pattern of work methods, the problem of organization is not solved forever. As the size of operation changes, a different combination of work methods may become optimal. .As the product mix changes, work methods may require alterations. Finally, as new equipment and methods are found, management must evaluate their use. Thus, complacency toward organizational problems will result in inefficiencies, probably in a shorter time than might be suspected.
The objective of organizational planning is to achieve minimum costs for the ice cream production system as a whole. The fact that work methods are chosen so as to minimize production cost of one item, such as half-gallon cartons, does not automatically insure minimum production costs for the entire system. Furthermore, management cannot select work methods on the basis of minimizing one factor of production in isolation from all others, such as labor or equipment costs, and expect automatically to achieve minimum total production costs. These concepts are illustrated later.
Planning Techniques
Several different techniques are available to help in organizing ice cream production processes.
Plant layout and flow diagram s. Perhaps the simplest and most commonly used devices in organizational planning are plant layouts and flow diagram s. The flow of ingredients and products through a plant is illustrated in Figure 1. Diagrams of this nature can be used to show movements of raw materials, products or containers through the plant. They are useful in coordinating activities and planning efficient operations.

-3-
LOCKERS AND
TOILETS
PROD, MGRS, OFFICE
LABORATORY
Shop Area
MACHINERY ROOM
Fi3ure 1. Flow Diagram and Plant Layout.
r--- - - -- - - - - - -- --- -----: Refrigera tion
KEY
: and s te am equipment 1. Weigh t ank on sca le (50 ga l. c ap . ) 2. Pa s teu l' iz ing va t (300 gal. cap.)
Novelty Storage
3 . Homogenizer (600 gal. per hr) 4. Pla te cooler (5400 lb per hr) 5. Mi x storage vat (600 gal . cap.) 6 . Mix storage vat (300 gal. c ap . ) 7 . Flavor tank (50 gal. c ap . ) 8 . Freezer(150 gal. per hr) 9. Fruit feeder (Portable )
10 . Spring table (Porta ble) I 11. Work table (Portable ) 'SI' 12 . Canformer • upp le s
I 51:: ]I.l I ____ /num ____ m\u__ Sc,I, of F,,, MAIN OFFICE LJ L.-------.------~- ...... _ AHH I
DRY STORAGE ROOM OS iO : MIX AREA ,'--.. - ==~~~::--::-------:~---~~:---'-:~.::=~- --- Flow Legend
c:b 0" "; i' + ,_} Supplies
[TIl--'- : .. ---- Mix ingredie nts _ - - Empty containers _Ice c r eam
- QW ~--- --.. -- _____ • __ -CAN STORAGE. _1 ___ _
office COO LER Source; Market~ng Research Report 477, AMS, USDA.
Schedules. --Schedules of processing, machine time, labor and utilities are a little more complex than flow diagrams but provide a better basis for planning operations. The use of schedules is illustrated in Figure 2. To make such a schedule of plant operations, utility and labor requirements involved in each operation, product mix and technical proces sing information must be known. These schedules will prove to be an aid in achieving balance among operations and in minimizing delays and bottlenecks which are costly in terms of labor and machine utilization.
Time study and comparative cost analysis. --Time study and comparative cost analysis can be made of various methods of performing a function such as freezing. Assume that loading out could be done by the basket and conveyor method , the manual method or the conveyor method. Time study of the three alternatives would reveal the amount of labor required under each system. Equipment and othe r costs as sociated with each alternative could be determined. With this information the least-cost method of
loading out could be determined. Of course, consideration must be given to how the various methods of loading out fit into the over-all production system.
Link analysis. --Since the entire production system should be considered when work methods are selected, link analysis is an ideal way of viewing ice cream operations. This technique requires consideration of labor, equipment and other costs for all method s simultaneously, rather than in isolation. The data obtained from time studies and comparative cost studies are used.
The use of link analysis for functions peculiar to half-gallon carton packages in a plant producing 1 SO, 000 gallons annually is illustrated in Figure 3. ~/ The functions of receiving mix ingredients, freezing and cleaning must be performed in producing all products and sizes and are thus not shown. -Two methods of freezing, four methods of packaging and storing, and three methods of loading out which are pec uliar for production of half -gallon carton
3/ Taylor's study was based primarily on plants operating at this volume of production.

Z 0 ...... t--< <t:! N ...... .....1 ......
~ 0::: 0 co <t:! .....1
C/}
~ w ~ w 0::: ::; CI W 0:::
0::: W ~ ~
-4-
Figure 2 - Partial Operating Schedules for Ice Cream Plant
Worki Hours
Pasteurizing Vat (300 gal.)
Homogenizer (6QO gal. /hr.)
Mix Storage Vat (600 gal.)
Freezer (150 gal. /hr. )
800 Pints Vanilla Ice Cream
600 1/2 Gallons Vanilla Ice Cream
600 308
200 1/2 Gallons Chocolate Ice Cream
400 Pints Chocolate Ice Cream
400 Pints Fruit Ice Cream
Mix and Laboratory Man
Eackager - Freezer
Packager
Packager
Packager
Hardening Room Man
30 Refrigeration (tons) I~
600 Steam 188 Requirements (lbs. /hr.)
0
20 Electrical 10 Requirements (kw/hr. ) 0
Water 40 Requirements (C.P.M.) 20
0
7:00 8:00 9:00 10:00 11:00 12:00 1:00
I I I ~
- -Mixi
Pac
Packaging
Packaging
Packaging
Storage and load out

,
-5-
Figure 3 - Labor and Equipment Cost Per 1000 Gallons for Certain Phases of Producing Half -Gallon Cartons of Ice Cream *
Freezing
Three Tube Method $31. 01
Single Tube Method $32.88
Packaging
Chute and Basket Method
$39.50
Three Worker Manual Method $54. 77
Filler Manual Method $47.14
Filler Chute and Basket
Method $49.30
Storing
Loading Out
Double Stack Method $7.98
Basket and Conveyor
Method $4.99
Basket and Conveyor Method $2.28
Manual Method $4.41
Manual Method $1. 93
Conveyor Method
$3.83
Conveyor Method $1. 77
* Source: James C. Taylor, Ice Cream Manufacturing Plants in the Midwest-Methods, Equipment and Layouts, Marketing Research Report 477, A. M. S., U. S. D.A.
packages are considered. The arrows between methods indicate feasible sequences of methods. Thus, each of the two methods of freezing is compatible with any of the packaging methods. But not all possible com-' binations would make sense. For example, the two-worker chute and basket method of packaging and the double-stack method of storing are not compatible and therefore are ruled out.
Sixteen feasible combinations of work methods are shown in Figure 3. A simple rule will make the least - cost combination of work methods easier to determine. Whenever all of the pos sible methods available for a particular function can be used feasibly . with 811 methods in the succeeding function, the higher cost methods can be eliminated. Thus, the single tube method
of freezing cart be eliminated and the number of combinations that must be considered drops from 16 to 8.
The next step is to compare the relative costs of work methods for a function such as packaging. The two-worker chute and basket method is almost $10 cheaper than the next lowe st method, namely the filler manual method. Since this cost difference is greater than the difference between the high and low cost methods in the next two functions combined, the two-worker chute and basket method of packaging is selected. Work methods in succeeding stages are likewise chosen by comparing relative costs.
The least-cost pattern of work methods shown in Figure 3 would result

-6-
in labor and equipment costs of $77. 78 per 1,000 gallons. The high cost combination amounts to $97.40 per 1, 000 gallons, or $19.62 per 1,000 gallons higher. The low cost system involves using the three-tube method of freezing, the two-worker chute and basket method of packaging, and the basket and conveyor method of storing and loading out.
For this particular plant size, the above combination of work methods which minimized costs for half-gallon cartons was also the minimum cost system for other package sizes, but this is not always the case. Thus, consideration must be given to all packages and to plant operations in total when this analysis is used.
Mathematical programming. --The best combination of work methods contained in Figure 3 was not immediately obvious. If several hundred feasible combinations are to be considered, the difficulties encountered are greatly mabrnified. The methods shown in Figure 3 combined with two ways each of performing the other three production functions of mixing ingredients, freezing and cleaning would give 768 possible combinations. But many of these would not be compatible. Mathematical programming is available for solving organizational problems when the system has a large number of feasible combinations. Desk calculators or electronic computers would be used to solve the problem.
Application
Plant layout and flow diagrams and most of the various schedules should be used, regardles s of size. Plants with production of 150, 000 or more gallons annually can and probably do use time study and comparative cost analysis and link analysis profitably. Whether programming on a computer is needed depends on the complexity of the system under consideration.
Many plants follow the practice of maintaining a given level of inventory for each product, which involves almost daily production runs of many items. Frequent production runs may be neces sary in some cases, but examination of Taylor's work suggests that the poss ibilities of scheduling longer production runs should be examined. Inventory would thus be built up so that production of some items may take place once a week or les s often. This system would eliminate unproductive man and machine time and fixed cost aSSOCiated with take -down and set ... up operation s. Hardening room space may place limits on this policy. Length of production runs and inventory policy are factors to consider in planning hardening room requirements for future plant expansion.
MECHANIZED OR MANUAL OPERATIONS
Taylor's study indicates that many plants with production of about 150,000 gallons annually would have reduced cost substantially if more manual and fewer mechanized operations were used. In plalU1ing future change s, thi s problem will have to be scrutinized more closely.
In deciding whether to mechanize, consideration must be given to the price of eqUipment, the wage rate and how machinery substitutes for labor in performing work. If an hour of machine time and an hour of labor each costs $2.00, then the output of both should be the same. If the machine output is les s than that from labor, then labor should be substituted for machines. A practical illustration of this principle is presented later.
A decision regarding the use of machines or manual methods is usually made to apply for a relatively long time span. Thus, in making a decision of this kind, expectations of future development obviously is a big factor. How much will wage rates increase or decrease? How much will equipment prices

J
increase or decrease? What new equipment and new methods will be developed, and will they make present equipment obsolete? Management is expected to be a perfect forecaster and come up with the right decision. Some devices to help in making that right decision follow.
Time Studies and Comparative Cost Analysis
Time and cost studies are made of two work methods such as loading out manually and loading out with conveyors as previously discus sed, to determine which method is the least-cost method from the standpoint of the over-all system. Price and wage expectations must be carefully considered.
Link Analysis
Link analysis can be used as before
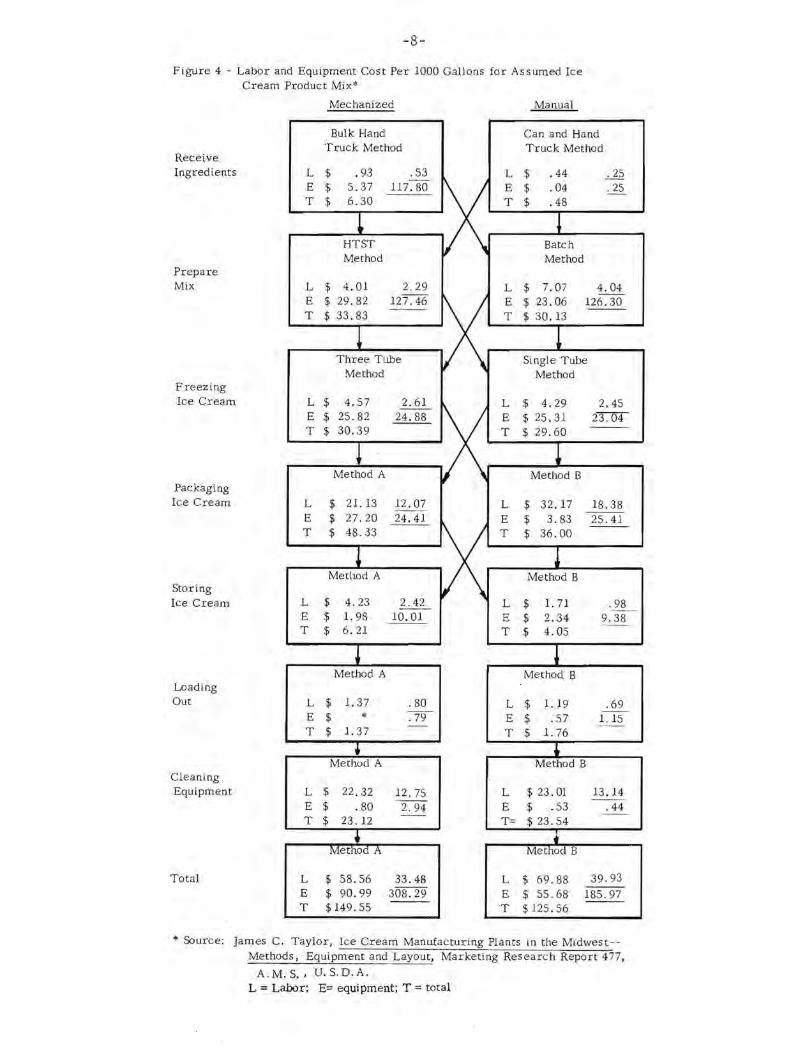
-7-
in making decisions relative to the selection of manual or mechanized methods. A sequence of methods Taylor examined are presented in Figure 4. Those methods in the first column are generally the more highly mechanized while those in the second column are more manual. The figures on the right in each box, which are underlined, are labor and machine hours used to perform the function per 1,000 gallons produced. Cost per hour of operation for each piece of equipment was calculated • . The labor cost used was $1. 75 per hour.
Total equipment and labor cost are minimized by using the more manual methods as shown in Figure 4. Costs for loading out and cleaning equipment were slightly les s under the more mechanized methods but were not used when the over-all production system was considered. Total labor and equipment costs per 1,000 gallons for the more manual operations for the specified product mix were $125.56 and $23.99 per 1,000 gallons less than the more mec hanized system. The higher
labor cost Gnder the manual system was more than offset by lower equipment costs.
In terms of decision making, future expectations must be considered. For example, what will the wage rate be in 1970? In 1950 the U. S. average hourly earnings of employees working in dairy plants was $1.26 compared with $1.38 for production workers in nondurable goods. In 1959 hourly earnings for dairy plant employees had increased to $2.07 or up 64.3 percent while hourly earnings for production workers in other nondurable goods industries were $2.01 or an increase of 45.6 percent. Since dairy workers' wages have not only caught up with but pas sed wages of workers in similar industries, it seems reasonable to assume that future changes in wage rates will be more comparable. As sume that the hourly earnings' trends of the 1950's carryover into the 60's, or that wages increase about 5 percent per year. If this happened, wages paid Indiana plant employees in 1970 are estimated to be $2.63 an hour, or 56 cents over the 1959 level.
The impact of the projected wage increase on labor and total costs for the production system illustrated in Figure 4 are shown in Figure 5. Equipment costs are the same. The system using more manual methods is still lowest in total cost, at $160. 70 per 1,000 gallons or $18.29less than the more mechanized methods. Thus, if the estimate of wage . rates for 1970 is correct, the same manual methods would be used.
What about equipment costs in 1970? They are likely to change, too. The index of machinery and motive parts prices rose from 108 in 1950 to 151 in 1960 or 38 percent. The index of all industrial commodity prices rose from 114 in 1953 to 128 in 1960 or 12.5 percent. A 30 percent increase in equipment costs is used for 1970.
- 8-
F igu r e 4 - Labor and Equ ipment Cos t Per 1000 Gallons for Assumed Ice Cream Produc t Mix*
Receive Ingredients
Pr epare Mix
F reezing Ice Cream
Packaging Ice Cream
Storing Ice Cream
Loading Out
Cleaning Equipment
Total
L E T
L E T
L E T
L E T
L E T
L E T
L E T
L E T
Mechanized
Bulk Hand Truck Method
$ .93 .53 -$ 5.37 117 . 80 $ 6 . 30
1 HTST Method
$ 4. 01 2. 29 $ 29.82 127.46
- - -$ 33 . 83
1 Three Tube
Method
$ 4. 57 2.61 - -$ 25.82 24 . 88 $ 30.39
T Method A
$ 21. 13 12.07 - -
$ 27 . 20 24 . 41 $ 48.33
l Me thod A
$ 4.23 2.42 --$ 1. 98 10. 01 $ 6 . 21
~ Method A
$ 1. 37 . 80 --
$ * . 79 -
$ 1. 37
• Method A
$ 22 . 32 12.75 $ . 80 2.94
--$ 23. 12
~ Method A
$ 58 . 56 33 . 48 --
$ 90 . 99 308.29 ---$ 149.55
Manual
Can and Hand Truck Method
L $ . 44 ~ E $ . 04 .25 T $ .48
I Batch Method
L $ 7.07 4.04 --E $ 23.06 126.30 ---T $ 30 .13
1 Single Tube
Method
~ L $ 4. 29 2. 45 E $ 25.31 23.04 T $ 29.60 ---
! Method B
L $ 32 .17 18.38 ---E $ 3.83 25.41 ---T $ 36 . 00
~ Method B
L $ 1. 71 .98 E $ 2.34 9. 38 --T $ 4. 05
~ Method B
L $ 1. 19 .69 --E $ . 57 1. 15 --T $ 1. 76
~ Method B
L $ 23.01 13. 14 - -E $ . 53 .44 --T= $ 23.54
~ Method B
L $ 69.88 39.93 ---E $ 55.68 185.97 - --T $125 . 56
* Source: James C . Taylor , Ice Cream Manufac turing Plants in the Midwest -Methods, Equipment and Layou t, Marketing Research Report 477,
A.M.S., U.S . O.A. L = Labor ; E= equipment; T = total

-9-
Figure 5 - Labor and Equipment Cost Per 1000 Gallons from Figure 4 with Assumed 5% Increase in Wage Rates*
Receive Ingredients
Prepare Mix
Freezing Ice Cream
Packaging
Ice Cream
Storing Ice Cream
Loading Out
Cleaning Equipment
Total Costs
Mechanized
Truck Method
$
Method
$ 6.02 35.84
Three Tube Method
$ 6.36
Method A
$ 33.53 34.33
Method A
$ 88.00 178.99
Manual
$ .66 .70
Batch Method
$ 10.63
$ 2.58
$ 1. 81 2.38
Method B
$ 34.56 35.09
Method B
$105.02 160.70
* The top figure on each cell is the labor cost and the bottom figure is total labor and equipment cos t.

-10-
Figure 6 - Labor and Equipment Cost Per 1000 Gallons from Figure 4 with Assumed 3% Increase in Equipment Costs*
Receive Ingredients
Prepare Mix
Freezing Ice Cream
Packaging Ice Cream
Storing Ice Cream
Loading Out
Cleaning Equipment
Total Costs
Mechanized
Bulk-Hand Truck Method
$ 2.57 6.80
$ 0 1. 37
Method A
$ 1. 04 23.36
Method A
$118.29 176.85
Manual
Can and Hand Truck Method
$ 3. 04
4. 75
Method B
.74 1.93
Method B
$ .69 23.70
Method B
$72.38 142.26
* The top figure is each cell is the equipment cost and the bottom figure
is the total labor and equipment cos t.

-11-
Equipment and total cost for the two methods of producing ice cream of the specified product mix with the projected 30 percent higher equipment co sts but no change in wage rates are presented in Figure 6. As expected, the more manual methods are still least-cost at $142.26 per 1,000 gallons, or $34.59 less than the more mechanized system. It would appear that for a plant producing in the neighborhood of 150,000 gallons of ice cream annually, the more manual methods of processing would be lowest in total cost over a wide range of expected price changes.
Total labor and equipment costs for the two methods if both 50 percent higher wage rates and 30 percent higher equipment costs are experienced by 1970 are shown in Figure 7. Total equipment and labor costs for the more manual methods would be $177.40 per 1,000 gallons, or $28.89 below the more mechanized methods. Note that total labor and equipment costs increase $56. 74 per 1,000 gallons or 38 percent for the more mechanized system from 1960 to 1970. Total labor and equipment costs increase $51.84 or 41 percent for the more manual system.
It was previously mentioned that the retail price had shown a downward trend in the 1950' s primarily because of the increased proportion of pre-packaged half-gallon carton sales. Will the average retail price in the 1960' s continue down in the face of expected rising labor and equipment rates? Average retail prices might continue down if (1) the trend toward larger containers continues; (2) ingredient costs and/or container costs go down; (3) more efficient production systems are used; (4) more efficient distribution systems are used. Otherwise, there will be pressures to raise retail prices of ice cream.
Mathematical Programming
As previously discussed, mathematical programming is available to management to solve complex problems of system selection.
EFFECT OF VOLUME ON COST
Knowledge about the relationship between cost and volume is useful to management. Such knowledge is useful in bidding for additional business, evaluating the loss of present business, planning advertising expenditure, and evaluating planned excess capacity. Use of the
following techniques which show the effect of volume on cost provides valuable information on which to base decisions regarding these and other problems.
Profiles
Cost and other data from studies made in comparable plants may provide useful profiles to show the relationship of cost to volume.
Profit-Volume Analysis
The profit-volume analYSiS, with appropriate modifications, can be used by any size of firm. It is useful in determining the effect of volume on cost and is a positive instrument of cost control.
A profit-volume analysis is a simplified way of viewing costs and profits which is used in making management deciSions. Briefly, the profit-volume analysis involves splitting expenses into those that are variable and those that are fixed. The variable expenses or per unit expenses are subtracted from the selling price leaving the margin to cover the fixed

-12-
Figure 7 - Labor and Equipment Cost Per 1000 Gallons from Figure 4 with As s umed 5% Increase in Wage Rates and 3% Increase in Equipment Costs.
Receive Ingredients
Prepare Mix
Freezing Ice Cream
Packaging Ice Cream
Storing Ice Cream
Loading Out
Cleaning Equipment
Total Costs
Increas e from 1960 Per Cent Increase
Mechanized
Bulk-Hand Truck Method
$ 8.93
Method A
$ 2.10
Method A
$ 34.57
Method A
$206.29
$ 56.74 + 38%
Manual
Can and Hand Truck Method
$ 5.62
Method B
$ 2.55
Method B
$ 35.25
Method B
$177.40
$ 51. 84 + 41%

expenses. By dividing fixed cost by the margin, the number of units of product that · must be sold to break even is determined.
Since selling price, costs and margins vary markedly among the many items produced, a system of adjusted units should be used to establish a common denominator among margins. Thus, different sizes and quantities of products are classified so that margins are equal among all the various products sold. Larger firms may find it desirable to compute costs and margins for each individual item produced.
-13-
An example of the profit-volume analysis for a hypothetical plant is given. Although the data are rough, this is probably pretty close to the true picture for an ice cream plant in the range of 150?000 gallons annually. The cost data and allocations listed at the bottom of this page are made on the basis of financial and other records that would be kept by the plant.
Assume that the average selling price is $1.36 per gallon. By subtracting the variable cost per unit from the average selling price, it can be seen that the margin available to recover the fixed cost is 56 cents. Therefore, by dividing the fixed cost by the margin, it is apparent that 150,000 gallons of ice cream ($84,000== 150,000)
$ .56 would have to be sold to break even.
F igure 8 - Pr ofit -Volume An alysis for Ice Cream Pl ants
10
'2 5 e>- O
10 bre"k~ even point
20
~ 30
'" ~ :; '" 40 ~
'" c
'" 50 ~
" il
E ~ 60 ~
0 U
'" 70 " >< iZ
80
20 40 60 80 100 120 140 160
Volu me (thousa nd s ga llons )
Sal es Profl r Conr ribmi u(l Ma rgin $ .56 x Gallons ~5 2, 000 = $85,1 20. 00
$85, 120.00 - Fi xed cos t $84,000. 00 = $1, 120. 00 Profit
The cost and profit structure of this hypothetical ice cream plant is illustrated in Figure 8. With a margin for profits of 56 cents and sales of 152,000 gallons, the profit contribution to recover fixed cost is $85, 120. The firm shows a profit of $1,120. In bidding for additional business, any price received over 80 cents would help defray fixed cost and improve the firm's profit position. Conversely, loss of sales to a competitor can reduce profits 56 cents
==============================================================================
Raw product and ingredients Container and p2.ckaging supplies Supplies and services purchased Taxex, insurance, repairs, depreciation Wages and salaries Advertising, rentals, miscellaneous
Total
Variable cost per gallon
$ .57 .15 .08
$. 80
Fixed annual cost
$25,500.00 43,500.00 15,000.00
$84,000.00 ================================~=============================================

-14-
per gallon of sales lost. Of course, the profit-volume analysis accurately portrays costs and margins within reasonable limits above and below optimal capacity, not for all volumes from zero to infinity.
SIZE OF PLANT
The same trend is evident in size of ice cream plants as in almost every other segment of our economy - - fewer but larger economic units. Between 1939 and 1958, the number of plants producing wholesale ice cream dropped 37 percent. With the large increase in ice cream sales, average production per plant increased 248 percent. But the ice cream industry is still characterized by relatively small producing units. For the U. S. in 1957, only 309 of the 3,395 plants making ice cream (9.1 percent) produced 750,000 gallons or more annually. There were 1,459 plants (43 percent of the total) with production of less than 25,000 gallons annually. The size distribution of ice cream plants in Indiana, the East North Central region, and the U. S. in 1957 was as follows: j/
Less than Over 25,000 750,000 Total gal. (!fa) gal. (!fa) No.
Indiana 28.2 10.0 110 E. N. Central 40.7 7.9 .868 u. S. 43.0 9.1 3,395
The size distribution of plants making all frozen dairy products (ice cream, ice milk, sherbet, mellorine) was about the same as for plants making ice cream only.
What factors should be considered in planning ideal plant size? The list would certainly include (1) expected economies of scale in processing and distribution; (2L size of market and estimate of future expansion; (3) procurement area and
ingredients used; (4) alternative use of milk in the event ice cream manufacture is used to dispose of surplus milk. These factors should be combined so as to give the lowest possible total cost.
The following techniques can be used in studying problems relating to plant size.
Profiles
In considering what size plant would be best, cost and other data in other size plants may be used as a profile. From such studies, management can get a rough idea of the effect of plant size on costs.
Synthesis
The best Glevice for studying plant size is the technique of synthesis. Synthesis is the process of assembling physical and cost data for various functional parts of the plant into a whole. It is a sort of model building or simulation. Synthesis can be done with varying degrees of precision, and it is strongly recommended for any size plant concerned with planning the scale of operations.
Taylor used this technique in studying the effect of size on cost. Total labor and equipment costs for six sizes of plants using four different processing methods in producing a specified product mix are shown in Table 1. Costs are in terms of dollars per 1,000 gallons of ice cream produced. The variation in costs among the several production methods declines as the size of plant increases. This indicates that larger plants are more flexible in adopting different production methods efficiently. The difference in cost between the 100,000 gallon and the 350,000 gallon plant is over $100 per 1,000 gallons under all work methods. Stated. another way, labor and equipment costs in the smallest plant averages about 2 1/2 times higher than in the largest plant. This effect of size on equipment and labor costs is shown in Figure 9 .
.J! Plants Manufacturing Dairy Products, March 1959. AMS-301, USDA.

-15-
Table 1. Effect of plant volume on total labor and equipment cost for plants using four systems of processing (dollars per 1,000 gallons). =====================================================================================
Plant System of processing Variation
Volume (gal.) I a/ II b/ IIIc/ IV d/
100,000 $208.47 $208.53 $178.68 $182.12 $29.85
150,000 145.80 145.79 134.24 129.21 16.59
200,000 120. SO 118.61 105.22 103.59 17.21
250,000 104.58 104.35 89.00 89.93 15.58
300,000 89.92 89.65 81.85 79.55 10.37
350,000 80.06 76.30 75.90 74.29 5.77
Variation $128.41 $132.23 $102.78 $107.83
High cost 260% 273% 235% 245% Low cost ====================================================================================
Source: James C. Taylor, Volume and Its Effects on Costs in Ice Cream Manufacturing Plants unpublished report, Purdue University.
_~/ Receive ingredients by the bulk method, prepare mix by the HTST method, freeze by tl1e three-tube method, prepare 5-gallon and 2 1/2-gallon cans by the conveyor method, package gallon cartons by tile spring table method, package 1/2-gallon cartons, pint cartons, 5-ounce cups, and 3-ounce cups by the filler method, store by the double-stack method, load out by the conveyor method, and clean up all equipment utilized.
~/ Receive ingredients by the bulk method, prepare mix by the HTST method, freeze by the three-tube method, package 5-gallon and 2 1/2-gallon cans by the conveyor method, package gallon cartons by the spring table, chute, and basket method, package l/2-gallon cartons and pint cartons by the filler chute, and basket method, package 5 -ounce and 3 -ounce cups by the filler and basket method, store and load out by the basket conveyor method, and clean all equipment utilized.
~/ Receive ingredients by the can methcd, prepare mix by the batch method, freeze by the single -tube method, package all containers by the manual method, store and load out by the manual method, and clean all equipment utilized.
~ Receive ingredients by the can-method, prepare mix by the batch method, freeze by the single -tube method, package 5 -gallon and 2 1/2 -gallon cans by the manual method, package gallon cartons by the spring table method, package gallon cartons by the filler method, package pint cartons, 5 -ounce and 3 -ounce cups by the manual method, store and load out by the conveyor method, and clean all equipment utilized.
How can the small plant compete with its larger counterpart under these conditions of declining costs? Several explanations are possible.
1. Equipment and labor costs are a relatively small part of total costs, and the small operator can offset this disadvantage in an area such as ingredients.
2. Smaller sales areas and fewer routes may result in more efficient distribution systems.
3. Margins available may mean that ice cream manufacture is the best alternative in disposing of surplus milk, in spite of relatively high processing costs. A recent study of milk manufacturing in the New York milk shed made by the USDA

----til H ('j
..--;
..--;
8 til c 0
..--;
..--; ('j
0 0 0 0 rl
H Q) p, +-> til 0 U
-16-
Figure 9 - Effect of Plant Volume:: on Total Labor and Equipment Cost for Plants Us ing Four Systems of Processing*
220
200
180
160
140
120
100
80
o
-----
-• • • • •
,. •
3
* Source: James C. Taylor, Volume and Its Effects on Cos ts in Ice Cream Manufacturing Plants, unpublished report, Purdue University
100 150 200
KEY
(1) Type 1 Plant
(2) Type 2 Plant
(3) Type 3 Plant
(4) Type 4 Plant
1
~.. ", ~ .. " .. , . .-.. -.
250 300 350
ANNUAL PLANT VOLUME - 1000 GAL.

-17-
Figu re 10 - U, S, PlcJnt Sal es o f Ice Cream - Perc entage of Tutu l Vulume •
% l Oa
80
60
- --
Pe rcentage of Total Volum e
Nove lti es and speci ah ics
Bulk
----40 -~ ----' --- ~ I--" - Pi ntS a nd qua rl S ~
20
1-'"-o J95J -----1954
Half ga llons a nd ga llons ..l
1957
'" 1960
I
• mos cly pints
..l
1951 ES[imared: 1958 -59 projec ted II moscl y half gall oM
-
-
-
-
196
indicated that ice cream mix and several skim product combinations returned higher net margins to proce s sor s than did other · product combinations. §j
4. Small processors are willing to take a lower return for their labor or have family labor available.
5. The small processor is living on his depreciation in hopes of better times while his asset structure weakens.
PRODUCT MIX
V!hat products and sizes should be produced ? How can the optimal product mix be determined? Management's objective in selecting the product mix is to select that combination of products and sizes which maximizes total profits.
Substantial changes have taken place in the combination of products and sizes making up ice cream sales. For example, Figure 10 shows the changes that have taken place in the composition of U. S. sales between 1951 and 1960. Half-gallon and gallon sales and prepackaged containers increased from 8 to 46 percent of total sales. This increase took place largely at the expense of bulk sales for hand-packing which declined from 46 to 18 percent and pints which decreased from 25 to 15 percent.
The following techniques can be used to determine the optimal product mix.
Profiles
Cost studies for comparable operations made by others can be used as a profile to give a rough idea of costs for specific products •
Cost Accounting
Cost accounting can give valuable information concerning costs of operations and an insight into product cost. There is a question as to how detailed these analyses should be, but even the smallest plant should do fairly accurate cost accounting. Considerable data are already available for a cost accounting system, as a by-product of such things as tax reports, reports to regulatory agencies, and the like.
Unit Cost System
Most ice cream plants should consider establishing a unit cost system. Here various items of expense are broken down into a cost per unit such as cost per gallon. This system will be particularly useful for comparing your costs with those of others, and in giving some indication of product cost.
Unit Product Cost System
Larger ice cream plants should consider the feasibility of establishing a detailed system of unit costs for each item produced. This system is fairly expensive but provide s accurate data on which sound decisions can be made. It also greatly enhances cost control.
5/ McAllister, C. E., and D. A. Clarke, Aug. 1960. Class III Milk in the New York Mtlkshed: IV. Processing Margins for Manufactured Dairy Products, Market Research Report No. 419. AMS, USDA.

-18-
Linear Programming
Linear programming is a technique larger firms may find useful in solving complex problems concerning the optimal product mix. Computers may be employed here. 6/
SUMMARY
A variety of economic engineering techniques for planning ice cream operations have been applied to several problem areas
ice cream plant managers must consider. In deciding what technique should be used in a specific plant, consideration of the cost of using these techniques relative to potential gain must be considered. Plants of any size or type should be able to find a technique or modification of one that suits their individual requirements. Regardles s of which device is used in planning operations, management will have to put forth some degree of effort. But use of these planning techniques should reward this effort in improved efficiency and profits.
(jj An example of the use of linear programming in solving product mix problems is given in Snyder, James C., and Charles E. French, Aug. 1958. Selection of Product Line for a Fluid Milk Plant by Activity Analysis, Research Bulletin 667, Agricultural Experiment Station, Purdue University.


![FP6036367€ANTIOXI ANTIOXI€€Decontamination€techniques ... · Nonchemical€decontamination€techniques 9 4.1.2 Ultrasonic€cleaning 10 4.1.3 Dry€ice€blasting€[14]](https://img.dokumen.tips/doc/110x75/5f0664d77e708231d417c629/fp6036367aantioxi-antioxiaadecontaminationatechniques-nonchemicaladecontaminationatechniques.jpg)


