Embed Size (px)
Citation preview

2007 Annual Report

1 Letter to Shareholders18 Pharmaceuticals23 Pharmaceuticals: Growth Drivers26 Nutritional Products31 Nutritional Products: Growth Drivers 32 Medical Products37 Medical Products: Growth Drivers40 Creating Greater Access to Health Care42 Financial Report44 Consolidated Financial Statements and Notes62 Management Report on Internal Control Over Financial Reporting63 Reports of Independent Registered Public Accounting Firm64 Financial Instruments and Risk Management65 Financial Review74 Summary of Selected Financial Data75 Directors and Corporate Officers76 Shareholder and Corporate Information
Abbott is a global, diversified health care company devoted to the discovery, development, manufacture and marketing of pharmaceuticals, nutritional products for children and adults, and medical products, including devices, diagnostic tests and instruments. The company employs more than 68,000 people and markets its products in more than 130 countries.
Swimming is a big part of 5-year-old Arden Cantwell’s life. Unfortunately, so is cancer. As part of Arden’s ongoing treatment, she needs regular blood transfusions. With its unique automated processing technology, Abbott Prism ensures the safety of her donated blood, allowing Arden to enjoy her swimming lessons.
On the cOveR:Abbott Prism — Arden Cantwell, San Antonio, Texas

Miles D. White / Chairman of the Board and Chief Executive Officer
Abbott • 2007 AnnuAl RepoRt
Miles White photographed in Shanghai, China. With its rapidly growing economy, China represents one of several emerging markets where Abbott is expanding its global presence.
Dear Fellow Shareholder: 2007 was an outstanding year for Abbott as we delivered strong growth across our broad mix of leading health care businesses. Together, these businesses provide our company — and our investors — with a diverse mix of cash flows and multiple sources of profitable growth. Our strength is our balance. With each goal we achieve, we build further on this balance, positioning Abbott for sustained, double-digit performance in the years ahead.

2005 2006 2007
$8.6 $10.1 $11.3
$11.4 $14.6
2005 2006 2007
$12.2
$9.9 $10.9 $13.0
$10.1 $12.9
$11.4
$20.0
$25.9 $22.3
$20.0
$25.9 $22.3 n pharmaceuticals
n nutritional and Medical products
Sales by Business Group*(dollars in billions)
n u.S. Sales
n International Sales
Sales by Geography*(dollars in billions)
2005 2006 2007
$8.6 $10.1 $11.3
$11.4 $14.6
2005 2006 2007
$12.2
$9.9 $10.9 $13.0
$10.1 $12.9
$11.4
$20.0
$25.9 $22.3
$20.0
$25.9 $22.3 We strive to balance our
portfolio among businesses, as well as geographies. In 2007, for the first time, revenues outside the United States exceeded those within.
When we look at the uncertainty of the global economic
environment, we see challenges for most companies across
virtually every market sector. Nonetheless, we see Abbott
becoming stronger and more successful as we continue
to shape it around three main defining attributes: today, our
company is balanced, global and strong.
Bal anced
The diverse mix of our business portfolio is our core strength
and Abbott’s greatest differentiator. It’s the foundation of our
stability, and it provides us the opportunity for sustained growth
across our four major business groups: pharmaceuticals,
nutritional products, diagnostics and medical devices.
We’ve chosen to compete in attractive health care businesses,
where our science can have the greatest impact on patients’
lives and where we have strong commercial positions. We’ve
aligned our commitments with society’s most pressing
health care needs. In doing so, we’re addressing pervasive,
high-priority health conditions through multiple technologies
and approaches.
For instance, Abbott helps patients and physicians treat heart
disease through all of its major businesses: we are a leader in
testing to identify cardiovascular conditions, in pharmaceutical
treatments to improve patients’ cardiovascular health, in
nutritional products that help to improve cardiovascular status
and in stents to relieve acute vascular conditions by reopening
blocked arteries. We provide similarly balanced arrays of prod-
ucts to address other high-priority public health challenges,
such as diabetes and HIV.
This broad base of technological expertise and market
strength provides Abbott a wealth of opportunity that distrib-
utes our growth across a number of different sectors — and
that allows us to sustain the quality of our performance. Longer
term, our goal remains a balanced mix of sales among our
broad base of businesses.
GloBal
We strive to balance our portfolio among businesses, as well
as geographically. Abbott has long been an international busi-
ness; today, we are truly a global company. While the United
States is still by far our largest single national market, it no
longer accounts for the majority of our total sales, as it had
since the company’s founding. In 2007, for the first time ever,
our revenues outside the United States slightly exceeded
those within.
While we expect the United States to remain an important mar-
ket for many years to come, we also recognize that, with the rise
of major new market economies, such as China, India, Russia
and Latin America, the rest of the world will play a much larger
role than ever before in our future growth. Consequently, we are
building our business around the world to capture the continued
emergence of new international markets.
Separating our international nutritional products and pharma-
ceuticals businesses into distinct, focused organizations has
paid significant dividends. Both businesses have grown stronger
apart than they did previously as a single, multiline division. In
2007, our international pharmaceuticals business delivered sales
growth of nearly 17 percent, and our international nutritional
products business grew more than 18 percent.
2
Abbott • 2007 AnnuAl RepoRt
*Sales excluding Boehringer Ingelheim products. For sales including these products, see page 74.

To meet future market demand, Abbott invested in a state-of-the-art biologics facility in Puerto Rico (left) and a nutrition manufacturing plant in Singapore to support its growing inter-national nutritional products business.
We’ve seen similar results with medical products, where Abbott
Diabetes Care achieved revenue growth of 18 percent interna-
tionally. In addition, most of our diagnostics sales are outside
the United States and performing well in emerging markets.
Achieving this kind of international growth is a priority in all our
major businesses. As rapid population growth in emerging
economies increases demand for health care products, we see
significant long-term opportunities around the world.
StronG
Of course, our breadth is an advantage only because of the
strength across our businesses. Abbott is a major player with
promising opportunities in every market in which we participate.
Pharmaceuticals
In 2007, Humira, our treatment for a variety of autoimmune
diseases, became Abbott’s most successful product in our
history. It was approved for the treatment of Crohn’s disease
and quickly captured 30 percent of the U.S. market. Since
February, we’ve launched Humira for the treatment of psoriasis
in both Europe and the United States, as well as for juvenile
rheumatoid arthritis in the United States. We continue to
develop Humira for ulcerative colitis. To keep up with Humira’s
growth and expected demand, last year, we completed con-
struction of our largest capital investment ever, the state-of-the-
art Abbott biotechnology manufacturing plant in Puerto Rico.
With our rapid integration of Kos Pharmaceuticals in 2007,
we established Abbott as a significant player in the lipid man-
agement market. The addition of the Kos portfolio, particularly
Niaspan, the leading product for raising HDL, or good choles-
terol, complements the position we’d built with TriCor, our
treatment for patients with high triglycerides. With our strong
lipid pipeline, we expect to sustain the growth of this franchise
in one of the world’s largest health care marketplaces.
Nutritional Products
Our U.S. nutritional products business, of course, is a long-
time leader. We’re finding new ways to meet consumer needs
with a renewed emphasis on product innovation, with products
such as Similac Sensitive and NutriPals fruit bars. This is in
addition to our strong international performance, perhaps best
characterized by our second consecutive year of rapid growth
in major Asian markets. To meet this surging regional demand,
we are building a new production facility in Singapore that will
come online in 2009.
Medical Products
In 2007, our medical products businesses grew double digits,
with significant contributions to sales from our vascular business
and nearly double-digit growth in our diabetes care business,
driven largely by the success of our more convenient FreeStyle
Lite meter, which is steadily gaining new user share.
After a late 2006 launch of our Xience V drug-eluting stent in
Europe, we saw excellent acceptance and share gains through-
out 2007. In November, the U.S. Food and Drug Administration
(FDA) Circulatory System Devices Advisory Panel recommended
approval in the United States, which we anticipate this year.
Our diagnostics business introduced new instruments and
assays, and is growing faster than its market worldwide. Our
molecular diagnostics unit grew sales significantly faster than its
market in 2007, thanks to the successful launch of our m2000
system in Europe and the United States.
Abbott • 2007 AnnuAl RepoRt
3

Abbott • 2007 AnnuAl RepoRt
Abbott Science
The key to our strength in all of these markets is the quality of
our products and of the scientific advances they provide. We
carefully shape our considerable investment in research and
development around what patients and health care professionals
need. Our scientists and engineers are performing distinguished
and distinguishing work, providing major advances across the
spectrum of care.
We’ve made refinements to our pharmaceutical discovery
process that are enhancing our productivity and delivering
compounds that have breakthrough potential. We’re doing
highly innovative work in neuroscience, where we’ve devel-
oped compounds that target receptors in the brain that
help regulate pain, mood, memory and other neurological
functions to address such conditions as attention deficit
hyperactivity disorder and Alzheimer’s disease. We’re also
doing leading-edge work in oncology research. The National
Cancer Institute and the journal Nature have recognized the
strength of Abbott’s science. In 2007, we also entered into an
agreement with Genentech to codevelop two novel, Abbott-
discovered cancer therapeutics.
The effectiveness of our science spans our businesses. For
example, we’re developing next-generation drug-eluting stents,
including a new bioabsorbable stent that could represent a
significant advance in this area of medicine.
Our Organization
In 2007, Rick Gonzalez, my longtime friend and colleague,
retired as Abbott’s chief operating officer after an exemplary
30-year career. We thank him for his contributions over the years.
With Rick’s departure, we realigned our operating structure
under four executive vice presidents — of pharmaceuticals,
nutritional products, diagnostics and medical devices —
reporting directly to me.
e xcellinG
In summary, Abbott is well prepared for its future. We under-
stand the economic and environmental pressures that face
companies today. Our confidence in delivering consistent results
to our shareholders despite these challenges speaks to our
ability to adapt, execute and optimize the many opportunities
that our mix of businesses provides.
Business diversity alone is not enough. It’s the nature of Abbott’s
business diversity that sets us apart. We have chosen to partici-
pate in businesses with a high degree of relevance for the future
of medicine, where technological and scientific superiority can
advance the state of care and provide competitive advantage.
As a result, we are ambitious, ready and determined to continue
capturing the vast array of opportunities before us.
In 2007, we made Abbott a better and stronger company.
Our goal is to do the same this year and every year. By doing
so, we’ll continue to deliver outstanding performance for
the people who rely upon us, including patients, health care
professionals and shareholders.
Miles D. WhiteChairman of the Board and Chief Executive OfficerMarch 3, 2008
4
“With each goal we achieve, we build further on this balance, positioning Abbott for sustained, double-digit performance in the years ahead.”
“We are ambitious, ready and determined to continue capturing the vast array of opportunities before us.”

Abbott todAy
Balanced • Global • Strong

Abbott • 2007 AnnuAl RepoRt
Abbott’s strong 2007 results reflect the performance of a balanced portfolio of higher- growth, innovation-driven businesses that align with current and emerging patient needs worldwide.
6

Abbott • 2007 AnnuAl RepoRt
Medical Products
Animal Health Diabetes Care Diagnostics Molecular Diagnostics Point of Care Spine Vascular
Nutritional Products
Adult Nutrition Healthy Living Pediatric Nutrition
Pharmaceuticals
Anesthesia Anti-infectives Cardiovascular Immunology Metabolics Neuroscience Oncology Pain Care Renal Care Virology
7

Abbott • 2007 AnnuAl RepoRt
Abbott is expanding its global presence steadily to maximize the impact its products can have for patients everywhere.
8

Abbott • 2007 AnnuAl RepoRt
Nutrition Demand Increasing in Emerging MarketsState-of-the-Art
Biologics PlantCompleted
HIV MedicineApproved for theDeveloping World
Xience V Gains Market Share Outside the United States
9
North America
In early 2008, we launched the fifth new disease indication for Humira — plaque psoriasis. In 2007, to maintain our biologics leadership, we completed construction of a state-of-the-art manufacturing facility in Puerto Rico for Humira and other biologics in our pipeline.
South America
Continued physician and consumer support of the FreeStyle Mini blood glucose meter drove strong sales in our diabetes care business. Sales in South America increased more than 20 percent in 2007.
Europe
Abbott’s Xience V drug-eluting stent continues to gain market share in Europe, Asia and Latin America, as physicians appreciate its deliverability and compelling clinical data. Xience V is expected to launch in the United States in 2008.
Africa
Aluvia (also known as Kaletra), our HIV protease inhibitor, is now available in a total of 103 countries, including 24 African countries. Aluvia does not require refrigeration, a critical step toward improving patient access and care in the developing world.
Asia
Population growth and improving economic conditions are increasing demand for our nutritional products in emerging markets, such as China and Southeast Asia. Abbott is building a new manufacturing facility in Singapore to keep pace with this rapid market expansion.
Following are selected Abbott global events that took place in 2007:
DiabetesCare SalesGrowing inSouth America

Abbott • 2007 AnnuAl RepoRt
10
Built on 120 years of success, Abbott generated another year of strong results in 2007, while, at the same time, investing in its future.

Abbott • 2007 AnnuAl RepoRt
$13 billionin international sales
15.3%net Sales Worldwide*(dollars in billions)
cash Dividends per Share(dollars per share)
R&D Investment(dollars in billions)
in 2007sales growth
2003 2004 2005 2006 2007
$16.2
$18.1
$20.0
$22.3
$25.9
2003 2004 2005 2006 2007
$1.6$1.7
$1.8
$2.3
$2.5
2003 2004 2005 2006 2007
11
$.98$1.04
$1.10
$1.18
$1.30
*Sales excluding Boehringer Ingelheim products. For sales including these products, see page 74.**Excludes $0.6 billion of other sales.
in 2007
Sales by Major operating Segment**(dollars in billions)
nutritionalproducts$4.4
Medical Devices$3.1
pharmaceuticals$14.6
Diagnostics$3.2

Abbott • 2007 AnnuAl RepoRt
12
Abbott is investing to discover and develop new technologies and treatments across a broad spectrum of important, rapidly growing areas of medical need.

Abbott • 2007 AnnuAl RepoRt
Abbott is the only company with a bioabsorbable drug-eluting coronary stent in human clinical trials. Made of polylactic acid, our bioabsorbable stent is designed to restore blood flow in clogged arteries and then be fully absorbed by the body.
R&D FocuS > IMMunology
ABT-874: A Promising Biologic
R&D FocuS > vASculAR
13
In addition to new indications for Humira, we’re advancing new biologics for autoimmune diseases, such as ABT-874, which is in late-stage development for psoriasis and Crohn’s disease.
A Next-Generation Drug-Eluting Stent

Abbott • 2007 AnnuAl RepoRt
R&D FocuS > DIABeteS cARe
PersonalizingMedicine
R&D FocuS > MoleculAR DIAgnoStIcS
14
R&D FocuS > cARDIovASculAR
AdvancingLipidManagement
We are advancing the detection and treatment of cancer, HIV and other serious diseases with the development of more sensitive molecular tests that can improve patient care through pharmacogenomics: predicting which patients are likely to benefit the most from a specific treatment option.
Abbott is developing promising drug-combination lipid therapies, recently receiving U.S. FDA approval for Simcor, which addresses LDL (bad cholesterol) and HDL (good cholesterol) in a single pill. ABT-335, our next-generation fenofibrate, is in development as both a stand-alone and combination therapy.
Accurate, Convenient Monitoring
Abbott scientists are designing devices for patients to monitor diabetes more accurately and easily. This builds on our estab-lished presence in blood glucose monitoring to help a diabetes population expected to nearly double by 2030.

Abbott • 2007 AnnuAl RepoRt
R&D FocuS > neuRoScIence
15
Abbott is at the forefront of new treatments for Alzheimer’s disease, attention deficit hyperactivity disorder (ADHD) and pain that have the potential to improve disease management. Abbott has also submitted for U.S. FDA approval a new controlled-release formulation of Vicodin for pain.
New Hope forAlzheimer’s, ADHD and Pain
R&D FocuS > InFectIouS DISeASeS
Abbott scientists are conducting early-stage research to develop drugs that directly block the hepatitis C virus, which affects more than 170 million people worldwide. These compounds have the potential to improve clinical treatment and tolerability.
Cutting-Edge Hepatitis C Research
R&D FocuS > oncology
Abbott scientists are pursuing breakthrough research focused on unique, targeted, less-toxic treatments that inhibit tumor growth and improve the response to common cancer therapies, such as radiation and chemotherapy.
A Promising Cancer Pipeline

Abbott • 2007 AnnuAl RepoRt
2007 was a year in which Abbott delivered strong performance and maintained leadership positions across its businesses, reaching a number of important milestones.
16

Abbott • 2007 AnnuAl RepoRt
17
Launched the FreeStyle Lite blood glucose monitoring system, which
has automated calibration, making it easier for patients to test quickly.
Submitted a new drug application to the U.S. FDA for
Introduced PediaSure NutriPals fruit bars, the only children’s snack bar with
one serving of fruit in every bar.
Gained market share in Europe, Asia and Latin America with Xience V, our drug-eluting
stent, which demonstrated superiority over the most widely used drug-eluting stent in reducing vessel renarrowing.
Launched a new Niaspan tablet, the leading medication for
boosting HDL, or good cholesterol.
a fixed-dose combination of Niaspan and simvastatin that targets both good
and bad cholesterol in a single pill.
Simcor,
FirSt HalF 20 07
Achieved
sales growth across pharmaceuticals, medical products and international
nutritional products in 2007.
double-digit
Second HalF 20 07
Submitted Humira for global regulatory approval for psoriasis — the fifth new Humira disease indication.
Launched Humira for Crohn’s disease. Achieved more than $3 billion in worldwide Humira sales in 2007.
ABT-335,
Vicodin
Submitted a record number of major new products for regulatory approval in
2007, including
our next-generation fenofibrate, and controlled-release
for pain.

Abbott • 2007 AnnuAl RepoRt
Pharmaceuticals • Abbott is advancing science to develop effective treatments that can make a difference in patients’ lives. We also continue to pursue new therapeutic indications for existing medications that offer physicians and patients important treatment options.
Crohn’s disease severely affected Fiona Kilty’s health and her food choices. Humira has helped Fiona manage her disease, reducing her symptoms and the unpredictability of her daily life.
Fiona KiltyDublin, Ireland Humira
18
Niaspan TriCor Zemplar Kaletra /Aluviafor cholesterol
and triglycerides for triglyceridesand cholesterol
for chronic kidney disease for HIV
Synthroidfor thyroid disease


Abbott • 2007 AnnuAl RepoRt
Pharmaceuticals / Year in Review
Rodolfo Troya Zuñiga’s recent switch to the tablet formulation of Kaletra was an improvement that allowed him to simplify his HIV treatment regimen.
Kaletra
21
PHarmaceuticalS: anotHer StronG ye ar
In 2007, we achieved several important milestones in our pharmaceuticals business. Humira,
our flagship biologic to treat autoimmune diseases, achieved record sales of more than
$3 billion, reflecting its successful launch for Crohn’s disease. We enhanced our emerging lipid
franchise with a new Niaspan tablet and the submission of two more cholesterol compounds for
approval. And we advanced several therapies in our early- and late-stage pipeline, including a
regulatory submission for controlled-release Vicodin.
immunoloGy: BrinGinG more oPtionS to PatientS
Humira is Abbott’s biologic for the treatment of rheumatoid arthritis (RA), plaque psoriasis,
Crohn’s disease, psoriatic arthritis and ankylosing spondylitis — autoimmune disorders in
which a human protein, tumor necrosis factor (TNF), plays a role in disease activity. Humira
is a fully human monoclonal antibody that blocks TNF, reducing inflammation.
Following the 2007 introduction of Humira for Crohn’s disease, a chronic inflammatory disease
of the intestines, we launched our fifth and sixth Humira disease indications — psoriasis and
juvenile RA — in early 2008. Moderate to severe plaque psoriasis, characterized by very dry,
scaly areas of skin, affects 125 million people worldwide. In clinical trials, nearly 75 percent of
patients treated with Humira achieved a significant reduction in psoriasis symptoms.
In addition, Humira treats RA, a painful joint disease that afflicts more than 5 million people
worldwide; psoriatic arthritis, characterized by arthritis and psoriatic skin disease; and
ankylosing spondylitis, an inflammation of the spine that can result in extreme physical limitation.
Humira is also in development for ulcerative colitis, inflammation of the large intestine. With
its efficacy in multiple autoimmune diseases in a single, well-established product, Humira will
continue to bring relief to thousands of patients for years to come.
Beyond Humira, we advanced our next-generation biologic, ABT-874, in late-stage development
for Crohn’s disease and psoriasis. ABT-874 is a fully human monoclonal antibody designed to
Rodolfo Troya ZuñigaQuito, Ecuador

Abbott • 2007 AnnuAl RepoRt
Pharmaceuticals / Year in Review
22
target and neutralize interleukin-12 (IL-12) and interleukin-23 (IL-23), two proteins that regulate
inflammatory response. Phase II psoriasis results demonstrated that more than 90 percent
of patients treated with ABT-874 achieved a significant reduction in their disease — results
previously thought to be unattainable.
cardiovaScul ar: a comPreHenSive aPProacH to liPid manaGement
Abbott’s cardiovascular product portfolio and pipeline address the three lipid parameters that
contribute to cardiovascular disease: high triglycerides, low HDL (good cholesterol) and high
LDL (bad cholesterol). By 2010, Abbott’s growing cholesterol franchise has the potential to
include five unique patient therapies in the largest U.S. pharmaceutical market.
TriCor, our fenofibrate, continues to be an excellent therapy for lowering triglycerides, and in
2007, we launched a new tablet formulation of Niaspan, the leading therapy for raising HDL.
Low HDL is recognized as an independent risk factor for heart disease.
In our cardiovascular pipeline, we are building on the success of TriCor with ABT-335, our
next-generation fenofibrate, submitted for U.S. FDA approval in 2007. And through our
collaboration with AstraZeneca, we are codeveloping a single-pill, fixed-dose combination
therapy of AstraZeneca’s Crestor and ABT-335, which targets all three blood lipids. During 2007,
we also submitted Simcor for U.S. FDA approval and received approval in early 2008. Simcor is
a fixed-dose combination of Niaspan and simvastatin that addresses both HDL and LDL.
viroloGy: continued le aderSHiP in Hiv tre atment
Kaletra remains a leading protease inhibitor for HIV. Today, HIV can be treated as a chronic
disease, making long-term viral suppression, tolerability and convenience important for patient
success. Kaletra has robust resistance data, which indicates a low level of resistance for
patients new to therapy. This is important because resistance — when the virus is no longer
sensitive to a drug — is the leading cause of HIV treatment failure. In 2007, Abbott launched a
new, lower-strength Kaletra tablet, which is also suitable for use in children with HIV.
aBBot t Science: Bre adtH, dePtH and PromiSe
In addition to advancing a number of Humira indications and cholesterol compounds in our
late-stage pipeline, we moved forward several innovative therapies in pain management,
neuroscience, oncology, infectious diseases and asthma.
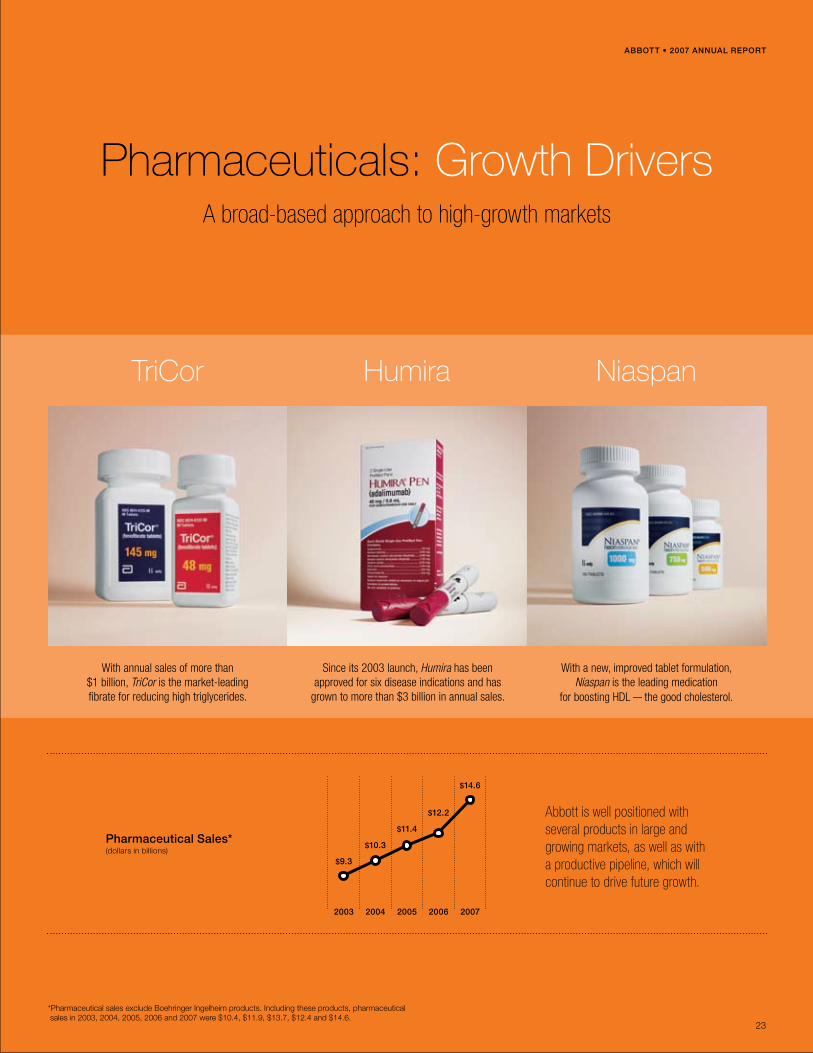
A broad-based approach to high-growth markets
Abbott • 2007 AnnuAl RepoRt
23
With annual sales of more than $1 billion, TriCor is the market-leading fibrate for reducing high triglycerides.
Since its 2003 launch, Humira has been approved for six disease indications and has
grown to more than $3 billion in annual sales.
With a new, improved tablet formulation, Niaspan is the leading medication
for boosting HDL — the good cholesterol.
pharmaceutical Sales*(dollars in billions)
2003 2004 2005 2006 2007
$9.3
$11.4
$12.2
$14.6
$10.3
*Pharmaceutical sales exclude Boehringer Ingelheim products. Including these products, pharmaceutical sales in 2003, 2004, 2005, 2006 and 2007 were $10.4, $11.9, $13.7, $12.4 and $14.6.
Pharmaceuticals: Growth Drivers
Abbott is well positioned with several products in large and growing markets, as well as with a productive pipeline, which will continue to drive future growth.
HumiraTriCor Niaspan

Abbott • 2007 AnnuAl RepoRt
Pharmaceuticals / Year in Review
Niaspan
24
Brian Kerwin, a professional actor, put a spotlight on controlling his cholesterol and improving his overall health. He relies on Niaspan, the leading therapy for raising HDL.
More than 75 million Americans suffer from chronic or acute pain. In 2007, we submitted for
regulatory review a more convenient controlled-release form of our branded pain medication,
Vicodin, to provide a longer duration of pain relief for the management of moderate to
moderately severe pain. Abbott scientists are also on the forefront of new therapeutic
approaches to treating cognitive disorders, such as Alzheimer’s disease and attention deficit
hyperactivity disorder (ADHD). This includes leading research targeting neuronal nicotinic
receptors, which play a role in regulating pain, mood, memory and other neurological functions.
In oncology, Abbott scientists are researching a number of cutting-edge treatments to fight
cancer. In 2007, Abbott partnered with Genentech to collaborate on the development and
commercialization of two Abbott compounds. This includes ABT-263, a Bcl-2 family protein
antagonist, designed to restore apoptosis (the natural process of cell death often inhibited
in cancer cells) and kill certain cancer cell types, such as lymphomas. Another compound,
a multitargeted kinase inhibitor, is designed to disrupt blood flow to tumors, inhibiting the
progression of cancer. Outside this collaboration, we continue development of additional
oncology therapies, including ABT-869, a PARP (Poly (ADP-ribose) polymerase) inhibitor,
which prevents DNA repair in cancer cells, enhancing the effectiveness of current therapies,
such as radiation.
We are conducting early-stage research in infectious diseases, including a partnership with
Enanta Pharmaceuticals Inc. to develop protease inhibitors for the treatment of hepatitis C,
which affects more than 170 million people worldwide.
In addition, Abbott is researching Flutiform, in late-stage development for asthma.
TAP, our joint venture with Takeda Pharmaceutical Company Ltd., submitted for U.S. FDA
approval TAK-390MR for the treatment of acid-related disorders. TAP is continuing the
development of febuxostat, a treatment for gout. Regulatory submission is expected in 2008.
Brian KerwinNew York, New York


Abbott • 2007 AnnuAl RepoRt
Nutritional Products • Abbott offers some of the world’s most trusted brands of pediatric nutrition, adult nutrition, performance nutrition and nutritious snack products, including Similac Advance, PediaSure, Ensure, EAS and NutriPals. We also provide specially formulated medical nutritional products for patients with unique dietary needs due to illness or injury.
For Tran Quoc Minh Quan, an energetic 5-year-old, Abbott’s Grow Advance, a nutritional supplement for children, delivers important nutrients that enhance his daily diet.
GrowAdvance
Pediatric Nutrition
26
Tran Quoc Minh QuanHo Chi Minh City, Vietnam
Adult Nutrition Healthy Living


Abbott • 2007 AnnuAl RepoRt
Nutritional Products / Year in Review
At 45, William Johnson is enjoying a new, healthier lifestyle. He credits EAS Myoplex products for helping him achieve and maintain his fitness goals.
Myoplex
29
William JohnsonColumbus, Ohio
nutritional ProductS: BuildinG our GloBal Fr ancHiSe
In 2007, we further strengthened our sales and marketing efforts for nutritional products in
rapidly growing international markets, such as Latin America and Asia. In the United States,
we introduced a number of new products, including Glucerna cereal, PediaSure NutriPals
fruit bars and Similac Sensitive infant formula.
international nutrition: Grow tH in emerGinG marketS
Improving economies and population growth in emerging markets, such as China, Southeast
Asia and Latin America are driving increased demand for nutritional products. As personal
incomes increase, parents seek better nutrition for their children and families. As a result,
sales of pediatric nutritional products — such as Similac Advance infant formula, Gain
Advance follow-on formula for older infants and PediaSure formula for picky eaters — have
increased significantly in recent years. Sales of Abbott nutritional products outside the United
States grew more than 18 percent in 2007.
We anticipate these trends to continue and have focused our business to address these
changing dynamics. We have realigned product research and development, enhanced our
focus on innovation and made a number of manufacturing and distribution improvements.
In 2009, we will open a new, state-of-the-art manufacturing facility in Singapore that will help
us meet growing consumer demand for our pediatric nutritional products in Asia.
In our adult nutrition business, we introduced in Asia a new heart-healthy formulation of
Ensure, a leading adult nutritional product that provides a source of complete, balanced
nutrition. The new formula is low in saturated fat and cholesterol, and its non-trans-fat formula
adheres to the latest dietary standards of the American Heart Association.

Abbott • 2007 AnnuAl RepoRt
Nutritional Products / Year in Review
30
u.S . nutrition: e xPandinG our Product PortFolio
In the multi-billion-dollar U.S. nutrition market, we continue to launch new and improved
products to better meet the changing needs of consumers and health care professionals.
Abbott expanded its Similac infant formula product line, adding Similac Sensitive for babies
with tolerance issues and Similac Go & Grow, designed for older babies and toddlers, ages
9 to 24 months. Our widely recognized Similac product line also includes Similac Organic,
the first certified organic infant formula from a major-brand manufacturer.
We also launched PediaSure NutriPals fruit bars, the only children’s snack bar made with
one serving of real fruit in every bar. NutriPals fruit bars contain nine times more fruit than
the leading cereal bar. In addition to fruit bars, Abbott markets NutriPals balanced nutrition
bars and NutriPals shakes, which have less sugar than the leading yogurt drinks.
A leader in the adult nutrition and healthy snack segment, we market a number of products
designed for active adults seeking convenient, balanced nutrition. Our Ensure, ZonePerfect,
EAS Myoplex and EAS AdvantEdge brands all offer a variety of snack and meal options.
For years, Abbott has been dedicated to developing specialized nutrition products for
people with diabetes. In 2007, we expanded our Glucerna product line to include several
new, consumer-friendly forms and flavors. We introduced Glucerna cereal, Glucerna mini-
snack bars and Glucerna snack shakes. We also refined the Glucerna shake formulation,
adding new ingredients that help consumers better prevent blood sugar spikes and actively
manage their diabetes. In addition, we packaged it in a consumer-friendly reclosable
plastic bottle. All of the Glucerna products meet American Diabetes Association nutrition
recommendations for protein, saturated fat, trans fat and all types of carbohydrates.
In the medical nutrition segment, Abbott also markets Juven, a therapeutic nutrition drink
mix designed for patients recovering from illness or surgery. Juven has been clinically
shown to help certain patients maintain lean body mass. In addition, Oxepa, a nutrition
therapy for critically ill patients with inflammatory lung conditions, has been clinically shown
to significantly reduce the risk of mortality in these patients.
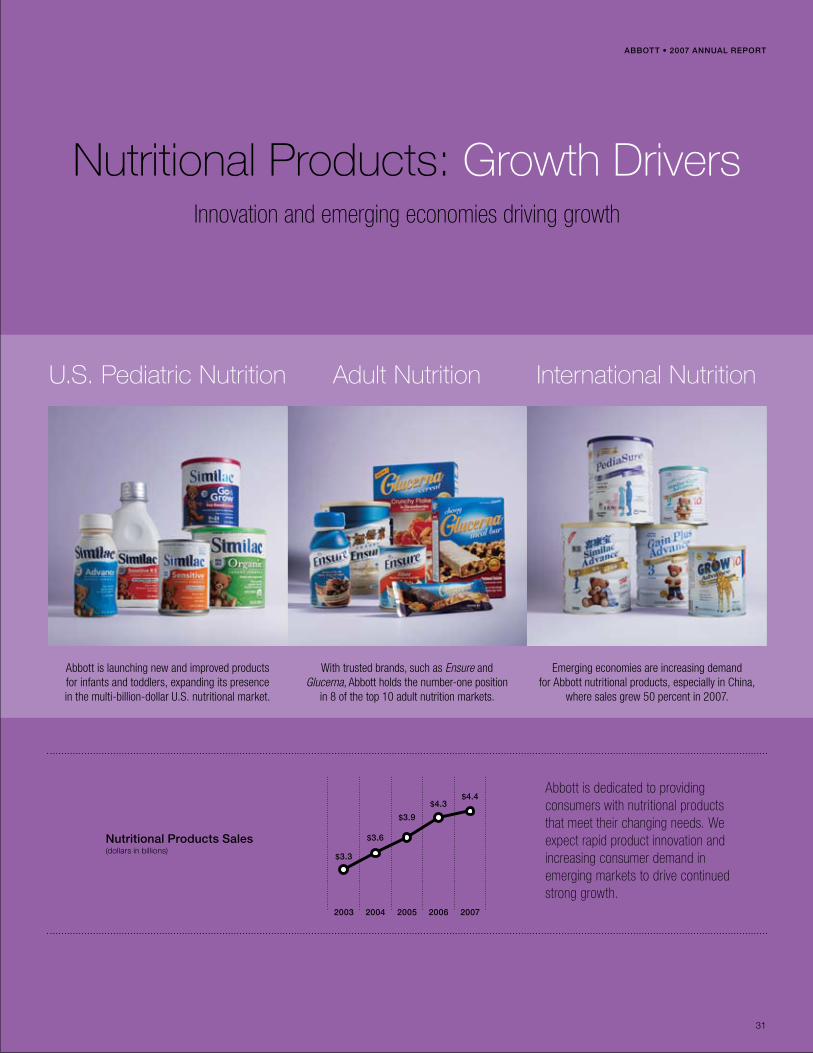
Nutritional Products: Growth DriversInnovation and emerging economies driving growth
Abbott is dedicated to providing consumers with nutritional products that meet their changing needs. We expect rapid product innovation and increasing consumer demand in emerging markets to drive continued strong growth.
nutritional products Sales(dollars in billions)
2003 2004 2005 2006 2007
$3.3
$3.9
$4.3$4.4
$3.6
Abbott • 2007 AnnuAl RepoRt
31
Adult Nutrition
Abbott is launching new and improved products for infants and toddlers, expanding its presence in the multi-billion-dollar U.S. nutritional market.
With trusted brands, such as Ensure and Glucerna, Abbott holds the number-one position
in 8 of the top 10 adult nutrition markets.
Emerging economies are increasing demand for Abbott nutritional products, especially in China,
where sales grew 50 percent in 2007.
International NutritionU.S. Pediatric Nutrition

Abbott • 2007 AnnuAl RepoRt
Medical Products • Abbott is an innovative leader in the fast-paced, high-growth medical technology space. Our medical products are advancing disease diagnosis, diabetes management and the treatment of vascular disease.
When Mary Ellen Tanaro Davis suffered complications following the birth of her son, an i-STAT test provided a rapid diagnosis at her bedside. Medical professionals made quick treatment decisions that helped her to return to music, one of her passions.
i-STAT
MolecularDiagnostics
Diagnostics
32
Vascular
Mary Ellen Tanaro DavisBowling Green, Kentucky
Diabetes Care


Abbott • 2007 AnnuAl RepoRt
Medical Products / Year in Review
The diagnosis of a heart condition was a shock to Parminder Swarup. Her doctor treated her with Xience V, featuring the latest technology in drug-eluting stents, unclogging her artery and relieving her chest pain.
Xience V
35
medical ProductS: BuildinG on innovation
In 2007, our medical products business introduced new products and advanced a pipeline of
promising technologies in high-growth, technology-driven markets. Most notably, we submitted
our next-generation drug-eluting stent, Xience V, for U.S. regulatory approval.
vaScul ar: e xPandinG our PreSence
Abbott’s leadership position encompasses three distinct vascular segments — coronary,
endovascular and vessel closure. In 2007, we submitted Xience V, our drug-eluting stent, for U.S.
FDA approval and expect to launch in 2008. Xience V is the first and only drug-eluting coronary
stent to be submitted for U.S. FDA approval with data demonstrating superiority in reducing vessel
renarrowing over the most widely used drug-eluting stent on the market today. We continue to
make progress with the international launch of Xience V, as physicians have recognized its safety,
world-class deliverability and unprecedented efficacy.
Drug-eluting stents are tiny metal scaffolds placed in diseased arteries to keep them open
and reestablish blood flow — a treatment alternative to open-heart surgery. Xience V features
Abbott’s market-leading Multi-Link Vision coronary stent platform and everolimus, a drug
that reduces tissue growth. Beyond Xience V, Abbott is developing additional next-generation
technologies, such as a bioabsorbable drug-eluting stent, which could address clinical
challenges that still exist.
Abbott’s endovascular business offers a portfolio of carotid stents, embolic protection devices,
balloons, wires and vessel closure devices. Carotid stenting is a less-invasive alternative to
surgery for patients at risk of stroke from a partially blocked carotid artery, the major blood
vessel in the neck that supplies blood to the brain. Our Xact and RX AccuLink stents are the
most widely used devices to treat diseased carotid arteries in the United States.
As a pioneer in closure technologies, Abbott offers products designed to facilitate secure
closure of the vascular access site following catheterizations. In 2008, we expect to launch
a next-generation StarClose device, our novel clip-based technology that closes the femoral
artery securely in a matter of seconds.
Parminder SwarupNew Delhi, India

Abbott • 2007 AnnuAl RepoRt
Medical Products / Year in Review
36
diaBeteS care: innovatinG to imProve diSe aSe manaGement
Abbott is building its presence in the large and growing blood glucose monitoring market by continuing to
introduce systems that are easier to use, require smaller blood samples and provide faster results.
In 2007, Abbott launched FreeStyle Lite, a new blood glucose monitoring system that improves patient
convenience by eliminating manual calibration required by most meters. In Europe, we launched FreeStyle
Freedom Lite, our second meter with automated calibration. Both meters return a fast, accurate reading
and require the world’s smallest blood sample. We anticipate U.S. approval in 2008.
We received European regulatory approval for the FreeStyle Navigator continuous glucose monitoring
system and expect U.S. approval in 2008. The FreeStyle Navigator measures glucose levels once per
minute, 24 hours a day, using a sensor worn on the body that wirelessly transmits readings to a pagerlike
device kept in a pocket or purse.
Currently in development is a fully integrated blood glucose monitoring system that combines a glucose
meter, test strips and lancing capabilities in one device, enabling simple point-and-click testing.
diaGnoSticS: a le ader’S PreSence worldwide
With nearly 70,000 customers in more than 100 countries, Abbott is a global leader in in vitro diagnostics.
We continue to transform the practice of medical diagnostics through innovative, automated systems that
lower costs and improve patient care. The largest and fastest-growing segment of our business is outside
the United States, where we’re seeing rapid uptake of our systems in emerging markets and Japan.
In 2007, we launched the Architect c16000, our large-volume chemistry analyzer, and the Architect
ci16200, which consolidates both immunoassay and clinical chemistry testing. Both systems will better
meet the needs of our large-volume laboratory customers by processing more tests, faster. We expanded
the Architect menu of assays, including an additional test for hepatitis B. We are also developing an
immunoassay analyzer to serve the needs of smaller-volume labs.
Abbott is also the worldwide leader in blood screening. The Abbott Prism blood analyzer is used in more
than 30 countries — nearly half of which use the system to screen 100 percent of their blood donations.
Point oF care: FaSter diaGnoSiS , Bet ter care
Our i-STAT point-of-care system provides physicians with the information they need to make life-saving
decisions in the intensive and acute care settings of the hospital. Our broad point-of-care portfolio
features key tests for cardiac diagnosis and routine diagnostic assessments, including our i-STAT
Chem8+ test, which combines eight tests from the most commonly requested chemistry panel on a
single cartridge. The U.S. FDA granted our Chem8+ test expanded availability for use in doctors’ offices
and clinics after it was deemed simple and accurate enough for use beyond the hospital setting.

Abbott • 2007 AnnuAl RepoRt
Medical Products: Growth DriversTechnology-focused businesses with high-growth potential
Abbott is introducing new products and advancing a pipeline of promising technologies in key high-growth, technology-driven markets around the world.
37
Vascular Diabetes Care Point of Care
Our emerging vascular business, including the Xience V drug-eluting stent, continues to offer the
opportunity for significant sales growth.
With a pipeline of new products, Abbott is focusing on promising new treatments for
the management of diabetes.
Our i-STAT point-of-care system provides fast test results at the patient’s bedside, which may help
physicians make quicker treatment decisions.
Medical products Sales*(dollars in billions)
2003 2004 2005 2006 2007
$3.3
$4.2
$5.2
$6.3
$3.7
*Medical products sales include Animal Health, Diabetes Care, Diagnostics, Spine and Vascular businesses.

Abbott • 2007 AnnuAl RepoRt
Medical Products / Year in Review
FreeStyleLite
38
molecul ar diaGnoSticS: advancinG tecHnoloGy to imProve Patient outcomeS
Molecular diagnostics — the analysis of DNA, RNA and proteins at the molecular level — is a
relatively new and fast-growing market. Our tests provide physicians with critical information based
on changes in patients’ genes and highly accurate detection of viruses and bacteria, allowing for
earlier diagnosis, selection of appropriate therapies and monitoring of disease progression.
Abbott’s product portfolio includes the m2000, an automated instrument for molecular testing
based on real-time PCR (polymerase chain reaction) technology. In 2007, we launched the m2000
in the United States with a test for HIV. In Europe, we market the m2000 with a complete menu of
infectious disease assays.
We continue to actively explore opportunities in the area of pharmacogenomics — the practice
of identifying which patients are likely to benefit the most from a specific treatment option. For
example, our PathVysion HER-2 assay is a DNA-based test that identifies which patients are likely
to benefit from Herceptin, a targeted breast cancer therapy.
We are also researching molecular diagnostics for several types of cancer and expect to introduce
new tests for melanoma and cervical cancer in Europe in 2008.
SPine: lever aGinG tecHnical e xPertiSe to imProve qualit y oF liFe
Abbott develops innovative devices and implants for the treatment of spinal disorders, traumatic
injuries and deformities. This year, we introduced the Universal Clamp spinal fixation system, a
unique implant designed to treat scoliosis and other spinal conditions.
animal He altH: lever aGinG our e xPertiSe
Abbott is advancing veterinary medicine and bringing value to small-animal veterinarians and
pet owners by adapting our strengths in human health. We market the AlphaTrak Blood Glucose
Monitoring System for cats and dogs, which, based on our FreeStyle blood glucose monitoring
technology, provides a fast, accurate response with just a tiny blood sample. Our surgical suite
product line addresses veterinary needs in anesthesia, fluid therapy and medical devices.
Joe Eldridge and Phil SoutherlandAtlanta, Georgia
Joe Eldridge and Phil Southerland used FreeStyle Lite, Abbott’s new blood glucose meter, in the 2007 Race Across America. Joe and Phil finished first in the race as members of Team Type I, a competitive bicycle racing team composed solely of people with diabetes.


Creating Greater Access to Health Care
Abbott • 2007 AnnuAl RepoRt
40
Abbott Chairman and CEO Miles White (second from right) dedicated the modernized laboratory in Mt. Meru, Tanzania, along with Dr. Omar Sharrif
Chande, medical officer in charge, Mt. Meru Hospital; Hon. Prof. David Mwakyusa, minister of health and social welfare, Tanzania; and Hon. Anna Abdallah, former minister of health, Tanzania. Abbott’s improvements have
tripled the facility’s capacity to serve 4 million people across the region.
Solar power systems installed at Abbott’s Temecula, California, site reflect our commitment to a cleaner environment. The 2,000 panels are expected to generate 500 kilowatts of power per year (the energy used annually by 100 average American homes), which will allow us to avoid 1.3 million pounds of
carbon dioxide emissions, among other environmental benefits.

Abbott • 2007 AnnuAl RepoRt
Citizenship influences all aspects of Abbott — how we advance business objectives, engage stakeholders, implement policies, apply social investment and philanthropy, and exercise influence to make a productive contribution to society.
Our key research and development contributions have the ability to improve patient care around the world. This includes work we’re conducting for treatments to address cancer and hepatitis C, breakthroughs in combination biologics, next- generation drug-eluting stents and advancements in diagnostics.
advancinG acceSS to He altH care
In 2007, Abbott and the Abbott Fund invested more than $380 million in grants, patient assistance programs, global product donations, humanitarian support and community programs that benefited millions of patients around the world:
• Donated$144millioninpharmaceuticalsandmedical products to assist humanitarian programs, medical missions and responses to natural disasters.
• Provided122,000U.S.patientswithfreemedicine,medical nutritional products and diabetes care products through the Abbott Patient Assistance Program.
• FormedtheSevereAdverseEventsConsortiumalongwith the U.S. Food and Drug Administration (FDA), academia and other pharmaceutical companies to identify genetic differences that cause negative responses to medication.
• Introducedalower-strengthAluvia tablet suitable for use in children living with HIV, the first protease inhibitor of its kind approved for pediatric patients. In 2007, children in Uganda became among the first in the world to gain access to the new medicine.
• AnnouncedaninitiativewiththeTanzaniangovernmentto modernize all of the country's regional hospital laboratories. Donated 1 million rapid HIV tests to support the country’s national HIV testing program.
• Reducedmortalityratesofprematureinfantsby25percent in Kosovo through a partnership program with Dartmouth Medical School and AmeriCares.
takinG action to PreServe tHe environment
Abbott launched significant initiatives to reduce the impact of our operations on the environment and establish aggressive goals for the company:
• BecamethefirstFortune500companytocommittogoing carbon neutral with our domestic fleet of 6,000 vehicles.
• Adoptedanewglobalenergypolicyoutliningseveral commitments, including:
Achieving a 30 percent reduction in overall CO2 emissions by 2011.
Investing in renewable energy capital projects, or energy sourcing, that produce no CO2 emissions at major manufacturing locations by 2011.
• Completedconstructionofasolarpowersystemtoproduce electricity for parts of the company’s vascular plant in Southern California, contributing to cleaner operations.
Based on our citizenship performance, Abbott was named to the Dow Jones Sustainability Index for the third straight year. The index is the leading benchmark of best-in-class economic, environmental and social performance of global companies.
The 2007 Global Citizenship Report details our commitment to innovation as the key to meeting health care needs, protecting the environment and strengthening our global workforce, partnerships and communities. For more details on 2007 performance and on how we plan to continue embedding citizenship thinking and action throughout the company, download the report at www.abbott.com/citizenship.
Global citizenship at Abbott is about enhancing and deepening the trust of the people we serve and the pride of the people who make our company work. We are committed to doing business in a responsible and sustainable way that brings wide-ranging benefits — health, social, economic — to the communities where we live and work.
41

2007 Financial Report

43
Abbott • 2007 AnnuAl RepoRt
44 Consolidated Statement of Earnings
45 Consolidated Statement of Cash Flows
46 Consolidated Balance Sheet
48 Consolidated Statement of Shareholders’ Investment
49 Notes to Consolidated Financial Statements
62 Management Report on Internal Control Over Financial Reporting
63 Reports of Independent Registered Public Accounting Firm
64 Financial Instruments and Risk Management
65 Financial Review
74 Summary of Selected Financial Data
75 Directors and Corporate Officers
76 Shareholder and Corporate Information

Abbott • 2007 AnnuAl RepoRt
44
Year Ended December 31 2007 2006 2005
Net Sales $25,914,238 $22,476,322 $22,337,808
Cost of products sold 11,422,046 9,815,147 10,641,111
Research and development 2,505,649 2,255,271 1,821,175
Acquired in-process and collaborations research and development — 2,014,000 17,131
Selling, general and administrative 7,407,998 6,349,685 5,496,123
Total Operating Cost and Expenses 21,335,693 20,434,103 17,975,540
Operating Earnings 4,578,545 2,042,219 4,362,268
Interest expense 593,142 416,172 241,355
Interest (income) (136,752) (123,825) (87,693)
(Income) from TAP Pharmaceutical Products Inc. joint venture (498,016) (475,811) (441,388)
Net foreign exchange (gain) loss 14,997 28,441 21,804
Other (income) expense, net 135,526 (79,128) 8,270
Earnings Before Taxes 4,469,648 2,276,370 4,619,920
Taxes on Earnings 863,334 559,615 1,247,855
Net Earnings $ 3,606,314 $ 1,716,755 $ 3,372,065
Basic Earnings Per Common Share $ 2.34 $ 1.12 $ 2.17
Diluted Earnings Per Common Share $ 2.31 $ 1.12 $ 2.16
Average Number of Common Shares Outstanding
Used for Basic Earnings Per Common Share 1,543,082 1,529,848 1,552,457
Dilutive Common Stock Options and Awards 16,975 6,876 11,646
Average Number of Common Shares Outstanding
Plus Dilutive Common Stock Options and Awards 1,560,057 1,536,724 1,564,103
Outstanding Common Stock Options Having No Dilutive Effect 6,406 23,567 22,469
The accompanying notes to consolidated financial statements are an integral part of this statement.
Consolidated Statement of Earnings(dollars and shares in thousands except per share data)

45
Abbott • 2007 AnnuAl RepoRt
Year Ended December 31 2007 2006 2005
Cash Flow From (Used in) Operating Activities:
Net earnings $ 3,606,314 $ 1,716,755 $ 3,372,065
Adjustments to reconcile net earnings
to net cash from operating activities —
Depreciation 1,072,855 983,485 868,808
Amortization of intangible assets 782,031 575,265 490,131
Share-based compensation 429,677 329,957 30,140
Acquired in-process research and development — 1,927,300 17,131
Investing and financing (gains) losses, net 356,331 277,388 125,328
Trade receivables (431,846) (101,781) (98,216)
Inventories 131,324 104,653 (88,257)
Prepaid expenses and other assets (418,344) (283,455) (406,858)
Trade accounts payable and other liabilities (82,960) (183,203) 199,703
Income taxes (261,539) (84,275) 537,429
Net Cash From Operating Activities 5,183,843 5,262,089 5,047,404
Cash Flow From (Used in) Investing Activities:
Acquisitions of businesses and technologies, net of cash acquired — (7,923,163) (295,123)
Acquisitions of property and equipment (1,656,207) (1,337,818) (1,207,493)
Sales of (investment in) Boston Scientific common stock;
and (investments in) note receivable and derivative financial instruments 568,437 (2,095,780) —
Purchases of investment securities (32,852) (33,632) (15,670)
Proceeds from sales of investment securities 17,830 18,476 783,599
Other (33,485) (25,712) 14,600
Net Cash (Used in) Investing Activities (1,136,277) (11,397,629) (720,087)
Cash Flow From (Used in) Financing Activities:
(Repayments of) net proceeds from issuance of short-term debt and other (3,603,481) 5,183,225 (1,528,180)
Proceeds from issuance of long-term debt 3,500,000 4,000,000 1,851,013
(Repayment) of long-term debt (441,012) (3,532,408) (150,000)
Purchases of common shares (1,058,793) (754,502) (1,302,314)
Proceeds from stock options exercised, including income tax benefit 1,249,804 502,782 223,637
Dividends paid (1,959,150) (1,777,170) (1,686,472)
Net Cash (Used in) From Financing Activities (2,312,632) 3,621,927 (2,592,316)
Effect of exchange rate changes on cash and cash equivalents 200,258 73,966 (193,954)
Net cash provided by operating activities of discontinued operations of Hospira, Inc. — 67,152 127,012
Net Increase (Decrease) in Cash and Cash Equivalents 1,935,192 (2,372,495) 1,668,059
Cash and Cash Equivalents, Beginning of Year 521,192 2,893,687 1,225,628
Cash and Cash Equivalents, End of Year $ 2,456,384 $ 521,192 $ 2,893,687
The accompanying notes to consolidated financial statements are an integral part of this statement.
Consolidated Statement of Cash Flows(dollars in thousands)

Abbott • 2007 AnnuAl RepoRt
46
December 31 2007 2006 2005
Assets
Current Assets:
Cash and cash equivalents $ 2,456,384 $ 521,192 $ 2,893,687
Investments, including $307,500 of investments
measured at fair value at December 31, 2007 364,443 852,243 62,406
Trade receivables, less allowances of —
2007: $258,288; 2006: $215,443; 2005: $203,683 4,946,876 4,231,142 3,576,794
Inventories:
Finished products 1,677,083 1,338,349 1,203,557
Work in process 681,634 686,425 630,267
Materials 592,725 781,647 708,155
Total inventories 2,951,442 2,806,421 2,541,979
Deferred income taxes 2,109,872 1,716,916 1,248,569
Other prepaid expenses and receivables 1,213,716 1,153,969 1,062,593
Total Current Assets 14,042,733 11,281,883 11,386,028
Investments 1,125,262 1,229,873 134,013
Property and Equipment, at Cost:
Land 494,021 488,342 370,949
Buildings 3,589,050 3,228,485 2,655,356
Equipment 10,393,402 9,947,503 8,813,517
Construction in progress 1,121,328 737,609 920,599
15,597,801 14,401,939 12,760,421
Less: accumulated depreciation and amortization 8,079,652 7,455,504 6,757,280
Net Property and Equipment 7,518,149 6,946,435 6,003,141
Intangible Assets, net of amortization 5,720,478 6,403,619 4,741,647
Goodwill 10,128,841 9,449,281 5,219,247
Deferred Income Taxes and Other Assets 1,178,461 867,081 1,657,127
$39,713,924 $36,178,172 $29,141,203
The accompanying notes to consolidated financial statements are an integral part of this statement.
Consolidated Balance Sheet(dollars in thousands)

47
Abbott • 2007 AnnuAl RepoRt
Consolidated Balance Sheet(dollars in thousands)
December 31 2007 2006 2005
Liabilities and Shareholders’ Investment
Current Liabilities:
Short-term borrowings $ 1,827,361 $ 5,305,985 $ 212,447
Trade accounts payable 1,219,529 1,175,590 1,032,516
Salaries, wages and commissions 859,784 807,283 625,254
Other accrued liabilities 3,713,104 3,850,723 2,783,473
Dividends payable 504,540 453,994 423,335
Income taxes payable 80,406 262,344 488,926
Current portion of long-term debt 898,554 95,276 1,849,563
Total Current Liabilities 9,103,278 11,951,195 7,415,514
Long-term Debt 9,487,789 7,009,664 4,571,504
Post-employment Obligations and Other Long-term Liabilities 3,344,317 3,163,127 2,155,837
Deferred Income Taxes — — 583,077
Commitments and Contingencies
Shareholders’ Investment:
Preferred shares, one dollar par value
Authorized — 1,000,000 shares, none issued — — —
Common shares, without par value
Authorized — 2,400,000,000 shares
Issued at stated capital amount —
Shares: 2007: 1,580,854,677;
2006: 1,550,590,438; 2005: 1,553,769,958 6,104,102 4,290,929 3,477,460
Common shares held in treasury, at cost —
Shares: 2007: 30,944,537;
2006: 13,347,272; 2005: 14,534,979 (1,213,134) (195,237) (212,255)
Earnings employed in the business 10,805,809 9,568,728 10,404,568
Accumulated other comprehensive income (loss) 2,081,763 389,766 745,498
Total Shareholders’ Investment 17,778,540 14,054,186 14,415,271
$39,713,924 $36,178,172 $29,141,203

Abbott • 2007 AnnuAl RepoRt
48
Year Ended December 31 2007 2006 2005
Common Shares:
Beginning of Year
Shares: 2007: 1,550,590,438; 2006: 1,553,769,958; 2005: 1,575,147,418 $ 4,290,929 $ 3,477,460 $ 3,189,465
Issued under incentive stock programs
Shares: 2007: 30,264,239; 2006: 14,456,341; 2005: 8,752,085 1,316,294 526,435 299,329
Tax benefit from option shares and vesting
of restricted stock awards (no share effect) 163,808 42,062 52,363
Share-based compensation 433,319 337,428 28,731
Issuance of restricted stock awards (100,248) (52,392) (27,125)
Retired - Shares: 2006: 17,635,861; 2005: 30,129,545 — (40,064) (65,303)
End of Year
Shares: 2007: 1,580,854,677; 2006: 1,550,590,438; 2005: 1,553,769,958 $ 6,104,102 $ 4,290,929 $ 3,477,460
Common Shares Held in Treasury:
Beginning of Year
Shares: 2007: 13,347,272; 2006: 14,534,979; 2005: 15,123,800 $ (195,237) $ (212,255) $ (220,854)
Issued under incentive stock programs
Shares: 2007: 2,063,123; 2006: 1,197,838; 2005: 588,821 37,080 17,492 8,599
Purchased
Shares: 2007: 19,660,388; 2006: 10,131 (1,054,977) (474) —
End of Year
Shares: 2007: 30,944,537; 2006: 13,347,272; 2005: 14,534,979 $ (1,213,134) $ (195,237) $ (212,255)
Earnings Employed in the Business:
Beginning of Year $ 9,568,728 $10,404,568 $10,033,440
Net earnings 3,606,314 1,716,755 3,372,065
Cash dividends declared on common shares
(per share — 2007: $1.30; 2006: $1.18; 2005: $1.10) (2,009,696) (1,807,829) (1,704,077)
Reclassification resulting from the application of the fair value option
to Boston Scientific common stock, net of tax (188,534) — —
Cost of common shares retired in excess of stated capital amount (237,958) (780,152) (1,315,397)
Cost of treasury shares issued below market value 66,955 35,386 18,537
End of Year $10,805,809 $ 9,568,728 $10,404,568
Accumulated Other Comprehensive Income (Loss):
Beginning of Year $ 389,766 $ 745,498 $ 1,323,732
Reclassification resulting from the application of the fair value option
to Boston Scientific common stock, net of tax 181,834 — —
Beginning of Year, as adjusted 571,600 745,498 1,323,732
Other comprehensive income (loss) 1,510,163 898,266 (578,234)
Adjustment to recognize net actuarial gain (loss)
and prior service cost as a component of
accumulated other comprehensive income (loss), net of tax — (1,253,998) —
End of Year $ 2,081,763 $ 389,766 $ 745,498
Comprehensive Income $ 5,116,477 $ 2,615,021 $ 2,793,831
The accompanying notes to consolidated financial statements are an integral part of this statement.
Consolidated Statement of Shareholders’ Investment(dollars in thousands except per share data)

49
Abbott • 2007 AnnuAl RepoRt
Note 1 — Summary of Significant Accounting Policies
Nature of Business — Abbott’s principal business is the discovery, development, manufacture and sale of a broad line of health care products.
Concentration of Risk and Guarantees — Due to the nature of its operations, Abbott is not subject to significant concentration risks relating to customers, products or geographic locations, except that three U.S. wholesalers accounted for 25 percent, 23 percent and 24 percent of trade receivables as of December 31, 2007, 2006 and 2005, respectively. Product warranties are not significant.
Abbott has no material exposures to off-balance sheet arrangements; no special purpose entities; nor activities that include non-exchange-traded contracts accounted for at fair value. Abbott has periodically entered into agreements in the ordinary course of business, such as assignment of product rights, with other companies which has resulted in Abbott becoming secondarily liable for obligations that Abbott was previously primarily liable. Since Abbott no longer main-tains a business relationship with the other parties, Abbott is unable to develop an estimate of the maximum potential amount of future payments, if any, under these obligations. Based upon past experi-ence, the likelihood of payments under these agreements is remote. Abbott periodically acquires a business or product rights in which Abbott agrees to pay contingent consideration based on attaining certain thresholds or based on the occurrence of certain events. In connection with the spin-off of Hospira, Inc., Abbott has retained liabilities for taxes on income prior to the spin-off and certain potential liabilities, if any, related to alleged improper pricing practices in con-nection with federal, state and private reimbursement for certain drugs.
Basis of Consolidation — The consolidated financial statements include the accounts of the parent company and subsidiaries, after elimination of intercompany transactions. The accounts of foreign sub-sidiaries are consolidated as of November 30, due to the time needed to consolidate these subsidiaries. In December 2005, certain foreign subsidiaries borrowed approximately $1.4 billion. These borrowings and related interest expense have been reflected on the December 31, 2005 Consolidated Balance Sheet and 2005 Consolidated Statement of Earnings. No other events occurred related to these foreign subsid-iaries in December 2007, 2006 and 2005 that materially affected the financial position, results of operations or cash flows.
Use of Estimates — The financial statements have been prepared in accordance with generally accepted accounting principles in the United States and necessarily include amounts based on estimates and assumptions by management. Actual results could differ from those amounts. Significant estimates include amounts for sales rebates, income taxes, pension and other post-employment benefits, valuation of intangible assets, litigation, share-based compensation, derivative financial instruments, and inventory and accounts receivable exposures.
Revenue Recognition — Revenue from product sales is recognized upon passage of title and risk of loss to customers. Provisions for discounts, rebates and sales incentives to customers, and returns and other adjustments are provided for in the period the related sales are recorded. Sales incentives to customers are not material. Historical data is readily available and reliable, and is used for estimating the amount of the reduction in gross sales. Revenue from the launch of
a new product, from an improved version of an existing product, or for shipments in excess of a customer’s normal requirements are recorded when the conditions noted above are met. In those situa-tions, management records a returns reserve for such revenue, if necessary. Sales of product rights for marketable products are recorded as revenue upon disposition of the rights. Revenue from license of product rights, or for performance of research or selling activities, is recorded over the periods earned.
Income Taxes — On January 1, 2007, Abbott adopted the provisions of FASB Interpretation No. 48, “Accounting for Uncertainty in Income Taxes.” Under this Interpretation, in order to recognize an uncertain tax benefit, the taxpayer must be more likely than not of sustaining the position, and the measurement of the benefit is calculated as the largest amount that is more than 50 percent likely to be realized upon resolution of the benefit. Deferred income taxes are provided for the tax effect of differences between the tax bases of assets and liabilities and their reported amounts in the financial statements at the enacted statutory rate to be in effect when the taxes are paid. U.S. income taxes are provided on those earnings of foreign subsidiaries which are intended to be remitted to the parent company. Deferred income taxes are not provided on undistributed earnings reinvested indefinitely in foreign subsidiaries as working capital and plant and equipment. Interest and penalties on income tax obligations are included in taxes on income.
Pension and Post-employment Benefits — Abbott accrues for the actuarially determined cost of pension and post-employment benefits over the service attribution periods of the employees. Abbott must develop long-term assumptions, the most significant of which are the health care cost trend rates, discount rate and the expected return on plan assets. Differences between the expected long-term return on plan assets and the actual return are amortized over a five-year period. Actuarial losses and gains are amortized over the remaining service attribution periods of the employees under the corridor method. On December 31, 2006, Abbott adopted the provisions of SFAS No. 158, “Employers’ Accounting for Defined Benefit Pension and Other Postretirement Plans.” This statement requires recognition of the deferrals on the balance sheet with a corresponding charge to Accumulated other comprehensive income (loss). Adoption of this statement on December 31, 2006 resulted in a decrease in Abbott’s shareholders’ equity of approximately $1.3 billion.
Fair Value Measurements — On January 1, 2007, Abbott adopted SFAS No. 157 “Fair Value Measurements.” Adoption of the provisions of this standard did not have a material effect on Abbott’s financial position. For assets and liabilities that are measured using quoted prices in active markets, total fair value is the published market price per unit multiplied by the number of units held without consideration of transaction costs. Assets and liabilities that are measured using signifi-cant other observable inputs are valued by reference to similar assets or liabilities, adjusted for contract restrictions and other terms specific to that asset or liability. For these items, a significant portion of fair value is derived by reference to quoted prices of similar assets or liabil-ities in active markets. For all remaining assets and liabilities, fair value is derived using a fair value model, such as a discounted cash flow model or Black-Scholes model. Purchased intangible assets are recorded at fair value. The fair value of significant purchased intangible assets is based on independent appraisals. Abbott uses a discounted
Notes to Consolidated Financial Statements

Abbott • 2007 AnnuAl RepoRt
50
cash flow model to value intangible assets. The discounted cash flow model requires assumptions about the timing and amount of future net cash inflows, risk, the cost of capital, terminal values and market participants. Intangible assets and goodwill are reviewed for impair-ment at least on a quarterly and annual basis, respectively.
Share-based Compensation — Through December 31, 2005, Abbott measured compensation cost using the intrinsic value-based method of accounting for stock options and replacement stock options granted to employees. Restricted stock awards and units have been amortized over their service period with a charge to compensation expense. In 2006, Abbott adopted SFAS No. 123 (revised 2004), “Share-Based Payment,” which requires that the fair value of stock options be recorded in the results of operations.
Litigation — Abbott accounts for litigation losses in accordance with SFAS No. 5. Under SFAS No. 5, loss contingency provisions are recorded for probable losses at management’s best estimate of a loss, or when a best estimate cannot be made, a minimum loss contin-gency amount is recorded.
Cash, Cash Equivalents and Investments — Cash equivalents consist of time deposits and certificates of deposit with original maturities of three months or less. Except for Abbott’s investment in the common stock of Boston Scientific, investments in marketable equity securities are classified as available-for-sale and are recorded at fair value with any unrealized holding gains or losses, net of tax, included in Accumulated other comprehensive income (loss). Beginning on January 1, 2007, the investment in the common stock of Boston Scientific is accounted for as a trading security with changes in fair value recorded in income. Investments in equity securities that are not traded on public stock exchanges are recorded at cost. Investments in debt securities are classified as held-to-maturity, as management has both the intent and ability to hold these securities to maturity, and are reported at cost, net of any unamortized premium or discount. Income relating to these securities is reported as interest income.
Abbott reviews the carrying value of investments in equity securities each quarter to determine whether an other than temporary decline in market value exists. Abbott considers factors affecting the investee, factors affecting the industry the investee operates in and general equity market trends. Abbott considers the length of time an invest-ment’s market value has been below carrying value and the near-term prospects for recovery to carrying value. When Abbott determines that an other than temporary decline has occurred, the investment is written down with a charge to Other (income) expense, net.
Inventories — Inventories are stated at the lower of cost (first-in, first-out basis) or market. Cost includes material and conversion costs.
Property And Equipment — Depreciation and amortization are provided on a straight-line basis over the estimated useful lives of the assets. The following table shows estimated useful lives of property and equipment:
Classification Estimated Useful Lives
Buildings 10 to 50 years (average 27 years)
Equipment 3 to 20 years (average 11 years)
Product Liability — Abbott accrues for product liability claims, on an undiscounted basis, when it is probable that a liability has been incurred and the amount of the liability can be reasonably estimated based on existing information. The liabilities are adjusted quarterly as additional information becomes available. Receivables for insurance recoveries for product liability claims are recorded as assets, on an undiscounted basis, when it is probable that a recovery will be real-ized. Abbott carries third-party insurance coverage in amounts that reflect historical loss experience, which does not include coverage for sizable losses.
Research and Development Costs — Internal research and develop-ment costs are expensed as incurred. Clinical trial costs incurred by third parties are expensed as the contracted work is performed. Where contingent milestone payments are due to third parties under research and development arrangements, the milestone payment obligations are expensed when the milestone results are achieved.
Note 2 — Supplemental Financial Information(dollars in thousands)
Current Investments: 2007 2006 2005
Time deposits and
certificates of deposit $ 56,943 $ 76,994 $ 62,406
Boston Scientific common stock 307,500 775,249 —
Total $ 364,443 $ 852,243 $ 62,406
Long-term Investments: 2007 2006 2005
Boston Scientific common stock $ — $ 248,049 $ —
Other equity securities 229,518 129,830 116,447
Note receivable from Boston
Scientific, 4% interest, due in 2011 850,594 837,260 —
Other 45,150 14,734 17,566
Total $1,125,262 $1,229,873 $134,013
In 2007, the Financial Accounting Standards Board issued Statement of Financial Accounting Standards No. 159, “The Fair Value Option for Financial Assets and Financial Liabilities.” SFAS No. 159 allows companies to measure specific financial assets and liabilities at fair value, such as debt or equity investments. The fair value option for the investment in Boston Scientific common stock was applied effective January 1, 2007. Abbott applied the fair value option to its investment in Boston Scientific stock under SFAS No. 159 because, unlike its other equity investments, the Boston Scientific stock is not a strategic investment and Abbott is required to dispose of the stock no later than October 2008. Abbott was subject to a limitation on the amount of shares it may sell in any one month through October 2007 and Abbott will not reacquire the Boston Scientific shares it sells. Accordingly, since at adoption, realized gains or losses were expected in the near future, the fair value option better represented the near-term expected earnings impact from sales of the stock. Under the fair value option, any cumulative unrealized gains or losses on an equity investment previously accounted for as an available-for-sale security is recorded as a cumulative effect adjustment to retained earnings as of the date of adoption of the standard. The pretax and after tax adjustment to
Notes to Consolidated Financial Statements

51
Abbott • 2007 AnnuAl RepoRt
Earnings employed in the business upon adoption was $297,000 and $189,000, respectively, and the fair value and carrying amount of the investment before and after adoption was approximately $1,000,000. The pretax and after tax adjustment to Accumulated other comprehensive income (loss) was $303,000 and $182,000, respectively. The effect of the adoption on deferred income taxes was not significant.
Other (income) expense, net for 2007 includes a $190,000 fair market value loss adjustment to Abbott’s investment in Boston Scientific common stock and a realized gain of $37,000 on the sales of Boston Scientific common stock. Other (income) expense, net for 2007 and 2006 includes fair value gain adjustments of $28,000 and $91,000, respectively, to certain derivative financial instruments included with the investment in Boston Scientific common stock.
Other Accrued Liabilities: 2007 2006 2005
Accrued rebates payable
to government agencies $ 661,822 $ 660,875 $ 620,300
Accrued other rebates (a) 444,633 390,863 206,514
All other 2,606,649 2,798,985 1,956,659
Total $3,713,104 $3,850,723 $2,783,473
(a) Accrued wholesaler chargeback rebates of $156,996, $122,729 and $83,551 at
December 31, 2007, 2006 and 2005, respectively, are netted in trade receivables
because Abbott’s customers are invoiced at a higher catalog price but only remit
to Abbott their contract price for the products.
Post-employment Obligations and
Other Long-term Liabilities: 2007 2006 2005
Defined benefit pension plans and
post-employment medical and
dental plans for significant plans $1,872,518 $1,897,525 $1,087,159
All other 1,471,799 1,265,602 1,068,678
Total $3,344,317 $3,163,127 $2,155,837
Comprehensive Income, net of tax: 2007 2006 2005
Foreign currency gain (loss)
translation adjustments $1,153,209 $1,033,968 $ (953,726)
Minimum pension liability adjustments,
net of taxes of $(199,100) in 2005 — 5,361 346,172
Net actuarial gains and prior service
cost and credits and amortization
of net actuarial losses and prior
service cost and credits,
net of taxes of $(225,500) 342,724 — —
Unrealized gains (losses) on
marketable equity securities, net of
income taxes of $(31,100) in 2007
and $118,500 in 2006 53,844 (177,722) (9,254)
Net adjustments for derivative
instruments designated
as cash flow hedges (39,614) 36,659 38,574
Other comprehensive income (loss) 1,510,163 898,266 (578,234)
Net Earnings 3,606,314 1,716,755 3,372,065
Comprehensive Income $5,116,477 $2,615,021 $2,793,831
Supplemental Comprehensive Income
Information, net of tax: 2007 2006 2005
Cumulative foreign currency
translation (gain) adjustments $(2,948,352) $(1,795,143) $(761,175)
Cumulative minimum
pension liability adjustments — — 8,931
Net actuarial losses and prior
service cost and credits 914,844 1,257,568 —
Cumulative unrealized (gains) loss
on marketable equity securities (66,403) 169,275 (8,447)
Cumulative losses (gain) on
derivative instruments designated
as cash flow hedges 18,148 (21,466) 15,193
On December 31, 2006, Abbott adopted the provisions of SFAS No. 158 “Employers’ Accounting for Defined Benefit Pension and Other Postretirement Plans.” Adoption of this statement resulted in a decrease in Abbott’s shareholders’ equity of $1,257,568, net of taxes of approximately $733,000.
Supplemental Cash Flow Information: 2007 2006 2005
Income taxes paid $951,648 $1,281,711 $746,504
Interest paid 563,891 428,868 213,067
Note 3 — Financial Instruments, Derivatives and Fair Value Measures
Certain Abbott foreign subsidiaries enter into foreign currency forward exchange contracts to manage exposures to changes in foreign exchange rates for anticipated intercompany purchases by those subsidiaries whose functional currencies are not the U.S. dollar. These contracts, totaling $281 million, $768 million and $222 million at December 31, 2007, 2006 and 2005, respectively, are designated as cash flow hedges of the variability of the cash flows due to changes in foreign exchange rates. Abbott records the contracts at fair value, resulting in a charge of $12 million in 2007 and credits of $16 million and $39 million to Accumulated other comprehensive income (loss) in 2006 and 2005, respectively. Ineffectiveness recorded in 2007, 2006 or 2005 was not significant. Accumulated gains and losses as of December 31, 2007 will be included in Cost of products sold at the time the products are sold, generally through the next twelve months.
Abbott enters into foreign currency forward exchange contracts to manage currency exposures for foreign currency denominated third-party trade payables and receivables, and for intercompany loans and trade accounts payable where the receivable or payable is denomi-nated in a currency other than the functional currency of the entity. For intercompany loans, the contracts require Abbott to sell or buy foreign currencies, primarily European currencies and Japanese yen, in exchange for primarily U.S. dollars and other European currencies. For intercompany and trade payables and receivables, the currency exposures are primarily the U.S. dollar, European currencies and Japanese yen. These contracts are recorded at fair value, with the resulting gains or losses reflected in income as Net foreign exchange (gain) loss. At December 31, 2007, 2006 and 2005, Abbott held $5.5 billion, $5.6 billion and $3.9 billion, respectively, of such foreign currency forward exchange contracts.
Notes to Consolidated Financial Statements
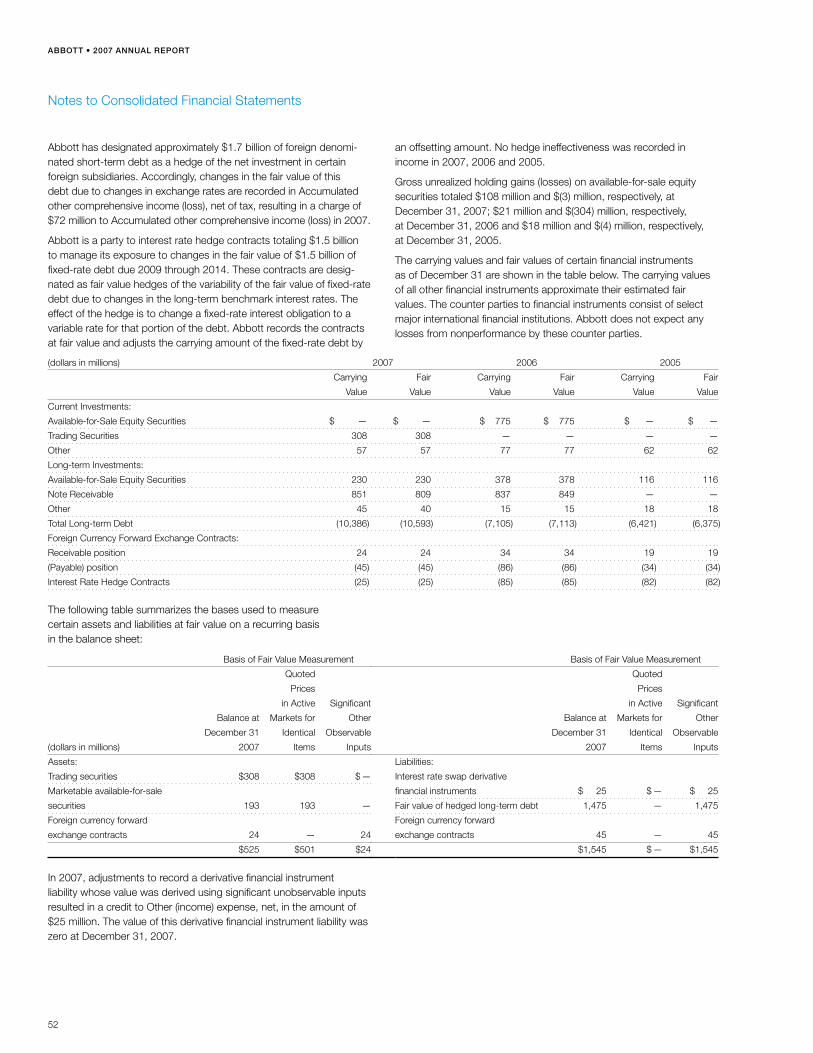
Abbott • 2007 AnnuAl RepoRt
52
(dollars in millions) 2007 2006 2005
Carrying Fair Carrying Fair Carrying Fair
Value Value Value Value Value Value
Current Investments:
Available-for-Sale Equity Securities $ — $ — $ 775 $ 775 $ — $ —
Trading Securities 308 308 — — — —
Other 57 57 77 77 62 62
Long-term Investments:
Available-for-Sale Equity Securities 230 230 378 378 116 116
Note Receivable 851 809 837 849 — —
Other 45 40 15 15 18 18
Total Long-term Debt (10,386) (10,593) (7,105) (7,113) (6,421) (6,375)
Foreign Currency Forward Exchange Contracts:
Receivable position 24 24 34 34 19 19
(Payable) position (45) (45) (86) (86) (34) (34)
Interest Rate Hedge Contracts (25) (25) (85) (85) (82) (82)
Notes to Consolidated Financial Statements
Abbott has designated approximately $1.7 billion of foreign denomi-nated short-term debt as a hedge of the net investment in certain foreign subsidiaries. Accordingly, changes in the fair value of this debt due to changes in exchange rates are recorded in Accumulated other comprehensive income (loss), net of tax, resulting in a charge of $72 million to Accumulated other comprehensive income (loss) in 2007.
Abbott is a party to interest rate hedge contracts totaling $1.5 billion to manage its exposure to changes in the fair value of $1.5 billion of fixed-rate debt due 2009 through 2014. These contracts are desig-nated as fair value hedges of the variability of the fair value of fixed-rate debt due to changes in the long-term benchmark interest rates. The effect of the hedge is to change a fixed-rate interest obligation to a variable rate for that portion of the debt. Abbott records the contracts at fair value and adjusts the carrying amount of the fixed-rate debt by
an offsetting amount. No hedge ineffectiveness was recorded in income in 2007, 2006 and 2005.
Gross unrealized holding gains (losses) on available-for-sale equity securities totaled $108 million and $(3) million, respectively, at December 31, 2007; $21 million and $(304) million, respectively, at December 31, 2006 and $18 million and $(4) million, respectively, at December 31, 2005.
The carrying values and fair values of certain financial instruments as of December 31 are shown in the table below. The carrying values of all other financial instruments approximate their estimated fair values. The counter parties to financial instruments consist of select major international financial institutions. Abbott does not expect any losses from nonperformance by these counter parties.
The following table summarizes the bases used to measure certain assets and liabilities at fair value on a recurring basis in the balance sheet:
Basis of Fair Value Measurement
Quoted
Prices
in Active Significant
Balance at Markets for Other
December 31 Identical Observable
(dollars in millions) 2007 Items Inputs
Assets:
Trading securities $308 $308 $ —
Marketable available-for-sale
securities 193 193 —
Foreign currency forward
exchange contracts 24 — 24
$525 $501 $24
In 2007, adjustments to record a derivative financial instrument liability whose value was derived using significant unobservable inputs resulted in a credit to Other (income) expense, net, in the amount of $25 million. The value of this derivative financial instrument liability was zero at December 31, 2007.
Basis of Fair Value Measurement
Quoted
Prices
in Active Significant
Balance at Markets for Other
December 31 Identical Observable
2007 Items Inputs
Liabilities:
Interest rate swap derivative
financial instruments $ 25 $ — $ 25
Fair value of hedged long-term debt 1,475 — 1,475
Foreign currency forward
exchange contracts 45 — 45
$1,545 $ — $1,545

53
Abbott • 2007 AnnuAl RepoRt
Notes to Consolidated Financial Statements
Note 4 — Post-Employment Benefits
(dollars in thousands)
Retirement plans consist of defined benefit, defined contribution and medical and dental plans. Information for Abbott’s major defined benefit plans and post-employment medical and dental benefit plans is as follows:
Defined Benefit Plans Medical and Dental Plans
2007 2006 2005 2007 2006 2005
Projected benefit obligations, January 1 $5,614,060 $5,041,086 $4,753,225 $ 1,520,412 $ 1,292,301 $ 1,112,124
Service cost — benefits earned during the year 249,098 218,662 205,286 57,991 55,618 43,554
Interest cost on projected benefit obligations 316,163 275,389 259,709 97,030 79,988 64,088
Losses (gains), primarily changes in discount and medical
cost trend rates, plan design changes, law changes and
differences between actual and estimated health care costs (308,760) 64,003 142,453 (100,739) 133,766 138,442
Benefits paid (228,009) (212,630) (195,964) (61,048) (67,511) (65,907)
Acquisitions — 86,024 — — 26,250 —
Other, primarily foreign currency translation 140,821 141,526 (123,623) — — —
Projected benefit obligations, December 31 $5,783,373 $5,614,060 $5,041,086 $ 1,513,646 $ 1,520,412 $ 1,292,301
Plans’ assets at fair value, January 1 $5,085,626 $4,348,779 $3,465,666 $ 212,035 $ 149,080 $ —
Actual return on plans’ assets 442,536 507,223 384,912 19,578 22,955 9,080
Company contributions 282,619 266,269 755,982 136,048 107,511 205,907
Benefits paid (228,009) (212,630) (195,964) (61,048) (67,511) (65,907)
Acquisitions — 92,760 — — — —
Other, primarily foreign currency translation 83,902 83,225 (61,817) — — —
Plans’ assets at fair value, December 31 $5,666,674 $5,085,626 $4,348,779 $ 306,613 $ 212,035 $ 149,080
Projected benefit obligations greater than
plans’ assets, December 31 $ (116,699) $ (528,434) $ (692,307) $(1,207,033) $(1,308,377) $(1,143,221)
Unrecognized actuarial losses, net 1,501,409 697,717
Unrecognized prior service cost (credits) 5,004 (264,499)
Net prepaid (accrued) benefit cost $ 814,106 $ (710,003)
Long-term assets $ 576,146 $ 84,266 $ — $ —
Short-term liabilities (27,360) (23,552) — —
Long-term liabilities (665,485) (589,148) (1,207,033) (1,308,377)
Net liability $ (116,699) $ (528,434) $(1,207,033) $(1,308,377)
Accrued benefit cost $ (463,789) $ (710,003)
Prepaid benefit cost 1,262,892 —
Intangible assets 130 —
Accumulated other comprehensive income (loss) 14,873 —
Net prepaid (accrued) benefit cost $ 814,106 $ (710,003)
Amounts Recognized in Accumulated Other
Comprehensive Income (loss):
Actuarial losses, net $ 919,710 $1,343,052 $ 635,302 $ 785,778
Prior service cost (credits) 39,911 42,659 (227,397) (248,947)
Total $ 959,621 $1,385,711 $ 407,905 $ 536,831
The projected benefit obligations for non-U.S. defined benefit plans was $1,754,000, $1,483,000 and $1,148,000 at December 31, 2007, 2006 and 2005, respectively. The accumulated benefit obligations for all defined benefit plans was $4,920,000, $4,738,000 and $4,158,000 at December 31, 2007, 2006 and 2005, respectively. For plans where the accumulated benefit obligations exceeded plan assets at
December 31, 2007, 2006 and 2005, the aggregate accumulated benefit obligations were $697,000, $544,000 and $465,000, respec-tively; the projected benefit obligations were $770,000, $592,000 and $508,000, respectively; and the aggregate plan assets were $84,000, $22,000 and $5,000, respectively.

Abbott • 2007 AnnuAl RepoRt
54
Other comprehensive income (loss) for 2007 includes amortization of actuarial losses and prior service cost of $81,110 and $3,573, respec-tively, and net actuarial gains of $341,408 for defined benefit plans. Other comprehensive income (loss) for 2007 includes amortization of actuarial losses and prior service credits of $54,727 and $21,550, respectively, and net actuarial gains of $95,748 for medical and dental plans. The pretax amount of actuarial losses and prior service cost (credits) included in Accumulated other comprehensive income (loss) at December 31, 2007, that is expected to be recognized in the net periodic benefit cost in 2008 is $46,100 and $3,800, respectively, for defined benefit pension plans and $42,600 and $(21,500), respec-tively, for medical and dental plans.
The weighted average assumptions used to determine benefit obliga-tions for defined benefit plans and medical and dental plans as of December 31, the measurement date of the plans, are as follows:
2007 2006 2005
Discount rate 6.2% 5.7% 5.5%
Expected aggregate average long-term
change in compensation 4.2% 4.2% 4.2%
The weighted average assumptions used to determine the net cost for defined benefit plans and medical and dental plans are as follows:
2007 2006 2005
Discount rate 5.7% 5.5% 5.6%
Expected return on plan assets 8.3% 8.5% 8.4%
Expected aggregate average
long-term change in compensation 4.2% 4.2% 4.2%
The assumed health care cost trend rates for medical and dental plans at December 31 were as follows:
2007 2006 2005
Health care cost trend rate
assumed for the next year 7% 7% 7%
Rate that the cost trend
rate gradually declines to 5% 5% 5%
Year that rate reaches the
assumed ultimate rate 2012 2012 2012
The discount rates used to measure liabilities were determined based on high-quality fixed income securities that match the duration of the expected retiree benefits. The health care cost trend rates represent Abbott’s expected annual rates of change in the cost of health care benefits and is a forward projection of health care costs as of the measurement date. A one-percentage point increase/(decrease) in the assumed health care cost trend rate would increase/(decrease) the accumulated post-employment benefit obligations as of December 31, 2007, by $205,600/$(163,500), and the total of
the service and interest cost components of net post-employment health care cost for the year then ended by approximately $28,700/$(22,400).
Approximately 70% of Abbott’s U.S. defined benefit plans and medical and dental plans assets are invested in equity securities with the remainder invested in primarily fixed income securities. The investment mix between equity securities and fixed income securities is based upon achieving a desired return, balancing higher return, more volatile equity securities, and lower return, less volatile fixed income securities. Abbott’s domestic plans are invested in diversified portfolios of public-market equity and fixed income securities. Investment allocations are made across a range of markets, industry sectors, capitalization sizes, and, in the case of fixed income securi-ties, maturities and credit quality. The plans do not directly hold any securities of Abbott. Abbott’s international defined benefit plans are invested in a corresponding manner, with some variance in portfolio structure around local practices.
The plans’ expected return on assets, as shown above, is based on management’s expectations of long-term average rates of return to be achieved by the underlying investment portfolios. In establishing this assumption, management considers historical and expected returns for the asset classes in which the plans are invested, as well as current economic and capital market conditions.
Abbott funds its domestic pension plans according to IRS funding limitations. In 2007 and 2006, $200,000 was funded to the main domestic pension plan and in 2005, $641,000 was funded to the main domestic pension plan. International pension plans are funded accord-ing to similar regulations. Abbott expects pension funding for its main domestic pension plan of $200,000 annually.
Total benefit payments expected to be paid to participants, which includes payments funded from company assets as well as paid from the plans, are as follows: Defined Medical and
Benefit Plans Dental Plans
2008 $ 234,600 $ 79,200
2009 237,800 84,500
2010 247,500 89,800
2011 256,800 95,600
2012 270,800 99,700
2013 to 2017 1,621,800 567,900
The Abbott Stock Retirement Plan is the principal defined contribution plan. Abbott’s contributions to this plan were $119,000 in 2007, $102,000 in 2006 and $100,000 in 2005.
Abbott provides certain other post-employment benefits, primarily salary continuation plans, to qualifying domestic employees, and accrues for the related cost over the service lives of the employees.
Notes to Consolidated Financial Statements
Defined Benefit Plans Medical and Dental Plans
2007 2006 2005 2007 2006 2005
Service cost — benefits earned during the year $ 249,098 $ 218,662 $ 205,286 $ 57,991 $ 55,618 $ 43,554
Interest cost on projected benefit obligations 316,163 275,389 259,709 97,030 79,988 64,088
Expected return on plans’ assets (425,639) (382,220) (360,304) (24,569) (16,253) (11,948)
Amortization of actuarial losses 81,110 78,288 65,744 54,727 44,612 31,569
Amortization of prior service cost (credits) 3,573 341 68 (21,550) (21,160) (21,160)
Total cost $ 224,305 $ 190,460 $ 170,503 $163,629 $142,805 $106,103

55
Abbott • 2007 AnnuAl RepoRt
Note 5 — Taxes on Earnings(dollars in thousands)
Taxes on earnings reflect the annual effective rates, including charges for interest and penalties. Deferred income taxes reflect the tax conse-quences on future years of differences between the tax bases of assets and liabilities and their financial reporting amounts. U.S. income taxes are provided on those earnings of foreign subsidiaries which are intended to be remitted to the parent company. Except for taxes on dividends that were remitted under the American Jobs Creation Act of 2004, Abbott does not record deferred income taxes on earnings reinvested indefinitely in foreign subsidiaries. Undistributed earnings reinvested indefinitely in foreign subsidiaries as working capital and plant and equipment aggregated $12,330,000 at December 31, 2007. It is not practicable to determine the amount of deferred income taxes not provided on these earnings. In the U.S., Abbott’s federal income tax returns through 2003 are settled, and the income tax returns for years after 2003 are open. There are numerous other income tax jurisdictions for which tax returns are not yet settled, none of which are individually significant. Reserves for interest and penalties are not significant.
Earnings before taxes, and the related provisions for taxes on earnings, were as follows:
Earnings Before Taxes 2007 2006 2005
Domestic $ 669,984 $ (868,384) $2,068,232
Foreign 3,799,664 3,144,754 2,551,688
Total $4,469,648 $2,276,370 $4,619,920
Taxes on Earnings 2007 2006 2005
Current:
U.S. Federal and Possessions $ 533,460 $ 491,579 $ 526,213
State 30,134 17,352 89,483
Foreign 675,205 633,947 616,118
Total current 1,238,799 1,142,878 1,231,814
Deferred:
Domestic (303,657) (544,678) 4,709
Foreign (74,367) (35,564) 17,035
Enacted tax rate changes 2,559 (3,021) (5,703)
Total deferred (375,465) (583,263) 16,041
Total $ 863,334 $ 559,615 $1,247,855
Differences between the effective income tax rate and the U.S. statutory tax rate were as follows: 2007 2006 2005
Statutory tax rate 35.0% 35.0% 35.0%
Benefit of lower tax rates and
tax exemptions in Puerto Rico,
the Netherlands and Ireland (12.6) (18.4) (6.4)
Effect of taxes on remittances of
foreign earnings in connection with
the American Jobs Creation Act of 2004 — — 5.3
Effect of non-deductible acquired
in-process research and development — 19.4 —
State taxes, net of federal benefit 0.4 0.3 1.2
Adjustments primarily related to
resolution of prior years’
accrual requirements — (5.8) (1.8)
Domestic dividend exclusion (3.1) (5.9) (2.7)
All other, net (0.4) — (3.6)
Effective tax rate on earnings 19.3% 24.6% 27.0%
As of December 31, 2007, 2006 and 2005, total deferred tax assets were $3,582,137, $3,172,933 and $2,040,906, respectively, and total deferred tax liabilities were $1,353,575, $1,136,964 and $1,355,181, respectively. Valuation allowances for deferred tax assets were not significant. The tax effect of the differences that give rise to deferred tax assets and liabilities were as follows: 2007 2006 2005
Compensation and employee benefits $ 861,483 $ 921,313 $ 37,578
Trade receivable reserves 336,542 236,218 227,251
Inventory reserves 219,795 163,004 161,934
Deferred intercompany profit 261,427 390,144 319,402
State income taxes 84,420 51,494 49,153
Depreciation (104,773) (134,649) (157,272)
Acquired in-process research and
development and other accruals
and reserves not currently deductible 1,751,428 1,268,445 1,132,954
Other, primarily the excess of book
basis over tax basis of intangible assets (1,196,627) (872,334) (1,095,182)
Total $ 2,213,695 $2,023,635 $ 675,818
On January 1, 2007, Abbott adopted the provisions of FASB Interpretation No. 48, “Accounting for Uncertainty in Income Taxes.” Under this Interpretation, in order to recognize an uncertain tax benefit, the taxpayer must be more likely than not of sustaining the position, and the measurement of the benefit is calculated as the largest amount that is more than 50 percent likely to be realized upon resolution of the benefit. Adoption of this Interpretation did not have a material impact on Abbott’s financial position. The following table summarizes the gross amounts of unrecognized tax benefits without regard to reduction in tax liabilities or additions to deferred tax assets and liabilities if such unrecognized tax benefits were settled:
January 1, 2007 $ 712,700
Increase due to current year tax positions 339,600
Increase due to prior year tax positions 146,700
Decrease due to prior year tax positions (10,900)
Settlements (62,000)
December 31, 2007 $1,126,100
The total amount of unrecognized tax benefits that, if recognized, would affect the effective tax rate is approximately $890,000. Abbott does not expect significant changes in the aggregate amount of unrecognized tax benefits that may occur within the next twelve months, other than tax settlements.
Among the provisions of the American Jobs Creation Act of 2004 was a provision that allows for the exclusion from income of a portion of the remittances of earnings of foreign subsidiaries to U.S. shareholders through December 31, 2005. In 2005, Abbott remitted in accordance with the provisions of the Act approximately $4,300,000 of foreign earnings previously reinvested indefinitely. The additional income tax expense recorded for the remittance was approximately $245,000.
Notes to Consolidated Financial Statements

Abbott • 2007 AnnuAl RepoRt
56
2007 2006 2005
Total Reportable Segment
Operating Earnings $6,428 $5,853 $5,455
Corporate functions and
benefit plans costs (e) (421) (449) (289)
Non-reportable segments 298 197 204
Net interest expense (456) (292) (154)
Acquired in-process and collaborations
research and development — (2,014) (17)
Income from TAP Pharmaceutical
Products Inc. joint venture 498 476 441
Share-based compensation (f) (430) (330) (30)
Other, net (g) (1,447) (1,165) (990)
Consolidated Earnings Before Taxes $4,470 $2,276 $4,620
(e) Corporate functions and benefit plans costs for 2006, includes a philanthropic
contribution of $70 to the Abbott Fund.
(f) The increase in share-based compensation in 2007 is partially due to the granting of
replacement stock options as a result of the increase in the market value of Abbott
common stock. Abbott adopted FASB No. 123 (revised 2004) “Share-Based Payment”
on January 1, 2006.
(g) Other, net for 2007 includes $197 for restructuring plans; $256 for acquisition
integration and related costs primarily associated with the acquisitions of Guidant’s
vascular intervention and endovascular solutions and Kos Pharmaceuticals Inc. and
a $190 fair market value loss adjustment to Abbott’s investment in Boston Scientific
common stock. Other, net for 2006 includes $281 for restructuring plans; $220 for
acquisition integration and related costs primarily associated with the acquisition
of Guidant’s vascular intervention and endovascular solutions businesses. Other,
net for 2005 includes $266 for restructuring and impairment charges.
Notes to Consolidated Financial Statements
Net Sales to Operating Depreciation Additions to External Customers (a) Earnings (Loss) (a) and Amortization Long-term Assets Total Assets
2007 2006 2005 2007 2006 2005 2007 2006 2005 2007 2006 2005 2007 2006 2005
Pharmaceuticals (b) (c) $14,632 $12,395 $13,691 $5,509 $4,522 $4,294 $330 $150 $170 $ 407 $2,615 $389 $ 9,197 $ 9,281 $ 6,766
Nutritionals (d) 4,388 4,313 3,937 855 1,206 1,036 115 112 99 388 184 81 3,261 2,467 2,219
Diagnostics 3,158 2,843 2,689 252 240 261 286 248 201 374 373 359 3,792 3,734 3,432
Vascular (c) 1,663 1,082 253 (188) (115) (136) 234 157 20 312 3,637 88 4,706 4,400 290
Total Reportable
Segments 23,841 20,633 20,570 $6,428 $5,853 $5,455 $965 $667 $490 $1,481 $6,809 $917 $20,956 $19,882 $12,707
Other 2,073 1,843 1,768
Net Sales $25,914 $22,476 $22,338
(a) Net sales and operating earnings for 2007 and 2005 were favorably affected by the relatively weaker U.S. dollar and were unfavorably affected by the relatively stronger U.S. dollar in 2006.
(b) The increase in Pharmaceutical Product segment sales in 2007 is due primarily to the acquisition of Kos Pharmaceuticals Inc. in December 2006 and the decrease in 2006 is due primarily
to the effects of the termination of a distribution agreement.
(c) Additions to long-term assets for the Pharmaceutical Products segment includes goodwill and intangible assets acquired of $1,590 and $821, respectively, in 2006 and for the Vascular
Products segment includes goodwill and intangible assets acquired of $1,688 and $1,195, respectively, in 2006.
(d) The decrease in the Nutritional Products segment operating earnings in 2007 was primarily due to the completion of the U.S. co-promotion of Synagis in 2006.
Note 6 — Segment and Geographic Area Information(dollars in millions)
Abbott’s principal business is the discovery, development, manufacture and sale of a broad line of health care products. Abbott’s products are generally sold directly to retailers, wholesalers, hospitals, health care facilities, laboratories, physicians’ offices and government agencies throughout the world. Abbott’s reportable segments are as follows:
Pharmaceutical Products — Worldwide sales of a broad line of pharmaceuticals. For segment reporting purposes, two pharmaceuti-cal divisions are aggregated and reported as the Pharmaceutical Products segment.
Nutritional Products — Worldwide sales of a broad line of adult and pediatric nutritional products.
Diagnostic Products — Worldwide sales of diagnostic systems and tests for blood banks, hospitals, commercial laboratories and alternate-care testing sites. For segment reporting purposes, three diagnostic divisions are aggregated and reported as the Diagnostic Products segment.
Vascular Products — Worldwide sales of coronary, endovascular and vessel closure products.
Abbott’s underlying accounting records are maintained on a legal entity basis for government and public reporting requirements. Segment disclosures are on a performance basis consistent with inter-nal management reporting. Intersegment transfers of inventory are recorded at standard cost and are not a measure of segment operat-ing earnings. The cost of some corporate functions and the cost of certain employee benefits are charged to segments at predetermined rates that approximate cost. Remaining costs, if any, are not allocated to segments. Effective in 2007, the Diagnostic segment was reorga-nized. Prior years’ segment information has been adjusted to reflect this change. For acquisitions prior to 2006, substantially all intangible assets and related amortization are not allocated to segments. The following segment information has been prepared in accordance with the internal accounting policies of Abbott, as described above, and are not presented in accordance with generally accepted accounting principles applied to the consolidated financial statements.

57
Abbott • 2007 AnnuAl RepoRt
Notes to Consolidated Financial Statements
2007 2006 2005
Total Reportable Segment Assets $20,956 $19,882 $12,707
Cash and investments 3,946 2,603 3,090
Current deferred income taxes 2,110 1,717 1,249
Non-reportable segments 1,575 1,486 1,341
All other, net, primarily goodwill
and intangible assets not allocated
to reportable segments 11,127 10,490 10,754
Total Assets $39,714 $36,178 $29,141
Net Sales to
External Customers (h) Long-term Assets
2007 2006 2005 2007 2006 2005
United States $13,252 $11,995 $12,707 $12,870 $13,536 $ 7,717
Japan 1,111 1,054 1,027 987 974 935
Germany 1,235 885 992 6,822 6,154 5,467
The Netherlands 1,271 1,061 899 211 185 156
Italy 974 848 806 288 256 211
Canada 832 762 680 156 74 68
France 854 696 657 142 131 92
Spain 731 583 542 336 283 232
United Kingdom 627 517 504 1,371 1,446 1,281
All Other Countries 5,027 4,075 3,524 2,488 1,857 1,596
Consolidated $25,914 $22,476 $22,338 $25,671 $24,896 $17,755
(h) Sales by country are based on the country that sold the product.
Note 7 — Litigation and Environmental Matters
Abbott has been identified as a potentially responsible party for investigation and cleanup costs at a number of locations in the United States and Puerto Rico under federal and state remediation laws and is investigating potential contamination at a number of company-owned locations. Abbott has recorded an estimated cleanup cost for each site for which management believes Abbott has a probable loss exposure. No individual site cleanup exposure is expected to exceed $3 million, and the aggregate cleanup exposure is not expected to exceed $15 million.
There are a number of patent disputes with third parties who claim Abbott’s products infringe their patents. In one of those disputes, filed in April 2007, Abbott is unable to estimate a range of possible loss, if any, and no reserve has been recorded. Abbott’s acquisition of Kos Pharmaceuticals Inc. resulted in the assumption of various cases and investigations and Abbott has recorded reserves related to several of those cases and investigations.
There are several civil actions pending brought by individuals or entities that allege generally that Abbott and numerous pharmaceutical companies reported false or misleading pricing information relating to the average wholesale price of certain pharmaceutical products in connection with federal, state and private reimbursement. Civil actions have also been brought against Abbott, and in some cases other members of the pharmaceutical industry, by state attorneys general seeking to recover alleged damages on behalf of state Medicaid pro-grams. In May 2006, Abbott was notified that the U.S. Department of Justice intervened in a civil whistle-blower lawsuit alleging that Abbott inflated prices for Medicaid and Medicare reimbursable drugs. The outcome of these investigations and litigation could include the imposition of fines or penalties. Abbott has recorded reserves for its estimated losses in a few of the cases, however, Abbott is unable to estimate the range or amount of possible loss for the majority of the cases, and no loss reserves have been recorded for them. Many of the products involved in these cases are Hospira products. Hospira, Abbott’s former hospital products business, was spun off to Abbott’s shareholders in 2004. Abbott retained liability for losses that result from these cases and investigations to the extent any such losses both relate to the sale of Hospira’s products prior to the spin-off of Hospira and relate to allegations that were made in such pending and future cases and investigations that were the same as allegations existing at the date of the spin-off.
Within the next year, legal proceedings may occur that may result in a change in the estimated reserves recorded by Abbott. For its legal proceedings and environmental exposures, except as noted in the second and third paragraphs of this footnote, Abbott estimates the range of possible loss to be from approximately $110 million to $325 million. The recorded reserve balance at December 31, 2007 for these proceedings and exposures was approximately $165 million. These reserves represent management’s best estimate of probable loss, as defined by Statement of Financial Accounting Standards No. 5, “Accounting for Contingencies.”
While it is not feasible to predict the outcome of all such proceedings and exposures with certainty, management believes that their ultimate disposition should not have a material adverse effect on Abbott’s financial position, cash flows, or results of operations, except for the cases and investigations discussed in the third paragraph of this foot-note, the resolution of which could be material to cash flows or results of operations for a quarter.
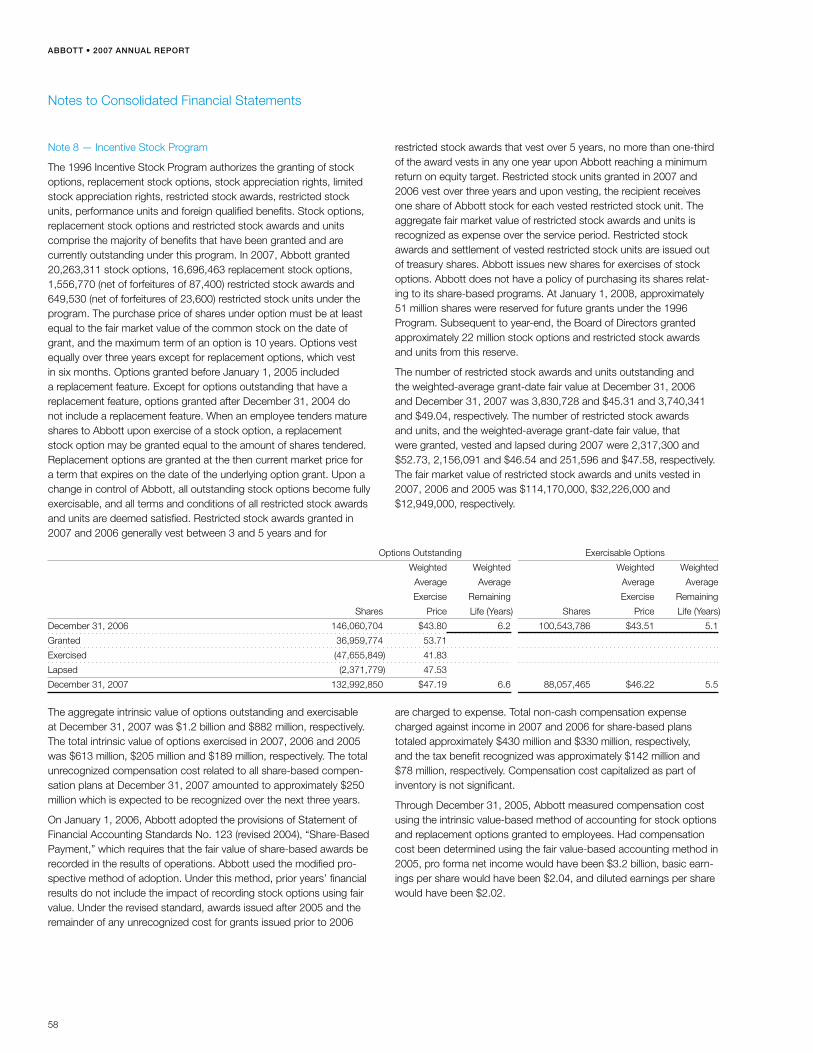
Abbott • 2007 AnnuAl RepoRt
58
Note 8 — Incentive Stock Program
The 1996 Incentive Stock Program authorizes the granting of stock options, replacement stock options, stock appreciation rights, limited stock appreciation rights, restricted stock awards, restricted stock units, performance units and foreign qualified benefits. Stock options, replacement stock options and restricted stock awards and units comprise the majority of benefits that have been granted and are currently outstanding under this program. In 2007, Abbott granted 20,263,311 stock options, 16,696,463 replacement stock options, 1,556,770 (net of forfeitures of 87,400) restricted stock awards and 649,530 (net of forfeitures of 23,600) restricted stock units under the program. The purchase price of shares under option must be at least equal to the fair market value of the common stock on the date of grant, and the maximum term of an option is 10 years. Options vest equally over three years except for replacement options, which vest in six months. Options granted before January 1, 2005 included a replacement feature. Except for options outstanding that have a replacement feature, options granted after December 31, 2004 do not include a replacement feature. When an employee tenders mature shares to Abbott upon exercise of a stock option, a replacement stock option may be granted equal to the amount of shares tendered. Replacement options are granted at the then current market price for a term that expires on the date of the underlying option grant. Upon a change in control of Abbott, all outstanding stock options become fully exercisable, and all terms and conditions of all restricted stock awards and units are deemed satisfied. Restricted stock awards granted in 2007 and 2006 generally vest between 3 and 5 years and for
restricted stock awards that vest over 5 years, no more than one-third of the award vests in any one year upon Abbott reaching a minimum return on equity target. Restricted stock units granted in 2007 and 2006 vest over three years and upon vesting, the recipient receives one share of Abbott stock for each vested restricted stock unit. The aggregate fair market value of restricted stock awards and units is recognized as expense over the service period. Restricted stock awards and settlement of vested restricted stock units are issued out of treasury shares. Abbott issues new shares for exercises of stock options. Abbott does not have a policy of purchasing its shares relat-ing to its share-based programs. At January 1, 2008, approximately 51 million shares were reserved for future grants under the 1996 Program. Subsequent to year-end, the Board of Directors granted approximately 22 million stock options and restricted stock awards and units from this reserve.
The number of restricted stock awards and units outstanding and the weighted-average grant-date fair value at December 31, 2006 and December 31, 2007 was 3,830,728 and $45.31 and 3,740,341 and $49.04, respectively. The number of restricted stock awards and units, and the weighted-average grant-date fair value, that were granted, vested and lapsed during 2007 were 2,317,300 and $52.73, 2,156,091 and $46.54 and 251,596 and $47.58, respectively. The fair market value of restricted stock awards and units vested in 2007, 2006 and 2005 was $114,170,000, $32,226,000 and $12,949,000, respectively.
Notes to Consolidated Financial Statements
The aggregate intrinsic value of options outstanding and exercisable at December 31, 2007 was $1.2 billion and $882 million, respectively. The total intrinsic value of options exercised in 2007, 2006 and 2005 was $613 million, $205 million and $189 million, respectively. The total unrecognized compensation cost related to all share-based compen-sation plans at December 31, 2007 amounted to approximately $250 million which is expected to be recognized over the next three years.
On January 1, 2006, Abbott adopted the provisions of Statement of Financial Accounting Standards No. 123 (revised 2004), “Share-Based Payment,” which requires that the fair value of share-based awards be recorded in the results of operations. Abbott used the modified pro-spective method of adoption. Under this method, prior years’ financial results do not include the impact of recording stock options using fair value. Under the revised standard, awards issued after 2005 and the remainder of any unrecognized cost for grants issued prior to 2006
are charged to expense. Total non-cash compensation expense charged against income in 2007 and 2006 for share-based plans totaled approximately $430 million and $330 million, respectively, and the tax benefit recognized was approximately $142 million and $78 million, respectively. Compensation cost capitalized as part of inventory is not significant.
Through December 31, 2005, Abbott measured compensation cost using the intrinsic value-based method of accounting for stock options and replacement options granted to employees. Had compensation cost been determined using the fair value-based accounting method in 2005, pro forma net income would have been $3.2 billion, basic earn-ings per share would have been $2.04, and diluted earnings per share would have been $2.02.
Options Outstanding Exercisable Options
Weighted Weighted Weighted Weighted
Average Average Average Average
Exercise Remaining Exercise Remaining
Shares Price Life (Years) Shares Price Life (Years)
December 31, 2006 146,060,704 $43.80 6.2 100,543,786 $43.51 5.1
Granted 36,959,774 53.71
Exercised (47,655,849) 41.83
Lapsed (2,371,779) 47.53
December 31, 2007 132,992,850 $47.19 6.6 88,057,465 $46.22 5.5

59
Abbott • 2007 AnnuAl RepoRt
The fair value of an option granted in 2007, 2006 and 2005 was $12.88, $11.72 and $12.17, respectively. The fair value of an option grant was estimated using the Black-Scholes option-pricing model with the following assumptions:
2007 2006 2005
Risk-free interest rate 4.5% 4.6% 3.8%
Average life of options (years) 5.9 6.1 5.4
Volatility 25.0% 28.0% 29.0%
Dividend yield 2.5% 2.7% 2.2%
The risk-free interest rate is based on the rates available at the time of the grant for zero-coupon U.S. government issues with a remaining term equal to the option’s expected life. The average life of an option granted in 2007 and 2006 is based on both historical and projected exercise and lapsing data. Prior to 2006, the average life of an option granted was based on historical experience. Expected volatility for 2007 and 2006 option grants is based on implied volatilities from traded options on Abbott’s stock and historical volatility of Abbott’s stock over the expected life of the option. Expected volatility for options granted prior to 2006 was based on historical volatility over a period prior to the option grant equal to the option’s expected life. Dividend yield is based on the option’s exercise price and annual dividend rate at the time of grant.
Note 9 — Debt and Lines of Credit(dollars in thousands)
The following is a summary of long-term debt at December 31:
2007 2006 2005
0.77% Yen notes, due 2007 $ — $ — $ 83,654
Notes, variable interest above LIBOR — — 770,000
British Pound notes,
variable interest above LIBOR — — 344,000
Euro notes, variable interest
above LIBOR, due 2008 — 264,180 638,766
6.0% Notes, due 2008 — 200,000 200,000
5.4% Notes, due 2008 — 200,000 200,000
1.05% Yen notes, due 2008 — 430,775 418,270
3.5% Notes, due 2009 500,000 500,000 500,000
5.375% Notes, due 2009 500,000 500,000 —
1.51% Yen notes, due 2010 135,257 129,232 125,481
3.75% Notes, due 2011 500,000 500,000 500,000
5.6% Notes, due 2011 1,500,000 1,500,000 —
5.15% Notes, due 2012 1,000,000 — —
1.95% Yen notes, due 2013 225,428 215,387 209,135
4.35% Notes, due 2014 500,000 500,000 500,000
5.875% Notes, due 2016 2,000,000 2,000,000 —
5.6% Notes, due 2017 1,500,000 — —
6.15% Notes, due 2037 1,000,000 — —
Other, including fair value adjustments
relating to interest rate hedge contracts
designated as fair value hedges 127,104 70,090 82,198
Total, net of current maturities 9,487,789 7,009,664 4,571,504
Current maturities of long-term debt 898,554 95,276 1,849,563
Total carrying amount $10,386,343 $7,104,940 $6,421,067
Principal payments required on long-term debt outstanding at December 31, 2007, are $857,454 in 2008, $1,003,619 in 2009, $138,218 in 2010, $2,001,958 in 2011, $1,000,390 in 2012 and $5,281,102 thereafter.
At December 31, 2007, Abbott had $3,000,000 of unused lines of credit, which support commercial paper borrowing arrangements. The unused lines of credit expire in 2012. Related compensating balances, which are subject to withdrawal by Abbott at its option, and commit-ment fees are not material. Abbott’s weighted-average interest rate on short-term borrowings was 3.7% at December 31, 2007, 5.0% at December 31, 2006 and 1.3% at December 31, 2005.
Note 10 — Business Combinations, Technology Acquisitions and Related Transactions
In December 2006, Abbott acquired Kos Pharmaceuticals Inc. for cash of approximately $3.8 billion, net of cash held by Kos Pharmaceuticals Inc., to expand Abbott’s presence in the lipid management market and to provide several on-market and late- stage pipeline products. Kos Pharmaceuticals Inc. was a specialty pharmaceutical company that developed and marketed proprietary medications for the treatment of chronic cardiovascular, metabolic and respiratory diseases. This business was acquired on December 13, 2006 and the financial results of the acquired operations are included in these financial statements beginning on that date. The acquisition was financed primarily with short-term debt. The allocation of the pur-chase price resulted in a charge of $1.3 billion for acquired in-process research and development, intangible assets of $821 million, goodwill (primarily non-deductible) of $1.6 billion and net liabilities, primarily deferred income taxes recorded at acquisition of $331 million. Acquired intangible assets are being amortized over 4 to 15 years. Non-deductible acquired in-process research and development was charged to income in 2006.
A substantial amount of the acquired in-process research and development charge relating to the Kos acquisition related primarily to cholesterol treatment drugs. The research efforts ranged from 70 percent to 80 percent complete at the date of acquisition. The valuation method used to fair value the projects was the Multi-period Excess Earnings Method (Income Approach) and the risk-adjusted discount rate used was 16 percent. In developing assumptions for the valuation model, comparable Abbott products or products marketed by competitors were used to estimate pricing, margins and expense levels. As of December 31, 2007, one drug was approved for marketing in the U.S. and the remaining research efforts were primarily on schedule. The estimated projected costs to com-plete the projects totaled approximately $75 million as of December 31, 2007 with anticipated product launches from 2008 through 2010. There have been no significant changes in the development plans for the acquired incomplete projects. Significant net cash inflows will commence with the launches of the products.
In order to expand Abbott’s presence in the growing vascular market, Abbott acquired Guidant’s vascular intervention and endovascular solutions businesses on April 21, 2006 for approximately $4.1 billion, in cash, in connection with Boston Scientific’s acquisition of Guidant.
Notes to Consolidated Financial Statements

Abbott • 2007 AnnuAl RepoRt
60
In addition, Abbott will also pay to Boston Scientific $250 million each upon government approvals to market the Xience V drug-eluting stent in the U.S. and in Japan. Government approvals are anticipated in 2008 for the U.S. and in 2009 for Japan. Each $250 million payment will result in the recording of additional goodwill. The allocation of the purchase price resulted in a charge of $665 million for acquired in-pro-cess research and development, intangible assets of $1.2 billion, goodwill (primarily deductible) of $1.7 billion and tangible net assets of $580 million. Acquired intangible assets are being amortized over 4 to 15 years. Deductible acquired in-process research and development was charged to income in 2006. The net tangible assets acquired consist primarily of property and equipment of approximately $530 mil-lion, trade accounts receivable of approximately $250 million and inventories of approximately $120 million, net of assumed liabilities, primarily trade accounts payable, litigation reserves and other liabilities.
A substantial amount of the acquired in-process research and devel-opment charge relating to the Guidant acquisition related to drug eluting and bioabsorbable stents. The research efforts ranged from 35 percent to 85 percent complete at the date of acquisition. The valuation method used to fair value the projects was the Multi-period Excess Earnings Method (Income Approach) and the risk-adjusted discount rates used ranged from 16 percent to 25 percent. In develop-ing assumptions for the valuation model, comparable Abbott products or products marketed by competitors were used to estimate pricing, margins and expense levels. As of December 31, 2007, the research efforts were primarily on schedule. The estimated projected costs to complete totaled approximately $390 million as of December 31, 2007, with anticipated product launch dates from 2008 through 2013. There have been no significant changes in the development plans for the acquired incomplete projects. Significant net cash inflows will com-mence within one to two years after product launch.
In order to facilitate Boston Scientific’s acquisition of Guidant, Abbott also acquired 64.6 million shares of Boston Scientific common stock directly from Boston Scientific and loaned $900 million to a wholly-owned subsidiary of Boston Scientific. The common stock was valued at $1.3 billion and the note receivable was valued at $829 million at the acquisition date. In connection with the acquisition of the shares, Boston Scientific is entitled to certain after-tax gains upon Abbott’s sale of the shares. In addition, Boston Scientific agreed to reimburse Abbott for certain borrowing costs on debt incurred to acquire the Boston Scientific shares. Abbott recorded a net derivative financial instruments liability of $59 million for the gain-sharing derivative finan-cial instrument liability and the interest derivative financial instrument asset. The effect of recording the shares, the loan to Boston Scientific and the derivative financial instruments at fair value on the date of acquisition resulted in the recording of additional goodwill of approxi-mately $204 million. Changes in the fair value of the derivative financial instruments, net are recorded in Other (income) expense, net.
In 2005, Abbott acquired the remaining interest in a small medical products company and a less than 50 percent equity interest in a small medical products company for $25 million. In 2005, Abbott also acquired additional rights related to HUMIRA for approximately $270 million, which are being amortized over 13 years.
Had the above acquisitions taken place on January 1 of the previous year, consolidated net sales and income would not have been signifi-cantly different from reported amounts.
Note 11 — Goodwill and Intangible Assets(dollars in millions)
Abbott recorded goodwill of $53, $3,721 and $69 in 2007, 2006 and 2005, respectively, related to acquisitions. Goodwill adjustments recorded in 2007 allocated to the Pharmaceutical Products segment amounted to $194 and goodwill allocated to the Vascular Products segment amounted to $(141). Acquired goodwill allocated to the Pharmaceutical Products segment amounted to $1,590 in 2006 and goodwill allocated to the Vascular Products segment amounted to $1,688 in 2006. Foreign currency translation and other adjustments increased (decreased) goodwill in 2007, 2006 and 2005 by $627, $509 and $(535), respectively. The amount of goodwill related to reportable segments at December 31, 2007 was $6,221 for the Pharmaceutical Products segment, $210 for the Nutritional Products segment, $261 for the Diagnostic Products segment, and $2,086 for the Vascular Products segment. There were no reductions of goodwill relating to impairments or disposal of all or a portion of a business.
The gross amount of amortizable intangible assets, primarily product rights and technology, was $9,043, $8,988 and $6,776 as of December 31, 2007, 2006 and 2005, respectively, and accumulated amortization was $3,323, $2,602 and $2,053 as of December 31, 2007, 2006 and 2005, respectively. The estimated annual amortization expense for intangible assets is $710 in 2008, 2009 and 2010; $690 in 2011 and $680 in 2012. Intangible assets are amortized over 4 to 25 years (average 11 years).
Note 12 — Equity Method Investments(dollars in millions)
Abbott’s 50 percent-owned joint venture, TAP Pharmaceutical Products Inc. (TAP), is accounted for under the equity method of accounting. The investment in TAP was $159, $162 and $167 at December 31, 2007, 2006 and 2005, respectively, and dividends received from TAP were $502, $487 and $343 in 2007, 2006 and 2005, respectively. Abbott performs certain administrative and manu-facturing services for TAP at negotiated rates that approximate fair value. Summarized financial information for TAP is as follows:
Year Ended December 31 2007 2006 2005
Net sales $3,002 $3,363 $3,260
Cost of sales 720 836 883
Income before taxes 1,564 1,524 1,379
Net income 996 952 883
December 31 2007 2006 2005
Current assets $1,101 $1,181 $1,339
Total assets 1,354 1,333 1,470
Current liabilities 914 955 1,082
Total liabilities 1,037 1,009 1,136
Undistributed earnings of investments accounted for under the equity method amounted to approximately $136 as of December 31, 2007.
Notes to Consolidated Financial Statements

61
Abbott • 2007 AnnuAl RepoRt
Note 13 — Restructuring Plans(dollars in millions)
In 2007, 2006 and 2005, Abbott management approved plans to realign its worldwide pharmaceutical and vascular manufacturing operations and selected domestic and international commercial and research and development operations in order to reduce costs. In 2007, 2006 and 2005, Abbott recorded pretax charges against earn-ings of approximately $107, $210 and $256, respectively, reflecting the impairment of manufacturing facilities and other assets, employee severance and other related charges. Approximately $94, $181 and $174, respectively, is classified as cost of products sold, $3, $29 and $10, respectively, as research and development and $10 in 2007 and $72 in 2005 as selling, general and administrative. Fair value for the determination of the amount of asset impairments was determined primarily based on a discounted cash flow method. An additional $90, $70 and $14 were subsequently recorded in 2007, 2006 and 2005, respectively, relating to these restructurings, primarily for accelerated depreciation. In addition, Abbott implemented facilities restructuring plans in 2007 related to the acquired operations of Kos Pharmaceuticals Inc., which resulted in an increase to goodwill of approximately $52.
The following summarizes the activity for restructurings:
Employee-
Related Asset
and Other Impairments Total
2005 restructuring charges $ 192 $ 64 $ 256
Payments, impairments
and other adjustments (37) (64) (101)
Accrued balance at December 31, 2005 155 — 155
2006 restructuring charges 118 93 211
Payments, impairments
and other adjustments (80) (93) (173)
Accrued balance at December 31, 2006 193 — 193
2007 restructuring charges 122 38 160
Payments, impairments
and other adjustments (121) (38) (159)
Accrued balance at December 31, 2007 $ 194 $ — $ 194
Abbott expects to incur up to an additional $73 in future periods for restructuring plans, primarily for accelerated depreciation.
Note 14 — Quarterly Results (Unaudited)(dollars in millions except per share data)
2007 2006 2005
First Quarter
Net Sales $5,945.5 $5,183.5 $5,382.7
Gross Profit 3,353.5 3,013.8 2,860.1
Net Earnings 697.6 865.0 837.9
Basic Earnings Per Common Share (a) .45 .57 .54
Diluted Earnings Per Common Share (b) .45 .56 .53
Market Price Per Share-High 57.26 45.58 48.16
Market Price Per Share-Low 48.75 39.18 43.34
Second Quarter
Net Sales $6,370.6 $5,501.1 $5,523.8
Gross Profit 3,566.3 3,112.5 2,892.0
Net Earnings (c) 988.7 612.2 877.1
Basic Earnings Per Common Share (a) (c) .64 .40 .56
Diluted Earnings Per Common Share (b) (c) .63 .40 .56
Market Price Per Share-High 59.50 43.61 49.98
Market Price Per Share-Low 52.80 40.55 45.98
Third Quarter
Net Sales $6,376.7 $5,573.8 $5,384.0
Gross Profit 3,512.7 3,182.5 2,706.8
Net Earnings (d) 717.0 715.8 680.7
Basic Earnings Per Common Share (a) (d) .46 .47 .44
Diluted Earnings Per Common Share (b) (d) .46 .46 .44
Market Price Per Share-High 56.91 49.87 50.00
Market Price Per Share-Low 49.58 43.25 41.57
Fourth Quarter
Net Sales $7,221.4 $6,218.0 $6,047.3
Gross Profit 4,059.7 3,352.4 3,237.8
Net Earnings (Loss) (e) 1,203.0 (476.2) 976.4
Basic Earnings (Loss)
Per Common Share (a) (e) .78 (.31) .63
Diluted Earnings (Loss)
Per Common Share (b) (e) .77 (.31) .63
Market Price Per Share-High 59.48 49.10 44.36
Market Price Per Share-Low 50.51 45.41 37.50
(a) The sum of the quarters’ basic earnings per share for 2007 and 2006 do not add
to the full year earnings per share amounts due to rounding.
(b) The sum of the quarters’ diluted earnings per share for 2006 does not add to the
full year earnings per share amount due to rounding.
(c) Second quarter 2006 includes a pretax charge of $493 for acquired in-process
and collaborations research and development.
(d) Third quarter 2006 includes a pretax charge of $214 for acquired in-process research
and development and 2005 includes pretax restructuring charges of $201.
(e) Fourth quarter 2006 includes a pretax charge of $1,307 for acquired in-process
and collaborations research and development.
Notes to Consolidated Financial Statements

Abbott • 2007 AnnuAl RepoRt
62
The management of Abbott Laboratories is responsible for establishing and maintaining adequate internal control over financial reporting. Abbott’s internal control system was designed to provide reasonable assurance to the company’s management and board of directors regarding the preparation and fair presentation of published financial statements.
All internal control systems, no matter how well designed, have inherent limitations. Therefore, even those systems determined to be effective can provide only reasonable assurance with respect to financial statement preparation and presentation.
Abbott’s management assessed the effectiveness of the company’s internal control over financial reporting as of December 31, 2007. In making this assessment, it used the criteria set forth in Internal Control-Integrated Framework issued by the Committee of Sponsoring Organizations of the Treadway Commission. Based on our assess-ment, we believe that, as of December 31, 2007, the company’s internal control over financial reporting was effective based on those criteria.
Abbott’s independent registered public accounting firm has issued an audit report on their assessment of the effectiveness of the company’s internal control over financial reporting. This report appears on page 63.
Miles D. WhiteChairman of the Board and Chief Executive Officer
Thomas C. FreymanExecutive Vice President, Finance and Chief Financial Officer
Greg W. LinderVice President and Controller
February 14, 2008
Management Report on Internal Control Over Financial Reporting

63
Abbott • 2007 AnnuAl RepoRt
To the Board of Directors and Shareholders of Abbott Laboratories:
We have audited the accompanying consolidated balance sheets of Abbott Laboratories and subsidiaries (the “Company”) as of December 31, 2007, 2006, and 2005, and the related consolidated statements of earnings, shareholders’ investment, and cash flows for the years then ended. These financial statements are the responsibility of the Company’s management. Our responsibility is to express an opinion on these financial statements based on our audits.
We conducted our audits in accordance with the standards of the Public Company Accounting Oversight Board (United States). Those standards require that we plan and perform the audit to obtain reason-able assurance about whether the financial statements are free of material misstatement. An audit includes examining, on a test basis, evidence supporting the amounts and disclosures in the financial statements. An audit also includes assessing the accounting principles used and significant estimates made by management, as well as evaluating the overall financial statement presentation. We believe that our audits provide a reasonable basis for our opinion.
In our opinion, such consolidated financial statements present fairly, in all material respects, the financial position of the Company as of December 31, 2007, 2006, and 2005 and the results of its operations and its cash flows for the years then ended in conformity with account-ing principles generally accepted in the United States of America.
As discussed in Notes 1, 2, 4, and 8 to the consolidated financial statements, the Company changed its method of accounting for fair value measurements to adopt Statement of Financial Accounting Standards (“SFAS”) No. 157, Fair Value Measurements, and adopted the fair value option under SFAS No. 159, The Fair Value Option for Financial Assets and Financial Liabilities, for certain investments in 2007, and the Company changed its method of accounting for pen-sion and other post employment benefits and share-based payments to adopt SFAS No. 158, Employers’ Accounting for Defined Benefit Pension and Other Postretirement Plans, and SFAS No. 123(R), Share-Based Payment, in 2006.
We have also audited, in accordance with the standards of the Public Company Accounting Oversight Board (United States), the Company’s internal control over financial reporting as of December 31, 2007, based on the criteria established in Internal Control-Integrated Framework issued by the Committee of Sponsoring Organizations of the Treadway Commission and our report dated February 14, 2008 expressed an unqualified opinion on the Company’s internal control over financial reporting.
Deloitte & Touche LLPChicago, IllinoisFebruary 14, 2008
To the Board of Directors and Shareholders of Abbott Laboratories:
We have audited the internal control over financial reporting of Abbott Laboratories and subsidiaries (the “Company”) as of December 31, 2007, based on criteria established in Internal Control-Integrated Framework issued by the Committee of Sponsoring Organizations of the Treadway Commission. The Company’s management is responsi-ble for maintaining effective internal control over financial reporting and for its assessment of the effectiveness of internal control over financial reporting, included in the accompanying Management Report on Internal Control Over Financial Reporting. Our responsibility is to
express an opinion on the Company’s internal control over financial reporting based on our audit.
We conducted our audit in accordance with the standards of the Public Company Accounting Oversight Board (United States). Those standards require that we plan and perform the audit to obtain reason-able assurance about whether effective internal control over financial reporting was maintained in all material respects. Our audit included obtaining an understanding of internal control over financial reporting, assessing the risk that a material weakness exists, testing and evaluat-ing the design and operating effectiveness of internal control based on the assessed risk, and performing such other procedures as we considered necessary in the circumstances. We believe that our audit provides a reasonable basis for our opinion.
A company’s internal control over financial reporting is a process designed by, or under the supervision of, the company’s principal executive and principal financial officers, or persons performing similar functions, and effected by the company’s board of directors, manage-ment, and other personnel to provide reasonable assurance regarding the reliability of financial reporting and the preparation of financial state-ments for external purposes in accordance with generally accepted accounting principles. A company’s internal control over financial reporting includes those policies and procedures that (1) pertain to the maintenance of records that, in reasonable detail, accurately and fairly reflect the transactions and dispositions of the assets of the company; (2) provide reasonable assurance that transactions are recorded as necessary to permit preparation of financial statements in accordance with generally accepted accounting principles, and that receipts and expenditures of the company are being made only in accordance with authorizations of management and directors of the company; and (3) provide reasonable assurance regarding prevention or timely detec-tion of unauthorized acquisition, use, or disposition of the company’s assets that could have a material effect on the financial statements.
Because of the inherent limitations of internal control over financial reporting, including the possibility of collusion or improper manage-ment override of controls, material misstatements due to error or fraud may not be prevented or detected on a timely basis. Also, projections of any evaluation of the effectiveness of the internal control over finan-cial reporting to future periods are subject to the risk that the controls may become inadequate because of changes in conditions, or that the degree of compliance with the policies or procedures may deteriorate.
In our opinion, the Company maintained, in all material respects, effec-tive internal control over financial reporting as of December 31, 2007, based on the criteria established in Internal Control-Integrated Framework issued by the Committee of Sponsoring Organizations of the Treadway Commission.
We have also audited, in accordance with the standards of the Public Company Accounting Oversight Board (United States), the consoli-dated financial statements of the Company as of and for the year ended December 31, 2007 and our report dated February 14, 2008 expressed an unqualified opinion on those financial statements and included an explanatory paragraph regarding the Company’s adoption of new accounting standards.
Deloitte & Touche LLPChicago, IllinoisFebruary 14, 2008
Reports of Independent Registered Public Accounting Firm

Abbott • 2007 AnnuAl RepoRt
64
Investment in Boston Scientific Common Stock and Note Receivable
At December 31, 2007, Abbott held 26.4 million shares, or approxi-mately $300 million of Boston Scientific common stock. Subsequent to year end, all of these shares were sold resulting in a small gain. At December 31, 2006, Abbott held 64.6 million shares, or approximately $1 billion of Boston Scientific common stock. Abbott also has a $900 million loan, due in April 2011, to a wholly-owned subsidiary of Boston Scientific as of December 31, 2007 and 2006, and, as such, is subject to credit risk.
Other Market Price Sensitive Investments
Abbott holds available-for-sale equity securities from strategic technol-ogy acquisitions. Excluding Boston Scientific, the market value of these investments was approximately $193 million and $97 million, respectively, as of December 31, 2007 and 2006. Abbott monitors these investments for other than temporary declines in market value, and charges impairment losses to income when an other than tempo-rary decline in value occurs. A hypothetical 20 percent decrease in the share prices of these investments would decrease their fair value at December 31, 2007 by approximately $39 million. (A 20 percent decrease is believed to be a reasonably possible near-term change in share prices.)
Non-Publicly Traded Equity Securities
Abbott holds equity securities from strategic technology acquisitions that are not traded on public stock exchanges. The carrying value of these investments was approximately $37 million and $33 million as of December 31, 2007 and 2006, respectively. No individual investment is in excess of $13 million. Abbott monitors these investments for other than temporary declines in market value, and charges impair-ment losses to income when an other than temporary decline in estimated value occurs.
Interest Rate Sensitive Financial Instruments
At December 31, 2007 and 2006, Abbott had interest rate hedge contracts totaling $1.5 billion to manage its exposure to changes in the fair value of debt due in 2009 through 2014. The effect of these hedges is to change the fixed interest rate to a variable rate. Abbott does not use derivative financial instruments, such as interest rate swaps, to manage its exposure to changes in interest rates for its investment securities. The fair value of long-term debt at
December 31, 2007 and 2006 amounted to $10.6 billion and $7.1 billion, respectively (average interest rates of 5.0% and 4.7%, respectively) with maturities through 2037. At December 31, 2007 and 2006, the fair market value of current and long-term investment securities amounted to $896 million and $941 million, respectively. A hypothetical 100-basis point change in the interest rates would not have a material effect on cash flows, income or market values. (A 100-basis point change is believed to be a reasonably possible near-term change in rates.)
Foreign Currency Sensitive Financial Instruments
Abbott enters into foreign currency forward exchange contracts to manage its exposure to foreign currency denominated intercompany loans and trade payables and third-party trade payables and receiv-ables. The contracts are marked-to-market, and resulting gains or losses are reflected in income and are generally offset by losses or gains on the foreign currency exposure being managed. At December 31, 2007 and 2006, Abbott held $5.5 billion and $5.6 billion, respec-tively, of such contracts, which mature in the next twelve months.
In addition, certain Abbott foreign subsidiaries enter into foreign currency forward exchange contracts to manage exposures to changes in foreign exchange rates for anticipated intercompany pur-chases by those subsidiaries whose functional currencies are not the U.S. dollar. These contracts are designated as cash flow hedges of the variability of the cash flows due to changes in foreign exchange rates and are marked-to-market with the resulting gains or losses reflected in Accumulated other comprehensive income (loss). Gains or losses will be included in Cost of products sold at the time the products are sold, generally within the next twelve months. At December 31, 2007 and 2006, Abbott held $281 million and $768 million, respectively, of such contracts, which all mature in the following calendar year.
Abbott has designated approximately $1.7 billion of foreign denomi-nated short-term debt as a hedge of the net investment in certain foreign subsidiaries. Accordingly, changes in the fair value of this debt due to changes in exchange rates are recorded in Accumulated other comprehensive income (loss).
The following table reflects the total foreign currency forward contracts outstanding at December 31, 2007 and 2006:
Financial Instruments and Risk Management
2007 2006
Fair and Fair and
Carrying Carrying
Average Value Average Value
Contract Exchange Receivable/ Contract Exchange Receivable/
(dollars in millions) Amount Rate (Payable) Amount Rate (Payable)
Receive primarily U.S. Dollars
in exchange for the following currencies:
Euro $2,630 1.464 $(11) $2,644 1.301 $(38)
British Pound 1,030 2.041 — 1,910 1.928 (14)
Japanese Yen 939 113.9 (5) 898 115.5 (3)
Canadian Dollar 426 0.995 (1) 332 1.115 6
All other currencies 716 N/A (4) 603 N/A (3)
Total $5,741 $(21) $6,387 $(52)

65
Abbott • 2007 AnnuAl RepoRt
Abbott’s revenues are derived primarily from the sale of a broad line of health care products under short-term receivable arrangements. Patent protection and licenses, technological and performance features, and inclusion of Abbott’s products under a contract or by a pharmacy benefit manager most impact which products are sold; price controls, competition and rebates most impact the net selling prices of products; and foreign currency translation impacts the measurement of net sales and costs. Abbott’s primary products are prescription pharmaceuticals, nutritional products, diagnostic testing products and vascular products. Abbott also owns 50 percent of TAP Pharmaceutical Products Inc. that Abbott accounts for on the equity method.
The worldwide launch of additional indications of HUMIRA, the acqui-sitions of Guidant’s vascular intervention and endovascular solutions businesses and Kos Pharmaceuticals Inc., the amendments ending the Boehringer Ingelheim agreement and the Synagis co-promotion agreement, the loss of patent protection for some pharmaceutical products, and realized gains and unrealized losses on the Boston Scientific common stock have impacted Abbott’s sales, costs and financial position over the last three years.
Pharmaceutical research and development is focused on therapeutic areas that include immunology, oncology, neuroscience, pain manage-ment, and infectious diseases. In 2003, Abbott began the worldwide launch of HUMIRA for rheumatoid arthritis, followed by launches for three additional indications, which increased HUMIRA’s worldwide sales to $3.0 billion in 2007 compared to $2.0 billion in 2006, and $1.4 billion in 2005. Including the launch of a fifth indication in 2008, Abbott forecasts worldwide HUMIRA sales of approximately $4 billion in 2008. Substantial research and development and selling support has been and continues to be dedicated to maximizing the worldwide potential of HUMIRA. In December 2006, Abbott acquired Kos Pharmaceuticals Inc. which complements Abbott’s existing franchise in the dyslipidemia market and strengthened the pharmaceutical pipeline for cholesterol management. In 2005, Abbott and Boehringer Ingelheim (BI) amended their agreement whereby Abbott distributed and promoted BI products. Effective January 1, 2006, Abbott no longer distributed or recorded sales for distribution activities for the BI products. Abbott’s gross margins for BI products from the prior agreement in effect through December 31, 2005 were substantially lower than its average gross margins. Sales of BI products were $150 million and $2.3 billion in 2006 and 2005, respectively. In addi-tion, increased generic competition resulted in U.S. sales of Omnicef declining from $637 million in 2006 to $235 million in 2007, and worldwide sales of clarithromycin declining from $1.1 billion in 2005 to $724 million in 2007.
On December 31, 2006, the U.S. co-promotion agreement for Synagis terminated. Revenues for co-promotion of Synagis were $373 million in 2006. Abbott’s nutritional products businesses have been reorganized into a worldwide business to better leverage the opportunities available for strong nutritional brands. Significant efforts have been focused on capturing those opportunities, particularly in developing markets where growth has been strong.
In April 2006, Abbott acquired Guidant’s vascular intervention and endovascular solutions businesses and began to integrate it with Abbott’s vascular business. The acquisition significantly improved
Abbott’s competitive position in this business that is characterized by rapid innovation. In 2006, Abbott received European Union approval to market the Xience V drug eluting stent, and Abbott is awaiting approval in the U.S.
Abbott’s diagnostic segment comprises three separate divisions-immunochemistry/hematology, point of care, and molecular. Subsequent to the termination of the agreement to sell the immuno-chemistry/hematology and point of care businesses to GE, Abbott has re-focused on managing and growing these businesses.
Abbott acquired 64.6 million shares of Boston Scientific in connection with Abbott’s acquisition of the vascular intervention and endovascular solutions businesses of Guidant. In 2007, the net loss charged to expense for the investment was $153 million. At December 31, 2007, Abbott held 26.4 million shares of Boston Scientific common stock. Subsequent to year end, all of these shares were sold resulting in a small gain. Abbott’s short- and long-term debt totaled $12.2 billion at December 31, 2007, largely incurred to finance recent acquisitions. Operating cash flows in excess of capital expenditures and cash dividends have partially funded acquisitions over the last three years. At December 31, 2007, Abbott’s long-term debt rating was AA by Standard and Poor’s Corporation and A1 by Moody’s Investors Service.
In 2008, Abbott will focus on several key initiatives. In the pharmaceu-tical business, Abbott will continue the launch of newly approved indications for HUMIRA and continue to leverage the product and pipeline opportunities of its lipid franchise, including the Kos Pharmaceuticals Inc. business. Pharmaceutical research and develop-ment efforts will continue to focus on the therapeutic areas noted above with a significant portion of the development expenditures allo-cated to new HUMIRA indications, as well as Simcor and ABT-335, cholesterol drugs, ABT-335/Crestor fixed dose combination, ABT-874, a biologic for psoriasis and Crohn’s disease, and controlled release Vicodin CR, as well as several Phase I and Phase II clinical programs in neuroscience and oncology. In the vascular business, Abbott will con-tinue the launch of the Xience V drug-eluting stent internationally, and will launch in the U.S. upon approval by the FDA. For diabetes care, Abbott anticipates launching the FreeStyle Freedom Lite monitor in the U.S. as well as the FreeStyle Navigator. In the other business seg-ments, Abbott will focus on developing or acquiring differentiated technologies in higher growth segments of those markets.
Critical Accounting Policies
Sales Rebates — Approximately 48 percent of Abbott’s consolidated gross revenues are subject to various forms of rebates and allowances that Abbott records as reductions of revenues at the time of sale. Most of these rebates and allowances are in the Pharmaceutical Products segment and the Nutritional Products segment. Abbott provides rebates to pharmacy benefit management companies, to state agen-cies that administer the federal Medicaid and Medicare programs and the Special Supplemental Food Program for Women, Infants, and Children (WIC), wholesalers, group purchasing organizations, and other government agencies and private entities. Rebate amounts are usually based upon the volume of purchases using contractual or statutory prices for a product. Factors used in the rebate calculations include the identification of which products have been sold subject to a rebate, which customer or government agency price terms apply,
Financial Review

Abbott • 2007 AnnuAl RepoRt
66
and the estimated lag time between sale and payment of a rebate. Using historical trends, adjusted for current changes, Abbott estimates the amount of the rebate that will be paid, and records the liability as a reduction of gross sales when Abbott records its sale of the product. Settlement of the rebate generally occurs from two to 24 months after sale. Abbott regularly analyzes the historical rebate trends and makes adjustments to reserves for changes in trends and terms of rebate programs. Rebates and chargebacks charged against gross sales in 2007, 2006 and 2005 amounted to approximately $3.2 billion, $2.6 billion and $2.5 billion, respectively, or 21.5 percent, 23.2 per-cent, and 22.9 percent, respectively, based on gross sales of approximately $15.0 billion, $11.0 billion and $10.9 billion, respectively, subject to rebate. A one-percentage point increase in the percentage of rebates to related gross sales would decrease net sales and operating earnings by approximately $150 million in 2007. Abbott considers a one-percentage point increase to be a reasonably likely increase in the percentage of rebates to related gross sales. Other allowances charged against gross sales were approximately $325 mil-lion, $247 million and $284 million for cash discounts in 2007, 2006 and 2005, respectively, and $269 million, $209 million and $162 million for returns in 2007, 2006 and 2005, respectively. Cash discounts are known within 15 to 30 days of sale, and therefore can be reliably esti-mated. Returns can be reliably estimated because Abbott’s historical returns are low, and because sales returns terms and other sales terms have remained relatively unchanged for several periods.
Management analyzes the adequacy of ending rebate accrual bal-ances each quarter. In the domestic nutritional business, management uses both internal and external data available to estimate the level of inventory in the distribution channel. Management has access to sev-eral large customers’ inventory management systems, and for other customers, utilizes data from a third party that continuously measures time on the retail shelf. These sources allow management to make reliable estimates of inventory in the distribution channel. Except for a transition period before or after a change in the supplier for the WIC business in a state, inventory in the distribution channel does not vary substantially. Management also estimates the states’ processing lag time based on claims data. In addition, internal processing time is a factor in estimating the accrual. In the WIC business, the state where the sale is made, which is the determining factor for the applicable price, is reliably determinable. Estimates are required for the amount of WIC sales within each state where Abbott has the WIC business. External data sources utilized for that estimate are participant data from the U.S. Department of Agriculture (USDA), which administers the WIC program, participant data from some of the states, and internally administered market surveys. The USDA has been making its data available for many years. Internal data includes historical redemption rates and pricing data. At December 31, 2007, Abbott had the exclu-sive WIC business in 27 states.
In the domestic pharmaceutical business, the most significant charges against gross sales are for Medicaid and Medicare Rebates, Pharmacy Benefit Manager Rebates and Wholesaler Chargebacks. In order to evaluate the adequacy of the ending accrual balances, management uses both internal and external estimates of the level of inventory in the distribution channel and the rebate claims processing lag time. External data sources used to estimate the inventory in the distribution
channel include inventory levels periodically reported by wholesalers and third party market data purchased by Abbott. Management esti-mates the processing lag time based on periodic sampling of claims data. To estimate the price rebate percentage, systems and calcula-tions are used to track sales by product by customer and to estimate the contractual or statutory price. Abbott’s systems and calculations have developed over time as rebates have become more significant, and Abbott believes they are reliable.
The following table is an analysis of the four largest rebate accruals, which comprise approximately 74 percent of the consolidated rebate provisions charged against revenues in 2007. Remaining rebate provisions charged against gross sales are not significant in the deter-mination of operating earnings. (dollars in thousands)
Domestic Pharmaceutical Products
Domestic Medicaid Pharmacy
Nutritionals and Benefit Wholesaler
WIC Medicare Manager Charge-
Rebates Rebates Rebates backs
Balance at
January 1, 2005 $ 98,047 $ 373,058 $ 153,798 $ 44,053
Provisions 641,189 663,043 253,499 450,901
Payments (644,460) (581,098) (273,166) (446,867)
Balance at
December 31, 2005 94,776 455,003 134,131 48,087
Provisions 636,849 527,860 281,221 532,847
Payments (595,477) (533,632) (246,456) (513,905)
Business combination — 36,191 50,675 20,189
Balance at
December 31, 2006 136,148 485,422 219,571 87,218
Provisions 753,535 438,198 411,798 786,183
Payments (690,438) (503,580) (394,692) (781,547)
Balance at
December 31, 2007 $ 199,245 $ 420,040 $ 236,677 $ 91,854
Historically, adjustments to prior years’ rebate accruals have not been material to net income. In 2007, adjustments were made to prior years’ rebate accruals. The Medicaid and Medicare rebate accrual was reduced by approximately $69 million and the WIC rebate accrual was increased by approximately $19 million. Abbott employs various techniques to verify the accuracy of claims submitted to it, and where possible, works with the organizations submitting claims to gain insight into changes that might affect the rebate amounts. For Medicaid, Medicare and other government agency programs, the calculation of a rebate involves interpretations of relevant regulations, which are subject to challenge or change in interpretation.
Income Taxes — Abbott operates in numerous countries where its income tax returns are subject to audits and adjustments. Because Abbott operates globally, the nature of the audit items are often very complex, and the objectives of the government auditors can result in a tax on the same income in more than one country. Abbott employs internal and external tax professionals to minimize audit adjustment amounts where possible. On January 1, 2007, Abbott adopted the provisions of FASB Interpretation No. 48 “Accounting for Uncertainty in Income Taxes,” which changed the measurement of tax contingencies. Under this Interpretation, in order to recognize an uncertain tax benefit,
Financial Review

67
Abbott • 2007 AnnuAl RepoRt
the taxpayer must be more likely than not of sustaining the position, and the measurement of the benefit is calculated as the largest amount that is more than 50 percent likely to be realized upon resolu-tion of the benefit. Application of this Interpretation requires a significant amount of judgment. In the U.S., Abbott’s federal income tax returns through 2003 are settled, and the income tax returns for years after 2003 are open. Abbott does not record deferred income taxes on earnings reinvested indefinitely in foreign subsidiaries.
Pension and Post-Employment Benefits — Abbott offers pension benefits and post-employment health care to many of its employees. Abbott engages outside actuaries to calculate its obligations and costs under these programs. Abbott must develop long-term assumptions, the most significant of which are the health care cost trend rates, dis-count rate and the expected return on plan assets. The discount rates used to measure liabilities were determined based on high-quality fixed income securities that match the duration of the expected retiree ben-efits. The health care cost trend rates represent Abbott’s expected annual rates of change in the cost of health care benefits and is a for-ward projection of health care costs as of the measurement date. A difference between the assumed rates and the actual rates, which will not be known for decades, can be significant in relation to the obliga-tions and the annual cost recorded for these programs. Recent low interest rates have significantly increased actuarial losses for these plans. At December 31, 2007, pretax net actuarial losses and prior service costs and (credits) recognized in Accumulated other compre-hensive income (loss) for Abbott’s defined benefit plans and medical and dental plans were $960 million and $408 million, respectively. Actuarial losses and gains are amortized over the remaining service attribution periods of the employees under the corridor method, in accordance with the rules for accounting for post-employment bene-fits. Differences between the expected long-term return on plan assets and the actual annual return are amortized over a five-year period. Footnote 4 to the consolidated financial statements describes the impact of a one-percentage point change in the health care cost trend rate; however, there can be no certainty that a change would be lim-ited to only one percentage point. On December 31, 2006, Abbott adopted the provisions of SFAS No. 158 “Employers’ Accounting for Defined Benefit Pension and Other Postretirement Plans.” The provi-sions of this statement require the recognition of the deferrals on the balance sheet with a corresponding charge to Accumulated other comprehensive income (loss). Adoption of this statement on December 31, 2006 resulted in a decrease in Abbott’s shareholders’ equity of approximately $1.3 billion.
Valuation of Intangible Assets — Abbott has acquired and continues to acquire significant intangible assets that Abbott records at fair value. Those assets which do not yet have regulatory approval and for which there are no alternative uses are expensed as acquired in-process research and development, and those that have regulatory approval are capitalized. Transactions involving the purchase or sale of intangi-ble assets occur with some frequency between companies in the health care field and valuations are usually based on a discounted cash flow analysis. The discounted cash flow model requires assump-tions about the timing and amount of future net cash inflows, risk, the cost of capital, terminal values and market participants. Each of these factors can significantly affect the value of the intangible asset.
Abbott engages independent valuation experts who review Abbott’s critical assumptions and calculations for significant acquisitions of intangibles. Abbott reviews intangible assets for impairment each quarter using an undiscounted net cash flows approach. If the undis-counted cash flows of an intangible asset are less than the carrying value of an intangible asset, the intangible asset is written down to its fair value, which is usually the discounted cash flow amount. Where cash flows cannot be identified for an individual asset, the review is applied at the lowest group level for which cash flows are identifiable. Goodwill is reviewed for impairment annually or when an event that could result in an impairment of goodwill occurs. At December 31, 2007, goodwill and intangibles amounted to $10.1 billion and $5.7 billion, respectively, and amortization expense for intangible assets amounted to $782 million in 2007. There were no impairments of goodwill in 2007, 2006 or 2005.
Litigation — Abbott accounts for litigation losses in accordance with SFAS No. 5, “Accounting for Contingencies.” Under SFAS No. 5, loss contingency provisions are recorded for probable losses at manage-ment’s best estimate of a loss, or when a best estimate cannot be made, a minimum loss contingency amount is recorded. These esti-mates are often initially developed substantially earlier than the ultimate loss is known, and the estimates are refined each accounting period as additional information becomes known. Accordingly, Abbott is often initially unable to develop a best estimate of loss, and therefore the minimum amount, which could be zero, is recorded. As information becomes known, either the minimum loss amount is increased, resulting in additional loss provisions, or a best estimate can be made, also resulting in additional loss provisions. Occasionally, a best esti-mate amount is changed to a lower amount when events result in an expectation of a more favorable outcome than previously expected. Except for a patent case and the majority of cases relating to pharma-ceutical pricing for which Abbott is unable to estimate a loss, if any, Abbott estimates the range of possible loss to be from approximately $110 million to $325 million for its legal proceedings and environmental exposures. Reserves of approximately $165 million have been recorded at December 31, 2007 for these proceedings and expo-sures. These reserves represent management’s best estimate of probable loss, as defined by SFAS No. 5.
Stock Compensation — On January 1, 2006, Abbott adopted SFAS No. 123 (revised 2004), “Share-Based Payment,” which requires that fair value of stock options be recorded in the results of operations. Since there is no market for trading employee stock options, manage-ment must use a fair value method. There is no certainty that the results of a fair value method would be the value at which employee stock options would be traded for cash. Fair value methods require management to make several assumptions, the most significant of which are the selection of a fair value model, stock price volatility and the average life of an option. Abbott has readily available grant-by-grant historical activity for several years in its option administration system that it uses in developing some of its assumptions. Abbott uses the Black-Scholes method to value stock options. The results of the Black-Scholes model are periodically compared to the binomial model and the results have been comparable. Abbott uses both his-torical volatility of its stock price and the implied volatility of currently traded options to develop the volatility assumptions. Abbott uses the
Financial Review
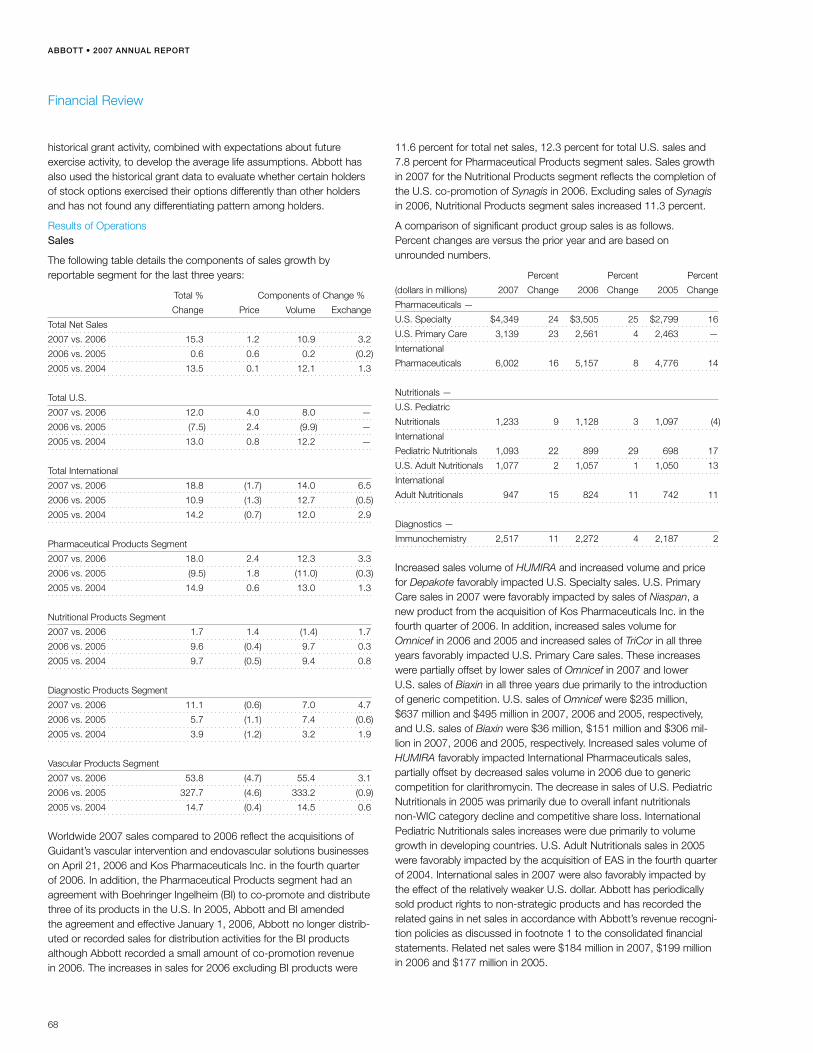
Abbott • 2007 AnnuAl RepoRt
68
historical grant activity, combined with expectations about future exercise activity, to develop the average life assumptions. Abbott has also used the historical grant data to evaluate whether certain holders of stock options exercised their options differently than other holders and has not found any differentiating pattern among holders.
Results of OperationsSales
The following table details the components of sales growth by reportable segment for the last three years:
Total % Components of Change %
Change Price Volume Exchange
Total Net Sales
2007 vs. 2006 15.3 1.2 10.9 3.2
2006 vs. 2005 0.6 0.6 0.2 (0.2)
2005 vs. 2004 13.5 0.1 12.1 1.3
Total U.S.
2007 vs. 2006 12.0 4.0 8.0 —
2006 vs. 2005 (7.5) 2.4 (9.9) —
2005 vs. 2004 13.0 0.8 12.2 —
Total International
2007 vs. 2006 18.8 (1.7) 14.0 6.5
2006 vs. 2005 10.9 (1.3) 12.7 (0.5)
2005 vs. 2004 14.2 (0.7) 12.0 2.9
Pharmaceutical Products Segment
2007 vs. 2006 18.0 2.4 12.3 3.3
2006 vs. 2005 (9.5) 1.8 (11.0) (0.3)
2005 vs. 2004 14.9 0.6 13.0 1.3
Nutritional Products Segment
2007 vs. 2006 1.7 1.4 (1.4) 1.7
2006 vs. 2005 9.6 (0.4) 9.7 0.3
2005 vs. 2004 9.7 (0.5) 9.4 0.8
Diagnostic Products Segment
2007 vs. 2006 11.1 (0.6) 7.0 4.7
2006 vs. 2005 5.7 (1.1) 7.4 (0.6)
2005 vs. 2004 3.9 (1.2) 3.2 1.9
Vascular Products Segment
2007 vs. 2006 53.8 (4.7) 55.4 3.1
2006 vs. 2005 327.7 (4.6) 333.2 (0.9)
2005 vs. 2004 14.7 (0.4) 14.5 0.6
Worldwide 2007 sales compared to 2006 reflect the acquisitions of Guidant’s vascular intervention and endovascular solutions businesses on April 21, 2006 and Kos Pharmaceuticals Inc. in the fourth quarter of 2006. In addition, the Pharmaceutical Products segment had an agreement with Boehringer Ingelheim (BI) to co-promote and distribute three of its products in the U.S. In 2005, Abbott and BI amended the agreement and effective January 1, 2006, Abbott no longer distrib-uted or recorded sales for distribution activities for the BI products although Abbott recorded a small amount of co-promotion revenue in 2006. The increases in sales for 2006 excluding BI products were
11.6 percent for total net sales, 12.3 percent for total U.S. sales and 7.8 percent for Pharmaceutical Products segment sales. Sales growth in 2007 for the Nutritional Products segment reflects the completion of the U.S. co-promotion of Synagis in 2006. Excluding sales of Synagis in 2006, Nutritional Products segment sales increased 11.3 percent.
A comparison of significant product group sales is as follows. Percent changes are versus the prior year and are based on unrounded numbers.
Percent Percent Percent
(dollars in millions) 2007 Change 2006 Change 2005 Change
Pharmaceuticals —
U.S. Specialty $4,349 24 $3,505 25 $2,799 16
U.S. Primary Care 3,139 23 2,561 4 2,463 —
International
Pharmaceuticals 6,002 16 5,157 8 4,776 14
Nutritionals —
U.S. Pediatric
Nutritionals 1,233 9 1,128 3 1,097 (4)
International
Pediatric Nutritionals 1,093 22 899 29 698 17
U.S. Adult Nutritionals 1,077 2 1,057 1 1,050 13
International
Adult Nutritionals 947 15 824 11 742 11
Diagnostics —
Immunochemistry 2,517 11 2,272 4 2,187 2
Increased sales volume of HUMIRA and increased volume and price for Depakote favorably impacted U.S. Specialty sales. U.S. Primary Care sales in 2007 were favorably impacted by sales of Niaspan, a new product from the acquisition of Kos Pharmaceuticals Inc. in the fourth quarter of 2006. In addition, increased sales volume for Omnicef in 2006 and 2005 and increased sales of TriCor in all three years favorably impacted U.S. Primary Care sales. These increases were partially offset by lower sales of Omnicef in 2007 and lower U.S. sales of Biaxin in all three years due primarily to the introduction of generic competition. U.S. sales of Omnicef were $235 million, $637 million and $495 million in 2007, 2006 and 2005, respectively, and U.S. sales of Biaxin were $36 million, $151 million and $306 mil-lion in 2007, 2006 and 2005, respectively. Increased sales volume of HUMIRA favorably impacted International Pharmaceuticals sales, partially offset by decreased sales volume in 2006 due to generic competition for clarithromycin. The decrease in sales of U.S. Pediatric Nutritionals in 2005 was primarily due to overall infant nutritionals non-WIC category decline and competitive share loss. International Pediatric Nutritionals sales increases were due primarily to volume growth in developing countries. U.S. Adult Nutritionals sales in 2005 were favorably impacted by the acquisition of EAS in the fourth quarter of 2004. International sales in 2007 were also favorably impacted by the effect of the relatively weaker U.S. dollar. Abbott has periodically sold product rights to non-strategic products and has recorded the related gains in net sales in accordance with Abbott’s revenue recogni-tion policies as discussed in footnote 1 to the consolidated financial statements. Related net sales were $184 million in 2007, $199 million in 2006 and $177 million in 2005.
Financial Review
69
Abbott • 2007 AnnuAl RepoRt
The expiration of licenses, patent protection and generic competition can affect the future revenues and operating income of Abbott. Significant ongoing generic activities and significant patent and license expirations in the next three years are as follows. The U.S. composi-tion of matter patent for Depakote expires in July of 2008. Abbott holds non-composition of matter patents on the extended release form of Depakote. U.S. sales of Depakote were $1.5 billion in 2007. The Pharmaceutical Products segment markets Depakote. Some patents under license in the Vascular Products segment related to rapid exchange technology expire in 2008, however the impact is not expected to be material. The patent for Prevacid, which is marketed by TAP Pharmaceuticals, expires in 2009.
Operating Earnings
Gross profit margins were 55.9 percent of net sales in 2007, 56.3 per-cent in 2006 and 52.4 percent in 2005. The decrease in the gross profit margin in 2007 was due, in part, to the effect of the unfavorable impact in 2007 of the completion of the U.S. co-promotion of Synagis in 2006 as well as generic competition for Omnicef and Biaxin sales in 2007. Increased amortization of intangible assets acquired in 2006 also had an unfavorable impact on the gross profit margins in 2007. The increase in the gross profit margin in 2006 was due to favorable product mix, primarily as a result of decreased sales of Boehringer Ingelheim products that had lower margins than other products in the Pharmaceutical Products segment and the decrease in the gross profit margin in 2005 was due to unfavorable product mix, primarily as a result of increased sales of Boehringer Ingelheim products. Restructuring charges, discussed below, reduced the gross profit margins in 2007, 2006 and 2005 by 0.7 percentage points, 1.1 per-centage points and 0.8 percentage points, respectively. Gross profit margins in all years were also affected by productivity improvements, higher commodity costs, higher project expenses for new products, higher manufacturing capacity costs for anticipated unit growth and the effects of inflation.
In the U.S., states receive price rebates from manufacturers of infant formula under the federally subsidized Special Supplemental Food Program for Women, Infants, and Children. There are also rebate programs for pharmaceutical products. These rebate programs continue to have a negative effect on the gross profit margins of the Nutritional and Pharmaceutical Products segments. Higher commodity costs unfavorably impacted the gross profit margins for the Nutritional Products segment in 2007 and pricing pressures unfavorably impacted the gross profit margins in 2006 and 2005.
The gross profit margins for the Pharmaceutical Products segment were favorably impacted in 2006 and unfavorably impacted in 2005 by product mix. The favorable product mix in 2006 was due to decreased sales of lower margin Boehringer Ingelheim products and the unfavor-able impact on the gross profit margin in 2005 was due primarily to increased sales of lower margin Boehringer Ingelheim products and higher other manufacturing costs.
Research and development expense, excluding acquired in-process and collaborations research and development, was $2.5 billion in 2007, $2.3 billion in 2006 and $1.8 billion in 2005 and represented increases of 11.1 percent in 2007, 23.8 percent in 2006 and 7.3 per-cent in 2005. The effect of recording compensation expense relating to share-based awards in 2006 and additional costs associated with
Abbott’s decision to discontinue the commercial development of the ZoMaxx drug-eluting stent increased research and development expenses by 6.3 percentage points over 2005. The increases in 2007 and 2006 were also affected by the acquisitions of Guidant’s vascular intervention and endovascular solutions businesses in April 2006 and Kos Pharmaceuticals Inc. in the fourth quarter of 2006. These increases also reflect increased spending to support pipeline programs, including new indications for HUMIRA, and ABT-335 (a cholesterol drug), ABT-335/Crestor fixed-dose combination, ABT-874 (a biologic for psoriasis and Crohn’s disease), controlled-release Vicodin CR, Xience V, as well as several Phase I and Phase II clinical programs in neuroscience and oncology. The majority of research and development expenditures are concentrated on pharmaceutical products.
Selling, general and administrative expenses increased 16.7 percent in 2007 compared to increases of 15.5 percent in 2006 and 11.7 per-cent in 2005. The 2007 increase reflects the acquisitions of Guidant’s vascular intervention and endovascular solutions businesses and Kos Pharmaceuticals Inc. The 2006 increase reflects recording com-pensation expense relating to share-based awards, a philanthropic contribution to the Abbott Fund and the acquisition of Guidant’s vascular intervention and endovascular solutions businesses. These items increased selling, general and administrative expenses by 8.6 percentage points over 2005. The restructuring charges discussed below and an increase in a bad debt reserve associated with an unfavorable court ruling increased the percent change from 2004 by 2.7 percentage points in 2005. The remaining increases in selling, general and administrative expenses were due primarily to increased selling and marketing support for new and existing products, including continued spending for HUMIRA and the continuing international launch of Xience V, as well as spending on other marketed pharma-ceutical products. Increases in all three years also reflect inflation and additional selling and marketing support primarily in the Pharmaceutical Products segment.
Restructurings(dollars in millions)
In 2007, 2006 and 2005, Abbott management approved plans to realign its worldwide pharmaceutical and vascular manufacturing operations and selected domestic and international commercial and research and development operations in order to reduce costs. In 2007, 2006 and 2005, Abbott recorded pretax charges against earn-ings of approximately $107, $210 and $256, respectively, reflecting the impairment of manufacturing facilities and other assets, employee severance and other related charges. Approximately $94, $181 and $174, respectively, is classified as cost of products sold, $3, $29 and $10, respectively, as research and development and $10 in 2007 and $72 in 2005 as selling, general and administrative. Fair value for the determination of the amount of asset impairments was determined primarily based on a discounted cash flow method. An additional $90, $70 and $14 were subsequently recorded in 2007, 2006 and 2005, respectively, relating to these restructurings, primarily for accelerated depreciation. In addition, Abbott implemented facilities restructuring plans in 2007 related to the acquired operations of Kos Pharmaceuticals Inc., which resulted in an increase to goodwill of approximately $52.
Financial Review

Abbott • 2007 AnnuAl RepoRt
70
The following summarizes the activity for restructurings:
Employee-
Related Asset
and Other Impairments Total
2005 restructuring charges $ 192 $ 64 $ 256
Payments, impairments
and other adjustments (37) (64) (101)
Accrued balance at December 31, 2005 155 — 155
2006 restructuring charges 118 93 211
Payments, impairments
and other adjustments (80) (93) (173)
Accrued balance at December 31, 2006 193 — 193
2007 restructuring charges 122 38 160
Payments, impairments
and other adjustments (121) (38) (159)
Accrued balance at December 31, 2007 $ 194 $ — $ 194
Abbott expects to incur up to an additional $73 in future periods for restructuring plans, primarily for accelerated depreciation.
Interest Expense
Interest expense increased in 2007 and 2006 due primarily to higher borrowings as a result of the acquisitions of Guidant’s vascular intervention and endovascular solutions businesses and Kos Pharmaceuticals Inc. and Abbott’s investment in the Boston Scientific common stock and note receivable.
Other (income) expense, net
Other (income) expense, net for 2007 includes a $190 million fair market value loss adjustment to Abbott’s investment in Boston Scientific common stock and a realized gain of $37 million on the sales of Boston Scientific common stock. Other (income) expense, net for 2007 and 2006 includes fair value gain adjustments of $28 million and $91 million, respectively, to certain derivative financial instruments included with the investment in Boston Scientific common stock.
Taxes on Earnings
The income tax rates on earnings were 19.3 percent in 2007, 24.6 percent in 2006 and 27.0 percent in 2005. Taxes on earnings in 2006 reflect the effect of the tax rates applied to acquired in-process research and development and the resolution of prior years’ income tax audits and the effect of other discrete tax items. For 2006, the tax rates applied to acquired in-process and collaborations research and development increased the effective tax rate by 6.6 percentage points and the effect of the income tax audit resolution and other discrete tax items decreased the effective tax rate by 5.5 percentage points. In 2005, Abbott remitted $4.3 billion of foreign earnings in accordance with the American Jobs Creation Act of 2004 and recorded additional tax expense of $245 million, which increased the effective tax rate by approximately 5.3 percentage points. This was partially offset by adjustments of prior years’ tax accounts resulting primarily from reso-lution of prior years’ accrual requirements, which decreased the effective tax rate by 2.3 percentage points. Abbott expects to apply an annual effective rate of somewhat above 19 percent in 2008.
Recently Adopted Accounting Standards
Effective January 1, 2007, Abbott adopted Statement of Financial Accounting Standards (SFAS) No. 157, “Fair Value Measurements,” and SFAS No. 159, “The Fair Value Option for Financial Assets and Financial Liabilities.” Adoption of these Standards did not have a material impact on Abbott’s financial position. However, adoption of SFAS No. 159 and SFAS No. 157 resulted in a decrease to Earnings employed in the business of approximately $189 million, substantially offset by an increase to Accumulated other comprehensive income (loss) of approximately $182 million as of January 1, 2007.
Effective January 1, 2007, Abbott adopted FASB Interpretation No. 48, “Accounting for Uncertainty in Income Taxes.” FASB Interpretation No. 48 requires that a recorded tax benefit must be more likely than not of being sustained upon examination by tax authorities based upon its technical merits. The amount of benefit recorded is the largest amount of benefit that is greater than 50 percent likely of being realized upon ultimate settlement. Adoption of this Interpretation did not have a material impact on Abbott’s financial position.
Business Combinations, Technology Acquisitions and Related Transactions
In December 2006, Abbott acquired Kos Pharmaceuticals Inc. for cash of approximately $3.8 billion, net of cash held by Kos Pharmaceuticals Inc., to expand Abbott’s presence in the lipid man-agement market and to provide several on-market and late-stage pipeline products. Kos Pharmaceuticals Inc. was a specialty pharma-ceutical company that developed and marketed proprietary medications for the treatment of chronic cardiovascular, metabolic and respiratory diseases. This business was acquired on December 13, 2006 and the financial results of the acquired operations are included in these financial statements beginning on that date. The acquisition was financed primarily with short-term debt. The allocation of the pur-chase price resulted in a charge of $1.3 billion for acquired in-process research and development, intangible assets of $821 million, goodwill (primarily non-deductible) of $1.6 billion and net liabilities, primarily deferred income taxes recorded at acquisition of $331 million. Acquired intangible assets are being amortized over 4 to 15 years. Non-deductible acquired in-process research and development was charged to income in 2006.
A substantial amount of the acquired in-process research and devel-opment charge relating to the Kos acquisition related primarily to cholesterol treatment drugs. The research efforts ranged from 70 per-cent to 80 percent complete at the date of acquisition. The valuation method used to fair value the projects was the Multi-period Excess Earnings Method (Income Approach) and the risk-adjusted discount rate used was 16 percent. In developing assumptions for the valuation model, comparable Abbott products or products marketed by com-petitors were used to estimate pricing, margins and expense levels. As of December 31, 2007, one drug was approved for marketing in the U.S. and the remaining research efforts were primarily on schedule. The estimated projected costs to complete the projects totaled
Financial Review
71
Abbott • 2007 AnnuAl RepoRt
approximately $75 million as of December 31, 2007 with anticipated product launches from 2008 through 2010. There have been no signif-icant changes in the development plans for the acquired incomplete projects. Significant net cash inflows will commence with the launches of the products.
In order to expand Abbott’s presence in the growing vascular market, Abbott acquired Guidant’s vascular intervention and endovascular solutions businesses on April 21, 2006 for approximately $4.1 billion, in cash, in connection with Boston Scientific’s acquisition of Guidant. In addition, Abbott will also pay to Boston Scientific $250 million each upon government approvals to market the Xience V drug-eluting stent in the U.S. and in Japan. Government approvals are anticipated in 2008 for the U.S. and in 2009 for Japan. Each $250 million payment will result in the recording of additional goodwill. The allocation of the purchase price resulted in a charge of $665 million for acquired in-pro-cess research and development, intangible assets of $1.2 billion, goodwill (primarily deductible) of $1.7 billion and tangible net assets of $580 million. Acquired intangible assets are being amortized over 4 to 15 years. Deductible acquired in-process research and development was charged to income in 2006. The net tangible assets acquired consist primarily of property and equipment of approximately $530 mil-lion, trade accounts receivable of approximately $250 million and inventories of approximately $120 million, net of assumed liabilities, primarily trade accounts payable, litigation reserves and other liabilities.
A substantial amount of the acquired in-process research and devel-opment charge relating to the Guidant acquisition related to drug eluting and bioabsorbable stents. The research efforts ranged from 35 percent to 85 percent complete at the date of acquisition. The valuation method used to fair value the projects was the Multi-period Excess Earnings Method (Income Approach) and the risk-adjusted discount rates used ranged from 16 percent to 25 percent. In develop-ing assumptions for the valuation model, comparable Abbott products or products marketed by competitors were used to estimate pricing, margins and expense levels. As of December 31, 2007, the research efforts were primarily on schedule. The estimated projected costs to complete totaled approximately $390 million as of December 31, 2007, with anticipated product launch dates from 2008 through 2013. There have been no significant changes in the development plans for the acquired incomplete projects. Significant net cash inflows will commence within one to two years after product launch.
In order to facilitate Boston Scientific’s acquisition of Guidant, Abbott also acquired 64.6 million shares of Boston Scientific common stock directly from Boston Scientific and loaned $900 million to a wholly-owned subsidiary of Boston Scientific. The common stock was valued at $1.3 billion and the note receivable was valued at $829 million at the acquisition date. In connection with the acquisition of the shares, Boston Scientific is entitled to certain after-tax gains upon Abbott’s sale of the shares. In addition, Boston Scientific agreed to reimburse Abbott for certain borrowing costs on debt incurred to acquire the Boston Scientific shares. Abbott recorded a net derivative financial instruments liability of $59 million for the gain-sharing derivative
financial instrument liability and the interest derivative financial instru-ment asset. The effect of recording the shares, the loan to Boston Scientific and the derivative financial instruments at fair value on the date of acquisition resulted in the recording of additional goodwill of approximately $204 million. Changes in the fair value of the derivative financial instruments, net are recorded in Other (income) expense, net.
In 2005, Abbott acquired the remaining interest in a small medical products company and a less than 50 percent equity interest in a small medical products company for $25 million. In 2005, Abbott also acquired additional rights related to HUMIRA for approximately $270 million, which are being amortized over 13 years.
Had the above acquisitions taken place on January 1 of the previous year, consolidated net sales and income would not have been signifi-cantly different from reported amounts.
Financial ConditionCash Flow
Net cash from operating activities amounted to $5.2 billion, $5.3 billion and $5.0 billion in 2007, 2006 and 2005, respectively. Cash from operating activities in 2007 and 2006 compared to 2005 is higher due to higher net earnings adjusted for after-tax non-cash charges for acquired in-process research and development in 2006 and share-based compensation and higher contributions to retirement benefit plans in 2005 compared to 2007 and 2006; partially offset by higher income tax payments in 2006, including tax payments related to the 2005 remittances of foreign earnings under the American Jobs Creation Act. Abbott funds its domestic pension plans according to IRS funding limitations. In 2007 and 2006, $200 million was funded to the main domestic pension plan and in 2005, $641 million was funded to the main domestic pension plan. Abbott expects pension funding for its main domestic pension plan of $200 million annually. The increased contribution in 2005 was due, in part, to the investment of cash remitted under the American Jobs Creation Act of 2004. Abbott expects annual cash flow from operating activities to continue to exceed Abbott’s capital expenditures and cash dividends.
Debt and Capital
At December 31, 2007, Abbott’s long-term debt rating was AA by Standard & Poor’s Corporation and A1 by Moody’s Investors Service. Abbott has readily available financial resources, including unused lines of credit of $3.0 billion that support commercial paper borrowing arrangements. These lines of credit expire in 2012.
In October 2006, the board of directors authorized the purchase of $2.5 billion of Abbott’s common shares from time to time and no shares were purchased under this authorization in 2006. In 2007, Abbott purchased approximately 19.0 million of its common shares at a cost of approximately $1.0 billion. In 2006 and 2005, Abbott purchased approximately 17.3 million and 30.0 million, respectively, of its common shares under prior authorizations at a cost of approximately $755 million and $1.3 billion, respectively.
Financial Review

Abbott • 2007 AnnuAl RepoRt
72
Under a registration statement filed with the Securities and Exchange Commission in February 2006, Abbott issued $3.5 billion of long-term debt in 2007 that matures in 2012 through 2037 with interest rates ranging from 5.15 percent to 6.15 percent. Proceeds from this debt were used to pay down short-term borrowings that were incurred to partially fund the acquisition of Kos Pharmaceuticals Inc. Under the same registration statement, Abbott issued $4.0 billion of long-term debt in 2006 that matures in 2009 through 2016 with interest rates ranging from 5.375 percent to 5.875 percent. Proceeds from this debt were used to pay down domestic commercial paper borrowings that were incurred to partially fund the acquisition of Guidant’s vascular intervention and endovascular solutions businesses. In addition, com-mercial paper borrowings were used to repay $1.9 billion of long-term debt in 2006. In 2005, Abbott borrowed $1.9 billion of long-term debt that was scheduled to mature in May 2008 with variable interest rates above LIBOR. In 2007 and 2006, $300 million and $1.6 billion, respectively, of this debt was paid prior to maturity.
Working Capital
Working capital was $4.9 billion at December 31, 2007 and $4.0 billion at December 31, 2005. At December 31, 2006, current liabilities exceeded current assets by approximately $669 million as a result of increased short-term borrowings used to acquire Kos Pharmaceuticals Inc. in December 2006.
Capital Expenditures
Capital expenditures of $1.7 billion in 2007, $1.3 billion in 2006 and $1.2 billion in 2005 were principally for upgrading and expanding manufacturing, research and development, investments in information technology and administrative support facilities in all segments, and for laboratory instruments placed with customers.
Contractual Obligations
The following table summarizes Abbott’s estimated contractual obligations as of December 31, 2007:
Contingent Obligations
Abbott has periodically entered into agreements in the ordinary course of business, such as assignment of product rights, with other compa-nies which has resulted in Abbott becoming secondarily liable for obligations that Abbott was previously primarily liable. Since Abbott no longer maintains a business relationship with the other parties, Abbott is unable to develop an estimate of the maximum potential amount of future payments, if any, under these obligations. Based upon past experience, the likelihood of payments under these agreements is remote. In addition, Abbott periodically acquires a business or product rights in which Abbott agrees to pay contingent consideration based on attaining certain thresholds or based on the occurrence of certain events. In connection with the acquisition of Guidant’s vascular inter-vention and endovascular solutions businesses, Abbott will pay to Boston Scientific $250 million each upon government approvals to market the Xience V drug-eluting stent in the U.S. and in Japan. Government approvals are anticipated in 2008 for the U.S. and in 2009 for Japan. In addition, Abbott has retained liabilities for taxes on income prior to the spin-off of Hospira and certain potential liabilities, if any, related to alleged improper pricing practices in connection with federal, state and private reimbursement for certain drugs.
Recently Issued Accounting Standards
In December 2007, the FASB issued two standards: SFAS No. 141 (revised 2007) “Business Combinations” and SFAS No. 160 “Noncontrolling Interests in Consolidated Financial Statements — an amendment of ARB No. 51.” Abbott will adopt these standards on January 1, 2009. Statement No. 141 (revised 2007) will impact Abbott primarily in five areas: acquired in-process research and development will be accounted for as an indefinite lived intangible asset until approval or discontinuation rather than as expense; acquisition costs will be expensed rather than added to the cost of an acquisition; restructuring costs in connection with an acquisition will be expensed rather than added to the cost of an acquisition; the fair value of contin-gent consideration at the date of an acquisition will be included in the cost of an acquisition; and the fair value of contingent liabilities that are more likely than not of occurrence will be recorded at the date of an acquisition. The effect of these changes will be applicable to acquisi-tions on or after January 1, 2009. Adoption of Statement No. 160 will not have a material effect on Abbott.
Financial Review
(dollars in millions) Payment Due By Period
2013 and
Total 2008 2009-2010 2011-2012 Thereafter
Long-term debt, including current maturities and future interest payments $14,831 $1,365 $2,052 $3,722 $7,692
Operating lease obligations 434 87 131 87 129
Capitalized auto lease obligations 78 26 52 — —
Purchase commitments (a) 3,551 3,194 283 67 7
Other long-term liabilities reflected on the consolidated balance sheet—
Benefit plan obligations 2,192 — 325 362 1,505
Other 1,100 — 742 115 243
Total $22,186 $4,672 $3,585 $4,353 $9,576
(a) Purchase commitments are for purchases made in the normal course of business to meet operational and capital expenditure requirements.

73
Abbott • 2007 AnnuAl RepoRt
Financial Review
Legislative Issues
In August 2006, the President of the United States signed the Pension Protection Act of 2006. Among other things, the Act estab-lishes new minimum funding requirements for plan years beginning in 2008. Abbott does not expect this Act to significantly impact future fundings of its domestic defined benefit pension plans.
Abbott’s primary markets are highly competitive and subject to sub-stantial government regulation throughout the world. Abbott expects debate to continue over the availability, method of delivery, and payment for health care products and services. Abbott believes that if legislation is enacted, it could have the effect of reducing access to health care products and services, or reducing prices or the rate of price increases for health care products and services. It is not possible to predict the extent to which Abbott or the health care industry in general might be adversely affected by these factors in the future. A more complete discussion of these factors is contained in Item 1, Business, and Item 1A, Risk Factors on Form 10-K.
Private Securities Litigation Reform Act of 1995 — A Caution Concerning Forward-Looking Statements
Under the safe harbor provisions of the Private Securities Litigation Reform Act of 1995, Abbott cautions investors that any forward-look-ing statements or projections made by Abbott, including those made in this document, are subject to risks and uncertainties that may cause actual results to differ materially from those projected. Economic, competitive, governmental, technological and other factors that may affect Abbott’s operations are discussed in 1A, Risk Factors, to the Annual Report on Form 10-K.

Abbott • 2007 AnnuAl RepoRt
74
Year Ended December 31 2007 2006 2005 2004 2003 2002 2001
Summary of Operations:
Net sales $25,914.2 22,476.3 22,337.8 19,680.0 17,280.3 15,279.5 13,918.5
Cost of products sold $11,422.0 9,815.1 10,641.1 8,884.2 7,774.2 6,820.5 6,107.1
Research and development (a) $ 2,505.6 2,255.3 1,821.2 1,696.8 1,623.8 1,474.5 1,491.8
Selling, general and administrative $ 7,408.0 6,349.7 5,496.1 4,921.8 4,808.1 3,724.9 3,491.0
Operating earnings $ 4,578.5 2,042.2 4,362.3 3,898.3 2,974.0 3,151.9 1,498.2
Interest expense $ 593.1 416.2 241.4 200.2 188.3 238.9 307.3
Interest income $ (136.8) (123.8) (87.7) (51.1) (41.9) (33.5) (71.4)
Other (income), net $ (347.5) (526.5) (411.3) (376.4) (559.5) (374.4) (231.3)
Earnings from continuing
operations before taxes $ 4,469.6 2,276.4 4,619.9 4,125.6 3,387.2 3,321.0 1,493.6
Taxes on earnings from
continuing operations $ 863.3 559.6 1,247.9 949.8 882.4 774.0 215.9
Earnings from continuing operations $ 3,606.3 1,716.8 3,372.1 3,175.8 2,504.7 2,547.0 1,277.7
Basic earnings per share
from continuing operations $ 2.34 1.12 2.17 2.03 1.60 1.63 0.82
Diluted earnings per share
from continuing operations $ 2.31 1.12 2.16 2.02 1.59 1.62 0.82
Financial Position:
Working capital $ 4,939.5 (669.3) 3,970.5 3,908.8 2,650.9 2,119.6 492.4
Long-term investments $ 1,125.3 1,229.9 134.0 145.8 406.4 250.8 647.2
Net property and equipment $ 7,518.1 6,946.4 6,003.1 6,007.9 6,281.8 5,828.1 5,551.5
Total assets $39,713.9 36,178.2 29,141.2 28,767.5 26,039.3 23,592.7 22,755.5
Long-term debt $ 9,487.8 7,009.7 4,571.5 4,787.9 3,452.3 4,274.0 4,335.5
Shareholders’ investment $17,778.5 14,054.2 14,415.3 14,325.8 13,072.3 10,664.6 9,059.4
Return on shareholders’ investment
from continuing operations % 22.7 12.1 23.5 23.8 22.6 28.0 15.9
Book value per share $ 11.47 9.14 9.37 9.18 8.36 6.82 5.83
Other Statistics:
Gross profit margin % 55.9 56.3 52.4 54.9 55.0 55.4 56.1
Research and development to net sales % 9.7 10.0 8.2 8.6 9.4 9.7 10.7
Net cash from operating activities
of continuing operations $ 5,183.8 5,262.1 5,047.4 4,306.0 3,385.2 3,653.5 3,083.7
Capital expenditures $ 1,656.2 1,337.8 1,207.5 1,291.6 1,050.1 1,105.4 963.6
Cash dividends declared per common share $ 1.30 1.18 1.10 1.04 0.98 0.94 0.84
Common shares outstanding (in thousands) 1,549,910 1,537,243 1,539,235 1,560,024 1,564,518 1,563,068 1,554,530
Number of common shareholders 73,176 77,727 82,237 88,582 91,212 94,687 97,760
Number of employees 68,697 66,663 59,735 60,617 58,181 57,819 56,426
Sales per employee (in dollars) $ 377,225 337,163 373,948 324,662 297,010 264,265 246,668
Market price per share – high $ 59.50 49.87 50.00 47.63 47.15 58.00 57.17
Market price per share – low $ 48.75 39.18 37.50 38.26 33.75 29.80 42.00
Market price per share – close $ 56.15 48.71 39.43 46.65 46.60 40.00 55.75
(a) In 2006, 2005, 2004, 2003, 2002 and 2001 Abbott also recorded pretax charges of $2,014, $17, $279, $100, $108 and $1,330, respectively, for acquired in-process research and
development related to business acquisitions.
Summary of Selected Financial Data(dollars in millions, except per share data)

75
Directors and Corporate Officers
Abbott • 2007 AnnuAl RepoRt
Directors
Roxanne S. AustinPresident, Austin Investment AdvisorsNewport Coast, Calif.
William M. DaleyHead of the Office of Corporate Social Responsibility and Chairman of the Midwest, JPMorgan Chase & Co.Chicago, Ill.
W. James Farrell Retired Chairman and Chief Executive Officer, Illinois Tool Works, Inc. Glenview, Ill.
H. Laurance FullerRetired Co-Chairman of the Board, BP Amoco, p.l.c. London, United Kingdom
William A. OsbornChairman and former Chief Executive Officer, Northern Trust Corporation and its principal subsidiary, The Northern Trust Co.Chicago, Ill.
The Rt. Hon. Lord Owen CHChairman of Europe Steel, p.l.c.London, United Kingdom
Boone Powell, Jr.Retired Chairman,Baylor Health Care SystemDallas, Texas
W. Ann Reynolds, Ph.D.Former President, The University of Alabama at BirminghamBirmingham, Ala.
Roy S. RobertsManaging Director, Reliant Equity InvestorsChicago, Ill.
Samuel C. Scott IIIChairman, President and Chief Executive Officer, Corn Products International Inc.Westchester, Ill.
William D. SmithburgRetired Chairman, President and Chief Executive Officer,The Quaker Oats Co.Chicago, Ill.
Glenn F. TiltonChairman, President and Chief Executive Officer, UAL Corporation and United Air Lines, Inc., a wholly owned subsidiary of UAL CorporationChicago, Ill.
Miles D. WhiteChairman of the Boardand Chief Executive Officer,Abbott
Senior Management
Miles D. White* Chairman of the Board and Chief Executive Officer
Thomas C. Freyman*Executive Vice President, Finance and Chief Financial Officer
Richard W. Ashley*Executive Vice President, Corporate Development
John M. Capek, Ph.D.*Executive Vice President, Medical Devices
Holger A. Liepmann*Executive Vice President, Nutritional Products
Edward L. Michael*Executive Vice President, Diagnostics Products
Laura J. Schumacher*Executive Vice President, General Counsel and Secretary
James L. Tyree*Executive Vice President, Pharmaceutical Products
Olivier Bohuon*Senior Vice President, International Pharmaceuticals
Thomas F. Chen*Senior Vice President, International Nutrition
Edward J. Fiorentino Senior Vice President, Abbott and Executive Vice President, TAP
Stephen R. Fussell*Senior Vice President, Human Resources
Robert B. Hance*Senior Vice President, Diabetes Care
John C. Landgraf*Senior Vice President, Pharmaceuticals, Manufacturing and Supply
John M. Leonard, M.D.*Senior Vice President, Pharmaceuticals, Research and Development
Donald V. Patton, Jr. *Senior Vice President, U.S. Nutrition
Mary T. Szela*Senior Vice President, U.S. Pharmaceuticals
Corporate Vice Presidents
Carlos AlbanVice President, Pharmaceuticals, Western Europe and Canada
Greg E. ArnsdorffVice President, Point of Care Diagnostics
Alejandro A. AruffoVice President, Pharmaceuticals Development
Catherine V. BabingtonVice President, Public Affairs
Michael G. Beatrice, Ph.D.Vice President, Corporate Regulatory and Quality Science
Charles M. BrockVice President, Chief Ethics and Compliance Officer
William J. ChaseVice President, Treasurer
Jaime ContrerasVice President, International Diagnostics
Thomas J. DeeVice President, Controller, International Pharmaceuticals
Charles D. FoltzVice President, Vascular Solutions
Robert E. FunckVice President, Internal Audit
Honey Lynn Goldberg Vice President, Associate General Counsel, Corporate Transactions
Cecilia L. KimberlinVice President, Quality, Medical Products
Zahir A. LavjiVice President, Diabetes Care, Commercial Operations
Elaine R. LeavenworthVice President, Government Affairs
Steven J. LichterVice President, Pharmaceuticals,Manufacturing
Greg W. Linder*Vice President, Controller
Heather L. MasonVice President, Pharmaceuticals,Latin America
P. Loreen Mershimer Vice President, Integrated Healthcare Policy
Sean E. MurphyVice President, Licensing/New Business Development
Daniel W. Norbeck, Ph.D.Vice President, Pharmaceuticals Discovery
D. Stafford O’KellyVice President, Molecular Diagnostics
AJ J. ShoultzVice President, Taxes
Preston T. SimonsVice President, Information Technology
R. Nicholas SpauldingVice President, Vascular, Commercial Operations
Eugene Sun, M.D.Vice President, Pharmaceuticals Clinical Development
John B. ThomasVice President, Investor Relations
Michael J. WarmuthVice President,Hematology Diagnostics
Glenn S. WarnerVice President, Pharmaceuticals,Japan
David E. Wheadon, M.D.Vice President,Pharmaceuticals Regulatory Affairs
Susan M. WidnerVice President, Corporate Marketing
*Denotes executive officers

Shareholder and Corporate Information
Stock Listing
The ticker symbol for Abbott’s common stock is ABT. It is listed on the New York, Chicago, London and Swiss exchanges. It is traded on the Boston, Philadelphia and National Stock Exchanges, as well as on the NYSE Arca and NASDAQ iM markets.
Quarterly Dividend Dates
Dividends are expected to be declared and paid on the following schedule in 2008, pending approval by the board of directors:
Quarter Declared Record Paid
First 2/15 4/15 5/15
Second 6/6 7/15 8/15
Third 9/12 10/15 11/15
Fourth 12/12 1/15/09 2/15/09
Tax Information for Shareholders
Abbott is an Illinois High Impact Business and is located in a U.S. federal Foreign Trade Sub-Zone (Sub-Zone 22F). Dividends may be eligible for a subtraction from base income for Illinois income tax purposes.
If you have any questions, please contact your tax advisor.
Dividend Reinvestment Plan
The Abbott Dividend Reinvestment Plan offers registered shareholders an opportunity to purchase additional shares, commission-free, through automatic dividend reinvestment and/or optional cash investments. Interested persons may contact the transfer agent, call Abbott’s Investor Newsline or write Abbott Shareholder Services.
Dividend Direct Deposit
Shareholders may have quarterly dividends deposited directly into a checking or savings account at any financial institution that participates in the Automated Clearing House system. For more information, please contact the transfer agent, call the Investor Newsline or write Abbott Shareholder Services.
Annual Meeting
The annual meeting of shareholders will be held at 9 a.m. on Friday, April 25, 2008, at Abbott’s corporate headquarters. Questions regarding the annual meeting may be directed to the Corporate Secretary.
A copy of Abbott’s 2007 Form 10-K Annual Report, as filed with the Securities and Exchange Commission, is available on the Abbott Web site at www.abbott.com or by contacting the Investor Newsline.
CEO and CFO Certifications
In 2007, Abbott’s chief executive officer (CEO) provided to the New York Stock Exchange the annual CEO certification regarding Abbott’s compliance with the New York Stock Exchange’s corporate governance listing standards. In addition, Abbott’s CEO and chief financial officer filed with the U.S. Securities and Exchange Commission all required certifications regarding the quality of Abbott’s public disclosures in its fiscal 2007 reports.
Investor Newsline(847) 937-7300
Investor RelationsDept. 362, AP6D2
Shareholder ServicesDept. 312, AP6D2
Corporate SecretaryDept. 364, AP6D2
Abbott 100 Abbott Park Road Abbott Park, IL 60064-6400 U.S.A. (847) 937-6100
Web Site
www.abbott.com
Global Citizenship Report
Visit www.abbott.com/citizenship to read Abbott’s current global citizenship report.
Transfer Agent and Registrar
Computershare P.O. Box 43078 Providence, RI 02940-3078 (888) 332-2268 www.computershare.com
Shareholder Information
Shareholders with questions about their accounts may contact the transfer agent, call the Investor Newsline or write Abbott Shareholder Services.
Individuals who would like to receive additional information or have questions regarding Abbott’s business activities may call the Investor Newsline, write Abbott Investor Relations or visit Abbott’s Web site.
Abbott trademarks and products in-licensed by Abbott are shown in italics in the text of this report. Crestor and Herceptin are not trademarks of Abbott Laboratories. © 2008, Abbott Laboratories
Printed on Recycled Paper
Some statements in this annual report may be forward-looking statements for purposes of the Private Securities Litigation Reform Act of 1995. Abbott cautions that these forward-looking statements are subject to risks and uncertainties that may cause actual results to differ materially from those indicated in the forward-looking statements. Economic, competitive, governmental, technological and other factors that may affect Abbott’s operations are discussed in Item 1A, “Risk Factors,” in our Securities and Exchange Commission 2007 Form 10-K and are incorporated by reference. We undertake no obligation to release publicly any revisions to forward-looking statements as the result of subsequent events or developments.
Abbott • 2007 AnnuAl RepoRt
76


Abbott100 Abbott Park Road, Abbott Park, IL 60064-6400 U.S.A.(847) 937-6100 www.abbott.com


