Embed Size (px)
Citation preview

7/24/2019 PDD Waste Gas RIL JN Version3
http://slidepdf.com/reader/full/pdd-waste-gas-ril-jn-version3 1/52
PROJECT DESIGN DOCUMENT FORM (CDM PDD) - Version 03.1.
CDM – Executive Board page 1
CLEAN DEVELOPMENT MECHANISM
PROJECT DESIGN DOCUMENT FORM (CDM-PDD)
Version 03 - in effect as of: 28 July 2006
CONTENTS
A. General description of project activity
B. Application of a baseline and monitoring methodology
C. Duration of the project activity / crediting period
D. Environmental impacts
E. Stakeholders’ comments
Annexes
Annex 1: Contact information on participants in the project activity
Annex 2: Information regarding public funding
Annex 3: Baseline information
Annex 4: Monitoring plan

7/24/2019 PDD Waste Gas RIL JN Version3
http://slidepdf.com/reader/full/pdd-waste-gas-ril-jn-version3 2/52
PROJECT DESIGN DOCUMENT FORM (CDM PDD) - Version 03.1.
CDM – Executive Board page 2
SECTION A. General description of project activity
A.1 Title of the project activity:
Waste gas utilisation for steam and power generation at RIL Jamnagar refinery
Version : 03Date : 19/10/2006
A.2. Description of the project activity:
>>
Reliance Industries Limited - Jamnagar is a fully integrated manufacturing complex comprising of a
petroleum refinery complex, a petrochemical complex, a power generation complex, and a port &
terminal complex along with the associated pipeline network. The refinery, of Crude is the world’s largest
grass root refinery. The design of the refinery as well as various process units within the complex is by
world’s leading technology suppliers viz. UOP & Linde etc.
RIL-Jamnagar is consciously working in the field of energy conservation and management to reduce
Green House Gas emission. In recognition of its effort, contribution and success, RIL-Jamnagar is
recipient of National Energy Conservation Awards by Ministry of Power, Government of India,
Confederation of Indian Industries, Petroleum Conservation Research Association etc.
The project activity involves efforts to reduce GHG emission through recovery of waste gases flared in
the refinery. Thus the aim of project activity was to systematically study the flare system, identify the
potential to reduce flaring and implement the schemes to reduce the flared gases.
The study involved stepwise analysis of all major streams joining the flare header. It consisted of
following steps :
• Review the conditions in Process Equipment to minimize flare control valve openings
• Identify leaky valves continuously and fix them
• Consider a flare gas recovery system.
Having worked on first two methods and minimizing the flare loss, it became apparent that further
reduction of flare loss is possible by going for a suitable and well designed flare gas recovery system. The
flare gas recovery System is known to be operative in some refineries internationally, while not working
properly at some other places. A detailed technical study and hydrocarbon balance with the help of
simulations resulted into proposals to management for four projects for flare gas recovery. Due to the lack
of experience and risk involved, the project proposals were not approved for a long period of time. Only

7/24/2019 PDD Waste Gas RIL JN Version3
http://slidepdf.com/reader/full/pdd-waste-gas-ril-jn-version3 3/52
PROJECT DESIGN DOCUMENT FORM (CDM PDD) - Version 03.1.
CDM – Executive Board page 3
when the incentive of CDM revenue along with other intangible benefits was taken into consideration, the
project proposals were approved. Various systems installed for flare gas recovery are explained below :
Measure I : Main Flare Gas Recovery
The Flare Gas Recovery System (FGRS) is a skid-mounted package consisting mainly of two
compressors which take suction from the flare gas header upstream of the Liquid Seal Drum, compresses
the gas and cools it for reuse in the Refinery Fuel Gas system.
FGRS is located downstream of knockout drums as all flare gases from various units in the refinery is
available at this single point. It is located just upstream of the seal drums as pressure control at the
suction to compressor will be maintained precisely, by keeping increased height of water column in the
drum.
The flare gas enters the compressors at 1.1 bara and 380°C. A continuous recirculating flow of process
water enters the compressors for compression, sealing and cooling of gas. After leaving the compressors
the gas, water and hydrocarbons mixture runs into the horizontal Gas/Liquid separator where the
compressed gas is separated from the water and condensed hydrocarbons by gravity due to lower gas
speed. The separated flare gas runs through demister before leaving the G/L separator in order to have
minimum water and condensed hydrocarbons content in the outlet gas stream and leaves from the top.
Measure II : Low Low Pressure (LLP) Flare gas Recovery
Delayed Coker at Reliance is the worlds largest coker operating at ultra low recycle and low drum
pressures aimed at maximizing distillate potential and reduced coke make for a given feed. Coking
operation is a semi batch process, which involves various sequential activities between coking and

7/24/2019 PDD Waste Gas RIL JN Version3
http://slidepdf.com/reader/full/pdd-waste-gas-ril-jn-version3 4/52
PROJECT DESIGN DOCUMENT FORM (CDM PDD) - Version 03.1.
CDM – Executive Board page 4
decoking cycle. One such activity is steaming of hydrocarbons from the coke drum to the blowdown
drum. This low-pressure coker operation forces the lighter fractions (non condensable) of hydrocarbons
from the blowdown system to be flared (LLP Flare). Several ideas were brainstormed to recover the
blowdown gases into the gas plant and ultimately an ejector system was commissioned to recover these
flare gases and make the worlds largest coker as a zero flaring coker.
A flare gas recovery system (FGRS) was designed and installed. This system recovers almost 43 Tonnes
per day of flare gases from coker. This also helped achieve a 95% reduction in Sox levels from flare.
The LLP Flare gas recovery system is as shown in the schematic (figure1). The flare gas from the
blowdown system is collected at the common flare knock out drum from where the gases are recovered
with the help of ejectors. The ejector system is a combination of four ejectors of equal capacity in
parallel. Medium pressure steam is used as a motive fluid and the flare gas are compressed to 0.9 Kg/cm2
(g) and is routed to the main fractionator overhead condenser receiver vessel after cooling. A water seal
pot is designed to create a system backpressure of 0.25 Kg/cm2 (g) at 70% level. This system has been
functional effectively with its unique control philosophy to minimize steam consumption. The ejector
motive steam is automatically switched on and off to control the suction pressure of the blowdown gases
at the ejector based on the requirement. The control philosophy takes care of inherent fluctuations in
coker automatically and needs no manual intervention at any point of time.
Flare gas seal
pot
Gas
KO A B C D
Close drain
A B
LLP
Close
Drain
FGBack-up PV
A33A
PVA34
PVA33B
XV061
XV062
XV06 3 XV06
4
XV065
XV066
XV06 7 XV06
8
PTA34
PSV A39
CWR Recovered gas to main
fractionator overhead
receiver vessel
A33
MP Motive steam
B/D settling
FractionatorO/H Receiver
Outlet of
Main ovhd
condensers
To
Compressor
Gas from B/D
O/H condenser
Gas from B/D O/H
PT 796
Flare gas
condenser
B/D settling
Outlet of
Main ovhd
condensers
CWS
Figure 1

7/24/2019 PDD Waste Gas RIL JN Version3
http://slidepdf.com/reader/full/pdd-waste-gas-ril-jn-version3 5/52
PROJECT DESIGN DOCUMENT FORM (CDM PDD) - Version 03.1.
CDM – Executive Board page 5
The trends (Figure 2) analyses the period with and with out FGRS system in coker. These trends indicate
the quantity of gases generated from blowdown system and the impact of FGRS on the quantity of
hydrocarbon being flared.
Sustainable development :Reliance Group is a socially responsible company and has taken following initiatives:
• Educational Initiatives.
o Dhirubhai Ambani Institute of Information and Communication Technology (DA-IICT),
Gandhinagar, India
o Dhirubhai Ambani International School, Mumbai
o Dhirubhai Ambani Foundation Rewards and scholarships
• Healthcare Initiatives
o Sir Hurkisondas Nurrotumdas Hospital and Research Centre (HNHRC), Mumbai and
Dhirubhai Ambani Hospital, Lodhivali, Raigad
• Harmony, an initiative of the Dhirubhai Ambani Memorial Trust, is dedicated to the cause of a
growing population of Senior Citizens
Some of the initiatives taken at RIL- Jamnagar:
• Cattle feed supply to cowsheds; organisation of community meals programmes, safety awareness
programmes; mobile medical van service to surrounding villages, multidiagnostic medical camps and
a village medical center
• Repairing of village roads, supply of drinking water through water tankers on need basis during the
year.
0
10000
20000
30000
40000
50000
60000
70000
80000
9/5/2004 9/10 /2004 9/15 /2004 9/20 /2004 9/25 /2004 9/30 /2004 10/5 /2004 10/10/2004 10/15 /2004 10/20 /2004 10/25 /2004
K g /
d a y
B efore F GR S A fte r F GR S
B l o w d o w n G a s
q u a n t i t y
Ne t Ga s F l a r e d
7/24/2019 PDD Waste Gas RIL JN Version3
http://slidepdf.com/reader/full/pdd-waste-gas-ril-jn-version3 6/52
PROJECT DESIGN DOCUMENT FORM (CDM PDD) - Version 03.1.
CDM – Executive Board page 6
• Support Jamnagar Municipal Corporation and citizens in various community celebrations and
activities.
The four criteria for sustainable development as defined by Host Government are addressed as follows :
Environmental impact : As the project activity reduces the quantity of fuel burnt in the boiler, the
emissions in the form of NOx, SOx and CO2 are reduced. This contributes to the sustainable development
of environment.
Social impact : Direct & Indirect employment has been generated in the plant for the project
implementation & management. Also the simulation studies and interaction with international experts
enhanced the skill sets of manpower.
Economical impact : The project activity reduces fuel consumption in the boilers, thus reducing the
variable cost of production. Though the quantum of savings are negligible as compared to total turnover
of the refinery, directionally the project contributes to economical development.
Technological impact : The project activity is the result of rigorous studies by the project proponent. The
outcome of the studies is the most energy efficient way of operating the unit in which project is
implemented. The project activity was vetted by leading refiner, M/s Shell and the same is now
incorporated in their design. This proves that the project activity is based on sound technology. The
modification detailed in this project can now be implemented in Saturated Gas Concentration Units of
other Crude Distillation Units. Hence, the benefit towards environmental development is anticipated
worldwide through this modification.
A.3. Project participants:
>>
Name of Party involved ((host)
indicates a host Party)
Private and/or public
entity(ies) project participants
(as applicable)
Kindly indicate if the Party
involved wishes to be
considered as project
participant (Yes/No)
India [ (Ministry of Environment
and Forest (MoEF)(Host party)]
Reliance Industries Limited
(Private entity)
No
A.4. Technical description of the project activity:
A.4.1. Location of the project activity:
>>
Reliance Industries Limited
Refinery complex
Jamnagar
A.4.1.1. Host Party(ies):
>>India

7/24/2019 PDD Waste Gas RIL JN Version3
http://slidepdf.com/reader/full/pdd-waste-gas-ril-jn-version3 7/52
PROJECT DESIGN DOCUMENT FORM (CDM PDD) - Version 03.1.
CDM – Executive Board page 7
A.4.1.2. Region/State/Province etc.:
>>
Gujarat state
A.4.1.3. City/Town/Community etc:
>>
Motikhavdi, Taluka Lalpar,P.O. Digvijaygram

7/24/2019 PDD Waste Gas RIL JN Version3
http://slidepdf.com/reader/full/pdd-waste-gas-ril-jn-version3 8/52
PROJECT DESIGN DOCUMENT FORM (CDM PDD) - Version 03.1.
CDM – Executive Board page 8
A.4.1.4. Detail of physical location, including information allowing the
unique identification of this project activity (maximum one page):
>>
N Buildin
Road Rail
CPP
PP
The site is located at latitude 22° 22' N,
longitude 69° 51' E adjacent to the town
of Jamnagar in Gujarat State alongside
the Gulf of Kutch approximately 480
km north of Bombay on India's West
Coast. The refinery site is located just
to the south of the State Highway No.25
to Jamnagar. Total area of this complex
is 7500 acres. Nearest Railway station is
Jamnagar Railway Station & Nearest
Airport is Jamnagar Airport

7/24/2019 PDD Waste Gas RIL JN Version3
http://slidepdf.com/reader/full/pdd-waste-gas-ril-jn-version3 9/52
PROJECT DESIGN DOCUMENT FORM (CDM PDD) - Version 03.1.
CDM – Executive Board page 9
A.4.2. Category(ies) of project activity:
>>
Project activity falls under “Categoty III : Energy Demand” as per Sectoral scopes related approved
methodologies and DOEs.
A.4.3. Technology to be employed by the project activity:
>>
The flare gas recovery system has been developed in house by the engineers of project proponents after
rigorous studies and accurate and systematic monitoring of various process parameters. The is an
excellent example of in-house tailor-made engineering solution for energy conservation. It is based on
good engineering practices. All proven tools of engineering viz, simulations, six sigma approach,
discussions with experts in the field of technology etc. The technology reduces not only the GHG
emission but also other pollutants i.e. SOx, NOx. The heat and gases released through flare normally
causes nuisance for the people staying in vicinity. Recovery of gases has thus contributed towards
environmental and social sustainability.
The modifications carried out in the plant for installation of the systems are explained below :
Measure II : Main Flare Gas Recovery :
The major modifications carried out in the field are:
1) The proposed Flare Gas Recovery system is a skid mounted package involving (All wetted parts shall
be of SS316L-the material should comply with NACE MR 0175 which is suitable for H2S, chlorine
and organic sulphur):
♦ A 20” tap off from the Main Flare header of 84” at downstream of knockout drums and
upstream of liquid seal drums for the suction of Flare gas recovery compressors.
♦ A set of two Liquid ring compressors to compress the flare gas from 1.1 bara to 8.0 bara with
mechanical seal flushing system. A bypass line for 100% recirculation is provided. To meet
the suction pressure requirements of these Compressors, flare gas header pressure needed to
be increased. This necessitated redesigning the water seal drums of the flare system &
revalidating the safety release system of all the operating plants connected with this system.
♦ A shell and tube water condenser to cool the liquid ring (water).
2) A Flare Gas Amine Absorber (distillation unit )

7/24/2019 PDD Waste Gas RIL JN Version3
http://slidepdf.com/reader/full/pdd-waste-gas-ril-jn-version3 10/52
PROJECT DESIGN DOCUMENT FORM (CDM PDD) - Version 03.1.
CDM – Executive Board page 10
Measure-1 LLP flare gas recovery :
Coking operation is a semi batch process, which involves various sequential activities between cokingand decoking cycle. One such activity involves steaming of hydrocarbons from the coke drum to the
blowdown drum for 1.5 hours. The lighter fractions (non condensable) of hydrocarbons are flared (LLP
Flare). In the project activity, The flare gas from the blowdown system is collected at the common flare
knock out drum from where the gases are recovered with the help of ejectors. The ejector system is a
combination of four ejectors of equal capacity in parallel. Medium pressure steam is used as a motive
fluid and the flare gas are compressed to 0.9 Kg/cm2 (g) and is routed to the main fractionator overhead
condenser receiver vessel after cooling. A water seal pot is designed to create a system backpressure of
0.25 Kg/cm2
(g) at 70% level. This system has been functional effectively with its unique control
philosophy to minimize steam consumption. The ejector motive steam is automatically switched on and
off to control the suction pressure of the blowdown gases at the ejector based on the requirement. The
control philosophy takes care of inherent fluctuations in coker automatically and needs no manual
intervention at any point of time.
A.4.4 Estimated amount of emission reductions over the chosen crediting period:
>>
Average Emission reduction is estimated to be 71227 tonnes CO2 e /year. Thus over a crediting period of
ten years, estimated CERs amount to 712270 tonnes CO2 e.
Years Annual estimation of emission reduction
tonnes CO2 e
Nov’2003 – Oct’2004 34642
Nov’2004 – Oct’2005 75292
Nov’2005 – Oct’2006 75292
Nov’2006 – Oct’2007 75292
Nov’2007 – Oct’2008 75292
Nov’2008 – Oct’2009 75292
Nov’2009 – Oct’2010 75292
Nov’2010 – Oct’2011 75292
Nov’2011 – Oct’2012 75292
Nov’2012 – Oct’2013 75292
Total estimated reductions
( tonnes CO2 e )
712270
Total Number of crediting years 10 years
Annual Average over the crediting
period of estimated reductions ( tonnes of
CO2 e )
71227

7/24/2019 PDD Waste Gas RIL JN Version3
http://slidepdf.com/reader/full/pdd-waste-gas-ril-jn-version3 11/52
PROJECT DESIGN DOCUMENT FORM (CDM PDD) - Version 03.1.
CDM – Executive Board page 11
A.4.5. Public funding of the project activity:
>>
No public funding has been sought for the project activity and the project proponent made entire
investment.
SECTION B. Application of a baseline and monitoring methodology
B.1. Title and reference of the approved baseline and monitoring methodology applied to the
project activity:
>>
There are no approved methodologies for energy efficiency improvements. A new baseline methodology
(NM0155) titled ‘Baseline and monitoring methodology for waste gas and / or heat utilization’ is used forestimation of emission reduction.
Version : 03
B.2 Justification of the choice of the methodology and why it is applicable to the project
activity:
>>
The methodology applies to project activities where no fuel switch is done in the process where the waste
heat or the waste gas is produced after the implementation of the project activity.

7/24/2019 PDD Waste Gas RIL JN Version3
http://slidepdf.com/reader/full/pdd-waste-gas-ril-jn-version3 12/52
PROJECT DESIGN DOCUMENT FORM (CDM PDD) - Version 03.1.
CDM – Executive Board page 12
The methodology covers both new and existing facilities.
Criteria Project activity fulfils the criteria
Make use of waste heat or the combustion ofwaste gases in industrial facilities for Electricity
generation, Steam generation, and / or Process
heating
The Project activity involves recovery of the wastegas, which was being flared. The gas is made use
of for power and steam generation in captive
power plant.
that do not involve setting up of new cogeneration
facility to make use of waste gas
The project activity uses waste gas in the existing
equipments and there is no new cogeneration
installation to make use of waste gas
No fuel switch is done in the process where the
waste heat or the waste gas is produced after the
implementation of the project activity
Only that gas which was being flared is used in the
project activity for steam and power generation
and there is no fuel switch in the process where it
is generated.
The methodology covers both new and existing
facilities.
In the project, methodology is applied to the
existing capacity and as mentioned in the
methodology, the capacity enhancement will be
treated as new facility.
The project proponent should be able to demonstrate
that the quantity of waste gas as measured by the
flowmeter is completely utilised for electricity /
steam / process heating application
The project proponent through P&IDs and actual
plant set up can demonstrate that all the waste gas
after flowmeter is utilised for electricity / steam
Thus the methodology is applicable to the project activity.

7/24/2019 PDD Waste Gas RIL JN Version3
http://slidepdf.com/reader/full/pdd-waste-gas-ril-jn-version3 13/52
PROJECT DESIGN DOCUMENT FORM (CDM PDD) - Version 03.1.
CDM – Executive Board page 13
B.3. Description of the sources and gases included in the project boundary
>>
Source Gas Included? Justification / Explanation
CO2 Included Main emission source
CH4 ExcludedCaptive electricity /
steam generation N2O Excluded
Excluded for simplification. This is conservative.
CO2 Included Main emission source
CH4 IncludedWaste gas
N2O Excluded
Excluded for simplification. This is conservative.
CO2 Included May be a main emission source
CH4 ExcludedOnsite fossil fuel
consumption due to
project activity N2O Excluded
Excluded for simplification.
CO2 Included Exception: If waste gas is burned in baseline case and not
vented, the source is excluded.
CH4 Excluded
Combustion of waste
gas for electricity /
steam generation or
process heating
applications N2O Excluded
Excluded for simplification.
CO2 Included Increase in electricity consumption, if any will result in
additional CO2 emission at power plant.
CH4 Excluded
P r o j e c t A c t i v i t y
Combustion of fuel in
CPP/grid for additional
energy required in
project activity N2O Excluded
Excluded for simplification.
Project boundary
Waste gas generation unit
(Coker plant / Hydrogen
plant)
Captive Power plant(Boilers and Gas tubines)
Flare

7/24/2019 PDD Waste Gas RIL JN Version3
http://slidepdf.com/reader/full/pdd-waste-gas-ril-jn-version3 14/52
PROJECT DESIGN DOCUMENT FORM (CDM PDD) - Version 03.1.
CDM – Executive Board page 14
B.4. Description of how the baseline scenario is identified and description of the identified
baseline scenario:
>>
The methodology requires that the alternative baseline scenarios to the CDM project activity are to include
various other sources for power (P), steam (S) and possible use of waste gas (W)
The possible alternatives scenarios in absence of the CDM project activity for electricity are identified as
follows:
Scenario designation Description
P1 Proposed project activity not undertaken as CDM project activity.
P2 Existing captive power generation / cogeneration from other energy source than
waste heat/ gas including renewable energy
P3 New captive power generation / cogeneration using other energy source(s) than
waste heat / gas including renewable energy
P4 Import of power from grid
P5 Continuation of existing practice
The possible alternatives scenarios in absence of the CDM project activity for steam are identified as follows:
Scenario designation Description
S1 Proposed project activity not undertaken as CDM project activity.
S2 Existing captive boiler / cogeneration from other energy source than waste heat/
gas including renewable energy
S3 New captive boiler / cogeneration using other energy source(s) than waste heat /
gas including renewable energy
S4 Use of steam, which is vented in the manufacturing unit, say through heat pump.
S5 Reduction in steam demand by use of other heating medium like electricity
S6 Continuation of existing practice, if not already included in options above

7/24/2019 PDD Waste Gas RIL JN Version3
http://slidepdf.com/reader/full/pdd-waste-gas-ril-jn-version3 15/52
PROJECT DESIGN DOCUMENT FORM (CDM PDD) - Version 03.1.
CDM – Executive Board page 15
The possible alternatives scenarios in absence of the CDM project activity for use of waste gas are identified
as follows:
Scenario designation Description
W1 Waste gas vented without combustion
W2 Waste gas released to atmosphere after combustion
W3 Waste gas sold as product / energy source
W4 Continuation of existing practice, if not already included in options above
Baseline options that do not comply with legal and regulatory requirements and depend on key resources
such as fuels, materials or technology that are not available at the project site are excluded.
P1, S1 : As explained in justification of additionality of the project activity in the section B.3. of this
PDD, project is not possible without CDM.
P2, S2 : Existing CPP can be run with using other fuels than the waste gas, fuel oil, naphtha etc. There is
no prohibitive barrier to use other fuels and flare the waste gas.
P3, S3 : The project activity does not increase the installed capacity of captive power plant but reduced
the steam – power generation from fossil fuels. The CPP is equipped with all the latest technology
machines and the operation of CPP is very reliable. The flexibility and economics due to use of internally
generated fuels favour the generation of steam, power and all other utilities captively rather than
purchasing from outside. The power failure of grid is very common in India and loss of production due to
power disturbances are not affordable for such a large complex. Hence, though there is provision for
using grid power, the complex remains islanded all the time, and imports power only in case of
emergencies. Hence there exist substantial barriers for this alternative and it is hence eliminated
P4, S4, S5 : As explained for P1 & S1, the capacity of the power – steam generation system is not
limiting. The project activity does not increase the capacity as such and hence reduction in power demand
or steam demand through some means can not be the alternative to the project activity.
W1 : waste gas cannot be vented due to safety and environmental concerns.

7/24/2019 PDD Waste Gas RIL JN Version3
http://slidepdf.com/reader/full/pdd-waste-gas-ril-jn-version3 16/52
PROJECT DESIGN DOCUMENT FORM (CDM PDD) - Version 03.1.
CDM – Executive Board page 16
W3 : The waste gas mainly contains hydrogen and hydrocarbons, which are left over after recovering all
the refinery products. Hence there is no possibility to economically extract any product from this gas. The
project proponent has the economics of recovery of hydrogen from waste gas and the same may be
produced to validator.
P5, S6, W4 : The only alternative to the project activity which does not have any prohibitive barrier was
to continue with existing practice i.e. flaring of waste gas and use of other fossil fuels in captive power
plant.
The parameters, data required to establish baseline scenario are given in following table along with source
:
SN Key information / data Data source
aWaste gas low (Flare loss) before
project implementationIP-21 trends
b Net calorific value of waste gasCalculated from composition
of waste gas
c Reliability of grid power supply State grid failure data
Note : IP-21 is the software which fetches data directly from Distributed Control System (DCS) and stores for a
longer period of time than DCS. The data can be analysed in Microsoft Excel through IP-21.
Baseline study completed along with PDD on 17/12/2005.
Name of entity determining baseline : M/s Reliance Industries Limited, who is project proponent. The
contact information is furnished in Annex I

7/24/2019 PDD Waste Gas RIL JN Version3
http://slidepdf.com/reader/full/pdd-waste-gas-ril-jn-version3 17/52
PROJECT DESIGN DOCUMENT FORM (CDM PDD) - Version 03.1.
CDM – Executive Board page 17
B.5. Description of how the anthropogenic emissions of GHG by sources are reduced below
those that would have occurred in the absence of the registered CDM project activity (assessment
and demonstration of additionality): >>
(a) Description of the baseline scenario determined by applying the methodology :
As discussed in Section B.2., the baseline scenario is determined as continuation of existing practice.
In this case, the plant would have consumed more carbon intensive fuel in CPP and continued to burn
the waste gas in flare.
(b) Description of the project activity scenario
In the project activity scenario, the waste gas is recovered and replaces the other fuel consumption in
boilers / Gas turbines of CPP.
(c) Analysis showing why the emissions in the baseline scenario would likely exceed emissions in the
project activity scenario.
The comparison of CO2 emission from various sources within project boundary are shown in the
following diagram. The reduction in green house gas emission is in flare and in the boilers and gas
turbines in CPP in terms of CO2, CH4 and N2O. However, for calculation purpose, only CO2 is
considered for simplicity. This is conservative approach.
As per the decision 17/cp.7 para 43, a CDM project activity is additional if anthropogenic
emissions of greenhouse gases by sources are reduced below those that would have occurred in
Reduced
CO2
Flare
Gas Turbine
in CPP
CO2
CO2
Fossil fuel
(Naphtha)
Boilers in
CPP
Fossil fuel
(Fuel oil)
CO2
Waste gas
(H2 & CH4 rich)
Flare
Gas Turbinein CPP
No CO2 by
waste gas used
in ro ect
Fossil fuel
(Naphtha)
Boilers in
CPP
Fossil fuel
(Fuel oil)
Reduced
CO2
Waste gas
(H2 & CH4 rich)
CO2
CO2
Baseline Project activity

7/24/2019 PDD Waste Gas RIL JN Version3
http://slidepdf.com/reader/full/pdd-waste-gas-ril-jn-version3 18/52
PROJECT DESIGN DOCUMENT FORM (CDM PDD) - Version 03.1.
CDM – Executive Board page 18
the absence of the registered CDM project activity. Following steps of additionality test are
followed for demonstration of additionality:
Steps Additionality Requirements Status of
Additionality Check
Step 0: Preliminary
screening based on
the starting date of
the project activity
The proposals for the two measures in project were
submitted for management approval on 02/12/2002 and
08.01.2000. However, considering the risk and
uncertainties involved in the project implementation, the
decision to implement the project was delayed. Both the
projects were approved in Mar’03 when revised
proposal giving due consideration to monetary as well asintangible benefits of CDM were addressed.
The projects were implemented in November 2003 and
October 2004 respectively.
The additionality check
has crossed Step 0, and
may proceed to Step 1.
Step 1: Identification of alternatives to the project activity consistent with
current laws and regulations
Status of
Additionality Check
Sub-step (1a):
Define Alternatives
to the project
activity
Following alternatives are identified :
1. The proposed project activity is not undertaken
as a CDM project activity.
2. Without project activity the additional energy
Import for electricity could be achieved from the
grid
3. Existing or new captive power, steam, process
heat generation on-site, using other energy
sources than waste heat and/or gas, such as coal,
diesel, natural gas, hydro, wind, etc;
4. Other uses of the waste gas which depending on
the quality & quantity of the waste gas and the
technology suitability considering the
operational parameter. But in case of the project
proponent the only alternative was the project,
hence the waste gas would have been continuing
to flare if not recovered.
5. The continuation of the current situation
The additionality check
has crossed Step 1, and
may proceed to either
Step 2 (Investment
Analysis) followed by
Step 3 (Barrier
Analysis), or directly to
Step 3.
In this PDD, Step 3 has
been used for
additionality check.

7/24/2019 PDD Waste Gas RIL JN Version3
http://slidepdf.com/reader/full/pdd-waste-gas-ril-jn-version3 19/52
PROJECT DESIGN DOCUMENT FORM (CDM PDD) - Version 03.1.
CDM – Executive Board page 19
Steps Additionality Requirements Status of
Additionality Check
Sub-step (1b):
Enforcement of
applicable laws and
regulations
There is no mandatory requirement for Reliance
Industries limited, Jamnagar, under all applicable laws
to implement the energy efficiency project such as this
project activity.
Step 3. Barrier analysis
Sub-step 3a. Identify
barriers that would
prevent the
implementation of
type of the proposed
project activity
Sub-step 3b. Show
that the identified
barriers would not
prevent the
implementation of at
least one of the
alternatives (except
the proposed project
activity)
Reliance Industries Limited is actively participating in
efforts towards Green House Gases emission reduction.
The company has contributed to sustainable
development initiatives of the country through various
boards, advisory committees. The backup papers can be
furnished to the validator, if so desired.
The project activity overcomes “technological barriers”
as well as “barriers due to prevailing practice”, as
described below.
• Technological Barriers:
Flare gas recovery can be described as the sewage
system of a refinery or gas recovery at a production
sight. It is normally considered waste gas due to the
composition of the gas. Since these are undesirable
gases of different composition pressure, quality,
quantity, etc, these gases are generally sent to flare to be
burned off as it is a very complex to identify each and
every outlet further study and recovery. The commonly
identified Imbalance of flare gas due to :
1. Reduced demand
2. Reduced load of one / more units
The additionality check
has crossed Step 3, and
may proceed to Step 4.

7/24/2019 PDD Waste Gas RIL JN Version3
http://slidepdf.com/reader/full/pdd-waste-gas-ril-jn-version3 20/52
PROJECT DESIGN DOCUMENT FORM (CDM PDD) - Version 03.1.
CDM – Executive Board page 20
Steps Additionality Requirements Status of
Additionality Check
3. Sudden shutdown of one / more units4. Relief valve malfunction
5. Intermittent minor venting from:
Sight glasses
Compressor bottles
Sampling systems
Pump or compressor vents
The flare is an essential safety system, used for safe
disposal of flows from pressure safety valves and
depressurization of processing equipment. The flare gas
recovery system must not compromise this capability
The system must be able to open quickly, before the
pressure rises and reaches a predetermined level.
The reliability must satisfy the security standards of
the project.
The gas recovery system must be simple and reliable.
The project proponent has sourced technology form the
world’s leading technology provider, and by design
itself, the refinery is energy efficient. To carry out
something for further improvement in energy efficiency
requires conscious and innovative efforts. The project
proponent is always putting in such effort to reduce
Green House Gas emissions and contribute to
environmental sustainability. Systematic monitoring and
study has resulted into the identification of the project
activity.
The project proponent had identified following methods
to reduce flare loss.
1. Review the conditions in process equipments to
minimize flare control valve openings.
2. Identify leaky valves continuously and fix them
3. Install a flare gas recovery system.

7/24/2019 PDD Waste Gas RIL JN Version3
http://slidepdf.com/reader/full/pdd-waste-gas-ril-jn-version3 21/52
PROJECT DESIGN DOCUMENT FORM (CDM PDD) - Version 03.1.
CDM – Executive Board page 21
Steps Additionality Requirements Status of
Additionality Check
Project proponent, having worked on first two methodsand minimizing the flare loss, it became apparent that
further reduction of flare loss is only possible by going
for a suitable and well-designed flare gas recovery
system. The flare gas recovery system is known to be
operative in some refineries internationally, while not
working properly at some other places.
Following potential risks due to implementation of
project activity are identified :
• The successful recovery of flare depend on accurate
flare load estimation any error or technical
inaccuracy will may the investment worthless. The
flare system is a key safety system, unique in that it
cannot be accessed for maintenance at any time
other than complete shutdown and degassing of the
entire process facility. Failure of components within
the flare system will at best cause safety concern,
and at worst ensure an unexpected facility
shutdown. If uncorrected, damage to the flare
system can impact operational integrity of the
process facility. The major cause of component
failure on the flare system is low flow rate flaring
when the flame wafts about in the breeze impinging
directly on the flare tip itself, the pilots and any
other equipment on the flare deck. The cost of
retrofit on existing facilities often draws into
question the benefit of full zero flare solutions. The
technological risk was mitigated by deputing an
international consultant to review the technical
aspects of the projects and with proper engineering
and simulations. This explains the major risk of non-
operability of the project in case of faulty design.

7/24/2019 PDD Waste Gas RIL JN Version3
http://slidepdf.com/reader/full/pdd-waste-gas-ril-jn-version3 22/52
PROJECT DESIGN DOCUMENT FORM (CDM PDD) - Version 03.1.
CDM – Executive Board page 22
Steps Additionality Requirements Status of
Additionality Check
The risk involved in use of waste gas in CPP was
significant. The performance of the gas turbines with
waste gas as fuel was prime concern. There was no
previous experience with project proponent of using
hydrogen rich gas in gas turbines. The risk was
mitigated by consultation with the machine suppliers.
• Safety risks are risk of project not synchronising
with the prevailing process during the time of
commissioning of the project. Risk in future due to
malfunctioning of modified system under abnormal
conditions or malfunctioning of the equipments
installed within the modification for which the
system is not tested before.
• The material of construction is for equipments &
piping is designed to resist wet H2S service which
will mitigate risk of material decay.
Measure I : Main Flare Gas Recovery
Main Flare System at Jamnagar Refinery Complex,
consisting of High Pressure (HP) and Low Pressure (LP)
flare headers, is a very large network consisting of all
the process units and offsite areas. Approximately 2000
points are connected to Main Flare System. Moreover, at
present all process units are running at their peak
capacityThe system comprises for installation of Liquid ring
Compressor, Amine Absorber, Flare header,
modifications in seal drum and control Instruments
The identified operational risks of the project activity
are :
• Liquid ring Compressor is the heart of the flaring
system failure will stop the complete project. This

7/24/2019 PDD Waste Gas RIL JN Version3
http://slidepdf.com/reader/full/pdd-waste-gas-ril-jn-version3 23/52
PROJECT DESIGN DOCUMENT FORM (CDM PDD) - Version 03.1.
CDM – Executive Board page 23
Steps Additionality Requirements Status of
Additionality Check
compressor needs special maintenance unlike othervacuum pumps, troubleshooting them is critical to
their continued operation and maintenance. As a
result, it is important that only qualified personnel,
using proper equipment, be authorized to perform
testing, possibility of leakage in tubes of the liquid
ring cooler of the liquid ring compressor due to
corrosion is expected. Malfunction of the vacuum
system could be due to utility or process conditions,
or both, or the equipment, and it is important to
determine the cause. A malfunction due to external
influences can be determined as follows:
- Reduced capacity of pump due to Seal water
temperature higher than design or Low seal water
flow rate
- Excessive noise due to Excessive or insufficient
seal liquid to pump or Coupling misalignment.
- High power consumption due to Excessive seal
liquid Coupling, misalignment, Excessive
discharge pressure, Defective bearing, Gland ring
too tight, Improperly mounted pump.
- Vibration due to Coupling misalignment, Pump or
motor not properly anchored, Rotor imbalance,
Improperly mounted pump.
- Pump shaft is seized and will not turn due to Scale
from hard water, Foreign object in pump,
Improperly mounted pump.
• In case of failure of Amine Absorber output H2S will
directly go into the fuel gas network as the flare gas
is high H2S content, and the network is not designed
for the same. This will have adverse effect on the life
of the network system and reduce the life.

7/24/2019 PDD Waste Gas RIL JN Version3
http://slidepdf.com/reader/full/pdd-waste-gas-ril-jn-version3 24/52
PROJECT DESIGN DOCUMENT FORM (CDM PDD) - Version 03.1.
CDM – Executive Board page 24
Steps Additionality Requirements Status of
Additionality Check
• In case of failure in the Flare Gas Header controlsystem there is possibility of explosion, for safe
operation of FGRS it is mandatory to eliminate the
possibility of air being sucked into the flare gas
system, since the composition is not only of
hydrocarbons and hydrogen sulphide but also of
hydrogen, which when mixed with air can be highly
explosive.
• The Seal Drum modification was carried out
necessary to have a bandwidth for pressure control of
the flare gas recovery system which was a difficult
task because of ongoing operation.
In case of failure in the purging system there is a
possibility of fire hence to avoid a major hazard with an
elevated flare (i.e., possible flash back of the flame into
the stack) modifications were carried out as stack be
continuously purged with fuel gas or inert gas (N2) to
prevent ingress of air. There may be a back flow of
purge gas, if purging is done from the original location.
Since there is a proposal for seal height increase, the
flow may not be able to break the seal height and hence,
would go back to KOD. Therefore, flare stack starves of
required purge, which is unsafe. Therefore, it is now
proposed to change the purging location from upstream
of the seal drum to downstream.
Over and above the control system is the key success to
the project as approximately 2000 points are connected
to Main Flare System incase of any change in process
parameters or the malfunction of the control system will

7/24/2019 PDD Waste Gas RIL JN Version3
http://slidepdf.com/reader/full/pdd-waste-gas-ril-jn-version3 25/52
PROJECT DESIGN DOCUMENT FORM (CDM PDD) - Version 03.1.
CDM – Executive Board page 25
Steps Additionality Requirements Status of
Additionality Check
be down, Hence project proponent has deployed skilledmanpower and sufficient inventory to mitigate the same
risk.
Measure II : Low Low Pressure (LLP) Flare gas
Recovery
The process is to recover vapors from the Coker Blow
down Settling Drums and recycle back to fractionators
overhead overhead drum. Presently, the vapor generated
from the Coker blow down settling drums is routed to
LLP flare header and flared.
The system comprises for installation of Blow down
Vent gas Single stage ejectors, Surface condensers,
knock out drum and control Instruments
The identified operational risks of the project activity
are :
1. The main problem an ejector is likely to experience
during operation is reduced capacity because of
worn parts. The sources of wear are the moving
fluids including:
• Motive fluid which enters the nozzle
• Suction fluid which is entrained in the suction
head
• Discharge fluid which is a mixture of the motive
fluid and the suction fluids
Steam is the fluid of choice for most vacuum
applications. Any moisture in the motive steam will
eventually affect the performance of the jet. The
high velocity wet steam will erode the metal in a
process known as wiredrawing.

7/24/2019 PDD Waste Gas RIL JN Version3
http://slidepdf.com/reader/full/pdd-waste-gas-ril-jn-version3 26/52
PROJECT DESIGN DOCUMENT FORM (CDM PDD) - Version 03.1.
CDM – Executive Board page 26
Steps Additionality Requirements Status of
Additionality Check
2. In case of failure in the condenser, there is possibilityof entry of hydrocarbons in cooling water. This was
the perceived safety concern. There is possibility of
leaking of the tubes due to under deposit corrosion
problem at the dead zone / low velocity zone of the
ejector after condenser. This will result in ingress of
cooloing water in sour water due to this the soar
water quantity will increase and high amount of Cl
in sour water may disturb the Crude unit operation /
may increase corrosion in Crude unit as this water is
treated in Sour water stripping unit and then used as
desalter make up water. Further if there is leakage in
the tube the H2S will mix with cooling water which
goes to cooling tower the piping and the equipments
is not design to handle H2S this may reduce life of
the Cooling water system.
3. There is a wide variation in the molecular weight and
density of the gas to be recovered which has being
mitigated by complicated control Instruments any
malfunctioning of the same may impact the success
of the project.
4. Integration and control of a flare gas recovery unit is
of critical importance. For example, care must be
exercised in the design of the recovery system to prevent application of a vacuum to the vapor header
that might draw in air and create a flammable
mixture in either the flare header or the fuel gas
system.
From the above it could be observed that Reliance
being in the Indian scenario has achieved a
appreciable goal of being third larges refinery of the
world. This itself is a remarkable achievement for a

7/24/2019 PDD Waste Gas RIL JN Version3
http://slidepdf.com/reader/full/pdd-waste-gas-ril-jn-version3 27/52
PROJECT DESIGN DOCUMENT FORM (CDM PDD) - Version 03.1.
CDM – Executive Board page 27
Steps Additionality Requirements Status of
Additionality Check
privet company in a developing country. Projectproponent has taken substantial effort and risk to
develop and implement the project activity compared
to Indian industries and expertise to develop and
modify a renowned technology at own cost & risk .
Following problem was overcome to complete the
CDM project.
• Unavailability of skill set required to identify / design
/ implement the potential energy saving opportunity
in the process plant.
• Skilled and/or properly trained labour to operate and
maintain the technology is not available, leading to
financial losses due to failure of equipment and
process control
• Inadequate information sharing within the industries
thus managers are not aware of the energy efficiency
measures implemented at similar facilities within the
country.
• Technology transfer barriers, such as lack of modern
equipment on local markets.
• Perceived technical and financial risks to enterprises
in adopting innovative energy saving technologies
(fears that a new technology may not work, couldinterrupt production, take time to perfect, or will not
actually result in financial savings, which inhibit
enterprise management from adopting new energy-
saving technologies).
• Barriers due to prevailing practice, e.g.:Developers
lack familiarity with state-of-the-art technologies and
are reluctant to use them;
• The project is the “first of a kind” and hence the

7/24/2019 PDD Waste Gas RIL JN Version3
http://slidepdf.com/reader/full/pdd-waste-gas-ril-jn-version3 28/52
PROJECT DESIGN DOCUMENT FORM (CDM PDD) - Version 03.1.
CDM – Executive Board page 28
Steps Additionality Requirements Status of
Additionality Check
project proponent does not have any past experienceof operation of the project and risks involved in
implementation of the project.
• Barriers due to prevailing practice:
In India, as per the prevailing practice, any major
modification in process, is undertaken only on the
recommendation of technology supplier/licensor. It
is also not a common practice in Indian industries to
carry out such major modifications in the process on
ground of energy conservation alone. Reliance
Industries Limited has been participating in the
National Energy Conservation Awards competition
constituted by Ministry of Power, Government of
India and has received the award every year. The
performance of the company in the area of energy
conservation has been appreciated by various
agencies in India including Confederation of Indian
Industries (CII), Bureau of Energy Efficiency etc
from time to time.
It is learnt through interaction, at different forums,
with representatives from leading companies in the
country and also with the experts in the field of
energy conservation that flare gas recovery is not a
common practice in India.
The Shell Benchmarking study of CE&L shows that
Reliance Refinery is the most energy efficient of all
leading refiners across world. Major contributor to
Energy and loss in refinery is the flaring. Hence
lowest CE&L index is because of near zero flaring

7/24/2019 PDD Waste Gas RIL JN Version3
http://slidepdf.com/reader/full/pdd-waste-gas-ril-jn-version3 29/52
PROJECT DESIGN DOCUMENT FORM (CDM PDD) - Version 03.1.
CDM – Executive Board page 29
Steps Additionality Requirements Status of
Additionality Check
of Jamnagar Refinery. Also the Energy IntensityIndex for our refinery in Soloman Benchmarking is
the lowest in the class.
The barriers in use of technology and its non-prevalence
as identified above, do not exist for the alternative i.e.
continuing with existing scenario
Step 4. Common practice analysis
Sub-step 4a. Analyze
other activities
similar to the
proposed project
activity.
Sub-step 4b. Discuss
any similar options
that are occurring.
As mentioned above under Step 3, it is not a
common practice in refineries in India to take
initiatives in big way towards energy conservation.
The innovativeness of the project is appreciable and
extraordinary. Huge flare is a common feature of
refineries in India. The flare loss in Jamnagar
refinery is less than one tenth of the normal flare loss
in refineries in India. Hence it is not a common
practice to undertake in Indian industries. Lack of
awareness and adequate knowledge form the prime
barriers to this.
The additionality check
has crossed Step 4, and
may proceed to Step 5.
Step 5. Impact of
CDM registration
The approval and registration of the project activity as a
CDM activity would result inter alias in the following
benefits:
Reduction in GHG emissions ;
Encourage other refinery industries in India and
abroad to initiate such measures for energy
conservation;
Since Step 5 is
satisfied, the project
activity is not a
baseline scenario, and
hence is additional.

7/24/2019 PDD Waste Gas RIL JN Version3
http://slidepdf.com/reader/full/pdd-waste-gas-ril-jn-version3 30/52
PROJECT DESIGN DOCUMENT FORM (CDM PDD) - Version 03.1.
CDM – Executive Board page 30
Steps Additionality Requirements Status of
Additionality Check
Publicity of the efforts taken by the project
proponent towards energy efficiency and hence
sustainable development; and
The social status of the company would be enhanced

7/24/2019 PDD Waste Gas RIL JN Version3
http://slidepdf.com/reader/full/pdd-waste-gas-ril-jn-version3 31/52
PROJECT DESIGN DOCUMENT FORM (CDM PDD) - Version 03.1.
CDM – Executive Board page 31
B.6. Emission reductions:
B.6.1. Explanation of methodological choices:
>>
This methodology applies to project activities that make use of waste heat or the combustion of waste
gases in industrial facilities for either or all of following applications :
• Electricity generation, thus reducing fossil fuel consumption in captive or grid power generation
• Steam generation, thus reducing fossil fuel consumption in the boiler(s)
• Process heating, thus reducing fossil fuel consumption either in process furnaces or in boilers
owing to reduced steam consumption for process heating
The methodology applies to project activities where no fuel switch is done in the process where the waste
heat or the waste gas is produced after the implementation of the project activity
The project activity involves use of waste gas which otherwise would have flared, for generation of
power and steam. There is no fuel switch over done in the process where waste has is produced, i.e. coker
and hydrogen units of refinery.
The project reduces fossil fuel consumption, namely naphtha for electricity generation and fuel oil for
steam generation in boilers. Thus the relevant sections of the methodology is applied to the project
activity.

7/24/2019 PDD Waste Gas RIL JN Version3
http://slidepdf.com/reader/full/pdd-waste-gas-ril-jn-version3 32/52
PROJECT DESIGN DOCUMENT FORM (CDM PDD) - Version 03.1.
CDM – Executive Board page 32
B.6.2. Data and parameters that are available at validation:
(Copy this table for each data and parameter)
PROJECT CONSTANTSMeasure I :
ID Number PC-1
Parameter NCVi
Data unit TJ/1000t
Description Net Calorific value of fuels for power
Source of data IPCC default
Value applied 45.01
Justification of the choice of data or
description of measurement methods
and procedures actually applied
IPCC default factor of naphtha is used.
Any comment --
ID Number PC-2
Parameter OXIDi
Data unit Fraction
Description Oxidation factor of naphtha
Source of data 1996 Revised IPCC Guidelines (p. 1.29)
Value applied 0.99
Justification of the choice of data or
description of measurement methods
and procedures actually applied
NA
Any comment --
Measure II :
ID Number PC-1
Parameter NCVi
Data unit TJ/1000t
Description Net Calorific value of fuels for steam generation
Source of data IPCC default
Value applied 40.19
Justification of the choice of data or
description of measurement methodsand procedures actually applied
IPCC default factor for fuel oil s used
Any comment --
ID Number PC-2
Parameter OXIDi
Data unit %
Description Oxidation factor of fuel oil
Source of data 1996 Revised IPCC Guidelines (p. 1.29)
Value applied 0.99
Justification of the choice of data or
description of measurement methodsand procedures actually applied
NA

7/24/2019 PDD Waste Gas RIL JN Version3
http://slidepdf.com/reader/full/pdd-waste-gas-ril-jn-version3 33/52
PROJECT DESIGN DOCUMENT FORM (CDM PDD) - Version 03.1.
CDM – Executive Board page 33
Any comment --
ID Number PC-3Parameter Hs
Data unit TJ/t
Description Enthalpy of steam
Source of data To be calculated from the steam temperature and pressure,
which are available in DCS
Value applied 0.0027
Justification of the choice of data or
description of measurement methods
and procedures actually applied
NA
Any comment Data to be archived for crediting period + 2 yrs
Constants for Baseline monitoring
Measure I :
ID Number BC-1
Parameter NCVwE
Data unit Kcal/kg
Description Net Calorific Value of waste gases used for electricity
generation
Source of data Determined from laboratory analysis of gas
Value applied 9750
Justification of the choice of data or
description of measurement methods and
procedures actually applied
Daily composition is available and average is used.
Any comment --
Measure II :
ID Number BC-2
Parameter NCVws
Data unit Kcal/kg
Description Net calorific value of waste gas used for steam generation
Source of data Determined from laboratory analysis of waste gas
Value applied 11209Justification of the choice of data or
description of measurement methods and
procedures actually applied
Daily analysis of the gas is available and average is used.
Any comment --

7/24/2019 PDD Waste Gas RIL JN Version3
http://slidepdf.com/reader/full/pdd-waste-gas-ril-jn-version3 34/52
PROJECT DESIGN DOCUMENT FORM (CDM PDD) - Version 03.1.
CDM – Executive Board page 34
B.6.3 Ex-ante calculation of emission reductions:
>>
a. Emission due to auxiliary fuels : Not applicable
b. Due to additional power or steam load due to project activity
For Measure I :
PE1y = E p x x (EFEcaptive)
= 3110 x x 72
= 806
For Measure II :
Efficiency of boiler is estimated by direct method.
PE1y = S p x x EFs
= 30240 x (0.0027 / 0.92) x 75.4
= 16428
PE1y Project emission due to increased electrical load in Measure I (t CO2/TJ)
PE2y Project emission due to increased steam load in Measure II (t CO2/TJ)
EP Additional electricity consumption due to project activity (MWh/year)Sp Additional steam consumption due to project activity (t/hr)
Hs Enthalpy of steam (TJ/t)
η b Boiler efficiency (Fraction).
EFsteam Weighted average Emission factor for fuels used in boiler (tCO2/TJ)
EFEcaptive Weighted average emission factor for captive power (tCO2/TJ)
Total project emission PE = PEEy + PEsy
= 17234
Energy equivalent of waste gas used for power generation (TJ/year)
Baseline emission for electricity generated at CPP
BE1 = x (η1project / η1baseline)
= 11287 x 0.041 x 76.6 x 1
= 35448
Where
BE1 Baseline emission for electricity generated at captive power plant (t CO2/year)
Qw1 Waste gas used for measure I (t or m3/year)
Hs
η b
3.6
1000
Qw1 x NCVw1 x EF1
3.6
1000

7/24/2019 PDD Waste Gas RIL JN Version3
http://slidepdf.com/reader/full/pdd-waste-gas-ril-jn-version3 35/52
PROJECT DESIGN DOCUMENT FORM (CDM PDD) - Version 03.1.
CDM – Executive Board page 35
NCVw1 Net Calorific Value of waste gas used for Measure I. Weighted average value is
considered if multiple waste gases are utilised (TJ/t or TJ/m3)
EF1 Emission factor for fuel displaced by waste gas in Measure I (t CO2/TJ)
η1project Energy efficiency of electricity generation in project case for Measure I (fraction)η1baseline Energy efficiency of electricity generation in baseline case for Measure I(fraction)
Baseline emission for Measure II :
BE2 = Qw2 x NCVw2 x EFs x (η2project / η2baseline)
= 15896 x 0.047 x 75.4 x 1
= 57078
Where
BE2 Baseline emission for Measure II (t CO2/year)
Qw2 Quantity of waste gas utilised for Measure II (t or m3 per year)
NCVws Net calorific value of waste gas used for Measure II. Weighted average value is taken
in case of multiple waste gases (TJ/t or m3)
EF2 Emission factor for the fuel displaced by waste gas for Measure II (t CO2/TJ)
η2project Energy efficiency of boiler in project case in Measure II(fraction)
η2baseline Energy efficiency of boiler in baseline case for Measure II (fraction)
Total Baseline emission BE = BE1 + BE2
= 92526
ER y = BEy - PEy
= 75292
ER y emissions reductions of the project activity during the year t in tons of CO2
BEy baseline emissions due to displacement of electricity during the year y in tons of CO2
PEy project emissions during the year y in tons of CO2
7/24/2019 PDD Waste Gas RIL JN Version3
http://slidepdf.com/reader/full/pdd-waste-gas-ril-jn-version3 36/52
PROJECT DESIGN DOCUMENT FORM (CDM PDD) - Version 03.1.
CDM – Executive Board page 36
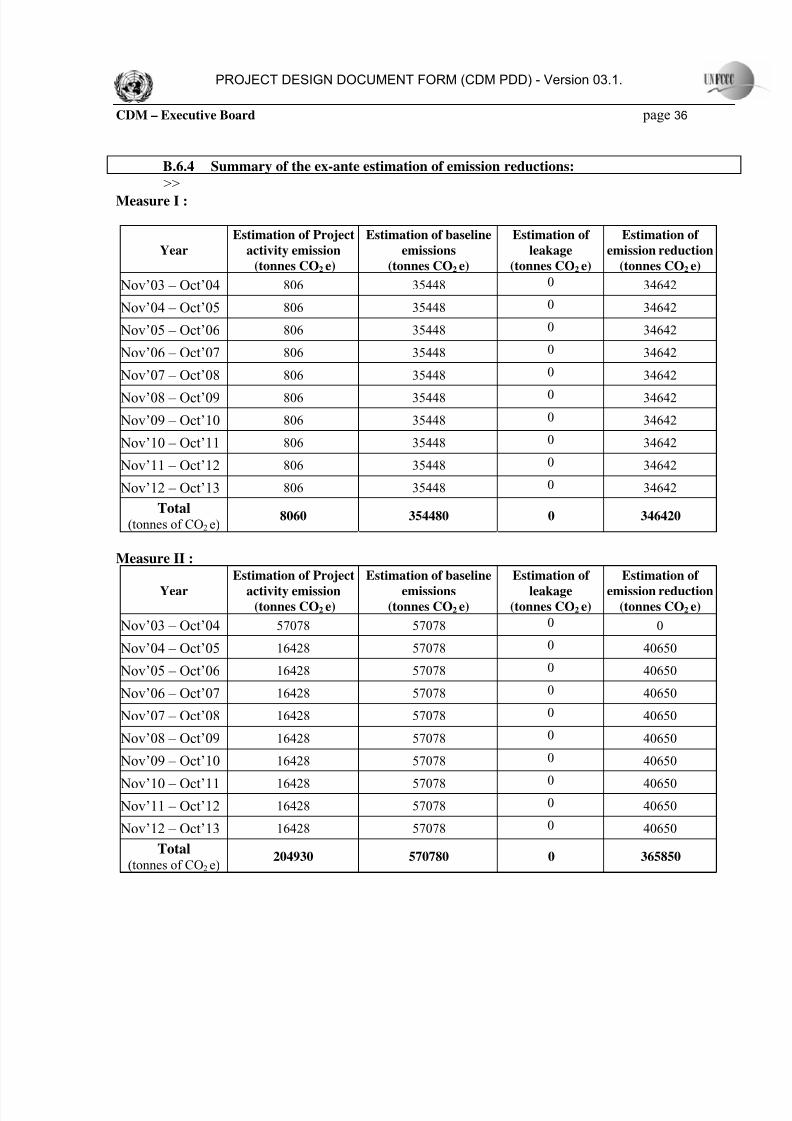
B.6.4 Summary of the ex-ante estimation of emission reductions:
>>
Measure I :
Year
Estimation of Project
activity emission
(tonnes CO2 e)
Estimation of baseline
emissions
(tonnes CO2 e)
Estimation of
leakage
(tonnes CO2 e)
Estimation of
emission reduction
(tonnes CO2 e)
Nov’03 – Oct’04 806 35448 0 34642
Nov’04 – Oct’05 806 35448 0 34642
Nov’05 – Oct’06 806 35448 0 34642
Nov’06 – Oct’07 806 35448 0 34642
Nov’07 – Oct’08 806 35448 0 34642
Nov’08 – Oct’09 806 35448 0 34642
Nov’09 – Oct’10 806 35448 0 34642
Nov’10 – Oct’11 806 35448 0 34642
Nov’11 – Oct’12 806 35448 0 34642
Nov’12 – Oct’13 806 35448 0 34642
Total(tonnes of CO2 e)
8060 354480 0 346420
Measure II :
Year
Estimation of Project
activity emission(tonnes CO2 e)
Estimation of baseline
emissions(tonnes CO2 e)
Estimation of
leakage(tonnes CO2 e)
Estimation of
emission reduction(tonnes CO2 e)
Nov’03 – Oct’04 57078 57078 0 0
Nov’04 – Oct’05 16428 57078 0 40650
Nov’05 – Oct’06 16428 57078 0 40650
Nov’06 – Oct’07 16428 57078 0 40650
Nov’07 – Oct’08 16428 57078 0 40650
Nov’08 – Oct’09 16428 57078 0 40650
Nov’09 – Oct’10 16428 57078 0 40650
Nov’10 – Oct’11 16428 57078 0 40650
Nov’11 – Oct’12 16428 57078 0 40650
Nov’12 – Oct’13 16428 57078 0 40650
Total(tonnes of CO2 e)
204930 570780 0 365850

7/24/2019 PDD Waste Gas RIL JN Version3
http://slidepdf.com/reader/full/pdd-waste-gas-ril-jn-version3 37/52
PROJECT DESIGN DOCUMENT FORM (CDM PDD) - Version 03.1.
CDM – Executive Board page 37
For complete project :
YearEstimation of Project
activity emission
(tonnes CO2 e)
Estimation of baselineemissions
(tonnes CO2 e)
Estimation ofleakage
(tonnes CO2 e)
Estimation ofemission reduction
(tonnes CO2 e)
Nov’03 – Oct’04 57884 92526 0 34642
Nov’04 – Oct’05 17234 92526 0 75292
Nov’05 – Oct’06 17234 92526 0 75292
Nov’06 – Oct’07 17234 92526 0 75292
Nov’07 – Oct’08 17234 92526 0 75292
Nov’08 – Oct’09 17234 92526 0 75292
Nov’09 – Oct’10 17234 92526 0 75292
Nov’10 – Oct’11 17234 92526 0 75292
Nov’11 – Oct’12 17234 92526 0 75292
Nov’12 – Oct’13 17234 92526 0 75292
Total(tonnes of CO2 e)
212990 925260 0 712270
B.7 Application of the monitoring methodology and description of the monitoring plan:
Proposed New Monitoring methodology for waste gas and/or heat utilization
This methodology applies to project activities that make use of waste heat or the combustion of waste
gases in industrial facilities for either or all of following applications :
• Electricity generation, thus reducing fossil fuel consumption in captive or grid power generation
• Steam generation, thus reducing fossil fuel consumption in the boiler(s)
• Process heating, thus reducing fossil fuel consumption either in process furnaces or in boilers
owing to reduced steam consumption for process heating
The methodology applies to project activities where no fuel switch is done in the process where the waste
heat or the waste gas is produced after the implementation of the project activity
The project activity involves use of waste gas which otherwise would have flared, for generation of
power and steam. There is no fuel switch over fone in the process where waste has is produced, i.e. coker
and hydrogen units of refinery.
Proposed baseline methodology “Baseline methodology for waste gas and / or heat utilisation is
applicable to the project activity as discussed in Section B.1.1 of PDD, hence this monitoring
methodology can to be used.

7/24/2019 PDD Waste Gas RIL JN Version3
http://slidepdf.com/reader/full/pdd-waste-gas-ril-jn-version3 38/52
PROJECT DESIGN DOCUMENT FORM (CDM PDD) - Version 03.1.
CDM – Executive Board page 38
B.7.1 Data and parameters monitored:
(Copy this table for each data and parameter)
Project monitoring :
(a) Project activity emissions parameters
Data/Parameter Qi
Data unit t or m3 per hour
Description Quantity of auxiliary fuel
Source of data Flowmeter / design values
Measurement
procedures (if any)
Will be monitored in flowmeter and DCS or from equipment specifications
Monitoring
frequency
Continuously
QA/QC procedures Data to be archived for 2 years following the end of the crediting period.
Any comment --
Data/Parameter EFi
Data unit TJ/1000t
Description Emission factor for auxiliary fuel
Source of data IPCC default or calculated based on composition.
Measurement
procedures (if any)
If EF is calculated, composition to be determined with calibrated instruments
based on international standard.
Monitoring
frequency
Once for IPCC default. If calculated based on composition, the composition to be
monitored on monthly basis and EF to be calculated annually.QA/QC procedures Data to be archived for 2 years following the end of the crediting period.
Any comment --
Data/Parameter E py
Data unit MWh/yr
Description Additional electricity consumption due to project activity
Source of data DCS / handheld meter / equipment specifications
Measurement
procedures (if any)
Measured by energy meter or by handheld meter.
Monitoring
frequency
Online if DCS / measured monthly / Once if specifications are used.
QA/QC procedures Data to be archived for crediting period + 2 yrs. Source of data is Specification
sheets, hence no QA/QC procedure required.
Any comment --

7/24/2019 PDD Waste Gas RIL JN Version3
http://slidepdf.com/reader/full/pdd-waste-gas-ril-jn-version3 39/52
PROJECT DESIGN DOCUMENT FORM (CDM PDD) - Version 03.1.
CDM – Executive Board page 39
Data/Parameter S py
Data unit tDescription Additional steam consumption due to project activity
Source of data DCS / equipment specifications
Measurement
procedures (if any)
Measured by energy meter or by handheld meter.
Monitoring
frequency
Online if DCS / measured monthly / Once if specifications are used.
QA/QC procedures Data to be archived for crediting period + 2 yrs. Source of data is Specification
sheets, hence no QA/QC procedure required.
Any comment --
Data/Parameter EFsteam Data unit t CO2/TJ
Description Weighted average emission factor for fuels used in boiler
Source of data IPCC default or calculated based on composition
Measurement
procedures (if any)
If EF is calculated, composition to be determined with calibrated instruments
based on international standard.
Monitoring
frequency
Once for IPCC default. If calculated based on composition, the composition to be
monitored on monthly basis and EF to be calculated annually
QA/QC procedures Default factors. No QA/QC procedure required. If calculated, data to be archived
for crediting period + 2 yrs
Any comment --
Data/Parameter EFEcaptive
Data unit T CO2/ MWh
Description Weighted average emission factor for captive power
Source of data IPCC default or calculated based on composition
Measurement
procedures (if any)
If EF is calculated, composition to be determined with calibrated instruments
based on international standard.
Monitoring
frequency
Once for IPCC default. If calculated based on composition, the composition to be
monitored on monthly basis and EF to be calculated annually
QA/QC procedures Data to be archived for crediting period + 2 yrs.
Any comment Weighted average value to be taken in case of multiple fuels
(b) Baseline emissions parameters
Data/Parameter Qw1
Data unit T or m3
Description Waste gas used for Measure I
Source of data Flowmeter
Measurement
procedures (if any)
DCS / local flowmeter indication
Monitoring
frequency
Online / daily
QA/QC procedures DCS data. Measuring instruments being calibrated and maintained as per ISO
procedures. QA/QC procedures included in ISO documentation and audited

7/24/2019 PDD Waste Gas RIL JN Version3
http://slidepdf.com/reader/full/pdd-waste-gas-ril-jn-version3 40/52
PROJECT DESIGN DOCUMENT FORM (CDM PDD) - Version 03.1.
CDM – Executive Board page 40
regularly. Data to be archived for 2 years following the end of the crediting period.
Any comment --
Data/Parameter EF1
Data unit t CO2/ TJ
Description Emission factor for fuel displaced by use of waste gas for Measure I
Source of data IPCC default value may be taken if available. Else to be calculated based on
composition of fuel. according to Equation 1.
Measurement
procedures (if any)
Fuel composition to be monitored in latter case.
Monitoring
frequency
Once (IPCC default) or monthly analysis of composition and annual calculation of
emission factor.
QA/QC procedures Default factors. No QA/QC procedure required. Data to be archived for crediting
period + 2 yrs.
Any comment Weighted average value to be taken in case of multiple fuels
Data/Parameter η1project
Data unit Fraction
Description Energy efficiency for Measure I in project case
Source of data Specific fuel energy consumption to be calculated
Measurement
procedures (if any)
Fuel consumption for electricity generation and total power generated to be
monitored on monthly basis in DCS.
Monitoring
frequency
Monthly
QA/QC procedures Data to be archived for crediting period + 2 yrs.Any comment Load-wise energy efficiency to be determined.
Data/Parameter η1baseline
Data unit Fraction
Description Energy efficiency of electricity generation in baseline case
Source of data Specific fuel energy consumption to be estimated from fuel consumption and
power generated for baseline period I.e. six months befor project implementation
Measurement
procedures (if any)
Fuel consumption and power generation at various loads to be monitored for
baseline period.
Monitoring
frequency
Monthly for six months before project implementation.
QA/QC procedures Data to be archived for crediting period + 2 yrs.
Any comment Load-wise energy efficiency to be established.
Data/Parameter Qw2
Data unit T or m3
Description Quantity of fossil fuel equivalent to waste gas being utilised for Measure II
Source of data DCS
Measurement
procedures (if any)
--
Monitoring Online

7/24/2019 PDD Waste Gas RIL JN Version3
http://slidepdf.com/reader/full/pdd-waste-gas-ril-jn-version3 41/52
PROJECT DESIGN DOCUMENT FORM (CDM PDD) - Version 03.1.
CDM – Executive Board page 41
frequency
QA/QC procedures DCS data. Measuring instruments being calibrated and maintained as per ISO
procedures. QA/QC procedures included in ISO documentation and audited
regularly. Data to be archived for 2 years following the end of the crediting period.Any comment --
Data/Parameter EF2
Data unit T CO2/ TJ
Description Emission factor for fuel displaced by waste gas for Measure II
Source of data IPCC default value may be taken if available.
Measurement
procedures (if any)
Fuel composition to be monitored in latter case.
Monitoring
frequency
Once (IPCC default) or monthly composition to calculate the emission factor
annually.
QA/QC procedures Default factors. No QA/QC procedure required. Composition to be analysed based
on international standards and analysers.
Any comment Weighted average to be taken for multiple fuels.
Data/Parameter η2project
Data unit fraction
Description Energy Efficiency of boiler in project case
Source of data Estimated from fuel energy consumption and steam generation.
Measurement
procedures (if any)
Consumption of fuel and steam generation to be monitored in DCS.
Monitoringfrequency Monthly
QA/QC procedures Data to be archived for crediting period + 2 yrs. Instruments to be calibrated
periodically.
Any comment --
Data/Parameter η2baseline
Data unit Fraction
Description Energy Efficiency of boiler in baseline case
Source of data Estimated from fuel energy consumption and steam generation.
Measurement
procedures (if any)
Consumption of fuel and steam generation to be monitored in DCS
Monitoring
frequency
Monthly for six months prior to implementation of project.
QA/QC procedures Data to be archived for crediting period + 2 yrs.
Any comment --

7/24/2019 PDD Waste Gas RIL JN Version3
http://slidepdf.com/reader/full/pdd-waste-gas-ril-jn-version3 42/52
PROJECT DESIGN DOCUMENT FORM (CDM PDD) - Version 03.1.
CDM – Executive Board page 42
B.7.2 Description of the monitoring plan:
>>
The process monitoring and control system at the Gandhar Complex is fully automated. All the
parameters covered under monitoring plan are monitored online through IP-21 based system that is
connected with Distributed Digital Control System (DCS). The data is archived electronically on IP-21
server.
Central Technical Services (CTS) department monitors the data on monthly basis in the form of monthly
reports. CTS Engineer will monitor and document the data on regular basis as per the monitoring plan
outlined in the GHG Emission Reduction Management System.
Report on emission reductions will be maintained on a monthly basis and will be available with CTS
department.
Project proponent have established a project specific GHG Emission Reduction Management System
RIL/CDM/MS/PDD/0607/009 which has made the project system driven and not person specific this
document gives detailed responsibility matrix, emergency preparedness, calibration / measuring/
monitoring and reporting parameters, control of records, internal audits, performance review, corrective
action for sustaining the CDM project.

7/24/2019 PDD Waste Gas RIL JN Version3
http://slidepdf.com/reader/full/pdd-waste-gas-ril-jn-version3 43/52
PROJECT DESIGN DOCUMENT FORM (CDM PDD) - Version 03.1.
CDM – Executive Board page 43
The project proponent already has well-established monitoring system. The Central Technical Services
(CTS) department has main responsibility of monitoring the plant parameters on regular basis. The
parameters related to emission reduction are being monitored by the engineer of energy cell of CTS.
ORGANOGRAM
B.8 Date of completion of the application of the baseline study and monitoring methodology and
the name of the responsible person(s)/entity(ies)
>>
Date of completing the final draft of this baseline section: 17/12/2005
Name of person/entity determining the baseline:
Name of entity : Reliance Industries Limited
Contact details are given in Annexure 1.
CTS Engineer
( monitors the parameters
related to GHG Emission
reduction)
Central Environmental CellCTS Sectional Head
CTS Head
Site President
Plant Operation Head

7/24/2019 PDD Waste Gas RIL JN Version3
http://slidepdf.com/reader/full/pdd-waste-gas-ril-jn-version3 44/52

7/24/2019 PDD Waste Gas RIL JN Version3
http://slidepdf.com/reader/full/pdd-waste-gas-ril-jn-version3 45/52
PROJECT DESIGN DOCUMENT FORM (CDM PDD) - Version 03.1.
CDM – Executive Board page 45
SECTION D. Environmental impacts
>>
D.1. Documentation on the analysis of the environmental impacts, including transboundary
impacts:
>>
As per the guidelines for conducting the EIA, the project activity does not fall into any of the two
categories, hence EIA is not required to be done as per the guidelines. However, the project proponent has
carried out environment impact analysis as a good engineering practice.
Detailed Environmental Impact Assessment of the project was carried out before its implementation. The
filled checklist used for EIA is available with the project proponent.
As the project leads to reduced fossil fuel consumption, it contributes to betterment of environment and
there is no negative effect in terms of land, water, air or noise pollution. The socio-economic and cultural
environment is also not affected in any way due to implementation of the project.
There are no legal clearances required for implementation of the project activity
D.2. If environmental impacts are considered significant by the project participants or the host
Party, please provide conclusions and all references to support documentation of an environmental
impact assessment undertaken in accordance with the procedures as required by the host Party:
>>
There are no negative environmental impacts envisaged due to implementation of project, in fact it
contributes to sustainable development of environment.

7/24/2019 PDD Waste Gas RIL JN Version3
http://slidepdf.com/reader/full/pdd-waste-gas-ril-jn-version3 46/52
PROJECT DESIGN DOCUMENT FORM (CDM PDD) - Version 03.1.
CDM – Executive Board page 46
SECTION E. Stakeholders’ comments
>>
E.1. Brief description how comments by local stakeholders have been invited and compiled:
>>
The project activity involves modifications within the existing operational plant. There are well-
established procedures within the company for involving technical as well as operating staff in the
decision making for implementation of any project. Field Change Order (FCO) is circulated through all
key departments within the plant concerned with the area of project activity. Comments from the
department chief are available in FCO.
There are no negative impacts of the project in any way on any stakeholder. In fact they appreciated the
efforts of project proponent towards energy conservation and the environmental benefits that the project
activity has resulted into.
All the local stakeholders of RIL Jamnagar are mapped and interviewed during a recent exhaustive
Corporate Social Responsibility (CSR) study. The report of their feedback is available with the project
proponent and may be made available to the validator is so desired.
E.2. Summary of the comments received:
>>
The stakeholders who were interviewed include panel superintendent, field engineer, Technical services
engineer and plant production manager. After providing all the details of project activity, the questions
were asked to evaluate what the stakeholder thinks about impact of project activity on following :
1. Air pollution
2. Water pollution
3. Water availability
4. Water allocation
5. Natural drainage pattern
6. Drainage in general
7. Solid waste generation and disposal
8. Land use / landscape
9. Plant life
10. Agriculture / horticulture
11. Habitat fragmentation

7/24/2019 PDD Waste Gas RIL JN Version3
http://slidepdf.com/reader/full/pdd-waste-gas-ril-jn-version3 47/52
PROJECT DESIGN DOCUMENT FORM (CDM PDD) - Version 03.1.
CDM – Executive Board page 47
12. Employment
13. Vocational opportunities
14. Income levels
15. Stress on infrastructure
The stakeholders have indicated that there is no significant impact of the project activity in terms of any
of the above parameters.
E.3. Report on how due account was taken of any comments received:
>>
Stakeholders have appraised the project as an environment friendly project and have expressed their
satisfaction on the fact that it reduces emissions and contributes to well-being of society. There are no
negative comments received that require the project proponent to take any corrective action

7/24/2019 PDD Waste Gas RIL JN Version3
http://slidepdf.com/reader/full/pdd-waste-gas-ril-jn-version3 48/52
PROJECT DESIGN DOCUMENT FORM (CDM PDD) - Version 03.1.
CDM – Executive Board page 48
Annex 1
CONTACT INFORMATION ON PARTICIPANTS IN THE PROJECT ACTIVITY
Organization: Reliance Industries Limited
Street/P.O.Box: Thane-Belapur Road, Koparkhairane
Building: 2nd
Floor, B Wing, PHQ, Dhirubhai Ambani Knowledge City (DAKC)
City: Navi Mumbai
State/Region: Maharashtra
Postfix/ZIP: 400709
Country: India
Telephone: + 91 22 67270585
FAX: + 91 22 67270699
E-Mail: [email protected]
URL: www.ril.com
Represented by:
Title: General Manager
Salutation: Mr
Last Name: Mukherjee
Middle Name: K
First Name: Kisor
Department: Projects
Mobile: + 91 9322645078
Direct FAX: + 91 22 67270699
Direct tel: + 91 22 67270585
Personal E-Mail: [email protected]

7/24/2019 PDD Waste Gas RIL JN Version3
http://slidepdf.com/reader/full/pdd-waste-gas-ril-jn-version3 49/52
PROJECT DESIGN DOCUMENT FORM (CDM PDD) - Version 03.1.
CDM – Executive Board page 49
Annex 2
INFORMATION REGARDING PUBLIC FUNDING
No Public Funding is sought for the project activity
Annex 3
BASELINE INFORMATION
Measure I:
Parameter Units Value
Energy equivalent of waste gas
used for power and steam
generation
TJ/year 458
Baseline emission T CO2/year 35448
Measure II :
Parameter Units Value
Energy equivalent of waste gas
used for power and steamgeneration
TJ/year 737
Baseline emission T CO2/year 57078

7/24/2019 PDD Waste Gas RIL JN Version3
http://slidepdf.com/reader/full/pdd-waste-gas-ril-jn-version3 50/52
PROJECT DESIGN DOCUMENT FORM (CDM PDD) - Version 03.1.
CDM – Executive Board page 50
Annex 4
MONITORING INFORMATION
The parameters for monitoring performance and estimating emission reduction by the project activity will
be monitored as per the monitoring plan given in Section D of this PDD. Monitoring and verification
protocol is developed as part of ‘GHG emission reduction management system’. The M&V protocol
provides a range of data measurement, estimation and collection options/techniques in each case
indicating preferred options consistent with good practices to allow project managers and operational
staff, auditors, and verifiers to apply the most practical and cost-effective measurement approaches to the
project. The aim is to enable this project have a clear, credible, and accurate set of monitoring, evaluation
and verification procedures. The purpose of these procedures would be to direct and support continuous
monitoring of project performance/key project indicators to determine project outcomes, greenhouse gas
(GHG) emission reductions.
Major Parameters monitored will be as follows.
1. Waste gas flow for steam and power generation
2. Fuels consumption and steam generation in boiler for boiler efficiency calculations
3. Boiler Steam pressure and temperature for enthalpy estimation
The instrumentation system installed for the project is Distributed Control System (DCS) of reputed
make, with shift-wise recording and feedback facility with desired level of accuracy. All instruments will
be calibrated and marked at regular intervals so that the accuracy of measurement can be ensured all the
time.
Monitoring Approach
The general monitoring principles are based on:
• Frequency
• Reliability
• Registration and reporting

7/24/2019 PDD Waste Gas RIL JN Version3
http://slidepdf.com/reader/full/pdd-waste-gas-ril-jn-version3 51/52
PROJECT DESIGN DOCUMENT FORM (CDM PDD) - Version 03.1.
CDM – Executive Board page 51
As the emission reduction units from the project are determined by the reduction in steam quantity and
subsequent reduction in consumption of fuel in service boiler, it is important to discuss the monitoring
principles in context of monitoring these parameters.
Frequency of monitoring
The project developer has installed all metering facilities within the plant premises. The measurements are
monitored and controlled through DCS on continuous basis, recorded day-wise in log sheets by operator
and duly authenticated by head of plant.
Reliability
The amount of emission reduction units is proportional to the net energy reduction due to project. Thus
the steam meter reading is of crucial value. All measurement devices will be digital type meters with on-
line DCS (Distributed Control System) having best accuracy and will be procured from reputed
manufacturers. Since the reliability of the monitoring system is governed by the accuracy of the
measurement system and the quality of the equipment for reproducibility, all instruments must be
calibrated once a year for ensuring reliability of the system. All instruments carry tag plates, which
indicate the date of calibration and the date of next calibration. Therefore it ensures that the monitoring
system is highly reliable.
Registration and reporting
Registration is done on the basis of daywise data logging in computer. Daily and monthly reports are
prepared stating the steam consumption and strippers output.
A daily report will be generated showing day-wise data on steam used in strippers in CDU-I and II, day-
wise calculated steam consumption per ton of stripper output and net reduction in steam consumption
calculated by multiplying difference in specific steam consumption and total production.
Verification
The reduction in steam consumption leads to the CO2 emission reductions. The project control system
comprises sophisticated monitoring system like on-line display meters and Distributed Control Systems
(DCS) which measures, collects the information about various process parameters, monitors and controls
on a continuous basis and records on daily basis. Fully functional management information generated
through DCS in pre-decided daily reports formats are built, so that access to and verification of actual

7/24/2019 PDD Waste Gas RIL JN Version3
http://slidepdf.com/reader/full/pdd-waste-gas-ril-jn-version3 52/52
PROJECT DESIGN DOCUMENT FORM (CDM PDD) - Version 03.1.
CDM – Executive Board page 52
data are possible at any point of time. A computerised MIS can is generated and distributed among
decision makers of the project. The major activities to be verified are as under
• Verification of various measurement and monitoring methods
• Verification of instrument calibration methods
• Verification of data generated through on-line meters and DCS
• Verification of measurement accuracy
- - - - -