Embed Size (px)
Citation preview

First results from the InternationalComparison Program in South America
Household Consumption in 2005
Ministério do Planejamento, Orçamento e GestãoInstituto Brasileiro de Geografi a e Estatística - IBGE
Rio de Janeiro2006
Programade Comparación InternacionalAmérica Latina
InternationalComparison ProgramLatin American
38494P
ublic
Dis
clos
ure
Aut
horiz
edP
ublic
Dis
clos
ure
Aut
horiz
edP
ublic
Dis
clos
ure
Aut
horiz
edP
ublic
Dis
clos
ure
Aut
horiz
edP
ublic
Dis
clos
ure
Aut
horiz
edP
ublic
Dis
clos
ure
Aut
horiz
edP
ublic
Dis
clos
ure
Aut
horiz
edP
ublic
Dis
clos
ure
Aut
horiz
ed

2
CoverMarcos Balster Fiore Correia - Coordenação de Marketing/Centro de Documentação e Disseminação de Informações - CDDI
Printing project Mônica Pimentel Cinelli Ribeiro
Desktop plublishingBeth Fontoura Mônica Pimentel Cinelli RibeiroNeuza Damásio
PrintingCentro de Documentação e Disseminação de Informações - CDDI
Impresso no Brasil/ Printed in Brazil
Instituto Brasileiro de Geografi a e Estatística - IBGEAv. Franklin Roosevelt, 166 - Centro - 20021-120 - Rio de Janeiro, RJ - Brasil
© IBGE. 2006

3
Introduction 05
Press release: First results from the International Comparison Program inSouth America - Household Consumption in 2005 07
Methodological note on the 2005 ICP round in South America 13
Tables with results
1 - Indices of per capita real expenditure, region =100 Per capita real (converted by PPPs) expenditures: ratio of country to regional average 19
2 - Indices of per capita nominal expenditure, region =100 Per capita nominal (converted by exchange rate) expenditures: ratio of country to regional average 20
3 - Price level indices, regional average =100PPP divided by exchange rate, scaled to the regional average 21
4 - Purchasing power paritiesPPPs, Argentina = 1.0 22
5 - Real expenditure sharesReal expenditure shares by consumption category 23
6 - Nominal expenditure sharesNominal expenditure shares by consumption category 24
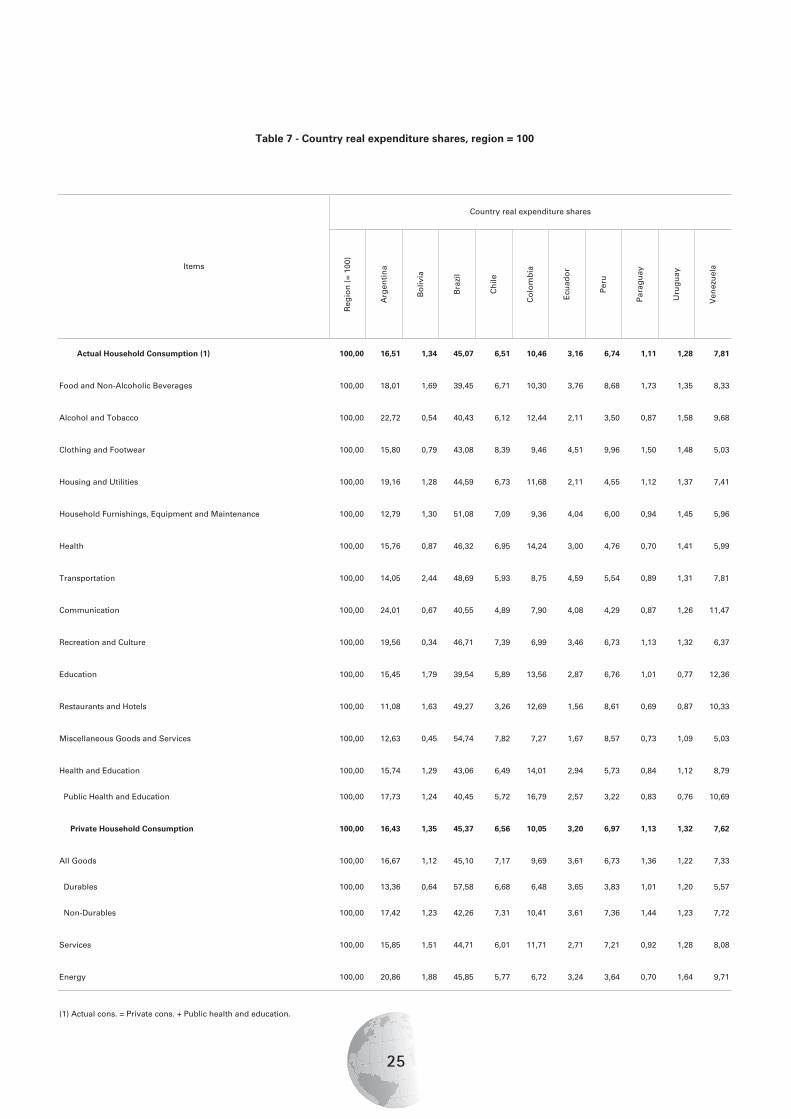
7 - Country real expenditure shares, region =100Real shares of countries in regional total 25
8 - Country nominal expenditure shares, region =100Nominal shares of countries in regional total 26
Anexed
An interview with Eduardo Pereira Nunes, President of the “Instituto Brasileiro de Geografi a e Estatistica (IBGE)” 27
Contents


5
Introduction
In order to make today’s event intelligible, a package of documents is being circulated to all participants. The package contains three components:
1. A press release (First Results of the International Comparison Programme (ICP) in South America - Household Consumption in 2005) of the principal fi ndings of the ICP in South America;
2. A note (Methodological note on the 2005 ICP Round in South America) describing the methods used in order to calculate Purchasing Power Parities, per capita expenditures on household consumption at parity rates; and
3. Tables containing the detailed numerical results of the programme – so far.
Notwithstanding the documents´ air of fi nality, participants should not be deceived into believing that today´ s event marks the end of the programme. In fact it marks its beginning. Whereas the ten South American countries that took part in the exercise can derive justifi able pride from being the fi rst to release results for their respective region, much remains to be done in the nature of better methods, better basic data, and better agreements on region wide concepts and the application thereof. It is a collective hope that these improvements will see the light of day in a second round of the ICP tentatively set for 2008. In the meantime users should be aware that small differences in either the price level or more importantly in consumption per capita measured at parity rates do not mean very much; that the estimates of expenditures on housing are still subject to revisions to make them more comparable internationally; that expenditures on services which are partly provided by the Government and partly by the private sector (Health, Education,. Telecommunications etc.) continue to be the object of discussion and improvement; and that the time between now and the end of the year will be devoted to bring about marginal improvements that may infl uence the ultimate outcome.
We are confi dent that the results shown in the package of documents are stable and should any change occur it would be marginal. The best recipe for the improvement of economic statistics is to put them out in the open and have a public discussion of their strengths and weaknesses.


7
Press release: First results of the International Comparison Program in South America -
Household Consumption in 2005
Introduction
In 2003, the World Bank launched a global round of the International Comparison Program (ICP), aimed at measuring the purchasing power parities (PPP) and corresponding price and volume levels of Gross Domestic Product (GDP) on a comparable basis for more than 100 countries, grouped into 5 regions1. Although the comparisons involving GDPs adjusted for purchasing power parities are not yet ready, there are preliminary regional results for the major component of GDP - household consumption.
Those results compare ten South American countries whose consumer prices were surveyed in 2005 to compute PPPs and apply them to household consumption for the same year. Household consumption in the South American region accounts on average for two-thirds of GDP. It is therefore unlikely that once estimated, the other components of national expenditure will bring about signifi cant changes in the ranking of GDP per capita or any marked changes in national parities.
Highlights:
• In 2005, Argentina, Chile and Uruguay were relatively better off than the other South Ameri-can countries
On the basis of the estimated 2005 fi gures, there are no major surprises in the ranking of the fi rst three countries relatively to the situation ten years ago. Table 1 shows Argentina remaining at the top in terms of per capita expenditures2 on household goods and services, at sixty per cent above the regional average. Chile and Uruguay follow respectively with 48 and 43 per cent above average. Paraguay and Bolivia remain at the bottom of the table, the former with two thirds of the regional average and the latter with fi fty two per cent. The middle group is less spread out, with Venezuela at the top, slightly above average, and Colombia roughly twenty per cent below. Brazil ranks sixth, almost ten per cent below par.
1 South America, Africa, the Middle East, Asia, and the Commonwealth of Independent States (formerly Union of Soviet Socialist Repu-blics).2 Throughout the text, “per capita expenditures” refers to the real per capita expenditures as adjusted by PPP.

8
Results are presented in the form of an index, where 100 corresponds to the ave-rage results for the 10 South American countries. Thus, the index of 161 for Ar-gentina indicates that its real household consumption per capita is 61% higher than the average for the South American region.
• In 2005, the most expensive countries to live in were Chile, Brazil and Uruguay; Paraguay and Bolivia were the cheapest
The best known application of purchasing power parities is to determine comparative price levels, or in ordinary language where it is most (or least) expensive to live. Table 2 below shows the newly calculated estimates – expressed in relation to the South American average. If a visitor from outside the region moved from one country to another and bought in each rigorously the same basket of goods and services, he would fi nd that he had spent most in Chile and least, in Paraguay and in Bolivia.
Country Per capita
Argentina 161,3
Chile 148,0
Uruguay 143,5
Venezuela 108,7
Peru 91,6
Brazil 90,5
Ecuador 88,5
Colombia 84,1
Paraguay 69,8
Bolivia 52,7
Note: Regional Average = 100.
Table 1 - Household Consumption per capita
Country Price Level Index
Chile 117,7
Brazil 114,2
Uruguay 108,0
Venezuela 101,3
Peru 85,8
Ecuador 85,7
Colombia 85,3
Argentina 77,5
Paraguay 57,4
Bolivia 53,8
Note: Regional Average = 100.
Table 2 - Comparative price levelsWhich is the most expensive
country to live in?
When comparing price levels with per capita expenditures, it should be noted that countries with the highest price levels are not necessarily those with the highest per capita expenditures. Chile’s price level is higher than Argentina’s, and so is Brazil’s (See Chart 1).

9
• Argentina spends more than its neighbours on most major household items but Uruguay leads in expenditure on transportation
How do per capita expenditures on specifi c groupings of consumer goods and services compare?
Tables 3a and 3b answer the question for some broad categories at a highly aggregate level. Although prices
are collected for specifi c goods and services, per capita expenditures rely on both price data (PPPs) and ex-
penditure estimates from the national accounts. However, the most detailed national accounts estimates of
expenditure are in fact aggregates, such as food, clothing, etc. Even when some detailed national accounts
information is available, it is not always fully comparable between countries. In addition, values for public
and private health and education are presented together as the results are not yet robust enough to be sho-
wn separately. When the full GDP results are released at the end of the year, private and public education
and health will be shown as four separate categories.
180
160
140
120
100
80
60
40
20
00Argentina Chile Uruguay Venezuela Peru Brazil Ecuador Colombia Paraguay Bolivia
Per Capita Price Level Index
Chart 1 - Comparative Price Levels and Indices of Household Expenditure Per Capita, 2005 Regional Average =100
Argentina Brazil Chile Paraguay Uruguay
Effective Household Consumption 161,3 90,5 148,0 69,8 143,5
Food and Non-Alcoholic Beverages 175,9 79,3 152,7 108,6 151,3
Clothing and Footwear 154,4 86,5 190,9 94,0 166,1
Housing and Related Expenses 187,1 89,6 153,0 70,3 153,7
Transportation 137,3 97,8 134,9 55,6 146,6
Restaurants and Hotels 108,3 99,0 74,2 43,3 97,9
Health and Education Public and Private 153,8 86,5 147,6 52,6 125,8
Note: Regional Average for all ten countries = 100.
Table 3a - Who spends most on what? Selected per capita items Mercosur and Chile
10
Bolivia Colombia Ecuador Peru Venezuela
Effective Household Consumption 52,7 84,1 88,5 91,6 108,7
Food and Non-Alcoholic Beverages 66,2 82,8 105,2 118,0 115,9
Clothing and Footwear 30,9 76,1 126,2 135,5 70,0
Housing and Related Expenses 50,3 93,9 59,1 61,9 103,1
Transportation 95,9 70,3 128,5 75,3 108,7
Restaurants and Hotels 63,8 102,0 43,8 117,0 143,8
Health and Education Public and Private 112,6 82,3 77,8 122,3
Note: Regional Average for all ten countries = 100.
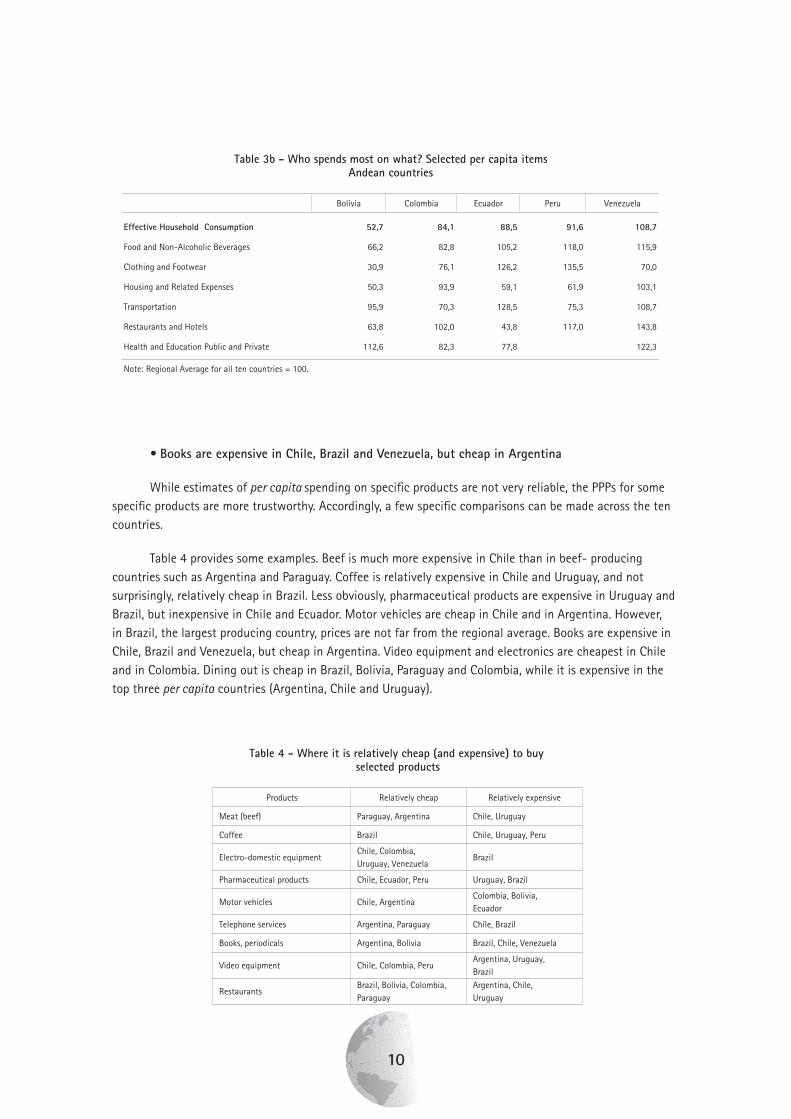
Table 3b - Who spends most on what? Selected per capita itemsAndean countries
• Books are expensive in Chile, Brazil and Venezuela, but cheap in Argentina
While estimates of per capita spending on specifi c products are not very reliable, the PPPs for some specifi c products are more trustworthy. Accordingly, a few specifi c comparisons can be made across the ten countries.
Table 4 provides some examples. Beef is much more expensive in Chile than in beef- producing countries such as Argentina and Paraguay. Coffee is relatively expensive in Chile and Uruguay, and not surprisingly, relatively cheap in Brazil. Less obviously, pharmaceutical products are expensive in Uruguay and Brazil, but inexpensive in Chile and Ecuador. Motor vehicles are cheap in Chile and in Argentina. However, in Brazil, the largest producing country, prices are not far from the regional average. Books are expensive in Chile, Brazil and Venezuela, but cheap in Argentina. Video equipment and electronics are cheapest in Chile and in Colombia. Dining out is cheap in Brazil, Bolivia, Paraguay and Colombia, while it is expensive in the top three per capita countries (Argentina, Chile and Uruguay).
Products Relatively cheap Relatively expensive
Meat (beef) Paraguay, Argentina Chile, Uruguay
Coffee Brazil Chile, Uruguay, Peru
Electro-domestic equipment Chile, Colombia, Uruguay, Venezuela
Brazil
Pharmaceutical products Chile, Ecuador, Peru Uruguay, Brazil
Motor vehicles Chile, Argentina Colombia, Bolivia, Ecuador
Telephone services Argentina, Paraguay Chile, Brazil
Books, periodicals Argentina, Bolivia Brazil, Chile, Venezuela
Video equipment Chile, Colombia, Peru Argentina, Uruguay, Brazil
Restaurants Brazil, Bolivia, Colombia, Paraguay
Argentina, Chile, Uruguay
Table 4 - Where it is relatively cheap (and expensive) to buy selected products

11
• The extrapolation of data over a long period yields misleading results and exaggerates the gap between the “haves” and the “have nots”
The results obtained in this round differ signifi cantly from the estimates based on the last round of the ICP, which were extrapolated to the present3 on the basis of a number of indicators, chief among them the national CPIs.
If one compares the present results with those extrapolated on the basis of the PPPs of ten years ago, the ranking of the countries in terms of per capita expenditure is similar. But the difference between the country with the highest spending per capita (Argentina) and the one with the lowest (Bolivia) is greatly exaggerated in the projections. The new estimates suggest that the ratio of one to the other is three to one rather than fi ve to one. Furthermore, the overall variability of the new per capita numbers is only two thirds of that of the extrapolated ones. In general the new estimates show that neither are the poor as poor as conventional statistics make out, nor the relatively rich quite as well off as is sometimes believed.
The extrapolated price levels do not compare as well as the per capita expenditures. Not only do they exaggerate the dispersion around the regional average, but the ranking is fundamentally changed (see Table 6).
3 See World Development Indicators Database
CountryHousehold
ConsumptionCountry
HouseholdConsumption
1. Argentina 174,2 1. Argentina 161,3 2. Uruguay 146,5 2. Chile 148,0 3. Chile 145,6 3. Uruguay 143,5 4. Colombia 95,8 4. Venezuela 108,7 5. Brazil 95,2 5. Peru 91,6 6. Peru 80,2 6. Brazil 90,5 7. Venezuela 71,0 7. Ecuador 88,5 8. Paraguay 68,8 8. Colombia 84,1 9. Ecuador 59,8 9. Paraguay 69,8 10. Bolivia 36,2 10. Bolivia 52,7 Ratio, max to min. 4,8 Ratio, max to min. 3,1
(1) Based on 2004 World Bank Database figures.
Table 5 - Comparison of Per Capita Country Rankings Based on the 2005 ICP Results and the 1996 ICP Extrapolations (1)
ICP 1996 Extrapolations ICP 2005
Country Price Level Index Country Price Level Index
1.Venezuela 155,9 1.Chile 117,7 2.Ecuador 127,6 2.Brazil 114,2 3.Chile 120,4 3.Uruguay 108,0 4.Brazil 109,2 4.Venezuela 101,3 5.Uruguay 106,6 5.Peru 85,8 6.Peru 98,5 6.Ecuador 85,7 7.Bolivia 78,8 7.Colombia 85,3 8.Colombia 75,8 8.Argentina 77,5 9.Argentina 72,1 9.Paraguay 57,4 10.Paraguay 58,7 10.Bolivia 53,8 Relative dispersion 1,00 0,6
(1) Based on 2004 World Bank database figures.
Table 6 - Comparison of Price Level Index Rankings Based on the 2005 ICP Results and the 1996 ICP Extrapolations (1)
ICP 1996 Extrapolations ICP 2005

12
The comparison of the results of this ICP round with the data extrapolated from the previous round shows the imperative need to calculate parities regularly. In the absence of a multilateral program that requires statistical offi ces to do so, any view held about which countries are relatively poor and which are relatively rich will be obsolete in a short while. And without recent results, policy makers will fi nd themsel-ves unable to make timely and balanced decisions.

13
Methodological note on the 2005 ICP round in South America
What is the ICP?
The International Comparison Program (ICP) is a global statistical initiative aimed at providing objective and quantifi ed answers to questions such as “By how much is country A more expensive than country B?”; “In what sense and to what extent is currency A overvalued in relation to currency B?” and “On a per capita basis, to what extent does country A consume more of such goods and services as Food, Health, Education etc.?” Those and similar questions are the substance of what we normally refer to as policy-driven international comparisons of economic indicators.
There is a traditional way of answering such questions. What is commonly done is to declare a currency the accepted yardstick for inter-country comparisons. In a distant past that currency was the Pound Sterling, replaced after the First World War by the US Dollar. All statistics expressed in value terms were converted into the yardstick currency using market exchange rates.
However, market exchange rates are infl uenced by many factors, of which purchasing power is but one. In the short term, speculative forces affecting countries’ capital accounts can be just as powerful as purchasing power if not more so. In addition to the signifi cant variations in the currency markets caused by investment and short term capital movements, the odd and sudden fi nancial collapse of a country, while immediately translated into the foreign exchange market, only affects the production and distribution of wealth much more slowly. A well-known example is the fi nancial crisis that shook Argentina in 2001. While the national currency saw its US dollar value reduced by two thirds almost overnight, neither the purchasing power of national wealth or national income suffered from a comparable reduction in the short or medium term.
There is now a serious alternative to market exchange rates for making meaningful international comparisons, namely the purchasing power parities or PPPs. The easiest way to explain them is in terms of consumption. For a consumer, the purchasing power parity is that rate of exchange between two currencies A and B that makes him indifferent to purchasing a pre-defi ned basket of goods and services with one currency or another. In other words, the consumer does not care whether he makes his purchases in currency A or else exchanges currency B for currency A at the calculated parity rate, because either way he can acquire the exact same goods and services in the exact same quantities.
Purchasing Power Parities in the ICP are calculated not only for consumption, but also for the other components of GDP – investment in machinery and equipment, residential and other construction, government expenditure on goods and services and so on. The calculation of PPPs allows participating countries to compare their key macro-economic aggregates with those of their neighbours without the comparisons being distorted by the fl uctuations in exchange rates.

14
History and organization of the ICP
In 2003, after an eight year gap, the World Bank launched a new round of the ICP following several years of intensive discussion and preparation. More than 100 countries grouped into 5 regions: South America, Africa, the Middle East, Asia, and the Commonwealth of Independent States (formerly Union of Soviet Socialist Republics)1 expressed their eagerness to take part in the exercise. And while some Latin American countries took part in earlier rounds this is the fi rst time that South American countries as a region take part in the project offi cially.
The current round represents a change from the organization of previous attempts. Replacing the statistical offi ce of the United Nations, the World Bank assumed the coordination of global operations through a newly created Global Offi ce, accountable to an Executive Board whose membership represents broadly the international statistical community as well as those institutions that fund the project. A Technical Advisory Group offers guidance and makes recommendations on what methods should be employed and in which circumstances they should be used. The Global Offi ce manages the ICP on a day-to-day basis and is responsible for calculating and publishing the global results. The price surveys required to calculate the PPPs and PPP-based GDP estimates are conducted by participating countries.
Each of the fi ve regions has its own institutional set-up to run the project. In the case of South America, regional coordination is provided jointly by Statistics Canada, the statistical offi ce of the Canadian government and by the UN’s Economic Commission for Latin America and the Caribbean (ECLAC). The price collection is handled by the institution responsible for the Consumer Price Index (CPI) in each participating country, but the specifi cation of a standard basket of goods and services is in the hands of the coordinating agencies in close collaboration with the World Bank’s Global Offi ce. The calculation of the weights required to aggregate national prices is carried out by the institution responsible for each country’s National Accounts. In addition to its coordination role, Statistics Canada is responsible for verifying and editing the prices and the GDP weights, as well as for calculating the PPPs and the PPP-based GDP estimates. The project is funded fi rst and foremost by the countries themselves, and by major international institutions including the World Bank (WB), the Inter-American Development Bank (IADB), the ECLAC and the Canadian International Development Agency (CIDA).
How can many countries have a single basket?
We all know that there are intrinsic problems with the calculation of the CPI, largely caused by changes in taste, advances in technology and changing scarcities refl ected in the change of relative prices. If we try to compare the present with a twenty year old past, how do we handle digital cameras, genetically modifi ed beef, Windows XP Pro and surround sound audio equipment? Comparing countries may be just as tricky, if not more so. Whose clothes do we declare to be standard when we compare a hot country with a cold one? Whose diet do we take as standard when we compare a coastal community with one living far inland? And how do we compare communities that rate soccer the most popular of sports with those that prefer baseball? And so on. The answer is that we compromise. We elect as standard those products that
1 The Eurostat-OECD PPP program is run independently from the ICP, but its results will be merged with those of the ICP to make this round a truly global undertaking.

15
are comparable after a fashion and yet retain some representativeness. There is no point designating meat as a comparable good in a country where the overwhelming majority of citizens are vegetarian. But we can consider that under certain conditions a choice cut of lamb is the equivalent of a choice cut of beef. We try to ensure the integrity of the overall comparison by multiplying the number of sound individual comparisons so as to feel on safe ground when challenged about the representativeness of our standard basket.
Calculation of elementary PPP
At basic level, a purchasing power parity is the ratio of prices for the same quantity of a particular commodity in two countries, when the prices are expressed in each country’s currency. Suppose the price of a kilo of rice is 500 pesos in Country A and 5 reais in Country B. The PPP for rice between Country A and Country B is the ratio 500/5. A real spent on rice in Country B purchases the same quantity and quality of rice as 100 pesos in Country A. The rice exchange parity for country B compared to A is 100.
Tens of thousands of goods and services make up household consumption and even more make up GDP. They range from several types of rice, to hundreds of clothing items and jewellery, to insurance services, medical services, etc. No statistical agency would fi nd it possible to price simultaneously all available goods and services.
Instead, PPPs are constructed for selected products and services considered to be representative of the main GDP aggregates, but also comparable with goods and services available in neighbouring countries. For the ICP, the main GDP aggregates (household consumption, government consumption, gross fi xed capital formation, exports and imports) are broken down into 155 basic headings.2 Examples of household consumption basic headings include ‘bread and cereals’, ‘fi sh and seafood’, ‘fresh fruits’, ‘footwear’, ‘motor vehicles’, ‘communications’, etc. For government, basic headings are ‘health services’, ‘education services’, ‘defense’, etc.3 Each of these headings is represented by a bundle of more precisely defi ned goods or services.
PPPs for basic headings are aggregated to higher levels according to their weight in the expenditure GDP of each country4. Once the GDP of each country within a region is revalued at parity rates, it is added to the GDP of its neighbours also revalued by their respective parity rates, in order to obtain a parity-valued regional GDP. This regional GDP aggregate corresponds to the value of all goods and services produced in the region and expressed in a single currency if those goods and services were each valued at their parity rate. The choice of a common currency or numéraire is arbitrary, but time-honoured convention establishes that it be the US dollar for global aggregates. The ratio of the value of a good or a service consumed by any one country and valued at its parity to the corresponding regional value represents the country’s ‘true’ share for that product.
2 A basic heading is the most detailed category for which a PPP is calculated. 3 See Table 3 for the list of basic headings.4 Several methods can be used to aggregate PPPs, and each has its strengths and weaknesses. The discussion of the different methods is quite technical but is featured in considerable detail in the ICP 2003-2006 Handbook, available on the World Bank website: www.worldbank.org/Data/International Comparison Program/Resources/Handbook

16
Once regional PPPs are calculated, all regions are linked together through a small number of countries acting as bridges to other regions (Brazil and Chile were the ones chosen in South America) and a World GDP is estimated by adding together the regional GDPs adjusted by their respective bridges. World GDP divided by world population is the best estimate of world GDP per capita. To the extent that any ranking is meaningful, no ranking of GDP per capita means much unless the GDPs are revalued at their parity rate.
How was it done in Latin America?
The principle followed is to aggregate like with like, at least initially. Where there is variety within a region, smaller groups of countries are considered before proceeding to estimate regional aggregates. Thus there were two consumer baskets for South America - one for the Andean Community and the other for Mercosur and Chile. The baskets were defi ned during a series of regional meetings in 2003 and 2004, and considerable care was taken to choose products that were comparable across countries and yet representative of national markets.
The fi nal basket for consumption consisted of 580 items covering 88 of the 110 basic headings established globally. Valid comparisons do not demand that each participating country collect prices for the complete standard basket. Thus, because of differences in product availability, only 450 items were surveyed in the Andean Community and 524 in Mercosur and Chile. No country, not even the largest, surveyed all items in the basket.
After a pilot round in October 2004, prices were collected in all countries in March, June, September and November 2005 and annual average prices calculated. A number of products were surveyed only once or twice. Seasonal products (e.g. winter clothing) were priced in the quarter in which they were available. Other products were priced once only because their price was not expected to change during the year (e.g. school fees). The following table shows the number of basic headings and products for 12 major consumption categories:
Category Basic headings ProductsAverage share in
consumption
Total 88 580 100,0
Food and non-alcoholic beverages 29 147 22,7
Alcoholic beverages and tobacco 4 8 2,7
Clothing and footwear 5 136 3,7
Housing, water, electricity, gas and other
fuels 6 20 17,0
Household furnishings, equipment and
maintenance 10 77 5,8
Health 7 51 9,6
Transportation 9 33 11,2
Communications 3 8 4,3
Recreation and culture 8 54 4,3
Education 1 10 8,5
Restaurants and hotels 2 14 4,0
Miscellaneous goods and services 4 22 6,3
Table 1 - Number of Basic Headings and Products in the South American Basket

17
Most countries did not set up price collection centres outside their major city or cities. The following table shows the cities surveyed in each country, and the estimated percentage of the urban population covered. Readers should keep in mind however that cities in South America account for a large proportion of the total population, and account for an even larger fraction of all retail transactions. Moreover, as national markets become increasingly integrated, it is diffi cult to think of signifi cant price differentials for items other than fresh produce and housing.
Nevertheless, procedures were devised to better represent national average prices. Thus, except for
Argentina, Paraguay and Venezuela, a weighting scheme applied to the cities where price collection took
place ensured that the rest of the country was represented, if not through its prices, at least through its
relative importance. One consequence of this was to prevent prices collected in larger cities from dwarfi ng
those collected in smaller ones. For example, in Peru and Uruguay, the cities outside the capital were
weighted to represent the rest of the country rather than their importance relative to that of the capital.
For each country, weights of each city/region were derived from regional household spending
patterns, regional GDP estimates or a combination of both. Population was used as an indicator only when
no expenditure information was available. For Argentina, average prices in Buenos Aires were adjusted to
refl ect the results of a purchasing power parity study conducted country wide.
Note to users: An international comparison with the sweep of the ICP will always catch some
countries in the midst of a broad ranging overhaul of their economic statistics. The detailed national
accounts estimates underlying the aggregation of the PPPs in each country are also subject to some
uncertainty. Accordingly, users should not read too much into the detailed expenditure data and should be
cautioned against ranking countries on the basis of the per capita expenditure on a single good or service.
seitiCyrtnuoCCoverage in % of urban
pop.
Argentina Gran Buenos Aires 39,7
5,67zurCatnaS,zaPaL,otlAlE,abmabahcoCaiviloB
0,72oluaPoãS,rodavlaS,orienaJedoiR,ergelAotroP,ainaioG,méleBlizarB
Chile Antofagasta, Concepción, Coquimbo, Iquique, La Serena, Puerto Montt, Quilpue, Santiago, Talcahuano, Temuco, Valdivia, Valp 6,45.MañiV,osiara
2,93nílledeM,ilaC,átogoB,alliuqnaraBaibmoloC
Ecuador Guayaquil, Quito 45,1
0,34ollijurT,amiL,sotiuqI,oyacnauH,apiuqerAureP
Paraguay Asunción 55,0
5,24óbmeraucaT,odanodlaM,sardeiPsaL,údnasyaP,oedivetnoMyaugurU
0,81)etamitse(sacaraCnarGaleuzeneV
Table 2 - Geographical Coverage in % of Urban Population by Country

18
NameBasic
Headings
551tcudorPcitsemoDssorG
011sdlohesuoHyberutidnepxEnoitpmusnoClaniF
92segareveBcilohoclA-noNdnadooF
5scitocraNdnaoccaboT,segareveBcilohoclA
5raewtooFdnagnihtolC
7sleuFrehtOdnasaG,yticirtcelE,retaW,gnisuoH
Furnishings, Household Equipment and Routine Maintenance of the House 13
Health 7
31tropsnarT
3snoitacinummoC
31erutluCdnanoitaerceR
1noitacudE
2sletoHdnastnaruatseR
01secivreSdnasdooGsuoenallecsiM
Balance of Expenditures of Residents abroad and Expenditures of non Residents 2yrotirreTcimonocEehtni
Individual Consumption Expenditure by Government and by NPISH 22
1HSIPNyberutidnepxEnoitpmusnoClaudividnI
12tnemnrevoGyberutidnepxEnoitpmusnoClaudividnI
Housing 1
Health 12
1erutluCdnanoitaerceR
6noitacudE
1noitcetorPlaicoS
5tnemnrevoGyberutidnepxEnoitpmusnoCevitcelloC
21noitamroFlatipaCdexiFssorGnoerutidnepxE
8tnempiuqEdnayrenihcaM
3noitcurtsnoC
1stcudorPlatipaCrehtO
4selbaulaVfolasopsiDsselsnoitisiuqcAdnaseirotnevnInisegnahC
2seirotnevnInisegnahC
2selbaulaVfolasopsiDsselsnoitisiuqcA
2stropmIdnastropxEfoecnalaB
Table 3 - List of the 155 Basic Headings of GDPs for the purposes of the ICP

19
Tables with results
Reg
ion
(=
100)
Arg
enti
na
Bo
livia
Bra
zil
Ch
ile
Co
lom
bia
Ecu
ado
r
Per
u
Uru
gu
ay
Ven
ezu
ela
7,8015,3418,966,195,881,480,8415,097,253,1610,001)1(noitpmusnoCdlohesuoHlautcA
9,5113,1516,8010,8112,5018,287,2513,972,669,5710,001segareveBcilohoclA-noNdnadooF
8,4313,7713,456,742,959,993,9312,183,129,1220,001occaboTdnalohoclA
0,071,6610,495,5312,6211,679,0915,689,034,4510,001raewtooFdnagnihtolC
1,3017,3513,079,161,959,390,3516,983,051,7810,001seitilitUdnagnisuoH
0,388,1619,855,181,3112,573,1616,2019,050,5210,001ecnanetniaMdnatnempiuqE,sgnihsinruFdlohesuoH
Health 100,0 153,9 34,2 93,1 158,1 114,4 84,0 64,7 44,1 157,7 83,3
7,8016,6416,553,575,8213,079,4318,799,593,7310,001noitatropsnarT
7,9512,1417,454,853,4115,362,1115,184,626,4320,001noitacinummoC
7,889,7419,075,198,692,650,8618,394,311,1910,001erutluCdnanoitaerceR
1,2718,584,369,194,080,9010,4314,971,079,0510,001noitacudE
8,3419,793,340,7118,340,2012,470,998,363,8010,001sletoHdnastnaruatseR
0,072,2215,545,6117,645,858,7710,0118,714,3210,001secivreSdnasdooGsuoenallecsiM
3,2218,5216,258,773,286,2116,7415,687,058,3510,001noitacudEdnahtlaeH
9,8411,580,257,340,279,4311,0313,186,842,3710,001noitacudEdnahtlaeHcilbuP
1,6013,7410,178,496,988,082,9411,190,355,0610,001noitpmusnoCdlohesuoHetavirP
0,2010,7313,584,190,1019,771,3616,098,348,2610,001sdooGllA
5,778,3315,361,253,2011,258,1517,5113,525,0310,001selbaruD
5,7010,8313,091,0010,1017,383,6619,482,842,0710,001selbaruD-noN
4,2115,3415,751,890,671,497,6318,983,959,4510,001secivreS
Energy 100,0 203,8 73,7 92,1 131,2 54,0 90,7 49,5 43,9 183,9 135,2
(1) Actual cons. = Private cons. + Public health and education.
Table 1 - Indices of per capita real expenditure, region = 100
Items
Indices of per capita real expenditure
Par
agu
ay

20
Reg
ion
(=
100)
Arg
enti
na
Bo
livia
Bra
zil
Ch
ile
Co
lom
bia
Ecu
ado
r
Per
u
Par
agu
ay
Uru
gu
ay
Ven
ezu
ela
Actual Household Consumption (1) 100,0 125,0 28,3 103,4 174,3 71,7 75,9 78,6 40,1 155,0 110,1
Food and Non-Alcoholic Beverages 100,0 148,4 42,8 79,5 178,5 89,3 100,9 117,9 66,4 150,9 146,5
Alcohol and Tobacco 100,0 195,7 19,4 74,7 185,1 119,1 66,0 62,9 41,9 229,1 133,8
Clothing and Footwear 100,0 118,8 20,0 98,5 213,3 68,2 102,2 101,4 68,3 162,6 94,4
Housing and Utilities 100,0 142,4 21,6 119,0 139,2 60,4 51,6 39,8 27,9 179,6 72,2
Household Furnishings, Equipment and Maintenance 100,0 108,2 27,6 109,1 193,1 64,4 89,7 70,1 35,9 161,9 98,2
Health 100,0 104,6 15,2 106,9 225,1 81,7 56,1 58,7 22,8 191,1 100,5
Transportation 100,0 102,2 47,1 115,2 152,0 67,3 93,9 57,8 39,9 158,4 87,2
Communication 100,0 148,2 20,3 92,7 202,0 63,0 106,2 60,7 30,2 147,0 158,3
Recreation and Culture 100,0 167,7 8,4 102,6 169,4 51,9 93,7 74,7 51,0 141,3 94,1
Education 100,0 74,1 27,0 111,6 176,0 67,7 74,0 82,3 22,8 91,9 141,4
Restaurants and Hotels 100,0 129,1 42,2 94,9 100,6 78,9 42,9 119,9 32,0 130,9 170,0
Miscellaneous Goods and Services 100,0 99,2 10,8 117,3 211,4 55,2 39,6 93,9 29,9 131,7 70,4
Health and Education 100,0 89,7 20,9 109,2 201,1 74,9 64,9 70,2 22,8 142,6 120,5
Public Health and Education 100,0 98,0 20,2 107,8 180,2 90,8 60,6 40,4 21,6 97,7 142,7
Private Household Consumption 100,0 127,5 29,1 103,0 173,7 70,0 77,3 82,1 41,8 160,3 107,2
All Goods 100,0 137,1 28,9 94,1 177,4 80,3 93,0 87,0 57,2 141,0 121,6
Durables 100,0 114,8 17,9 122,8 130,5 49,1 91,9 47,1 48,1 131,8 85,7
Non-Durables 100,0 142,1 31,4 87,6 188,0 87,3 93,2 96,0 59,3 143,0 129,7
Services 100,0 116,8 25,9 108,8 172,7 67,3 63,7 73,6 27,0 158,0 107,6
Energy 100,0 108,1 46,5 124,9 164,9 47,7 57,6 60,4 30,4 235,2 45,9
(1) Actual cons. = Private cons. + Public health and education.
Table 2 - Indices of per capita nominal expenditure, region = 100
Items
Indices of per capita nominal expenditure

21
Arg
enti
na
Bo
livia
Bra
zil
Ch
ile
Co
lom
bia
Ecu
ado
r
Per
u
Par
agu
ay
Uru
gu
ay
Ven
ezu
ela
Actual Household Consumption (1) 77,5 53,8 114,2 117,7 85,3 85,7 85,8 57,4 108,0 101,3
Food and Non-Alcoholic Beverages 84,4 64,6 100,3 116,9 107,9 95,9 99,9 61,1 99,7 126,4
Alcohol and Tobacco 88,2 90,9 92,0 132,9 119,1 111,5 132,0 77,1 129,2 99,3
Clothing and Footwear 76,9 64,8 113,9 111,7 89,6 81,0 74,8 72,6 97,9 134,9
Housing and Utilities 76,1 42,9 132,8 91,0 64,3 87,3 64,2 39,6 116,9 70,0
Household Furnishings, Equipment and Maintenance 86,5 54,3 106,3 119,7 85,6 79,3 86,0 60,9 100,1 118,3
Health 68,0 44,4 114,9 142,4 71,4 66,8 90,7 51,6 121,2 120,6
Transportation 74,4 49,1 117,8 112,7 95,8 73,1 76,7 71,8 108,0 80,2
Communication 63,2 76,8 113,8 181,7 99,3 92,9 104,0 55,2 104,1 99,1
Recreation and Culture 87,8 62,4 109,3 100,8 92,3 96,8 81,6 72,0 95,5 106,0
Education 49,1 38,4 140,5 131,3 62,1 92,1 89,5 35,9 107,1 82,2
Restaurants and Hotels 119,3 66,1 95,8 135,5 77,4 97,9 102,5 73,9 133,7 118,2
Miscellaneous Goods and Services 80,4 60,5 106,6 118,9 94,5 84,9 80,6 65,7 107,7 100,5
Health and Education 58,3 41,3 126,2 136,3 66,5 78,8 90,2 43,3 113,4 98,5
Public Health and Education 56,6 41,4 132,6 138,5 67,3 84,2 92,4 41,5 114,9 95,8
Private Household Consumption 79,4 54,9 113,0 116,4 86,7 86,2 86,6 58,9 108,8 101,0
All Goods 84,2 66,0 103,8 108,7 103,0 92,0 95,2 67,1 102,9 119,2
Durables 88,0 71,0 106,1 85,9 94,2 89,8 90,4 75,8 98,5 110,5
Non-Durables 83,5 65,0 103,2 113,1 104,3 92,3 95,9 65,6 103,7 120,6
Services 75,4 43,7 121,1 126,3 71,5 83,8 75,1 47,0 110,1 95,7
Energy 53,1 63,0 135,6 125,7 88,3 63,6 122,1 69,4 127,9 33,9
(1) Actual cons. = Private cons. + Public health and education.
Table 3 - Price level indices, Regional average = 100
Items
Price level indices

22
Arg
enti
na
Bo
livia
Bra
zil
Ch
ile
Co
lom
bia
Ecu
ado
r
Per
u
Par
agu
ay
Uru
gu
ay
Ven
ezu
ela
Actual Household Consumption (1) 1 1,927 1,235 292,9 880 0,381 1,256 1 577 11,75 940
Food and Non-Alcoholic Beverages 1 2,128 0,996 267,2 1 022 0,391 1,344 1 541 9,96 1 078
Alcohol and Tobacco 1 2,862 0,875 290,8 1 080 0,436 1,699 1 860 12,35 810
Clothing and Footwear 1 2,339 1,241 280,1 931 0,363 1,104 2 008 10,73 1 262
Housing and Utilities 1 1,566 1,463 230,6 675 0,395 0,958 1 108 12,94 662
Household Furnishings, Equipment and Maintenance 1 1,744 1,029 266,9 790 0,316 1,129 1 497 9,75 983
Health 1 1,813 1,416 403,9 840 0,338 1,514 1 615 15,02 1 277
Transportation 1 1,833 1,327 292,1 1 029 0,338 1,169 2 051 12,24 775
Communication 1 3,374 1,510 554,4 1 256 0,506 1,868 1 858 13,89 1 128
Recreation and Culture 1 1,974 1,044 221,6 841 0,380 1,056 1 745 9,18 869
Education 1 2,176 2,399 516,1 1 012 0,647 2,071 1 558 18,40 1 205
Restaurants and Hotels 1 1,538 0,673 219,1 519 0,283 0,975 1 318 9,45 713
Miscellaneous Goods and Services 1 2,089 1,111 285,2 939 0,363 1,137 1 738 11,29 899
Health and Education 1 1,966 1,814 450,6 911 0,465 1,755 1 578 16,38 1 215
Public Health and Education 1 2,034 1,963 472,0 950 0,512 1,852 1 558 17,11 1 219
Private Household Consumption 1 1,921 1,193 282,8 872 0,374 1,238 1 578 11,55 915
All Goods 1 2,176 1,033 249,1 978 0,376 1,283 1 695 10,30 1 018
Durables 1 2,242 1,011 188,4 856 0,352 1,166 1 833 9,44 904
Non-Durables 1 2,163 1,035 261,2 998 0,381 1,304 1 673 10,47 1 039
Services 1 1,610 1,346 323,1 758 0,383 1,129 1 326 12,31 913
Energy 1 3,299 2,143 457,1 1 330 0,413 2,613 2 784 20,32 460
(1) Actual cons. = Private cons. + Public health and education.
Table 4 - Purchasing power parities
Items
Purchasing power parities

23
Ave
rag
e
Arg
enti
na
Bo
livia
Bra
zil
Ch
ile
Co
lom
bia
Ecu
ado
r
Per
u
Par
agu
ay
Uru
gu
ay
Ven
ezu
ela
Actual Household Consumption (1) 100,00 100,00 100,00 100,00 100,00 100,00 100,00 100,00 100,00 100,00 100,00
Food and Non-Alcoholic Beverages 19,59 21,36 24,59 17,15 20,20 19,28 23,28 25,21 30,46 20,65 20,89
Alcohol and Tobacco 2,40 3,31 0,97 2,16 2,26 2,86 1,61 1,25 1,87 2,97 2,98
Clothing and Footwear 4,65 4,45 2,72 4,44 5,99 4,20 6,62 6,87 6,25 5,38 2,99
Housing and Utilities 16,88 19,59 16,10 16,71 17,45 18,85 11,27 11,41 16,99 18,08 16,01
Household Furnishings, Equipment and Maintenance 5,80 4,50 5,60 6,58 6,32 5,19 7,41 5,16 4,89 6,54 4,43
Health 9,30 8,88 6,04 9,56 9,94 12,66 8,83 6,57 5,87 10,23 7,13
Transportation 11,47 9,76 20,87 12,39 10,45 9,59 16,65 9,43 9,14 11,72 11,47
Communication 3,21 4,67 1,61 2,89 2,41 2,42 4,14 2,04 2,51 3,16 4,71
Recreation and Culture 4,88 5,79 1,24 5,06 5,54 3,26 5,34 4,87 4,96 5,04 3,99
Education 8,89 8,32 11,83 7,80 8,05 11,53 8,07 8,92 8,07 5,31 14,07
Restaurants and Hotels 5,28 3,54 6,40 5,77 2,65 6,40 2,61 6,74 3,27 3,60 6,98
Miscellaneous Goods and Services 7,64 5,84 2,58 9,28 9,18 5,31 4,03 9,72 4,98 6,51 4,92
Health and Education 18,19 17,35 17,51 17,38 18,14 24,35 16,91 15,45 13,71 15,95 20,47
Public Health and Education 8,36 8,97 7,71 7,50 7,34 13,41 6,79 3,99 6,22 4,96 11,44
Private Household Consumption 91,64 91,20 92,10 92,25 92,37 88,04 92,76 94,76 93,16 94,07 89,44
All Goods 42,73 43,14 35,51 42,77 47,09 39,59 48,77 42,63 52,19 40,81 40,11
Durables 7,87 6,37 3,77 10,05 8,07 4,87 9,09 4,47 7,15 7,34 5,61
Non-Durables 34,86 36,80 31,90 32,69 39,15 34,69 39,78 38,07 45,08 33,53 34,48
Services 51,68 49,63 58,17 51,28 47,72 57,85 44,35 55,30 42,52 51,67 53,45
Energy 5,58 7,06 7,81 5,68 4,95 3,58 5,72 3,01 3,51 7,16 6,95
(1) Actual cons. = Private cons. + Public health and education.
Table 5 - Real expenditure shares
Items
Real expenditure shares

24
Ave
rag
e
Arg
enti
na
Bo
livia
Bra
zil
Ch
ile/C
hile
Co
lom
bia
Ecu
ado
r
Per
u
Par
agu
ay
Uru
gu
ay
Ven
ezu
ela
Actual Household Consumption (1) 100,00 100,00 100,00 100,00 100,00 100,00 100,00 100,00 100,00 100,00 100,00
Food and Non-Alcoholic Beverages 19,59 23,26 29,56 15,05 20,06 24,38 26,05 29,38 32,42 19,06 26,06
Alcohol and Tobacco 2,40 3,76 1,64 1,74 2,55 3,99 2,09 1,92 2,51 3,55 2,92
Clothing and Footwear 4,65 4,41 3,28 4,43 5,68 4,41 6,26 5,99 7,90 4,87 3,98
Housing and Utilities 16,88 19,24 12,85 19,43 13,49 14,21 11,48 8,54 11,72 19,56 11,06
Household Furnishings, Equipment and Maintenance 5,80 5,02 5,66 6,12 6,43 5,20 6,86 5,18 5,19 6,06 5,17
Health 9,30 7,79 4,99 9,62 12,02 10,60 6,88 6,95 5,28 11,47 8,49
Transportation 11,47 9,37 19,06 12,78 10,01 10,77 14,19 8,43 11,41 11,72 9,08
Communication 3,21 3,80 2,30 2,88 3,72 2,82 4,49 2,48 2,41 3,04 4,61
Recreation and Culture 4,88 6,55 1,44 4,84 4,75 3,53 6,04 4,64 6,21 4,45 4,17
Education 8,89 5,27 8,46 9,59 8,98 8,39 8,68 9,31 5,05 5,27 11,42
Restaurants and Hotels 5,28 5,45 7,86 4,84 3,05 5,81 2,98 8,05 4,21 4,46 8,15
Miscellaneous Goods and Services 7,64 6,06 2,90 8,67 9,27 5,88 3,99 9,13 5,69 6,49 4,88
Health and Education 18,19 13,06 13,44 19,21 21,00 18,99 15,56 16,26 10,32 16,74 19,91
Public Health and Education 8,36 6,55 5,94 8,71 8,64 10,57 6,67 4,30 4,49 5,27 10,83
Private Household Consumption 91,64 93,45 94,06 91,29 91,36 89,43 93,33 95,70 95,51 94,73 89,17
All Goods 42,73 46,87 43,56 38,87 43,50 47,81 52,38 47,30 60,96 38,86 47,18
Durables 7,87 7,23 4,98 9,34 5,89 5,38 9,53 4,71 9,43 6,69 6,12
Non-Durables 34,86 39,64 38,58 29,53 37,61 42,43 42,85 42,59 51,52 32,17 41,06
Services 51,68 48,30 47,29 54,38 51,22 48,48 43,38 48,41 34,81 52,67 50,50
Energy 5,58 4,83 9,15 6,75 5,28 3,71 4,24 4,29 4,24 8,47 2,33
(1) Actual cons. = Private cons. + Public health and education.
Table 6 - Nominal expenditure shares
Items
Nominal expenditure shares
25
Reg
ion
(=
100)
Arg
enti
na
Bo
livia
Bra
zil
Ch
ile
Co
lom
bia
Ecu
ado
r
Per
u
Par
agu
ay
Uru
gu
ay
Ven
ezu
ela
Actual Household Consumption (1) 100,00 16,51 1,34 45,07 6,51 10,46 3,16 6,74 1,11 1,28 7,81
Food and Non-Alcoholic Beverages 100,00 18,01 1,69 39,45 6,71 10,30 3,76 8,68 1,73 1,35 8,33
Alcohol and Tobacco 100,00 22,72 0,54 40,43 6,12 12,44 2,11 3,50 0,87 1,58 9,68
Clothing and Footwear 100,00 15,80 0,79 43,08 8,39 9,46 4,51 9,96 1,50 1,48 5,03
Housing and Utilities 100,00 19,16 1,28 44,59 6,73 11,68 2,11 4,55 1,12 1,37 7,41
Household Furnishings, Equipment and Maintenance 100,00 12,79 1,30 51,08 7,09 9,36 4,04 6,00 0,94 1,45 5,96
Health 100,00 15,76 0,87 46,32 6,95 14,24 3,00 4,76 0,70 1,41 5,99
Transportation 100,00 14,05 2,44 48,69 5,93 8,75 4,59 5,54 0,89 1,31 7,81
Communication 100,00 24,01 0,67 40,55 4,89 7,90 4,08 4,29 0,87 1,26 11,47
Recreation and Culture 100,00 19,56 0,34 46,71 7,39 6,99 3,46 6,73 1,13 1,32 6,37
Education 100,00 15,45 1,79 39,54 5,89 13,56 2,87 6,76 1,01 0,77 12,36
Restaurants and Hotels 100,00 11,08 1,63 49,27 3,26 12,69 1,56 8,61 0,69 0,87 10,33
Miscellaneous Goods and Services 100,00 12,63 0,45 54,74 7,82 7,27 1,67 8,57 0,73 1,09 5,03
Health and Education 100,00 15,74 1,29 43,06 6,49 14,01 2,94 5,73 0,84 1,12 8,79
Public Health and Education 100,00 17,73 1,24 40,45 5,72 16,79 2,57 3,22 0,83 0,76 10,69
Private Household Consumption 100,00 16,43 1,35 45,37 6,56 10,05 3,20 6,97 1,13 1,32 7,62
All Goods 100,00 16,67 1,12 45,10 7,17 9,69 3,61 6,73 1,36 1,22 7,33
Durables 100,00 13,36 0,64 57,58 6,68 6,48 3,65 3,83 1,01 1,20 5,57
Non-Durables 100,00 17,42 1,23 42,26 7,31 10,41 3,61 7,36 1,44 1,23 7,72
Services 100,00 15,85 1,51 44,71 6,01 11,71 2,71 7,21 0,92 1,28 8,08
Energy 100,00 20,86 1,88 45,85 5,77 6,72 3,24 3,64 0,70 1,64 9,71
(1) Actual cons. = Private cons. + Public health and education.
Table 7 - Country real expenditure shares, region = 100
Items
Country real expenditure shares

26
Reg
ion
(=
100)
Arg
enti
na
Bo
livia
Bra
zil
Ch
ile
Co
lom
bia
Ecu
ado
r
Per
u
Par
agu
ay
Uru
gu
ay
Ven
ezu
ela
Actual Household Consumption (1) 100,00 12,80 0,72 51,47 7,66 8,93 2,71 5,78 0,64 1,39 7,91
Food and Non-Alcoholic Beverages 100,00 15,19 1,09 39,56 7,85 11,11 3,60 8,67 1,06 1,35 10,52
Alcohol and Tobacco 100,00 20,03 0,49 37,21 8,14 14,82 2,36 4,63 0,67 2,05 9,61
Clothing and Footwear 100,00 12,16 0,51 49,05 9,38 8,48 3,65 7,46 1,09 1,45 6,78
Housing and Utilities 100,00 14,58 0,55 59,24 6,12 7,51 1,84 2,93 0,44 1,60 5,18
Household Furnishings, Equipment and Maintenance 100,00 11,07 0,70 54,29 8,49 8,01 3,20 5,16 0,57 1,45 7,05
Health 100,00 10,71 0,39 53,22 9,90 10,17 2,00 4,32 0,36 1,71 7,22
Transportation 100,00 10,46 1,20 57,36 6,68 8,38 3,35 4,25 0,64 1,42 6,26
Communication 100,00 15,18 0,52 46,16 8,88 7,84 3,79 4,47 0,48 1,31 11,37
Recreation and Culture 100,00 17,17 0,21 51,05 7,45 6,45 3,35 5,49 0,81 1,26 6,76
Education 100,00 7,58 0,69 55,53 7,74 8,43 2,64 6,05 0,36 0,82 10,16
Restaurants and Hotels 100,00 13,22 1,07 47,21 4,42 9,82 1,53 8,82 0,51 1,17 12,21
Miscellaneous Goods and Services 100,00 10,16 0,27 58,38 9,29 6,87 1,41 6,91 0,48 1,18 5,05
Health and Education 100,00 9,18 0,53 54,35 8,84 9,32 2,32 5,17 0,36 1,27 8,66
Public Health and Education 100,00 10,03 0,51 53,64 7,92 11,29 2,16 2,97 0,34 0,87 10,25
Private Household Consumption 100,00 13,05 0,74 51,27 7,64 8,71 2,76 6,04 0,67 1,43 7,70
All Goods 100,00 14,03 0,74 46,82 7,80 9,99 3,32 6,40 0,91 1,26 8,73
Durables 100,00 11,75 0,46 61,11 5,74 6,10 3,28 3,46 0,77 1,18 6,16
Non-Durables 100,00 14,55 0,80 43,59 8,26 10,86 3,33 7,06 0,95 1,28 9,32
Services 100,00 11,96 0,66 54,15 7,59 8,37 2,27 5,41 0,43 1,41 7,73
Energy 100,00 11,07 1,18 62,19 7,25 5,93 2,06 4,44 0,49 2,10 3,29
(1) Actual cons. = Private cons. + Public health and education.
Table 8 - Country expenditure nominal shares, region = 100
Items
Country expenditure nominal shares

27
An interview with Eduardo Pereira Nunes, President of the
“Instituto Brasileiro de Geografi a e Estatistica (IBGE)”
IBGE employs over 8,500 staff, including 1,500 part-time contractors, and offers an undergradu-ate and a graduate degree in statistics. It has 530 branch offi ces covering 5,564 cities throughout Brazil. It offers graduate degrees in statistics.
What does the ICP represent for you, as a national accountant and as President of your institution?
E. P. Nunes: As someone who was involved in the discussions that followed the last round of the ICP and saw the program reaching this stage, I am enormously happy with the results. I believe my satisfaction is commensurate with the extraordinary efforts made fi rst and foremost by the ten countries that took part in this region’s program, and with the outstanding coordinating role played by Statistics Canada and Economic Commission for Latin America and the Caribbean (ECLAC), sup-ported by the Global Offi ce of the World Bank. And I would like to record that we have taken a giant step to make inter-country comparisons of economic variables possible and meaningful. But I am fully conscious that we must improve our own statistics in a number of important respects. This is a realization that came to light as a result of the systematic comparisons with other countries that the program imposed on us and for which I am truly grateful.
What are for you the fundamental changes revealed by the 2005 ICP round as distinct from the pre-vious ones?
E. P. Nunes: It helped us master a discipline which we did not handle as effectively as we should. The machinery for technical coordination deployed for this program – ensuring that transparency and mutual trust was the order of the day and what was compared was always like with like – made it imperative that all respects of data collection be looked at with great care. Indeed, we used where necessary digital photography of selected goods and places of purchase. Moreover, our very frequent technical meetings in order to discuss whether or not the right products had been selected and priced; the methods used to establish prices in more complex situations; all of these made it possible for a systematic approach to quality control that many of the countries taking part were not used to and from which I am sure all benefi ted greatly.
How did the IBGE fi nance its participation to this ICP round?
E. P. Nunes: With its own resources. Initially, we thought that no more than marginal funding was required. After all, Brazil has a very broad-ranging CPI, based on an extensive basket of goods and services. We believed that the basket was ample enough to serve as a frame from which the subset of goods and services required for the ICP would be chosen. Subsequently we realized that not only did we have to supplement the basket with a number of new products but we also had to gain access

28
to outlets which were hitherto excluded from our purview. The consequence was that the funding required was far from marginal. But we decided that we should absorb those costs in the interest of improving the skills and the knowledge of our fi eld-force and our price statisticians. The fi nancial cost may have been unforeseen but whatever it cost was worth our while. We treated it not as a current expenditure but as an investment in the quality of our young professionals.
Do you think this program will have a particular impact on other IBGE programs?
E. P. Nunes: Of course. The fi rst of the many positive effects that the program has on us and on any of the regional statistical offi ces is that it allows us to make well-founded inter-country comparisons at a critical time in our region’s history. Do not forget that so many of the countries in our region opened up their doors to increasing trade with the rest of the world. The dynamic of economic chan-ge demands greater awareness of how our neighbors estimate their economic aggregates and deal with the computing of price indexes which, in turn, affects our own methods and the improvement thereof. But the effect to which I attach greatest importance is what the program leaves behind in terms of well-trained professionals much more capable to evaluate, analyze, interpret and compare -- be it prices, price indexes or national accounting aggregates.
The national statistical offi ce of Canada was directly involved together with ECLAC and acted as the executing agency for the ICP in Latin America. How would you assess the experience?
E. P. Nunes: No matter how motivated the national institutes of our region, the program requires a coordinating agency, preferably one drawn from outside the circle of national participants. In our re-gion, we are all used to ECLAC but it was a novel experience for us to work with a statistical agency like Statistics Canada. I was enormously impressed with the degree of professionalism introduced by the Canadian offi ce and how well the regional coordinators worked together. Naturally, the perspec-tive brought to bear by a fellow producer of national statistics helped us greatly to identify weaknes-ses in our region’s systems of national accounts and prices.
Looking ahead, do you think a second round of this program should proceed?
E. P. Nunes: I am concerned at the speed with which relative prices have been changing and the constraints that such change imposes on the timetable we should observe for future rounds of the program. Take as an example what has been happening to the prices of crude oil. At the time of the previous round of the ICP, prices were of the order of USD 25. During our year of reference – 2005 – prices reached USD 50 but no other major component of the standard basket of goods and services showed an even remotely comparable increase. If we were collecting prices today, oil would have clocked in at USD 70 plus thus introducing yet another very substantial change in relative prices. It is our responsibility as suppliers of offi cial statistics to record, analyze and interpret such changes rather than leaving them unobserved because we did not bother to mount the right program.
Let me not ignore yet another collective undertaking assumed by the community of statistical agencies at the United Nations – to keep up by measuring and monitoring with the millennium goals through the production of relevant information. Goal 19 foresees a reduction of half in the global population trying to subsist on incomes of less than USD 1 per capita and per diem. But we simply cannot honor the commitment unless and until we are capable of tracking reliably the purchasing power of USD 1 in different parts of the world.

29
What in your opinion should be done differently?
E. P. Nunes: Taking stock of what we learned in this round of the ICP is imperative. We can readily agree that we learned a great deal about the way in which prices should be specifi ed, collected, and processed. Moreover, we gained additional knowledge through confrontation of our numbers with those of neighboring countries and were greatly helped by the coordinators’ efforts to harmonize seemingly inconsistent results. Unfortunately, the same process did not take place with the natio-nal accounts. Admittedly we did not have the same freedom with the national accounts as we had with prices. The former exist and were not going to be changed especially for this occasion. But the fact is that we faced troublesome inconsistencies - at low levels of aggregation but troublesome nonetheless. I look forward to a forthcoming round where after thorough preparation we engage in a process of systematic comparison of the most elementary components of the national accounts, a process analogous to what we did for prices, and we fi nd out just as much about our respective strengths and weaknesses.
Is there anything you would like to add in conclusion?
E. P Nunes: The most important point I would like to stress is the obvious and pressing need to make out of this project an ongoing program. We must get a return on the enormous effort put into this round of the ICP. The next round should start immediately after this round comes to a fi nish. Preparation ought to start in 2007; data collection in 2008 and publication in 2009. If we can secure the continuing cooperation of Statistics Canada and ECLAC, I believe we should be capable of making ICP a permanent feature of our national statistical program.


31
National Institutions
Argentina: Instituto Nacional de Estadística y Censos, INDEC
Bolivia: Instituto Nacional de Estadística, INE
Brazil: Instituto Brasileiro de Geografi a e Estatística, IBGE
Canada: Statistics Canada
Chile: Instituto Nacional de Estadísticas, INE; Banco Central de Chile
Colombia: Departamento Administrativo Nacional de Estadística, DANE
Ecuador: Instituto Nacional de Estadística y Censos Del Ecuador, INEC; Banco Central Del Ecuador
Paraguay: Banco Central Del Paraguay
Peru: Instituto Nacional de Estadística e Informática, INEI
Uruguay: Instituto Nacional de Estadística, INE; Banco Central del Uruguay
Venezuela: Banco Central de Venezuela
International Institutions
World Bank
Economic Commission for Latin America and the Caribbean, ECLAC
Acknowledgements
The text and the tables in this publication were authored by a team led by Jacob Ryten (Senior Ad-visor to the World Bank) and Louis Marc Ducharme (Statistics Canada) assisted by Yonas Biru (World Bank) and Heber Camelo (ECLAC). The publication was prepared by the Survey Directorate and the International Relations Section of the IBGE.
Acknowledgements