Embed Size (px)
Citation preview

Fuel 93 (2012) 658–669
Contents lists available at SciVerse ScienceDirect
Fuel
journal homepage: www.elsevier .com/locate / fuel
PC-SAFT characterization of crude oils and modeling of asphaltene phase behavior
Sai R. Panuganti a, Francisco M. Vargas b,⇑, Doris L. Gonzalez c, Anjushri S. Kurup a, Walter G. Chapman a
a Department of Chemical and Biomolecular Engineering, Rice University, Houston, TX 77005, USAb Department of Chemical Engineering, Petroleum Institute, Abu Dhabi, United Arab Emiratesc Data Quality Group, Schlumberger, Houston, TX 77056, USA
a r t i c l e i n f o a b s t r a c t
Article history:Received 11 February 2011Received in revised form 9 September 2011Accepted 13 September 2011Available online 8 October 2011
Keywords:CharacterizeCrude oilBubble pressureAsphaltene onset pressurePhase plot
0016-2361/$ - see front matter � 2011 Elsevier Ltd. Adoi:10.1016/j.fuel.2011.09.028
⇑ Corresponding author. Tel.: +971 2 607 5456.E-mail addresses: [email protected] (S.R. Panuganti), fv
[email protected] (D.L. Gonzalez), [email protected] (W.G. Chapman).
Asphaltenes are the heaviest and most polarizable components of crude oil. The phase behavior of thesepolydisperse components is important in both the upstream and downstream processing of crude oilbecause of their potential to precipitate, deposit and plug pipelines and production equipment. Predictingflow assurance issues caused by asphaltenes requires the ability to model the phase behavior of asphalt-enes as a function of temperature, pressure, and composition. In this work we present a detailed proce-dure to characterize crude oil and plot asphaltene phase envelope, using the Perturbed Chain form of theStatistical Associating Fluid Theory (PC-SAFT). This work also demonstrates that the proposed procedurecan model the asphaltene thermodynamic phase behavior better than using a cubic equation of state typ-ically used in the industry, even with compositional data as low as C9+.
The results obtained with the proposed characterization method show a remarkable matching with theexperimental data points for both the bubble point and asphaltene precipitation onset curves. A widerange of temperatures, pressures and gas injection percentages have been tested. In this work, the con-cept of lower asphaltene onset pressure is also clarified and a new representation of asphaltene phaseplot is presented. The results obtained in this work are very promising in providing better tools to modelasphaltene phase behavior.
� 2011 Elsevier Ltd. All rights reserved.
1. Introduction
Asphaltenes are the heaviest and most polarizable fraction ofcrude oil [1]. They are operationally defined in terms of their solu-bility as the components of crude oil that are completely misciblein aromatic solvents, such as benzene, toluene or xylenes, butinsoluble in light paraffinic solvents, such as n-pentane orn-heptane at ambient conditions [2,3]. Asphaltenes are of particu-lar interest to the petroleum industry because of their depositiontendencies in production equipment that cause considerable pro-duction costs [4]. In addition, precipitated asphaltenes impart highviscosity to crude oils, negatively impacting production [5].
Among the flow assurance problems in the Middle East, asphal-tene deposition in production wells are one of the major concerns[6]. Hence, as a starting step prediction of asphaltene precipitationis important towards understanding deposition problems [7].Tendency of asphaltene to precipitate can be best understood fromits phase behavior with respect to pressure, temperature and com-position of the system. However, a typical crude oil has numerouscomponents and computing the phase behavior by considering
ll rights reserved.
[email protected] (F.M. Vargas),[email protected] (A.S. Kurup),
these components individually becomes computationally expen-sive. On the contrary, characterizing the oil as a mixture of well de-fined fractions that represent blends of similar components in oil,instead of handling the components individually can aid in reduc-ing the computational cost significantly.
One of the earliest studies on crude oil characterization datesback to 1978 by Katz and Firoozabadi [8] where boiling point tem-peratures were used for separating the carbon number fraction.The cut points were determined from the boiling points of n-paraf-fins. The resulting densities are for paraffinic oils and thereforevery low [9]. Later work (1983) on characterizing crude oils byWhitson [10] subdivided crude oils into different single carbonnumber (SCN). This has been the most widely applied procedurefor upstream applications. It is based on average boiling point ofeach SCN cut and uses correlations from Riazi and Daubert pub-lished in 1980 [11]. Typical representation of Whitson character-ization for a Middle East light crude oil (crude A) is presented inTable 1. In this case the plus fraction component (C36+) representsall higher molecular weight components above C36.
The reservoir fluid which is monophasic is usually flashedfrom reservoir pressure and temperature to ambient conditionsto yield residual liquid/stock tank oil (STO) and evolved gasphase/flashed gas which are then analyzed for composition usinggas chromatography. The live oil composition is computed usinggas-to-oil ratio (GOR).
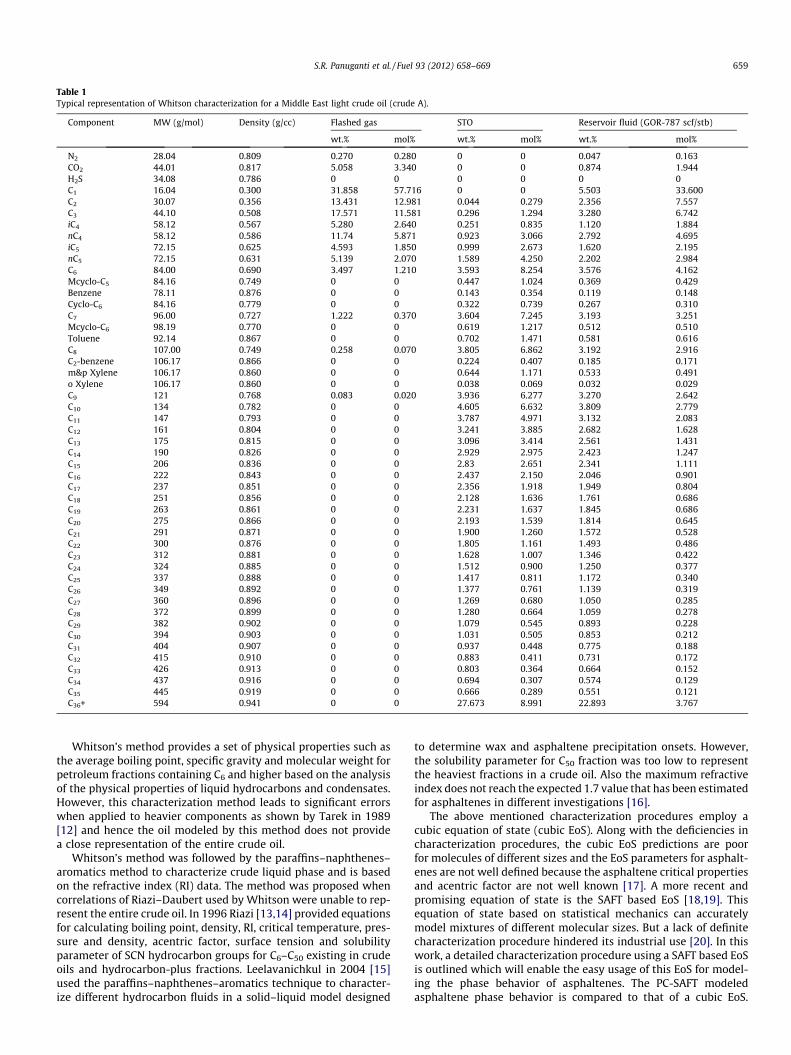
Table 1Typical representation of Whitson characterization for a Middle East light crude oil (crude A).
Component MW (g/mol) Density (g/cc) Flashed gas STO Reservoir fluid (GOR-787 scf/stb)
wt.% mol% wt.% mol% wt.% mol%
N2 28.04 0.809 0.270 0.280 0 0 0.047 0.163CO2 44.01 0.817 5.058 3.340 0 0 0.874 1.944H2S 34.08 0.786 0 0 0 0 0 0C1 16.04 0.300 31.858 57.716 0 0 5.503 33.600C2 30.07 0.356 13.431 12.981 0.044 0.279 2.356 7.557C3 44.10 0.508 17.571 11.581 0.296 1.294 3.280 6.742iC4 58.12 0.567 5.280 2.640 0.251 0.835 1.120 1.884nC4 58.12 0.586 11.74 5.871 0.923 3.066 2.792 4.695iC5 72.15 0.625 4.593 1.850 0.999 2.673 1.620 2.195nC5 72.15 0.631 5.139 2.070 1.589 4.250 2.202 2.984C6 84.00 0.690 3.497 1.210 3.593 8.254 3.576 4.162Mcyclo-C5 84.16 0.749 0 0 0.447 1.024 0.369 0.429Benzene 78.11 0.876 0 0 0.143 0.354 0.119 0.148Cyclo-C6 84.16 0.779 0 0 0.322 0.739 0.267 0.310C7 96.00 0.727 1.222 0.370 3.604 7.245 3.193 3.251Mcyclo-C6 98.19 0.770 0 0 0.619 1.217 0.512 0.510Toluene 92.14 0.867 0 0 0.702 1.471 0.581 0.616C8 107.00 0.749 0.258 0.070 3.805 6.862 3.192 2.916C2-benzene 106.17 0.866 0 0 0.224 0.407 0.185 0.171m&p Xylene 106.17 0.860 0 0 0.644 1.171 0.533 0.491o Xylene 106.17 0.860 0 0 0.038 0.069 0.032 0.029C9 121 0.768 0.083 0.020 3.936 6.277 3.270 2.642C10 134 0.782 0 0 4.605 6.632 3.809 2.779C11 147 0.793 0 0 3.787 4.971 3.132 2.083C12 161 0.804 0 0 3.241 3.885 2.682 1.628C13 175 0.815 0 0 3.096 3.414 2.561 1.431C14 190 0.826 0 0 2.929 2.975 2.423 1.247C15 206 0.836 0 0 2.83 2.651 2.341 1.111C16 222 0.843 0 0 2.437 2.150 2.046 0.901C17 237 0.851 0 0 2.356 1.918 1.949 0.804C18 251 0.856 0 0 2.128 1.636 1.761 0.686C19 263 0.861 0 0 2.231 1.637 1.845 0.686C20 275 0.866 0 0 2.193 1.539 1.814 0.645C21 291 0.871 0 0 1.900 1.260 1.572 0.528C22 300 0.876 0 0 1.805 1.161 1.493 0.486C23 312 0.881 0 0 1.628 1.007 1.346 0.422C24 324 0.885 0 0 1.512 0.900 1.250 0.377C25 337 0.888 0 0 1.417 0.811 1.172 0.340C26 349 0.892 0 0 1.377 0.761 1.139 0.319C27 360 0.896 0 0 1.269 0.680 1.050 0.285C28 372 0.899 0 0 1.280 0.664 1.059 0.278C29 382 0.902 0 0 1.079 0.545 0.893 0.228C30 394 0.903 0 0 1.031 0.505 0.853 0.212C31 404 0.907 0 0 0.937 0.448 0.775 0.188C32 415 0.910 0 0 0.883 0.411 0.731 0.172C33 426 0.913 0 0 0.803 0.364 0.664 0.152C34 437 0.916 0 0 0.694 0.307 0.574 0.129C35 445 0.919 0 0 0.666 0.289 0.551 0.121C36+ 594 0.941 0 0 27.673 8.991 22.893 3.767
S.R. Panuganti et al. / Fuel 93 (2012) 658–669 659
Whitson’s method provides a set of physical properties such asthe average boiling point, specific gravity and molecular weight forpetroleum fractions containing C6 and higher based on the analysisof the physical properties of liquid hydrocarbons and condensates.However, this characterization method leads to significant errorswhen applied to heavier components as shown by Tarek in 1989[12] and hence the oil modeled by this method does not providea close representation of the entire crude oil.
Whitson’s method was followed by the paraffins–naphthenes–aromatics method to characterize crude liquid phase and is basedon the refractive index (RI) data. The method was proposed whencorrelations of Riazi–Daubert used by Whitson were unable to rep-resent the entire crude oil. In 1996 Riazi [13,14] provided equationsfor calculating boiling point, density, RI, critical temperature, pres-sure and density, acentric factor, surface tension and solubilityparameter of SCN hydrocarbon groups for C6–C50 existing in crudeoils and hydrocarbon-plus fractions. Leelavanichkul in 2004 [15]used the paraffins–naphthenes–aromatics technique to character-ize different hydrocarbon fluids in a solid–liquid model designed
to determine wax and asphaltene precipitation onsets. However,the solubility parameter for C50 fraction was too low to representthe heaviest fractions in a crude oil. Also the maximum refractiveindex does not reach the expected 1.7 value that has been estimatedfor asphaltenes in different investigations [16].
The above mentioned characterization procedures employ acubic equation of state (cubic EoS). Along with the deficiencies incharacterization procedures, the cubic EoS predictions are poorfor molecules of different sizes and the EoS parameters for asphalt-enes are not well defined because the asphaltene critical propertiesand acentric factor are not well known [17]. A more recent andpromising equation of state is the SAFT based EoS [18,19]. Thisequation of state based on statistical mechanics can accuratelymodel mixtures of different molecular sizes. But a lack of definitecharacterization procedure hindered its industrial use [20]. In thiswork, a detailed characterization procedure using a SAFT based EoSis outlined which will enable the easy usage of this EoS for model-ing the phase behavior of asphaltenes. The PC-SAFT modeledasphaltene phase behavior is compared to that of a cubic EoS.
660 S.R. Panuganti et al. / Fuel 93 (2012) 658–669
The phase plot is extended further to include the lower onset ofasphaltene and the amount of asphaltene precipitated.
The characterization procedure is an extension of work reportedby Ting in 2003 [21]. This work uses the perturbed chain version ofSAFT (PC-SAFT), developed by Gross and Sadowski [22]. It has beendemonstrated that PC-SAFT can accurately predict the phasebehavior of high molecular weight compounds [23] similar to thelarge asphaltene molecules, and PC-SAFT is also available in com-mercial simulators such as Multiflash of InfoChem and VLXE ofVLXE Aps.
2. Characterization methodology
Carbon content in a crude oil is almost entirely present as satu-rates and unsaturates [24]. This identity is made use of in the pro-posed characterization procedure to model crude oil with a smallnumber of components. The characterized system consists of gasphase and liquid phase which are then recombined according toGOR to simulate live oil.
2.1. Gas components
The gas phase is characterized to consist of seven components:N2, CO2, H2S, methane, ethane, propane and heavy gas pseudo-component that represents a mixture of hydrocarbons heavier thanpropane. It has been observed that the light components in oil af-fect both the bubble pressure and asphaltene onset pressure (AOP)significantly [25]. Hence in this work, the lightest fractions of oilwill be considered individually which should result in better pre-diction of asphaltene onset pressures. Also, the injected gas typi-cally used for enhanced oil recovery (EOR) purposes is generallyrich in lighter hydrocarbons and hence the methodology proposedin this work will enable good predictions even for these gas injec-tion situations and will be demonstrated in the results and discus-sion section.
2.2. Liquid components
The liquid fraction characterization into saturates, aromat-ics + resins (A + R) and asphaltenes is based on the STO composi-tion and the saturates, aromatics, resins and asphaltenes (SARA)analysis.
2.2.1. Saturates pseudo-componentThe saturates pseudo-component represents normal alkanes
(n-paraffins), branched alkanes (iso-paraffins) and cyclo-alkanes(naphthenes) present in the stock tank oil. They are defined asthe fraction of STO soluble at room temperature in n-heptane.
2.2.2. Aromatics + resins pseudo-componentIn the SARA analysis of STO, aromatics are determined by adsorp-
tion chromatography, typically from silica or silica/alumina and res-ins from clay packed column adsorption. The total amount ofaromatics and resins fraction distribute along the liquid phase, pro-portionally with the saturates fraction as dictated by the SARA anal-ysis. The aromatics and resin fractions are combined into a singlelumped pseudo-component defined in terms of the degree of aromaticity (c). This parameter determines the tendency of the aromat-ics + resins pseudo-component to behave as a poly-nuclear-aro-matic (PNA) (c = 1) or as a benzene derivative component (c = 0)[26]. In the characterization procedure of different crude oils, thearomaticity value is adjusted to meet the saturation pressure anddensity of the crude oil. The aromaticity value is thus typically ad-justed between 0 and 1.
2.2.3. AsphaltenesAsphaltenes, as mentioned before, are defined by their solubil-
ity. Asphaltenes exist as pre-aggregated molecules even in goodsolvents such as toluene [27,28]. Hence, in this work, the averagemolecular weight (MW) for such nano-sized pre-aggregatedasphaltene is considered as 1700 g/mol [21,25,29]. Variations inasphaltene parameters have negligible effect on saturation pres-sures and density of crude oil, because asphaltenes have verylow vapor pressure and are generally present in small amountsin crude oil.
2.3. The following is the characterization procedure
2.3.1. Characterization of flashed gasThe flashed gas is modeled as a mixture of seven compounds:
N2, CO2, H2S, C1 (methane), C2 (ethane), C3 (propane) and heavygas (lumped C4+ components). Benzene, toluene and xylene arenot added in the compositional analysis of flashed gas since theyare present in very small quantities and hence do not significantlyimpact the predictions. Moreover, these components belong to thearomatics class and cannot be lumped into the heavy gas fractioncontaining saturates. Considering these components separately in-creases the number of components in the modeled gas increasingthe computational time without significant advantage. Table 2 rep-resents the characterized gas phase of crude oil A.
2.3.2. Characterization of STOWhile characterizing the liquid phase, the mole percentage of
compositional data is converted to weight percentage to matchwith the SARA data. From a typical crude oil composition data,all the components that are C9 and above are lumped into C9+ frac-tion with an average MW. As discussed before, the asphaltene MWis presumed as 1700 g/mol. The C9+ MW of the saturates and aro-matics + resins pseudo components are assumed such that the STOMW and C9+ average MW are matched. Amounts of C9+ saturates,A + R and asphaltenes pseudo-components are inputted such thatthe total weight percentages of saturates, aromatics plus resinsand asphaltene match the content reported in SARA. Table 3 showsthe characterized STO of crude oil A.
Gas-to-oil ratio which is operationally specified in scf/stb or m3/m3 is converted in terms of (moles of gas)/(moles of liquid). With abasis of total moles of live oil as 100, individual moles contributionfrom components towards flashed gas and STO are calculated andhence the mole percentage of all components in live oil. Table 4 isthe representation of characterized live oil of crude A with itscomponents.
2.3.3. Parameters estimationIt is established by the works of Hirasaki and Buckley that it is
not polarity but polarizability that dominates asphaltene phasebehavior [16,30]. Because of this, the association term in SAFT isnot used in this asphaltene modeling work and the PC-SAFT EoS re-quires just three parameters for each non-associating component.These parameters are the temperature-independent diameter ofeach molecular segment (r), the number of segments per molecule(m), and the segment–segment dispersion energy (e/k).
PC-SAFT parameters (m, r and e/k) for N2 to C3 are pre definedthrough the works of Gross and Gonzalez separately [22,26] andare summarized in Table 5. PC-SAFT parameters for heavy gas/sat-urates, aromatics + resins are also well established through thework of Gonzalez and Ting [26,31]. The correlations are shown inFig. 1 and summarized in Table 6. The parameter of aromaticity(c) used in these correlations determines the aromatics + resinspseudo-component tendency to behave as a poly-nuclear-aromatic(PNA) (c = 1) or as a benzene derivative component (c = 0).

Table 3Characterized stock tank oil for crude A.
Component MW(g/mol)
Basis 100 gof STO (mass %)
Saturates Aromatics + resins Asphaltenes
Mass (g) mol% Mass (g) mol% Component MW Mass mole
N2 28.04 0 0 0 0 0 Asphaltenes 1700 2.8 0.0016CO2 44.01 0 0 0 0 0H2S 34.08 0 0 0 0 0C1 16.04 0 0 0 0 0C2 30.07 0.04 0.04 0.37 0 0C3 44.10 0.30 0.30 1.70 0 0iC4 58.12 0.25 0.25 1.10 0 0nC4 58.12 0.92 0.92 4.03 0 0iC5 72.15 1.00 1.00 3.52 0 0nC5 72.15 1.59 1.59 5.60 0 0C6 84.00 3.59 3.59 10.87 0 0Mcyclo-C5 84.16 0.45 0.45 1.35 0 0Benzene 78.11 0.14 0 0 0.14 1.50Cyclo-C6 84.16 0.32 0.32 0.97 0 0C7 96.00 3.60 3.60 9.54 0 0Mcyclo-C6 98.19 0.62 0.62 1.60 0 0Toluene 92.14 0.70 0 0 0.70 6.20C8 107 3.80 3.80 9.04 0 0C2-benzene 106.00 0.22 0 0 0.22 1.72m&p Xylene 106.17 0.64 0 0 0.64 4.94o Xylene 106.17 0.04 0 0 0.04 0.29C9+ 268.4 81.72 49.5 50.31 29.42 85.36
C9 + Sat MW 250 C9 + Sat MW 280.6
Table 2Characterized gas phase for crude A.
Flashed gas Modeled gas
Component MW mol% Component MW mol%
N2 28.04 0.28 N2 28.04 0.29CO2 44.01 3.34 CO2 44.01 3.59H2S 34.08 0.00 H2S 34.08 0.00C1 16.04 57.72 C1 16.04 59.79C2 30.07 12.98 C2 30.07 13.00C3 44.10 11.58 C3 44.10 10.36iC4 58.12 2.64 Heavy gas 65.4 14.08nC4 58.12 5.87iC5 72.15 1.85nC5 72.15 2.07C6 84.00 1.21Mcyclo-C5 84.16 0.00Benzene 78.11 0.00Cyclo-C6 84.16 0.00C7 96.00 0.37Mcyclo-C6 98.19 0.00Toluene 92.14 0.00C8 107.00 0.07C2-benzene 106.17 0.00m&p Xylene 106.17 0.00o Xylene 106.17 0.00C9 121 0.02
S.R. Panuganti et al. / Fuel 93 (2012) 658–669 661
Initially PC-SAFT parameters for asphaltenes are set as: m = 33,r = 4.3 and e/k = 400 [32]. The constant set of PC-SAFT temperatureindependent binary interaction parameters (Kij) are well estab-lished (Table 7) by adjusting binary vapor–liquid equilibrium forthe combination of pure components. The references in Table 7indicate the data used to establish interaction parameters. Withall the initial parameters set, density of crude oil is calculated usingPC-SAFT. Accordingly, aromaticity is adjusted to match the givendensity and bubble pressure simultaneously. Only after the aroma-ticity is set, PC-SAFT parameters of asphaltene are adjusted tomatch the experimentally observed onset pressures.
The asphaltene onset pressure (AOP) is the cloud point at afixed temperature for which the crude oil will split up into 2 li-quid phases of asphaltene rich and lean phases [65]. Such mea-
surements can involve depressurization of live oil or titration ofdead oil with a precipitant. In order to match a given set ofasphaltene onset pressure, asphaltene PC-SAFT parameters canbe varied according to the selection rules proposed by Ting [31].It has been observed that experimental errors while calculatingAOP using the near infrared technique (NIR) vary between±250 psia.
Table 8 summarizes the adjusted parameters.
3. Results and discussion
In the current study three crude oils (A, B and C) are considered.The properties of the crudes are listed in Table 9. Crude oils A, B

Table 4Characterized live oil of crude A as a combination of nine components.
Component MW(g/mol)
Contributionfrom gas (moles)
Contribution fromSTO (moles)
Moles in live oil Characterized live oil
Basis 100
N2 28.04 0.163 0 0.163CO2 44.01 1.944 0 1.944C1 16.04 33.600 0 33.600C2 30.07 7.557 0 7.557C3 44.10 6.742 0 6.742Heavy gas 65.49 8.198 0 8.198Saturates 167.68 0 31.743 31.743Aromatics + resins 253.79 0 9.907 9.907Asphaltenes 1700 0 0.133 0.133
Table 5PC-SAFT parameters for light components in crude oil [22].
Component m r (A) e/k (K)
N2 1.206 3.313 90.96CO2 2.073 2.785 169.21H2S 1.6517 3.0737 227.34C1 1.000 3.704 150.03C2 1.607 3.520 191.42C3 2.002 3.618 208.11
662 S.R. Panuganti et al. / Fuel 93 (2012) 658–669
and C are similar in nature, given their location. The PC-SAFT char-acterized crude oils A, B and C along with the parameters are re-ported in Tables 10–12 respectively. It can be noted that theasphaltene PC-SAFT parameters differ between the oils becauseasphaltenes of different crude oils behave differently [66].
Fig. 1. Variation of PC-SAFT parameters for different homologous series [26].
3.1. PC-SAFT parameter estimation
The previous PC-SAFT characterization for crude oil lacked acomplete experimental data [25]. Here, we report a new character-ization procedure when minimum data is available. Ethane (C2)and propane (C3) constitute almost 20% of flashed gas (from Table2) and injected gas (N2-0.4%, CO2-3.9%, C1-71.4%, C2-12%, C3-7.2%,heavy gas-5.1%; all reported in mole percentage). Previously eth-ane and propane were lumped along with heavy gas even thoughthese gases had significant concentration. Now they are consideredseparately giving more flexibility in the binary interaction param-eters and hence a better parameter estimation. Previously all singlecarbon number (SCN) fractions even if present as high as C35+,were individually split into saturates, aromatics + resins governedby SARA data with asphaltenes appearing only in the heaviest frac-tion of SCN [67]. Then they were regrouped into saturates, aromat-ics and resins components. Now, SCN after xylenes are lumped intoone fraction and then split according to SARA analysis therebyreducing the computation time and the requirement to defineSCN beyond C9. Comparison between old and new PC-SAFT charac-terization results for crude A is represented using Fig. 2 where thediscontinuous line represents the predictions made using the oldPC-SAFT characterization method and the continuous line repre-sents the predictions made with the new characterizationprocedure.

Table 6PC-SAFT correlations observed in Fig. 1 can be summarized as below [26].
Correlation for saturates Aromatics + resins pseudo component (c is aromaticity)parameter = (1 � c)(benzene derivatives correlation) + c(PNA correlation)
m = (0.0257 �MW) + 0.8444 m = (1 � c)(0.0223 �MW + 0.751) + c(0.0101 �MW + 1.7296)
rðAÞ ¼ 4:047� 4:8013�Ln MWð ÞMW
rðAÞ ¼ ð1� cÞ 4:1377� 38:1483MW
� �þ c 4:6169� 93:98
MW
� �
Lnðe=kÞ ¼ 5:5769� 9:523MW ; K e=k ¼ ð1� cÞ 0:00436 �MWþ 283:93ð Þ þ c 508� 234100
MWð Þ1:5
� �; K
Table 7PC-SAFT temperature independent binary interaction parameters (Kij) for a crude oil.
Component N2 CO2 H2S C1 C2 C3 Heavy gas Saturates Aromatics + resins Asphaltenes
N2 0 0 [33] 0.09 [34] 0.03 [35] 0.04 [36] 0.06 0.075 [37] 0.14 [38] 0.158 [39] 0.16CO2 0 0.0678 [40] 0.05 [41] 0.097 [42] 0.1 [43] 0.12 [44] 0.13 [45] 0.1 [46] 0.1 [26]H2S 0 0.062 [47] 0.058 [48] 0.053 [49] 0.07 [50] 0.09 [51] 0.015 [52] 0.015C1 0 0 [53] 0 [54] 0.03 [55] 0.03 [56] 0.029 [57] 0.07C2 0 0 [58] 0.02 0.012 [59] 0.025 [60] 0.06C3 0 0.015 [61] 0.01 0.01 [62] 0.01Heavy gas 0 0.005 [63] 0.012 [64] 0.01 [26]Saturates 0 0.007 [62] �0.004Aromatics + resins 0 0 [26]Asphaltenes 0
Table 8Adjusted parameters.
Parameter Purpose Remarks
Aromaticity To match densityand bubblepressure
Density and bubblepressure are matchedsimultaneously
The three PC-SAFTasphaltene parameters(m, r and e/k)
To matchasphaltene onsetpressure
To be estimated only afteraromaticity is set
Table 9Properties of crude oils A, B and C.
Crude A Crude B Crude C
GOR (scf/stb) 787 798 852MW of reservoir fluid (g/mol) 97.750 96.15 92.78MW of flashed gas (g/mol) 29.064 28.54 30.24MW of STO (g/mol) 193 191 182STO density (g/cc) 0.823 0.823 0.817Saturates (wt%) 66.26 75.56 73.42Aromatics (wt%) 25.59 20.08 19.32Resins (wt%) 5.35 4.13 7.05Asphaltene (wt%) 2.8 0.21 0.17
Table 10PC-SAFT characterized crude A.
Component MW (g/mol) mol%
N2 28.04 0.163CO2 44.01 1.944C1 16.04 33.600C2 30.07 7.557C3 44.10 6.742Heavy gas 65.49 8.198Saturates 167.68 31.743Aromatics + resins (c = 0.0) 253.79 9.907Asphaltenes 1700.00 0.133
S.R. Panuganti et al. / Fuel 93 (2012) 658–669 663
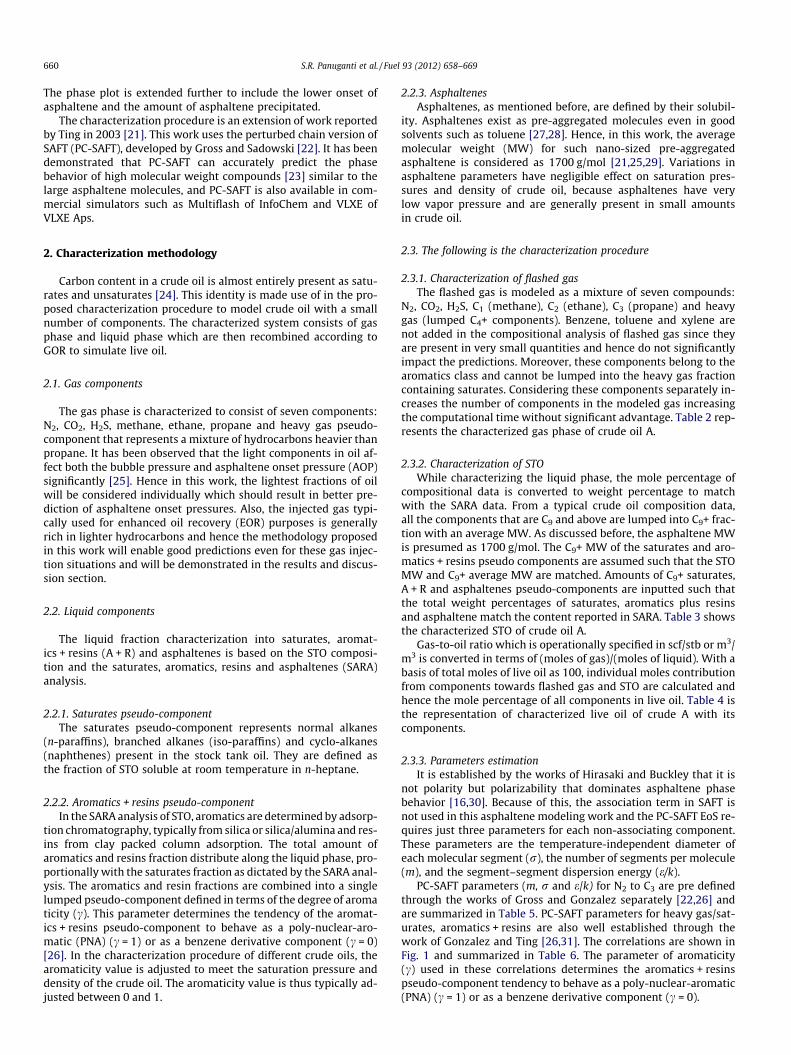
3.2. Comparison of cubic and PC-SAFT EoS
Despite their poor prediction of asphaltene properties, cubicEoS [68] are widely used in the oil industry due to the simplicityof models. However, it is seen that the parameters fit using a cubicequation of state for a particular data set fails to predict anothersituation for the same well. This is demonstrated in the presentwork. Employing the well optimized characterization procedure[20] available in PVT-Sim (Version 18) from Calsep, crude B is char-acterized and parameters are fit to the saturation pressures andasphaltene onset pressures for various temperatures for this oilwith 5% gas injection (mol%) using an SRK with Peneloux correc-tion (discontinuous line in Fig. 3B). The same parameters are thenused to predict the saturation pressure and temperature depen-dence of asphaltene onset pressure for different amounts of gas in-jected. Crude B is also characterized using the proposed PC-SAFTcharacterization method. Similar to the cubic EoS, the PC-SAFTparameters are obtained by estimating the EoS predictions toexperimental data of saturation and onset pressures for oil with5% gas injection (mol%) (continuous line in Fig. 3B). The same setof parameters was then used to predict the phase behavior for dif-ferent injected gas amounts. PC-SAFT and the cubic EoS character-ization are plotted together for each injected gas amounts and thepredictions made by the EoS are compared in Fig. 3A, C and D. Wecan see that only PC-SAFT does a very good job in predicting thephase behavior of asphaltenes for various gas injection amounts.
PC-SAFT parameters
m r (A) e/k (K)
1.206 3.313 90.962.073 2.785 169.211.000 3.704 150.031.607 3.520 191.422.002 3.618 208.112.530 3.740 228.515.150 3.900 249.696.410 3.990 285.00
32.998 4.203 353.50

Table 11PC-SAFT characterized crude B.
Component MW (g/mol) mol% PC-SAFT parameters
m r (A) e/k (K)
N2 28.04 0.169 1.206 3.313 90.96CO2 44.01 2.096 2.073 2.785 169.21C1 16.04 34.865 1.000 3.704 150.03C2 30.07 7.578 1.607 3.520 191.42C3 44.10 6.042 2.002 3.618 208.11Heavy gas 67.12 7.560 2.570 3.750 229.32Saturates 176.08 34.152 5.370 3.910 250.36Aromatics + resins (c = 0.05) 256.14 7.527 6.360 4.000 293.30Asphaltenes 1700.00 0.010 37.220 4.493 413.54
Table 12PC-SAFT characterized crude C.
Component MW (g/mol) mol% PC-SAFT parameters
m r (A) e/k (K)
N2 28.04 0.147 1.206 3.313 90.96CO2 44.01 1.716 2.073 2.785 169.21C1 16.04 32.558 1.000 3.704 150.03C2 30.07 7.889 1.607 3.520 191.42C3 44.10 7.287 2.002 3.618 208.11Heavy gas 66.36 9.310 2.550 3.740 228.95Saturates 169.17 32.630 5.190 3.900 249.81Aromatics + resins (c = 0.22) 234.78 8.456 5.570 4.030 319.70Asphaltenes 1700.00 0.007 35.750 4.484 413.42
Fig. 2. Comparison of old and new PC-SAFT characterization procedures usingcrude A (black line: AOP; gray line: bubble pressure; circles: experimental data).
664 S.R. Panuganti et al. / Fuel 93 (2012) 658–669
The major limitation of cubic EoS is that they cannot describeadequately the phase behavior of mixtures of molecules with largesize differences and they are unable to accurately calculate liquiddensities of the precipitated phase. Accurate modeling of liquiddensity is essential for an equation of state to predict liquid–liquidequilibrium and their corresponding parameters, such as the solu-bility parameter, over a range of conditions [69]. Also, the cubicEoS are typically fit to the critical point and asphaltene criticalproperties are not well defined because asphaltenes decomposebefore reaching critical points and thus impairing the predictivecapabilities for asphaltene onset conditions.
3.3. Robustness of PC-SAFT characterization
The previous results showed that PC-SAFT with the new charac-terization procedure can represent the system better than the cu-bic EoS. The robustness of the characterization method is furtherchecked by performing the PC-SAFT parameter estimation as dis-cussed above for a different crude oil (crude C), and with gas injec-tion of 15 mol%. The PC-SAFT predictions and comparison with
experimental data points are shown in Fig. 4C. This parameterset was further used to predict the asphaltene phase behavior forother gas injection amounts (Fig. 4A, B and D). The results wereimpressive as observed from Fig. 4A, B and D due to the good char-acterization of crude oil with asphaltene as one of its component.
3.4. Sensitivity to SARA
As observed from the characterization procedure, one of theimportant inputs on which the crude oil is modeled is the SARA.Unfortunately, a disadvantage of the SARA analysis is that fractionmeasurements by different techniques and/or from different labo-ratories can show large differences [70,71]. Despite this deficiencySARA analysis is still widely used as a form of characterizing the oiland quantifying the amount of asphaltenes present. An equation ofstate tuned to an inaccurate SARA is expected to produce inaccu-rate predictions of phase behavior.
Table 13 shows the SARA reported by two different labs for thesame crude C. Because lab 2 in the process of quantifying SARA lostsignificant amount of light ends in the form of saturates, they re-ported a higher amount of aromatics and asphaltenes than actuallypresent. To consider the possibility of dealing with an inaccurateSARA data, crude C was fit at 15 mol% of injected gas to an inaccu-rate SARA. The result is inaccurate predictions of the phase behav-ior particularly at high injected gas concentration. The conclusionis that, in characterizing a crude oil, care must be taken to fit theequation of state model to accurate data.
3.5. Lower asphaltene onset pressure
Till now we discussed the onset pressures of asphaltene whichare above bubble pressure. During the transport of crude oils in awellbore/pipeline, the pressure depletes and on a pressure–tem-perature diagram it may follow the path shown with discontinuousblack line in Fig. 5. The path followed is a curve because the systemis non-isothermal. Point A has high enough pressure such that

SRK-P
PC-SAFT
Fig. 3. PC-SAFT and SRK-P characterized oil prediction for crude B after estimating the parameters for 5 mol% of gas injection data (black line: AOP; gray line: bubblepressure; circles: experimental data). Injected gas composition (mol%): N2-0.4%, CO2-3.9%, C1-71.4%, C2-12%, C3-7.2%, heavy gas-5.1%.
Fig. 4. PC-SAFT characterized oil prediction for crude C after estimating the parameters for the data of 15 mol% of injected gas (black line: AOP; gray line: bubble pressure;circles: experimental data). Injected gas composition (mol%): N2-0.5%, CO2-4.5%, C1-87.4%, C2-7.2%, C3-0.4%, heavy gas-0.0%.
S.R. Panuganti et al. / Fuel 93 (2012) 658–669 665

Table 13SARA analysis as reported by two different laboratories for the same crude C.
(wt/wt%) Saturates Aromatics + resins Asphaltenes
Lab 1 73.42 26.37 0.17Lab 2 49.5 47.4 3.1
Fig. 5. Path followed by a PT curve of crude oil A from reservoir condition to itsbubble pressure in a wellbore during production (black line: AOP; gray line: bubblepressure; discontinuous black line: pressure drop in wellbore).
666 S.R. Panuganti et al. / Fuel 93 (2012) 658–669
asphaltenes are stable in oil, Point B lies on asphaltene phaseboundary below which asphaltenes precipitate and Point C lieson the bubble pressure curve. The curve from Point A crosses overthe asphaltene onset pressure (Point B) and reaches the bubblepressure (Point C). From Point B to Point C liquid–liquid equilib-rium exists. This pressure depletion along the length of the well-bore is also schematically shown in Fig. 6A. With furtherdepletion of pressure along the wellbore, the system arrives toits bubble point, where the light components that are asphalteneprecipitants, escape from the liquid phase. As this happens, the sol-ubility parameter of the oil increases until the oil becomes a betterasphaltene solvent and asphaltene becomes stable in the oil phase
Fig. 6. AOP behavior of crude oil A with respect to gas content in crude oil at a
again [21]. Thus, once we reach bubble pressure at our original gascontent, with further pressure depletion we travel along a pres-sure–composition curve {as per the experimental procedure oflower AOP [72]} as shown in Fig. 6B for a constant temperatureof 120 F. Below a particular gas content (Point D), the asphaltenesbecome completely soluble in crude oil. This is called the lowerasphaltene onset for this temperature.
Wellbore/pipeline systems are not isothermal, thus forcing us toanalyze the pressure depletion curve from a two variables point ofview (gas content and temperature). This results in a 3D asphalten-e phase plot between pressure, temperature and gas content asshown in Fig. 7. Now the pressure depletion curve (for crude oilsystem in a wellbore) can be followed in the phase plot very easilyas represented by the black line in Fig. 7.
As mentioned before, the escape of lighter ends makes crude oila good solvent for asphaltenes [73] and the trend is seen from the3D phase plot with decreasing AOP. Also with less light compo-nents in the liquid phase, the bubble pressure decreases. In the lit-erature there are studies that also report the lower asphalteneonset pressure curves (conditions below which asphaltenes be-comes stable in the oil again), typically plotted on a P–T diagramat constant gas content [74,75]. According to such a representation,it means that for a system at constant overall composition thereexists an upper asphaltene onset and a lower asphaltene onsetfor every temperature. Thus for a range of temperatures, with vary-ing composition we get different lower onsets which when inter-polated on the pressure–temperature diagram looks like thegreen star marker line in Fig. 8.
3.6. Precipitated asphaltene rich phase
Along with crude oil characterization and asphaltene phasebehavior, another aspect of interest for the oil industry is theasphaltene deposition profile [76]. Both academics and industriesare actively involved in the development of asphaltene depositionsimulator [76–79]. For such a program, an essential initial bound-ary condition is the amount of asphaltene that can precipitate and
constant temperature of 120 F (black line: AOP; gray line: bubble pressure).

Temperature
(F)
Pressure
(Psia)
Gas content in crude oil (scf/stb)
AOP
Bubble Pressure
Fig. 7. 3D asphaltene phase plot with the path followed by the PT curve along the length of wellbore for for Crude A (red line: AOP; blue line: bubble pressure; black line:Pressure drop in wellbore). (For interpretation of the references to color in this figure legend, the reader is referred to the web version of this article.)
Gas content in crude oil (scf/stb)
Temperature
(F)
Pressure
(Psia)
AOP
Bubble Pressure
Fig. 8. 3D phase plot along with asphaltene lower onset pressures for crude A (red line: AOP; blue line: bubble pressure; green line: lower AOP). (For interpretation of thereferences to color in this figure legend, the reader is referred to the web version of this article.)
S.R. Panuganti et al. / Fuel 93 (2012) 658–669 667
hence deposit [7]. After characterizing the crude oil with the abovementioned procedure and modeling the asphaltene phase behav-ior, at any given temperature and pressure one can say whetherthe oil will split into two liquid fractions of asphaltene rich andlean phases. From the phase diagrams, we observe that maximumdriving force and hence maximum amount of asphaltene precipi-tated at a given temperature is at its bubble point. For a systemat bubble pressure, Fig. 9 shows the weight percent of asphalteneprecipitated with respect to STO (crude B). Thus the maximum per-cent that can be precipitated is the asphaltene content reported bySARA.
The results are in accordance with the phase plots as moreasphaltene are precipitated with increasing injected gas. Also fromthe phase plot we observe that at lower temperatures instability ofasphaltenes increases. The maximum amount of asphaltenes thatcan be precipitated is the amount of asphaltenes in crude oil. For30% of injected gas and above, from Fig. 9 we can observe that al-most all the asphaltenes present in oil are precipitated as percentof asphaltene precipitated is �0.2% while SARA reports �0.21%.Bulk filtration data at 100 psia above the saturation pressure wasavailable at three different temperatures, without gas injection.Consequent to filtration, filter retained solid asphaltene particles

Fig. 9. Crude B asphaltene precipitation curve for different amounts of injected gasat three different temperatures.
Table 14Amount of asphaltene in precipitated phase of crude A.
Temperature(F)
Mole percentage ofasphaltene in precipitatedphase
Weight percentage ofasphaltene in precipitatedphase
130 15.2 72.45165 11.8 66.91254 7.9 57.24
668 S.R. Panuganti et al. / Fuel 93 (2012) 658–669
larger than 0.22 lm, the smaller asphaltene particles stuck to thewall of the NIR cell, while the unprecipitated asphaltene remainedin the filtrate. Thus the data could not be quantified for reproduc-ing the results.
Table 14 shows the estimated amount of asphaltene in the pre-cipitated phase of Crude A at the bubble pressures, and will behelpful in the design of solvent deasphalters. It is interesting to ob-serve the enrichment of asphaltene in the precipitated phase(�10 mol%) from a very lean oil phase of �0.1 asphaltene mol%.
4. Conclusion
PC-SAFT is a highly promising equation of state for modelingasphaltene precipitation. With this work, we have demonstrated abrief methodology to characterize crude oils using PC-SAFT EoSand subsequently model asphaltene phase behavior in crude oils.This work describes a methodology by which several similar compo-nents can be lumped together as one fraction and thus drasticallydecreasing the computational expense in performing these thermo-dynamic calculations. PC-SAFT parameters can then be calculatedfor each of these fractions based on the correlations provided in thiswork. A systematic methodology to perform the PC-SAFT parameterestimation is also explained in this work which will facilitate easyusage of this EoS to model other crude oils. Phase behavior calcula-tions were performed for different crude oils in the presence ofdifferent amounts of injected gas and the results were comparedagainst similar calculations performed with a cubic EoS. It wasobserved that in case of PC-SAFT, a single set of parameters wassufficient to describe the phase behavior of the oil with various gasinjection amounts. However, for a cubic EoS one set of parametersfailed to sufficiently describe the experimental observations forother gas injection amounts.
The asphaltene phase behavior curves were plotted on pres-sure–temperature and pressure–composition axis. These curveswere then combined to show the pressure depletion in a well boreon an asphaltene phase envelope and to explain the lower asphal-tene onset pressure. Based on the predicted asphaltene phaseenvelope, the amount of precipitated asphaltene was computed.Such modeling is essential for an asphaltene deposition simulatorand solvent deasphalters.
5. Acronyms
PC-SAFT
Perturbed Chain form ofthe Statistical Associating Fluid TheorySRK-P
Soave–Redlich–Kwong–Peneloux SCN single carbon number STO stock tank oil/dead oil GOR gas-to-oil ratio EoS equation of state RI refractive index A+R aromatics + resins SARA saturates, aromatics, resins and asphaltenes PNA poly-nuclear-aromatic MW molecular weight AOP asphaltene onset pressure NIR near infraredAcknowledgments
This work was undertaken with the funding from ADNOC’s OilR&D Subcommittee. The authors are thankful to Shahin Negahban,Marwan Haggag, Dalia Abdullah, Sanjay Misra and the EnhancedOil Recovery Technical Committee for valuable support. Theauthors also thank George Hirasaki, Jefferson Creek, Jianxin Wang,Hariprasad Subramani and Jill Buckley for helpful discussions.
References
[1] Vargas FM, Gonzalez DL, Ceek JL, Wang J, Buckley J, Hirasaki GJ, et al.Development of a general method for modeling asphaltene stability. EnergyFuels 2009;23:1147–54.
[2] Mitchell DL, Speight JG. Solubility of asphaltenes in hydrocarbon solvents. Fuel1973;52(2):149–52.
[3] Yen TF, Erdman JG, Pollack SS. Investigation of the structure of petroleumasphaltenes by X-ray diffraction. Anal Chem 1961;33(11):1587–94.
[4] Creek JL. Freedom of action in the state of asphaltenes: escape fromconventional wisdom. Energy Fuels 2005;19(4):1212–24.
[5] Escobedo J, Mansoori GA. Theory of viscosity as a criterion for determination ofonset of asphaltene flocculation. SPE J 1996 [SPE paper 28729].
[6] Grutters M, Huoa Z, Ramanathana K, Naafsa D, Clarkea E, Abdallahc D, et al.Using geochemistry to identify and control asphaltene deposition and improveflow assurance strategies in onshore middle-east carbonate fields. In:Petrophase conference 2010, Jersey City; June 13–17, 2010.
[7] Vargas FM, Ceek JL, Chapman WC. On the development of an asphaltenedeposition simulator. Energy Fuels 2010;24(4):2294–9.
[8] Katz DL, Firoozabadi A. Predicting phase behavior of condensate/crude-oilsystems using methane interaction coefficients. J Petrol Technol 1978;30(11):1649–55.
[9] Roenningsen HP, Skjevrak I, Osjord E. Characterization of North Sea petroleumfractions: hydrocarbon group types, density and molecular weight. EnergyFuels 1989;3(6):744–55.
[10] Whitson CH. Characterizing hydrocarbon plus fractions. SPE J 1983;23(4):683–94 [SPE Paper 12233].
[11] Riazi MR, Daubert TE. Simplify property predictions. Hydrocarbon Process1980;60(3):115–6.
[12] Tarek A. Hydrocarbon phase behavior. 1st ed. Houston: Gulf PublishingCompany; 1989.
[13] Riazi MR, Taher A. Physical properties of heavy petroleum fractions and crudeoils. Fluid Phase Equilib 1996;117(1–2):217–24.
[14] Riazi MR. A continues model for C7+ fraction characterization of petroleumfluids. Ind Eng Chem Res 1997;36(10):4299–307.
[15] Leelavanichkul P, Deo MD, Hanson FV. Crude oil characterization and regularsolution approach to thermodynamic modeling of solid precipitation at lowpressure. Pet Sci Technol 2004;22(7–8):973–90.
[16] Buckley J, Hirasaki GJ, Liu Y, Von Drasek S, Jianxin W, Gill BS. Asphalteneprecipitation and solvent properties of crude oils. Pet Sci Technol 1998;16(3–4):251–85.
[17] GC, Mansoori AG. Advances in thermodynamics : C7+ fractioncharacterization, vol. 1. Portland: Taylor & Francis; 1989.
[18] Chapman WG, Gubbins KE, Jackson G, Radosz M. SAFT: equation-of-statesolution model for associating fluids. Fluid Phase Equilib 1989;52:31–8.
[19] Chapman WG, Gubbins KE, Jackson G, Radosz M. New reference equation ofstate for associating liquids. Ind Eng Chem Res 1990;29(8):1709–21.
[20] Pedersen KS, Christensen PL. Phase behavior of petroleum reservoir fluids. 1sted. Boca Raton: CRC Press; 2007.

S.R. Panuganti et al. / Fuel 93 (2012) 658–669 669
[21] Ting PD, Hirasaki GJ, Chapman WG. Modeling of asphaltene phase behaviorwith the SAFT equation of state. Pet Sci Technol 2003;21(3–4):647–61.
[22] Gross J, Sadowski G. Perturbed-chain SAFT: an equation of state based on aperturbation theory for chain molecules. Ind Eng Chem Res 2001;40(4):1244–60.
[23] Dominik A, Chapman WG. Thermodynamic model for branched polyolefinsusing the PC-SAFT equation of state. Macromolecules 2005;38(26):10836–43.
[24] Rao BKB. Modern petroleum refining. 4th ed. Delhi: Oxford-IBH; 2005.[25] Gonzalez DL, Ting PD, Hirasaki GJ, Chapman WG. Prediction of asphaltene
instability under gas injection with the PC-SAFT equation of state. Energy Fuels2005;19(4):1230–4.
[26] Gonzalez DL, Hirasaki GJ, Chapman WG. Modeling of asphaltene precipitationdue to changes in composition using the perturbed chain statistical associatingfluid theory equation of state. Energy Fuels 2007;21(3):1231–42.
[27] Mullins OC. The modified Yen model. Energy Fuels 2010;24(4):2179–207.[28] Spiecker PM, Keith LG, Kilpatrick PK. Aggregation and solubility behavior of
asphaltenes and their subfractions. J Colloid Interf Sci 2003;267(1):178–93.[29] Zao JY, Mullins OC, Chengli D, Dan Z. Modeling of asphaltene grading in oil
reservoirs. Nat Resour 2010;1(1):19–27.[30] Buckley JS. Predicting the onset of asphaltene precipitation from refractive
index measurements. Energy Fuels 1999;13(2):328–32.[31] Ting PD. Thermodynamic stability and phase behavior of asphaltenes in oil and
of other highly asymmetric mixtures. PhD Thesis, USA: Rice University; 2003.[32] Gonzalez DL, Vargas FM, George JH, Chapman WG. Modeling study of CO2-
induced asphaltene precipitation. Energy Fuels 2008;22(2):757–62.[33] Brown TS, Niesen NV, Sloan ED, Kidnay AJ. Vapor–liquid equilibria for the
binary systems of nitrogen, carbon dioxide, and n-butane at temperaturesfrom 220 to 344 K. Fluid Phase Equilib 1989;53:7–14.
[34] Besserer GJ, Robinson DB. Equilibrium-phase properties of nitrogen–hydrogensulfide system. J Chem Eng Data 1975;20(2):157–61.
[35] Stryjek R, Chappelear PS, Kobayashi R. Low-temperature vapor–liquidequilibria of nitrogen–methane system. J Chem Eng Data 1974;19(4):334–9.
[36] Stryjek R, Chappelear PS, Kobayashi R. Low-temperature vapor–liquidequilibria of nitrogen–ethane system. J Chem Eng Data 1974;19(4):340–3.
[37] Kalra H, Robinson DB, Besserer GJ. The equilibrium phase properties of thenitrogen-n-pentane system. J Chem Eng Data 1977;22(2):215–8.
[38] Cordova TG, García DNJ, Flores BEG, Sanchez FG. Vapor–liquid equilibriumdata for the nitrogen dodecane system at temperatures from (344 to 593) Kand at pressures up to 60 MPa. J Chem Eng Data 2011;56(4):1555–64.
[39] Richon D, Laugler S, Renon H. High-pressure vapor-liquid equilibrium data forbinary mixtures containing N2, CO2, H2S, and an aromatic hydrocarbon orpropylcyclohexane in the range 313–473 K. J Chem Eng Data 1992;37(2):264–8.
[40] Bierlei JA, Kay WB. Phase-equilibrium properties of system carbon dioxide-hydrogen sulfide. Ind Eng Chem 1953;45(3):618–24.
[41] Bian B, Wang Y, Shi J. Simultaneous determination of vapor–liquid equilibriumand molar volumes for coexisting phases up to the critical temperature with astatic method. Fluid Phase Equilib 1993;90(1):177–87.
[42] Ohgaki K, Katayama T. Isothermal vapor–liquid equilibrium data for theethane–carbon dioxide system at high pressures. Fluid Phase Equilib1977;1(1):27–32.
[43] Kim JH, Kim MS. Vapor–liquid equilibria for the carbon dioxide + propanesystem over a temperature range from 253.15 to 323.15 K. Fluid Phase Equilib2005;238(1):13–9.
[44] Besserer GJ, Robinson DB. Equilibrium-phase properties of n-pentane–carbondioxide system. J Chem Eng Data 1973;18(4):416–9.
[45] Camacho LEC, Luna LAG, Solis OE, Ramirez ZM. New isothermal vapor–liquidequilibria for the CO2 + n-nonane, and CO2 + n-undecane systems. Fluid PhaseEquilib 2007;259(1):45–50.
[46] Morris WO, Donohue MD. Vapor–liquid equilibria in mixtures containingcarbon dioxide, toluene, and 1-methylnaphthalen. J Chem Eng Data1985;30(3):259–63.
[47] Kohn JP, Kurata F. Heterogeneous phase equilibria of the methane–hydrogensulfide system. AIChE J 1958;4(2):211–7.
[48] Kay WB, Brice DB. Liquid–vapor equilibrium relations in ethane–hydrogensulfide system. Ind Eng Chem 1953;45(3):615–8.
[49] Gilliland ER, Scheeline HW. High-pressure vapor–liquid equilibrium for thesystems propylene–isobutane and propane–hydrogen sulfide. Ind Eng Chem1940;32(1):48–54.
[50] Reamer HH, Sage BH, Lacey WN. Phase equilibria in hydrocarbon systemsvolumetric and phase behavior of n-pentane–hydrogen sulfide system. Ind EngChem 1953;45(8):1805–9.
[51] Yokoyama C, Usui A, Takahashi S. Solubility of hydrogen sulfide in isooctane,n-decane, n-tridecane, n-hexadecane and squalane at temperatures from 323to 523 K and pressures up to 1.6 MPa. Fluid Phase Equilib 1993;85:257–69.
[52] Laugier S, Richon D. Vapor-liquid equilibria for hydrogen sulfide + hexane, +cyclohexane, + benzene, + pentadecane, and + (hexane + pentadecane). J ChemEng Data 1995;40(1):153–9.
[53] Wichterle I, Kobayashi R. Vapor–liquid equilibrium of methane–ethane systemat low temperatures and high pressures. J Chem Eng Data 1972;17(1):9–12.
[54] Wichterle I, Kobayashi R. Vapor–liquid equilibrium of methane–propanesystem at low temperatures and high pressures. J Chem Eng Data 1972;17(1):4–9.
[55] Chu TC, Chen RJJ, Chappelear PS, Kobayashi R. Vapor–liquid equilibrium ofmethane-n-pentane system at low temperatures and high pressures. J ChemEng Data 1976;21(1):41–4.
[56] Srivastan S, Darwish NA, Gasem KAM, Rabinson RL. Solubility of methane inhexane, decane, and dodecane at temperatures from 311 to 423 K andpressures to 10.4 MPa. J Chem Eng Data 1992;37(4):516–20.
[57] Lin HM, Sebastian HM, Simnick JJ, Chao KC. Gas–liquid equilibrium in binarymixtures of methane with n-decane, benzene, and toluene. J Chem Eng Data1979;24(2):146–9.
[58] Matscike DE, Thodos GT. Vapor–liquid equilibria for the ethane–propanesystem. J Chem Eng Data 1962;7(2):232–4.
[59] Bufkin BA, Rabinson RL, Esirera SS, Luks KD. Solubility of ethane in n-decane atpressures to 8.2 MPa and temperatures from 278 to 411 K. J Chem Eng Data1986;31(4):421–3.
[60] Ohgaki K, Sano F, Katayama T. Isothermal vapor–liquid equilibrium data forbinary systems containing ethane at high pressures. J Chem Eng Data1976;21(1):55–8.
[61] Oxley JA. Phase relations of binary hydrocarbon systems propane-n-pentane.MS thesis, USA: The Ohio State University; 1962.
[62] Richon D, Laugler S, Renon H. High-pressure vapor–liquid equilibria for binarymixtures containing a light paraffin and an aromatic compound or anaphthene in the range 313–473 K. J Chem Eng Data 1991;36(1):104–11.
[63] Rice P, Nikheli AE. Isothermal vapour–liquid equilibrium data for the systemsn-pentane with n-hexane, n-octane and n-decane. Fluid Phase Equilib1995;107(2):257–67.
[64] Wang JLH, Lu BCY. Vapour–liquid equilibrium data for the n-pentane–benzenesystem. J Appl Chem Biotechnol 1971;21(10):297–9.
[65] Gonzalez DL. Modeling of asphaltene precipitation and deposition tendencyusing the PC-SAFT equation of state. PhD Thesis, USA: Rice University; 2008.
[66] Jog PK, Chapman WG, Gupta SK, Swindoll RD. Modeling of liquid–liquid-phaseseparation in linear low-density polyethylene-solvent systems using thestatistical associating fluid theory equation of state. Ind Eng Chem Res2002;41(5):887–91.
[67] Dudášová D, Silset A, Sjöblom J. Quartz crystal microbalance monitoring ofasphaltene adsorption/deposition. J Dispersion Sci Technol 2008;29(1):139–46.
[68] Modaresghazani J, Satyro MA, Yarranton HW. Conventional cubic equation ofstate modeling of the phase behavior of bitumen and solvents. In: Petrophaseconference 2010, Jersey City; June 13–17, 2010.
[69] Vargas FM, Panuganti S, Gonzalez DL, Chapman WG. Advances in predictingasphaltene precipitation at high pressure and temperature. Managing scale &asphaltene SPE ATW 2010, Abu Dhabi; November 28–December 1, 2010.
[70] Fan T, Buckley JS. Rapid and accurate SARA analysis of medium gravity crudeoils. Energy Fuels 2002;16(6):1571–5.
[71] Kharrat AM, Zacharia J, Cherian VJ, Anyatonwu A. Issues with comparing SARAmethodologies. Energy Fuels 2007;21(6):3618–21.
[72] Hammami A, Phelps CH, Monger-McClure T, Little TM. Asphalteneprecipitation from live oils: an experimental investigation of onsetconditions and reversibility. Energy Fuels 2000;14(1):14–8.
[73] Vargas FM, Gonzalez DL, Hirasaki GJ, Chapman WG. Modeling asphaltenephase behavior in crude oil systems using the perturbed chain form of thestatistical associating fluid theory (PC-SAFT) equation of state. Energy Fuels2009;23(3):1140–6.
[74] Zhidong L, Firoozabadi A. Cubic-plus-association equation of state forasphaltene precipitation in live oils. Energy Fuels 2010;24(5):2956–63.
[75] Akbarzadeh K, Hammami A, Kharrat A, Zhan D, Allenso S, Creek JL, et al.Asphaltenes—problematic but rich in potential. Oilfield Rev 2007;19(2):22–43.
[76] Akbarzadeh K, Ratulowski J, Lindvig T, Davis T, Huo Z, Broze G. The importanceof asphaltene deposition measurements in the design and operation of subseapipelines. In: SPE annual technical conference and exhibition 2009, NewOrleans; October 4–7, 2009 [SPE paper 124956].
[77] Ramirez-Jaramillo E, Lira-Galeana C, Manero O. Modeling asphaltenedeposition in production pipelines. Energy Fuels 2006;20(3):1184–96.
[78] Soltani SB, Rashtchian D, Tohidi B, Jamialahmadi M. Integrated modelingmethods for asphaltene deposition in wellstring. J Jpn Pet Inst 2009;52:322–31.
[79] Vargas FM, Creek JL, Chapman WG. Development of an asphaltene depositionsimulator. In: Petrophase conference 2009, Rio de Janeiro; June 14–18, 2009.